Article

The Coupling and Coordination of Agricultural Carbon Emissions Efficiency and Economic Growth in the Yellow River Basin, China

1
Research Center for Economic of Upper Reaches of Yangtze River, Chongqing Technology and Business University, Chongqing 400067, China
2
Finance Department, Chongqing Medical and Pharmaceutical College, Chongqing 401331, China
3
School of Economics, Xihua University, Chengdu 610039, China
4
College of Economics, Yunnan University, Kunming 550002, China
*
Author to whom correspondence should be addressed.
Sustainability 2023, 15(2), 971; https://doi.org/10.3390/su15020971
Submission received: 29 November 2022 / Revised: 28 December 2022 / Accepted: 1 January 2023 / Published: 5 January 2023

Abstract

:
The balanced ecological protection and high-quality development of the Yellow River basin (YRB) has become a major national strategy in China in which low-carbon agricultural development in the region is crucial. In this context, studying the coupling and coordination between agricultural carbon emissions efficiency and economic growth in the YRB is of great significance to promote low-carbon, green, and sustainable agricultural development. Therefore, based on the data of 30 cities in the YRB from 2010 to 2020, the super-efficient slacks-based measure (SBM) model with non-expected output was employed to effectively measure the agricultural carbon emissions efficiency in the YRB. Subsequently, the coupling and coordination degree of agricultural carbon emissions efficiency and economic growth in the YRB was further calculated. Finally, the Dagum Gini coefficient and kernel density estimation methods were adopted in order to comprehensively examine the spatial differences, as well as the dynamic evolution pattern of the coupled coordination in the YRB. The results demonstrate that there is a significant spatial non-equilibrium in the coupling and coordination degree of agricultural carbon emission efficiency and economic growth in the YRB, in addition to the decreasing trend of coupling coordination during the sample observation period. As such, there is still considerable room for improvement of the efficiency of agricultural carbon emissions and the degree of coupling and coordination in the YRB. This study may serve as a reference for improving the low-carbon development of agriculture and economy in the YRB, providing theoretical guidance for solving the contradiction between ecological protection and economic development in this region.

1. Introduction

With the increase in carbon emissions, climate change has become one of the greatest challenges facing the world at present [1]. Watersheds, as key areas where humanity and nature interact, are also facing the impacts of climate change due to carbon emissions. In October 2021, the ecological protection and high-quality development of the YRB became a significant national strategy in China, successfully emphasizing the YRB’s strategic position [2]. As such, the introduction of this remarkable national strategy is of vital relevance to the promotion of coordinated regional development and high quality of life for the population [3]. Therefore, the YRB has also made certain achievements in green and sustainable development; however, when viewed from a dual perspective of spatial patterns and historical laws, the YRB is not an axial development model comparable to the Yangtze River Economic Belt [4], as large disparities in economic development may be observed within the basin, along with more prominent ecological and water resource problems, as well as more acute contradictions of unbalanced and insufficient development [2]. The provinces and regions along the YRB have been severely affected by regional endowments and various other factors, including the degree of economic linkages, the quality of the division of labour, and the level of coordinated development all remain to be enhanced [5]. The YRB is an important ecological barrier and economic zone in China [6], and strengthening the ecological protection and green development of cities along the YRB is very important for the achievement of sustainable watershed management.
In September 2019, a seminar on ecological protection and high-quality development of the YRB held in Henan proposed “to make new and greater strides in ecological protection and high-quality development of the YRB by focusing on innovative institutional mechanisms, promoting ecological protection as well as high-quality development of the YRB” [7]. According to the FAO, the greenhouse gases emitted from agricultural land account for more than 30% of global anthropogenic greenhouse gas emissions [8]. In 2018, the total coal consumption in the YRB amounted to 2.057 billion tonnes, accounting for 45.69% of the total coal consumption in China [9]. Therefore, it is important to study the efficiency and characteristics of agricultural carbon emissions in the YRB, analyse the degree of coupling and coordination between agricultural carbon emissions efficiency and economic growth in the YRB, and clarify the regional differences and their change trends in the upper, middle, and lower reaches of the YRB. Most scholars have examined the YRB at the provincial level, where cities—as carriers of economic development and ecological management and protection—are the core drivers of green and coordinated development in the YRB [10]. Therefore, in this paper, we adopt the cities along the YRB as the entry point of the study in order to effectively measure the efficiency of agricultural carbon emissions in the YRB, and to analyse the degree of coupling and coordination with economic growth, as well as regional differences. In this way, we can better reflect the coupling and coordination of carbon emission efficiency and economic growth in the YRB. This study has important theoretical and practical significance for the strengthening of ecological protection and high-quality development of the YRB, along with the promotion of China’s economic and social development and ecological security.
Through a literature review, it was found that research on agricultural carbon emissions typically begins with the determination of agricultural carbon sources. In the early days, researchers measured the agricultural carbon emissions based on four different dimensions: fertilizers, pesticides, agricultural irrigation, and seed cultivation [11]. Subsequently, scholars began to examine agricultural carbon sources in the areas of livestock farming and rice cultivation [12], fertilizers and pesticides [13], energy consumption [14], enteric fermentation of livestock and manure management [15], and so on. In contrast, others have measured CH4, N2O, and CO2 emissions from agricultural production [16], as well as that from four different dimensions, including agricultural energy use, agricultural material inputs, rice cultivation, and livestock farming [17], and so on. Then, the second step is the measurement of carbon emissions efficiency. Scholars have focused on measuring the efficiency and reduction potential of carbon emissions by utilizing the SBM-Undesirable model [18] and the DEA-Global Malmquist model [19], where agricultural carbon emissions are treated as an undesired output factor. Comprehensive studies have revealed that there is no stochastic convergence at the national level as the east, central, and west regions exhibit different characteristics [20,21]. Similarly, it has been observed that the scale of agricultural carbon reduction potential is the largest in the central region, especially in provinces, such as Henan, Anhui, and Hebei [22]. As the ecological protection of the YRB has become a major national strategy, many scholars have paid attention to solving many problems faced by the high-quality development of the YRB, especially research on the relationship between carbon emissions and economic growth. Scholars have analysed the relationship between economic growth and agricultural carbon emissions in China by utilizing the environmental Kuznets curve (EKC) model [23] and the Tapio decoupling indicator [24]. The relationship between them has been found to be inverted U-shaped [25], N-shaped [26], or two-way causal [27]. Moreover, other scholars have examined the relationship between them at the provincial [28] and regional [29] levels and concluded that China’s current economic growth is highly dependent on carbon emissions. Hence, these studies indicate that it will be extremely challenging to implement a low-carbon economic development model in the short term [30]. As far as the YRB is concerned, scholars have found that the overall pattern of carbon emissions in the YRB is “high in the east and low in the west”, the carbon sink pattern is “high in the west and low in the east” [31], and the intensity of carbon emissions presents a spatial distribution pattern with coexistence of “agglomeration” and “differentiation” [32]. The carbon emissions efficiency gap presents a W-shaped evolution trend, as well as a stepped distribution pattern of “upstream–midstream–downstream” [33].
Although many scholars have studied the relationship between agricultural carbon emissions efficiency and economic growth, it is evident that there is still considerable room for improvement. First, most of the existing literature has been based on the research of carbon emission efficiency, lacking relevant analysis of carbon emissions efficiency specifically for agriculture, and mostly at the provincial level, thus lacking relevant analysis in the YRB, especially at the urban level. Second, most existing studies have employed the common SBM model to measure the efficiency of agricultural carbon emissions, which fails to overcome the limitation of an efficiency value of one. Hence, there are limitations in understanding the spatial differences in the efficiency of agricultural carbon emissions. Third, the relevant literature has been predominantly focused on analysis of the influencing factors, while quantitative research on the spatial differences and dynamic evolution patterns of the coupling and coordination of agricultural carbon emissions efficiency and economic growth has been relatively insufficient.
Given the above, in this paper, we primarily focus on investigating the spatial differences and dynamic evolution of the coupling and coordination between agricultural carbon emissions efficiency and economic growth in the YRB. First, a super-efficient SBM model based on non-expected output is adopted in order to effectively measure the efficiency of agricultural carbon emissions in the YRB. Second, the degree of coupling and coordination between agricultural carbon emissions efficiency and economic growth in the YRB is successfully measured by applying the coupling and coordination model. Third, the Dagum Gini coefficient and decomposition method are utilized to effectively examine the magnitude of spatial differences in the degree of coupling and coordination between agricultural carbon emissions efficiency and economic growth in the YRB, along with their sources. Finally, the kernel density estimation method is utilized to depict the dynamic evolution of the degree of coupling and coordination between agricultural carbon emissions efficiency and economic growth in the YRB.

2. Materials and Methods

In this section, first, the distribution of sample cities in the Yellow River basin is briefly described. Then, we provide an overview of the construction of the index system and data sources. The research ideas guiding this paper are as follows: First, the super-efficiency SBM model is used to measure the efficiency of agricultural carbon emissions. Second, based on the efficiency of agricultural carbon emissions and the level of economic development, the coupling coordination degree model is further used to measure the coupling and coordination level of agricultural carbon emissions efficiency and economic growth in cities along the Yellow River basin. Third, as the Yellow River basin spans the eastern, central, and western parts of China, there are great differences in resource endowment, geographical location, and economic foundation. In order to explore the relative differences in the degree of coupling and coordination, we use the Dagum Gini coefficient to comprehensively investigate the size and sources of the differences. Kernel density estimation is utilized to describe the absolute difference, distribution pattern, and location of coupling coordination degree in the Yellow River basin.

2.1. Research Area

The YRB crosses three major segments in the east, middle, and west of China. It flows through nine provinces, including Qinghai, Sichuan, Gansu, Ningxia, Inner Mongolia, Shanxi, Shaanxi, Henan, and Shandong (Figure 1). As the carriers of economic development, as well as ecological governance and protection, cities are the fundamental driving forces in promoting the green and coordinated development of the river basin. As such, we selected 30 cities in the region as the research object. Simultaneously, with reference to existing research [11], we categorized these 30 sample cities into upstream, middle, and downstream regions (see Table 1).

2.2. Index System Construction and Data Source

To provide a comprehensive and objective representation of the level of agricultural carbons emission efficiency in the YRB, we integrated the techniques used in existing studies [28,34]. We selected the corresponding input indicators from four dimensions: labour, land, agricultural resources, and water resources. Simultaneously, the outputs included desired outputs and undesired outputs, and the specific indicators are presented in Table 2.
Among the raw data required for the YRB agricultural carbon emissions efficiency evaluation index system, the number of people employed in the primary industry was successfully obtained from the China Statistical Yearbook or the statistical yearbooks of each province (city). Similarly, the raw data required for crop sowing area, fertilizer application, pesticide use, agricultural film use, gross agricultural machinery power, total output value of agriculture, forestry, animal husbandry, and fishery and agricultural carbon emissions measurement were obtained from the China Rural Statistical Yearbook and the yearbooks of each province (city). Some of the missing values were assigned to fill in gaps using the neighbourhood linear interpolation method. Indicators of agricultural economic growth in cities were measured by the value added per capita of agriculture, calculated as: per capita agricultural value added = agricultural value added / number of primary industry employees (in CNY/person).

2.3. Super-Efficient SBM Model Based on Undesired Outputs

Tone proposed a non-radial and non-angular SBM [35], which effectively enhances the accuracy of the estimation of the efficiency of the decision unit and can incorporate undesired outputs into the efficiency evaluation system, thereby significantly enhancing its practical applicability. In addition, to further distinguish and rank the efficiency differences between relatively efficient (i.e., efficiency value of 1) decision units, Tone [36] proposed a super-efficient SBM model in 2002, which assumes the existence of n decision units. Simultaneously, for a decision unit D M U k , for every input indicator m, it produces r 1 desired output indicators and r 2 non-desired output indicators. The vector forms are denoted as x R m , y d R r 1 , y u R r 2 . X , Y d , and Y u are matrices, where X = ( x 1 , ... , x n ) R m × n , Y d = ( y 1 d , ... , y n d ) R r 1 × n , and Y u = ( y 1 u , ... , y n u ) R r 2 × n . Subsequently, the super-efficient SBM model is constructed as follows:
min ρ = 1 m i = 1 m x ¯ x i k 1 r 1 + r 2 ( s = 1 r 1 y d ¯ y s k d + q = 1 r 2 y u ¯ y q k u ) ,
x ¯ j = 1 , k n x i j λ j i = 1 , 2 , ... , m y d ¯ j = 1 , k n y s j d λ j s = 1 , 2 , ... , r 1 y u ¯ j = 1 , k n y q j u λ j q = 1 , 2 , ... , r 2 s . t . λ j > 0 j = 1 , 2 , ... , n s x ¯ x k k = 1 , 2 , ... , m y d ¯ y k d q = 1 , 2 , ... , r 1 y u ¯ y k u u = 1 , 2 , ... , r 2

2.4. The Coupling Coordination Degree Model

With reference to existing studies [28], the formula for the coupling and coordination of carbon emissions efficiency and economic growth in urban agriculture in the YRB is defined as:
T = α U 1 + β U 2 ,
C = U 1 × U 2 / U 1 + U 2 / 2 2 1 / 2 ,
D = C × T ,
where T represents the coupled and coordinated development index; α and β are equally weighted, both taking a value of 1/2; C represents the coupling degree between the two systems; U 1 is the level of the agricultural carbon emissions system in the YRB (i.e., the agricultural carbon emission efficiency); U 2 represents the level of the economic system, measured by the agricultural value added per capita (which is standardized in the specific calculations); and D denotes the coupling and coordination, with values in the range of [0,1]. The larger the value, the better the coupling coordination development. At the same time, with respect to the existing research [35], the coupling coordination degree of agricultural carbon emissions efficiency and economic growth was graded and classified, as detailed in Table 3.

2.5. The Dagum Gini Coefficient

In this paper, the Dagum Gini coefficient and its decomposition method were adopted to examine the regional differences and sources of the coupled coordination between agricultural carbon emissions efficiency and economic growth in the three major regions of the upper, middle, and lower YRB. On the basis of sub-sample decomposition analysis, the overall source of variation, G , can be decomposed into the intra-regional variation contribution G w , the inter-regional variation contribution G n b , and the super-variable density contribution G t [36]. The specific definitions are as follows:
G = j = 1 k h = 1 k i = 1 n j r = 1 n h y j i y h r / 2 n 2 y   ¯ ,  
G ω = j = 1 k G j j p j s j ,
G n b = j = 2 k h = 1 j 1 G j h ( p j s h + p h s j ) D j h ,
G t = j = 2 k h = 1 j 1 G j h p j s h + p h s j 1 D j h ,
where k represents the number of regions, n represents the number of all cities, n j ( n h ) represents the number of cities in region j ( h ) , y j i ( y h r ) is the coupled coordination of agricultural carbon emission efficiency and economic growth for the city i ( r ) in region j ( h ) , y ¯ is the average of the coupled coordination of all the cities, G j j denotes the Gini coefficient for region j , G j h is the Gini coefficient between region j and region h , and D j h denotes the interaction of coupling coordination between region j and region h . The specific definitions are as follows:
G j j = 1 2 y j ¯ i = 1 n j R = 1 n j y j i y j r n j 2 ,
G j h = i = 1 n j r = 1 n h y j i y h r n j n h ( Y j ¯ + Y h ¯ ) ,
D j h = d j h p j h d j h + p j h ,
where p j = n j / n ; s j = n j Y j ¯ n μ ; F j ( F h ) is the cumulative density distribution functions of the coupling coordination in region j ( h ) ; d j h is defined as the difference between the coupling coordination between regions, which is the mathematical expectation of the sum of all the sample values of y j i y h r > 0 in regions j and h ; and p j h is the super-variable first order moment, which can be interpreted as the mathematical expectation of the sum of all the sample values of y j i y h r < 0 in regions j and h . The specific definitions are as follows:
d j h = 0 d F j y 0 y ( y x ) d F h ( x ) ,
p j h = 0 d F h y 0 y ( y x ) d F j ( x ) .

2.6. The Kernel Density Estimation Method

The kernel density estimation method that was used to investigate the non-equilibrium problem of spatial distribution is a non-parametric estimation method, which predominantly aims to estimate the probability density of a random variable and to describe its dynamic evolution utilizing a smooth continuous density profile [37]. The density function of the random variable, X , is assumed to be:
d j h = 0 d F j y 0 y ( y x ) d F h ( x ) ,
where X i represents the independent identically distributed observations, X ¯ is the mean, h is the bandwidth, and K ( ) is the kernel function. In this paper, the kernel density was selected as the Gaussian kernel function for estimation, expressed as:
K ( x ) = 1 2 π exp ( - x 2 2 ) .

3. Results and Analysis

3.1. Analysis of the Status Quo Characteristics of Agricultural Carbon Emissions Efficiency

Based on Formula (1), the agricultural carbon emissions efficiency of 30 prefecture-level cities in the YRB from 2010 to 2020 was measured using the MATLAB software. Then, analysis of the characteristics of carbon emissions efficiency at the regional and urban levels has been performed; the results are presented in Table 4.
When viewing the YRB as a whole, the overall agricultural carbon emissions efficiency value in the YRB during the observation interval of 2010–2020 was 0.593, which implies that, with the existing resource input, there is still considerable room for improvement in agricultural carbon emissions efficiency. Subsequently, when comprehensively analysed at the regional level, the three major regions in the YRB’s upper, middle, and lower sections exhibited a significant stepwise imbalance. Simultaneously, during the sample observation period, regional agricultural carbon emissions efficiency was ranked as upstream > midstream > downstream in the YRB. In particular, the efficiency of agricultural carbon emissions in the upstream and midstream areas of the YRB was consistently higher than the overall average, except for the year 2020, in which the efficiency of agricultural carbon emissions in the upstream area was relatively lower than the overall average. On the contrary, the efficiency of agricultural carbon emissions in the downstream region was consistently lower than the overall average value over the observation period. Subsequently, when analysed at the city level, there were substantial differences in the efficiency of agricultural carbon emissions within the same region or between cities in different regions. Concurrently, further observations portrayed that the agricultural carbon emissions efficiency values of four cities—namely, Wuhai, Sanmenxia, Yan’an, and Yulin—were consistently greater than 1. Hence, this indicates that they were in an effective state, accounting for 13.33%. In addition, further analysis also revealed that Hohhot and Baotou gradually transformed from an effective state to an ineffective state during the measurement period; while Yuncheng, Zhengzhou, Luoyang, Jiyuan, Kaifeng, and Xinxiang gradually transformed from an ineffective state to an effective state during the measurement period.

3.2. Analysis of the Coupling and Coordination between Agricultural Carbon Emission Efficiency and Economic Growth

Based on Formula (4), the coupling coordination degree of agricultural carbon emissions efficiency and economic growth in the YRB from 2010 to 2020 was successfully measured, and the coupling coordination level was also further classified. The specific results are presented in Table 5.
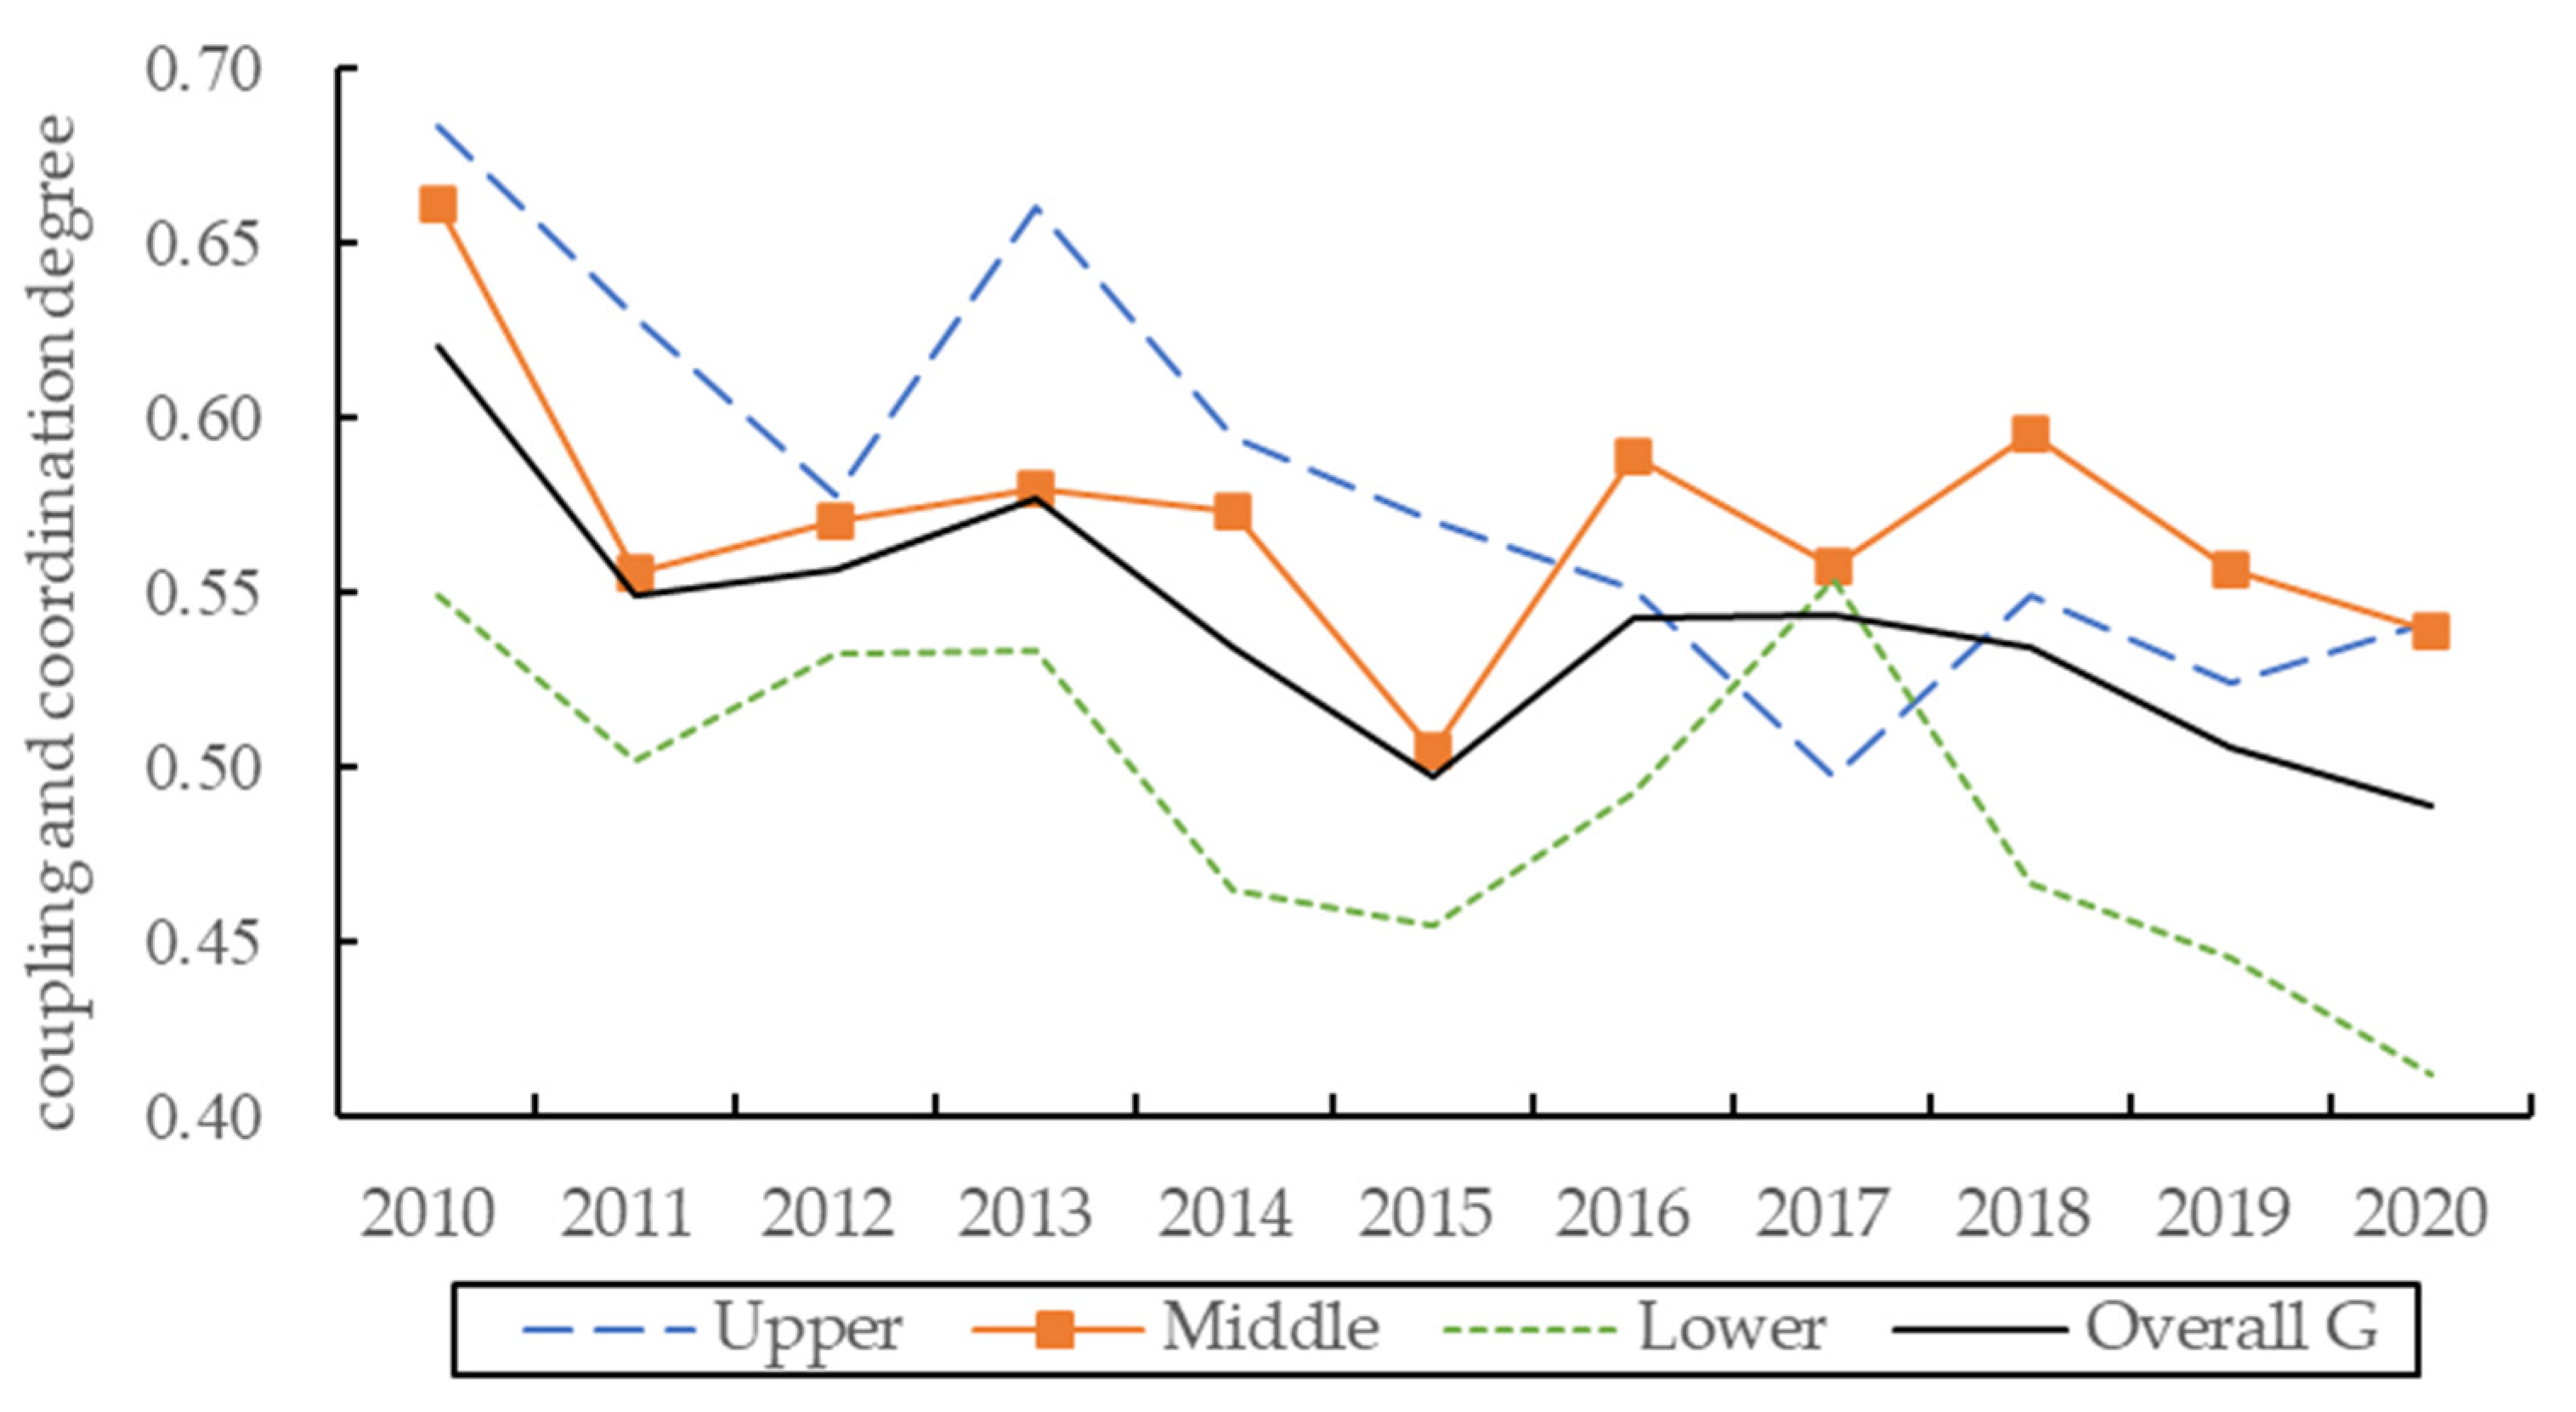
The evolution of the coupling and coordination degree of agricultural carbon emissions efficiency and economic growth in the YRB is depicted in Figure 2. At the overall level of the YRB, the coupling and coordination degree of agricultural carbon emission efficiency and economic growth in the YRB exhibited a fluctuating downward trend, with a significant decrease from 2010 to 2011, an annual increase from 2011 to 2013, an annual decrease from 2013 to 2015, a rebound increase in 2016, and a steady decline thereafter, until the lowest point of 0.489 in the sample observation in 2020. During the observation period, the coupling coordination declined from 0.621 in 2010 to 0.489 in 2020, a decrease of 0.132 (or about 21.26%), with an average annual decrease rate of about 2.13%.
From the regional perspective, the spatial distribution pattern of the coupling and coordination of agricultural carbon emissions efficiency and economic growth in the YRB exhibited a “high in the west and low in the east” trend. In the upper reaches of the YRB, the coupling and coordination degree of agricultural carbon emission efficiency and economic growth presented an overall W-shaped trend, which can be broadly divided into four stages: “declining year by year, rebounding and rising, declining year by year, rebounding and rising”. The trend was characterized by these four stages of change. At the same time, during the observation period, the degree of coupling coordination was generally decreasing, with a decrease of about 0.141 in 2020, as compared to 0.683 in 2010 (or approximately 20.64%), with an average annual decrease rate of about 2.06%. Overall, the coupling and coordination degree of agricultural carbon emissions efficiency and economic growth in the midstream region presented a fluctuating downward trend, with a significant decline from 2010 to 2011, a steady increase from 2011 to 2013, and a yearly decline to the minimum value of 0.504 from 2013 to 2015. This was followed by an overall “M”-shaped evolution trend from 2015 to 2016, whereby the trend rebounded upwards in 2016, declined slightly from 2016–2017, rose slightly from 2017–2018, and then declined thereafter. During the observation period, the degree of coupling coordination decreased from 0.661 in 2010 to 0.539 in 2020 (a decrease of about 18.47%), with an average annual decrease rate of about 1.85%. Simultaneously, the coupling coordination of agricultural carbon emissions efficiency and economic growth in the downstream region also decreased slightly from 2010 to 2011, increased gradually from 2011 to 2013, decreased gradually to 0.455 from 2013 to 2015, then rebounded and increased to 0.554 in 2017, reaching a maximum value. From 2017 to 2020, the coupling coordination decreased to 0.413—the lowest point of the sample observations. At the same time, over the observation period, the degree of coupling coordination fluctuated from 0.549 in 2010 to 0.413 in 2020, a decline of about 0.136 (or about 24.77%), with an average annual rate of decline of about 2.48%.

3.3. Analysis of Regional Differences and Sources of Coupled Coordination between Agricultural Carbon Emission Efficiency and Economic Growth

In order to further analyse the regional differences in the degree of coupled coordination between agricultural carbon emissions efficiency and economic growth in the YRB, as well as their sources, we adopted the Dagum Gini coefficient and its decomposition method to thoroughly calculate the results, as presented in Table 6.

3.3.1. Overall Regional Differences in the Degree of Coordination of Coupled Agricultural Carbon Emission Efficiency and Economic Growth in the YRB

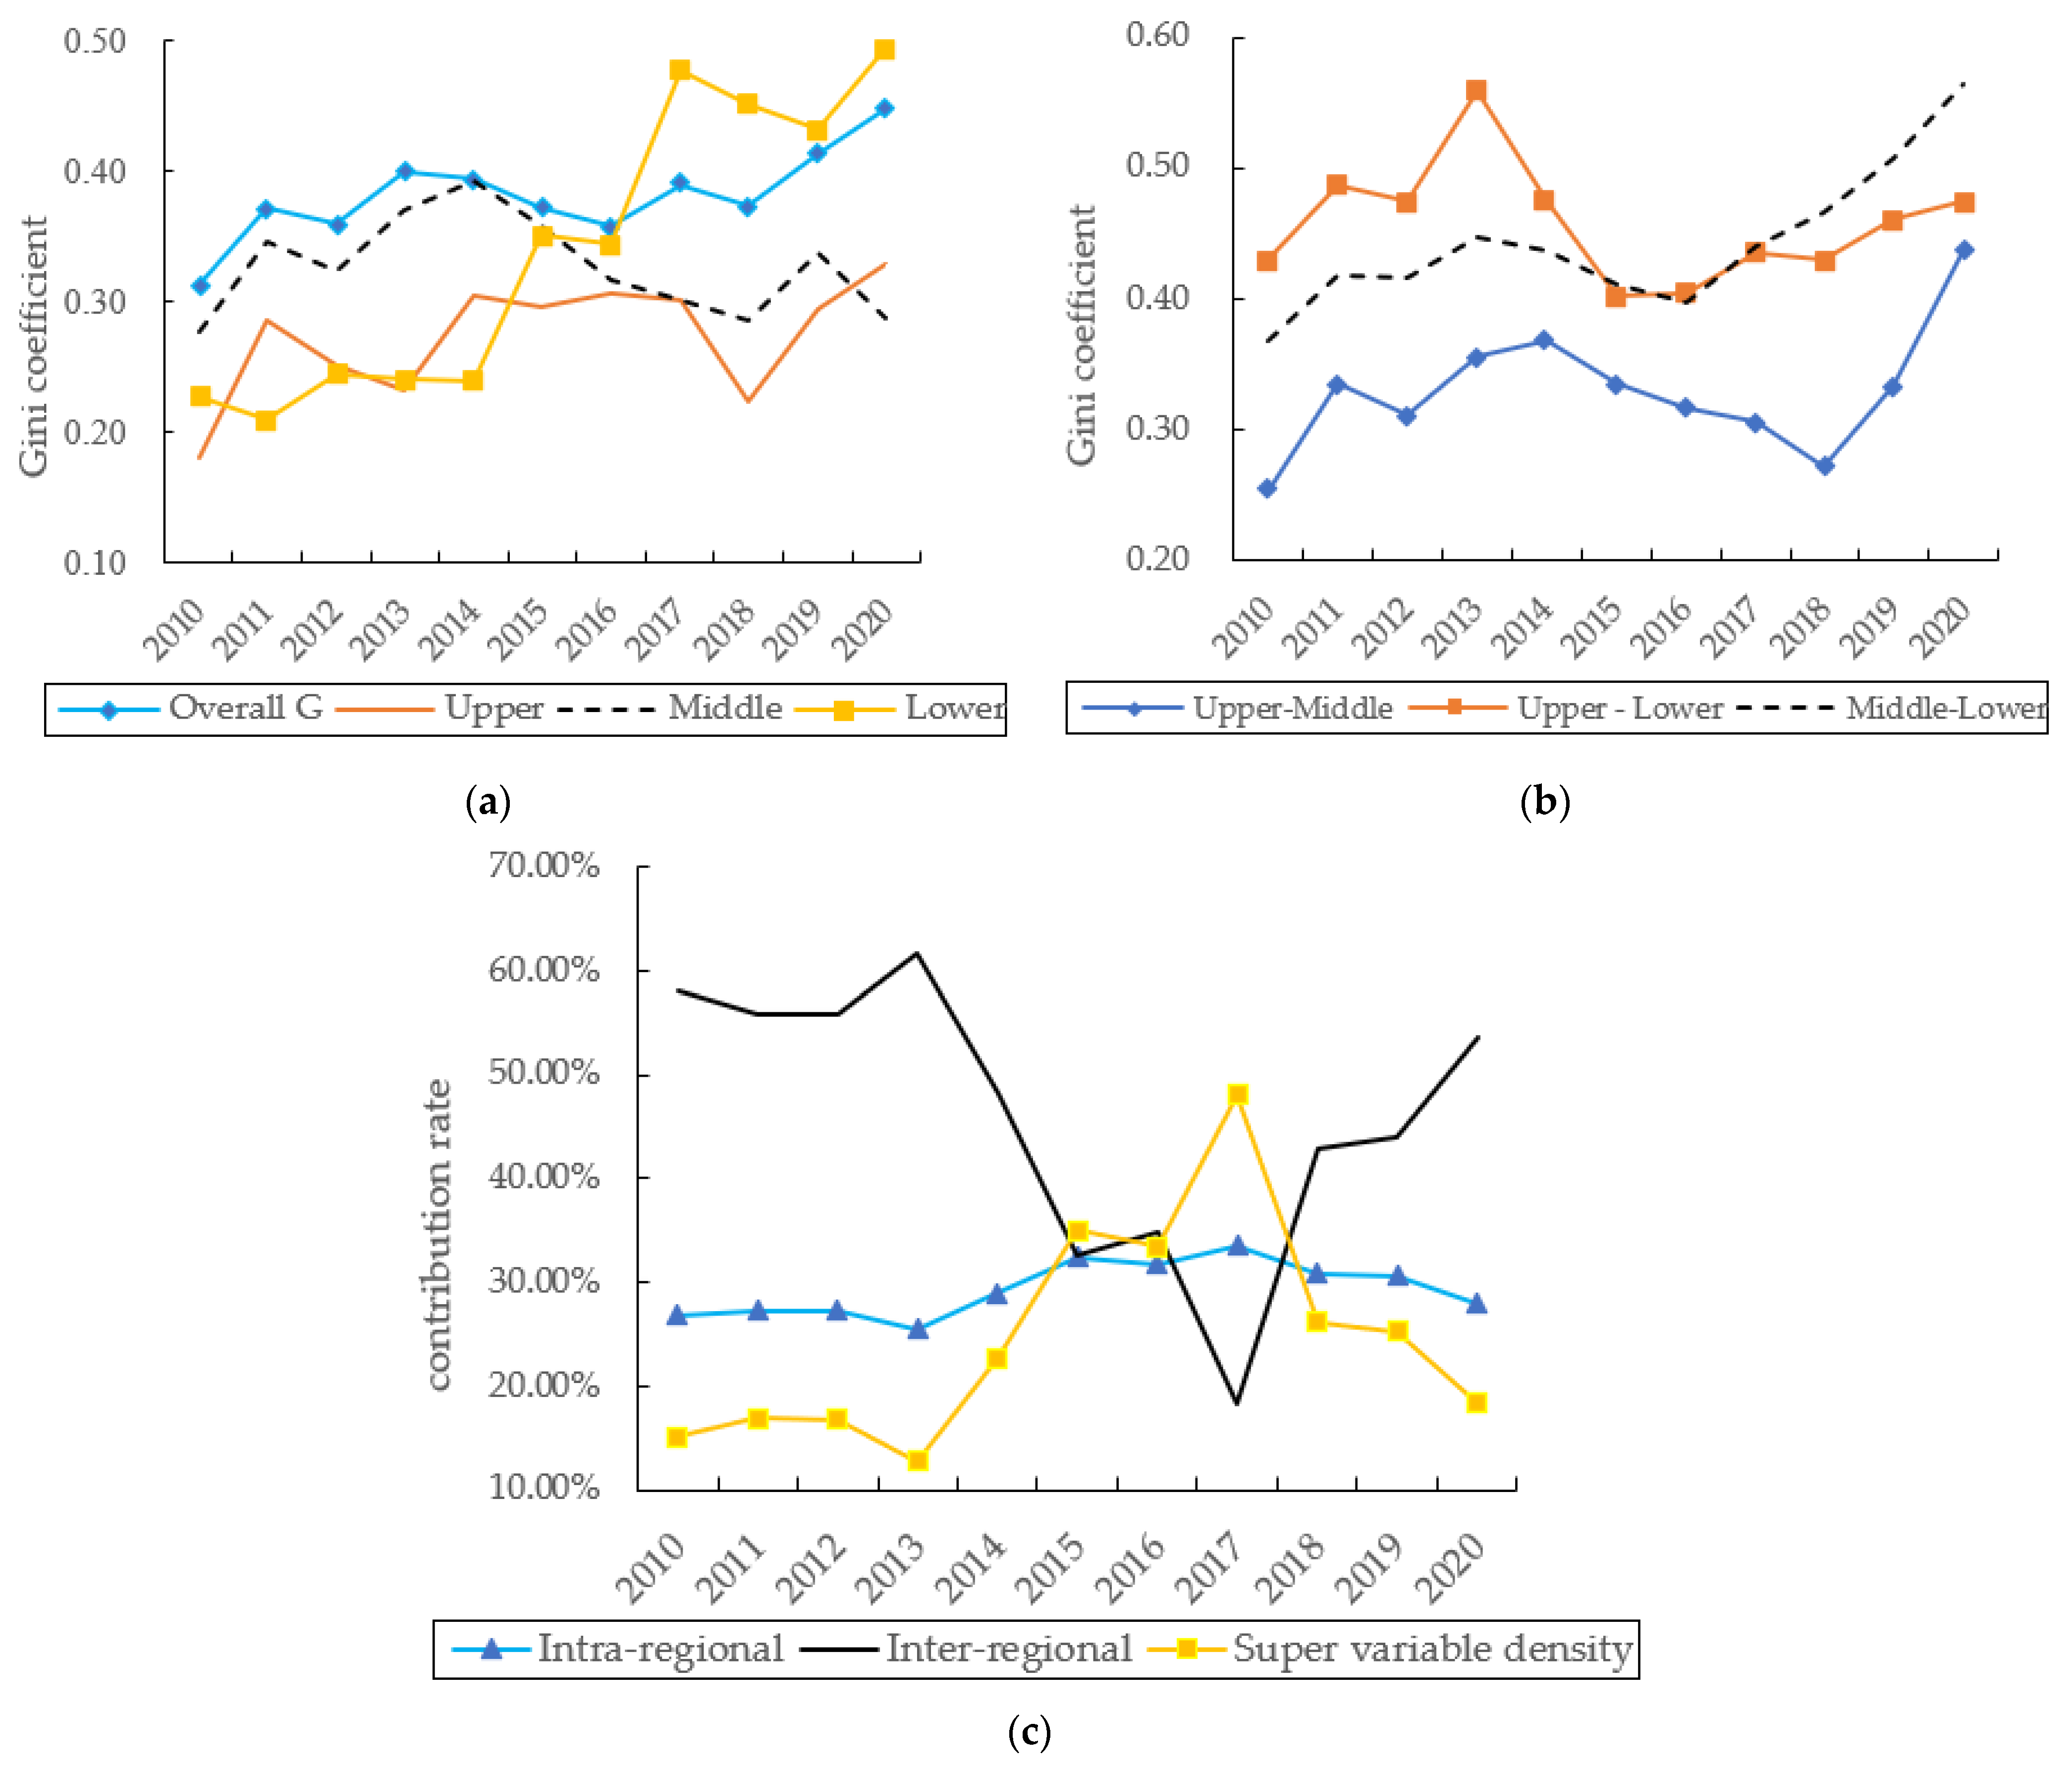
Figure 3a depicts the evolution of the overall and intra-regional variation in the coupling and coordination degree of agricultural carbon emissions efficiency and economic growth in the YRB. The mean value of the overall Gini coefficient for the coupling and coordination of agricultural carbon emissions efficiency and economic growth in the YRB was 0.3814, with a significant spatial non-equilibrium in the coupling and coordination. The overall Gini coefficient increased from 0.3128 in 2010 to 0.4485 in 2020 (or an increase of 43.38%), with an average annual increase of 4.34%. Hence, the spatial variation in the degree of coordination between agricultural carbon emissions efficiency and economic growth in the YRB has been increasing. From the viewpoint of the dynamic evolution process, the overall Gini coefficient of the coupling and coordination degree evolved in a fluctuating process of “small increase–slight decrease–rebound and increase–year by year decrease–rebound and increase–slight decrease–year by year increase”. At the same time, when comparing the three major regions, the differences in coupling and coordination of agricultural carbon emissions efficiency and economic growth in the YRB were evident, whereby the largest difference was in the downstream region, with an average value of the intra-regional Gini coefficient of 0.3377. Simultaneously, the unevenness of the coupling and coordination within the middle and upstream regions decreased, with their average intra-regional Gini coefficients being 0.3273 and 0.2732, respectively. During the sample period, the upstream and downstream regions exhibited a fluctuating upward trend, with average annual increases of about 8.29% and 11.78%, respectively. These results indicate that the spatial differences in coupling coordination within the upstream and downstream regions have deepened to varying degrees. To the contrary, the Gini coefficient in the midstream region fluctuated considerably, with a roughly “M”-shaped curve from 2010 to 2018, followed by a slight increase in 2019 and a slight decrease in 2020.

3.3.2. Inter-Regional Variation in the Degree of Coordination between the Coupling of Agricultural Carbon Emissions Efficiency and Economic Growth in the YRB

Figure 3b illustrates the evolution of inter-regional differences in the degree of coupling and coordination between agricultural carbon emissions efficiency and economic growth in the YRB. In terms of the magnitude of the numerical differences, the inter-regional variation in the coupling coordination degree between the upstream and downstream was the largest, with the mean value of the inter-regional Gini coefficient being 0.4577. Concurrently, the degree of difference between the midstream and downstream, as well as between the upstream and midstream regions, was lower, with the mean values of their inter-regional Gini coefficients being 0.4431 and 0.3297, respectively. From the perspective of the evolution process, the inter-regional differences in the coupling coordination between upstream and midstream, upstream and downstream, and midstream and downstream all exhibited a fluctuating upward trend during the observation period, with average annual increase rates of about 7.22%, 1.06%, and 5.35%, respectively. Meanwhile, the Gini coefficient between the upstream and midstream regions presented an M-shaped trend from 2010 to 2018. Subsequently, it rebounded and increased to the maximum value during the observation period of 0.4374 in 2020. The Gini coefficient between the upstream and downstream regions followed the general trend of “fluctuating upwards–declining downwards–rising steadily”. The evolution of the Gini coefficient curve between the midstream and downstream regions was similar to that between the upstream and midstream regions.

3.3.3. The Contribution of Sources to the Spatial Variation in the Degree of Coupled Coordination between Agricultural Carbon Emissions Efficiency and Economic Growth in the YRB

The trend of the contribution of various sources to the spatial variation in the degree of coordination between agricultural carbon emissions efficiency and economic growth in the YRB is illustrated in Figure 3c. From the perspective of the evolution process, the intra-regional contribution rate varied relatively smoothly, while the inter-regional contribution rate roughly underwent a “W”-shaped evolution process, whereby it fluctuated slightly from 2010 to 2013, decreased steadily from 2013 to 2015, increased slightly from 2015 to 2016, and then dropped to the minimum value during the observation period in 2017. After that, it increased continuously. In contrast to the inter-regional contribution rate, the super variable density contribution rate curve presented an opposite trend. In terms of magnitude, the mean inter-regional contribution rate was as high as 46.01%, and the mean intra-regional contribution rate was 29.37%, slightly higher than the mean contribution rate of 24.61% for super-variable density. As a result, the predominant source of spatial variation in the degree of coordination of coupled agricultural carbon emissions efficiency and economic growth in the YRB was inter-regional variation, while the second source was intra-regional variation, and the third source was super-variable density.

3.4. Dynamic Evolution of the Degree of Coupled Coordination between Agricultural Carbon Emissions Efficiency and Economic Growth

Next, the Kernel density method was utilized to thoroughly examine the location, shape, and extensibility of the distribution of the coupling between agricultural carbon emissions efficiency and economic growth in the YRB in order to further analyse the evolution of the absolute differences in the degree of coupling between agricultural carbon emissions efficiency and economic growth in the YRB.

3.4.1. Kernel Density Estimate Based on the Overall Level of the YRB

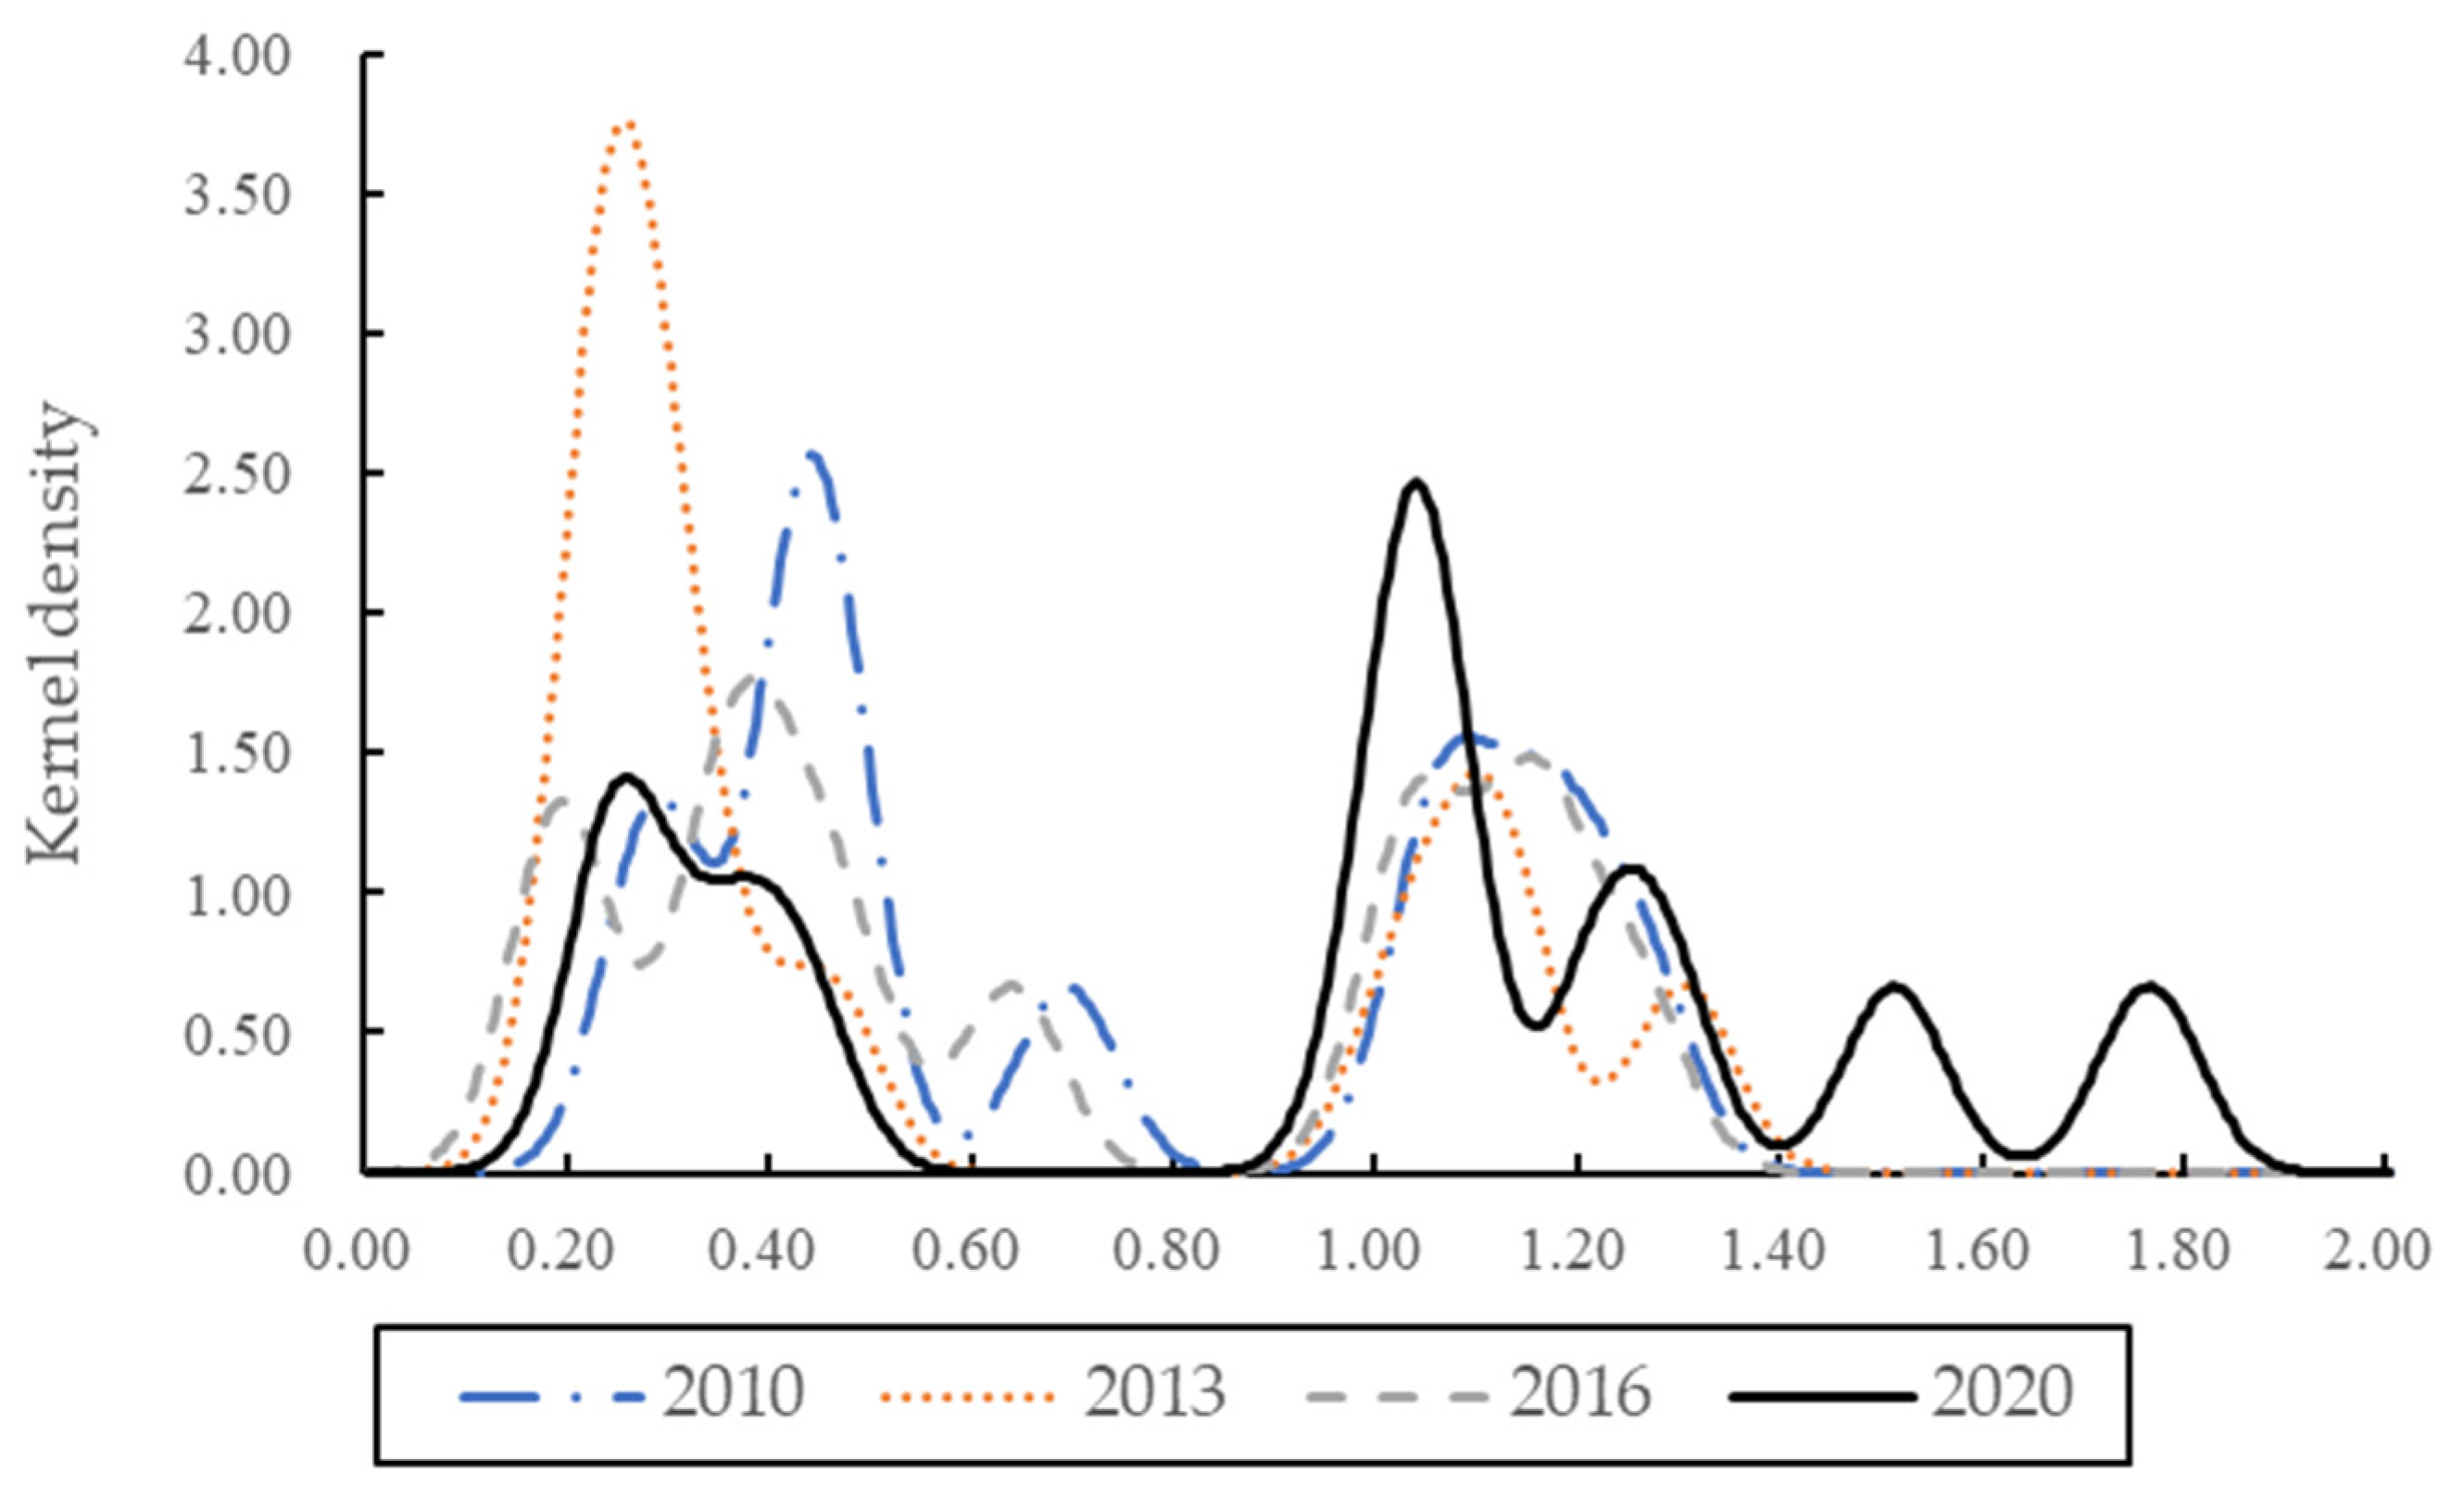
In Figure 4, the dynamic trends in the distribution of the degree of coupling and coordination between agricultural carbon emissions efficiency and economic growth in the 30 prefectures of the YRB are depicted. It can be observed that the main peak position of the coupling coordination degree in the YRB generally tended to shift to the left during the sample observation period. At the same time, the coupling coordination degree decreased, to a certain extent, consistently with the objective results in the previous section. More specifically, the peak of the estimated Kernel density curve shifted to the left in 2013 when compared to 2010, with little change in 2016 when compared to 2013, and presented a slight shift to the left in 2020. In terms of the distribution pattern of the main peaks, the peak of the Kernel density estimation curve presented a “rising–declining–rising” evolution, while the width tended to increase. This indicates that the absolute difference in the overall degree of coupling coordination in the YRB further expanded. Concurrently, from the perspective of distribution extension, the kernel density estimation curves of the sample observation period all exhibited a rightward trailing-phenomenon, which was the most significant in 2020, caused by the presence of more and more cities with a higher degree of coupling coordination within the YRB. Finally, in terms of the polarisation trend, the coupling coordination level in all years exhibited a multipolar distribution.

3.4.2. Kernel Density Estimate Based on the Local Level of the YRB

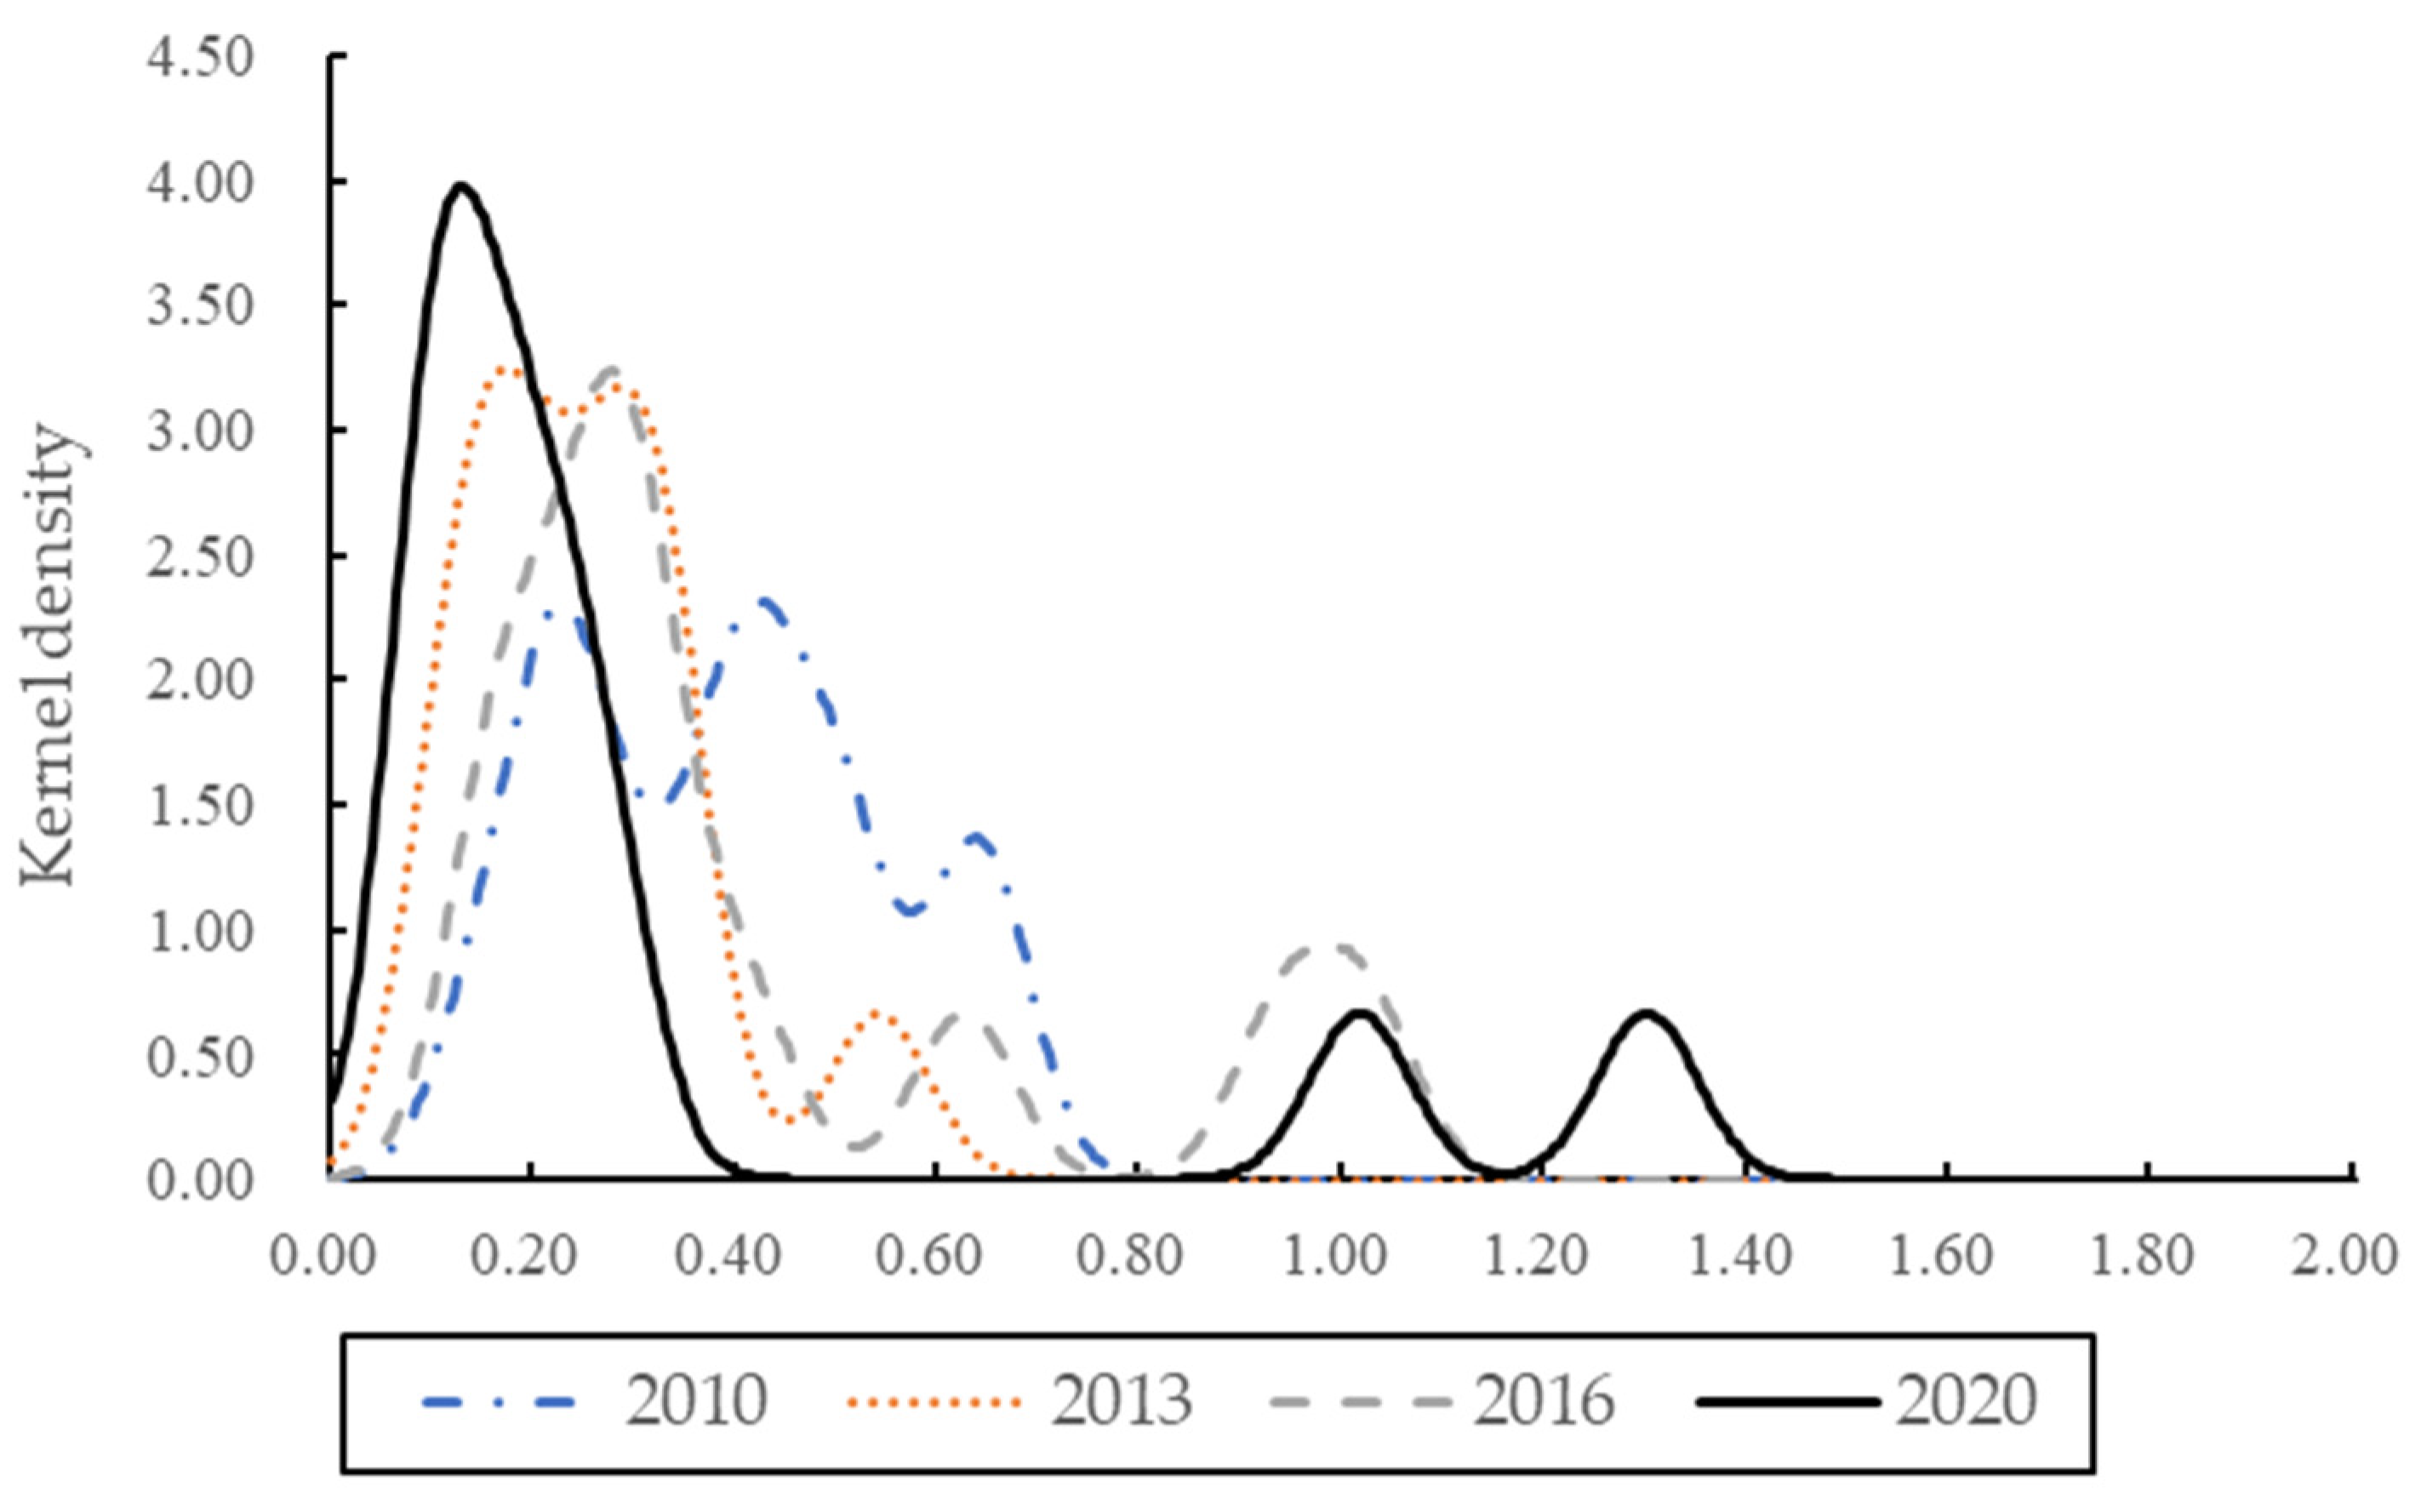
Figure 5 details the evolution of the distribution trend of the degree of coupling and coordination between agricultural carbon emissions efficiency and economic growth in the upstream region. Overall, the height of the main peak of the distribution curve in the upstream region exhibited a trend of “ apparent decrease–small increase–large increase” during the observation period, while the width of the main peak presented a trend of “widening–converging–widening”. This implies that the internal variation in the coupling coordination in the upstream region has undergone a “widening–narrowing–widening” evolution process. At the same time, further observation revealed that the position of the main peak generally exhibited a leftward trend over the observation period, and the degree of coupling coordination level demonstrated a decreasing trend. Finally, in terms of the polarization trend, the degree of coupling coordination was polarized in 2010 and 2020, while the distribution of coupling coordination was multi-polar in 2013 and 2016.
In Figure 6, the evolution of the distribution of the degree of coupling and coordination between agricultural carbon emissions efficiency and economic growth in the midstream region is depicted. From an overall perspective, the main peak of the density function curve in the midstream region fluctuated significantly, and the centre of the main peak changed significantly, while the width of the density function did not exhibit significant changes. First, from the perspective of the distribution position, the central portion of the distribution curve and the interval of change in the midstream region exhibited a leftward and then rightward shift, indicating that the coupling coordination degree in the midstream region generally presented an upward trend after 2013. Second, in terms of the distribution pattern, the peak height of the distribution curve in the midstream region generally exhibited a trend of “significant increase–significant decrease–slight increase” over the observation period, implying that the absolute differences in the midstream region were generally more volatile. Furthermore, in terms of the extension of the distribution, there was an obvious tailing phenomenon in 2020, implying that the level of coupling coordination in the midstream region exhibited obvious gradient differences with time. Finally, in terms of polarisation trends, all measurement years presented multi-polar characteristics.
In Figure 7, the evolution of the distribution of the degree of coupling and coordination between agricultural carbon emissions efficiency and economic growth in the downstream region is depicted. In terms of evolution, the centre of the density function shifted to the left when compared to 2010, providing a clear indication of the overall decreasing trend of coupling coordination in the downstream region. Subsequently, in 2016, the centre of the density function shifted to the right while, in 2020, it shifted to the left again, indicating that the level of coupling and coordination in the downstream region has generally undergone a process of “decline–rise–decline”. Simultaneously, in terms of the polarisation trend, except for 2010—when there was a clear multi-polarisation trend—the rest of the measurement years did not exhibit a clear multi-polarisation feature. Finally, in terms of the extension of the distribution, there is an evident rightward-trailing phenomenon in 2020 when compared to other years. This implies that, as time goes by, the cities with a higher degree of coupling and coordination in the downstream region are further promoted and the gap with the average level in the region is further widened. This provides evidence for the presence of a “rich get richer” effect.

4. Discussion and Conclusions

First, we compare and discuss the results of this paper with the existing literature on the basis of empirical research. Then, in order to promote the sustainable development of green and low-carbon agriculture in the YRB, it is essential to promote the coordinated development of the ecological environment and the economy, for which we drew the following conclusions to make relevant policy recommendations.

4.1. Results and Discussion

Since the ecological protection and high-quality development of the YRB has become a major national strategy, many scholars have paid extensive attention to the sustainable development of agriculture about this region [38,39,40]. The goal of an agricultural low-carbon economy is to achieve the coordinated development of ecological environmental protection and economic growth—this is the inherent requirement of ecological protection and high-quality development in the YRB. The degree of economic connection, the quality of division of labour and cooperation, and the level of coordinated development of agriculture in cities along the YRB urgently need to be improved. Therefore, the core objective of this study was to reveal the spatial differences and dynamic evolution laws of the coupling and coordination between agricultural carbon emissions efficiency and economic growth in the YRB.
The coupling coordination level of most cities in the YRB showed a decline, to varying degrees, during the sample observation period, consistent with existing studies [41]. In contrast, we also used the Dagum Gini coefficient and kernel density estimation methods to investigate the spatial differences and dynamic evolution of their coupling coordination, thus enriching the research results. However, some scholars have reached inconsistent conclusions in research on the ecological environment and economic growth of the YRB. For example, Li et al. [42] found the carbon emission efficiency of the tourism industry in the YRB increased slightly from 2010 to 2019, the possible reason for this is that these scholars have not used sub-division in agricultural aspects, especially agricultural carbon emission efficiency, and most of them have been conducted at the provincial level, failing to pay attention to the urban scale [43,44,45].

4.2. Conclusions and Policy Suggestions

Our main findings are as follows:
(1)
In terms of typical facts, there is still considerable room for improvement in the efficiency of agricultural carbon emissions in the YRB. In the upper, middle, and lower reaches of the YRB, a significant stepwise imbalance was observed. In addition, there were also significant differences in the degree of coupling and coordination between agricultural carbon emissions efficiency and economic growth in the YRB. At the same time, the degree of coupling and coordination exhibited a spatial distribution pattern of “high in the west and low in the east,” and the degree of coupling and coordination in most cities demonstrated varying degrees of decline over the sample observation period.
(2)
In terms of regional differences, there was a significant spatial non-equilibrium in the coupling and coordination degree of agricultural carbon emissions efficiency and economic growth in the YRB. When comparing the three major regions, the differences in the coupling and coordination of agricultural carbon emissions efficiency and economic growth in the YRB were noticed significantly, with the spatial non-equilibrium decreasing in the downstream, midstream, and upstream regions on a sequential basis.
(3)
In terms of dynamic evolution, the main peak of the kernel density estimation curve for the YRB exhibited a leftward shift, further indicating the decreasing trend of coupling coordination during the sample observation period.
Under the guidance of the national strategy for ecological protection and quality development of the YRB, based on the above findings, we propose the following policy recommendations to promote the efficiency of agricultural carbon emissions, economic growth, and synergistic regional development in the YRB:
(1)
To enhance the coupling and coordination of agricultural carbon emissions efficiency and economic growth in the YRB, it is essential to take into account both the overall perspective of the YRB and the differences in geographical location, resource endowment, and ecological and environmental conditions of the three major regions in the YRB. At the same time, it is necessary to follow the principles of local adaptation and coordinated development in order to improve the overall layout of ecological protection along with high-quality economic development in the YRB, based on the perspective of coordinated regional development.
(2)
We should fully understand the importance and urgency of the coupled and coordinated development of agricultural carbon emissions efficiency and economic growth in the YRB. Similarly, we should recognize that there is still considerable room for improvement in the efficiency of agricultural carbon emissions, as well as the degree of coupling and coordination in the YRB. At the same time, we should be aware that inter-regional differences are the predominant source of spatial differences in the degree of coupling and coordination in the YRB and that the spatial differences are most severe between the upstream and downstream. According to this characteristic, we should establish a solid idea by taking into account the overall interest of the whole country; establish a comprehensive mechanism for coordinated development in the upper, middle, and lower streams of the YRB; and develop a cooperation mechanism whereby the wise seek common interest. At the same time, it is also immensely crucial to accelerate the coordinated development of the whole basin in essential areas, such as ecology and environment, infrastructure, and technological research, in order to form a pattern of coordinated development in the three regions.

4.3. Limitations and Future Prospects

The short period of relevant public data for many cities along the YRB led to a lack of the data that was needed for this study to measure agricultural carbon emissions. With the global concern for climate change in recent years and the policy guidance of ecological priority, green, and low-carbon development, the low-carbon development of agriculture in cities along the YRB should be further improved. In the future, further measurements can be made after the supplementation of the data.

Author Contributions

Conceptualization, Y.Q., B.Z., and C.W.; methodology, Y.Q. and B.Z.; software, Y.Q. and B.Z.; validation, Y.Q. and B.Z.; formal analysis Y.Q.; investigation, Y.Q.; resources, Y.Q.; data curation, Y.Q. and B.Z.; writing—original draft preparation, Y.Q. and B.Z.; writing—review and editing, Y.Q., B.Z., and C.W.; visualization, Y.Q.; supervision, Y.Q. and C.W.; project administration, Y.Q. and C.W.; funding acquisition, Y.Q. and C.W. All authors have read and agreed to the published version of the manuscript.

Funding

This work was funded by the Key Program of the National Social Science Fund of China (The Funder: National Office for Philosophy and Social Sciences, grant number: 20&ZD095) and funded by Chongqing Social Science Planning Project (The Funder: Chongqing Office for Philosophy and Social Sciences,(grant number: 2021SZ21).

Institutional Review Board Statement

Not applicable.

Informed Consent Statement

Not applicable.

Data Availability Statement

The data presented in this study are available on request from the corresponding author.

Conflicts of Interest

The authors declare no conflict of interest.

References

  1. Davis, S.J.; Caldeira, K.; Matthews, H.D. Future CO2 emissions and climate change from existing energy infrastructure. Science 2010, 5997, 1330–1333. [Google Scholar] [CrossRef] [PubMed] [Green Version]
  2. Ren, B.P.; Zhang, Q. Strategic Design and Supporting System Construction of High-quality Development in the Yellow River Basin. Reform 2019, 308, 26–34. [Google Scholar]
  3. Jin, F.J. Coordinated promotion strategy of ecological protection and high-quality development in the Yellow River Basin. Reform 2019, 11, 33–39. [Google Scholar]
  4. Liu, T.; Xu, Z.Y. The Co-evolution of Economic Development, Green Innovation and Ecological Environment in the Yellow River Basin. Stat. Decis. 2022, 38, 105–109. [Google Scholar] [CrossRef]
  5. Zhou, Q.X.; He, A.P. Can Environmental Regulation Promote High-quality Development of the Yellow River Basin. Financ. Econ. 2020, 6, 89–104. [Google Scholar]
  6. Xi, J.P. Speech at the symposium on ecological protection and high-quality development in the Yellow River basin. Seek. Truth 2019, 20, 1–5. [Google Scholar]
  7. Xi, J.P. Jointly do a good job of great protection and coordinated promotion of great governance to make the Yellow River a river of happiness that benefits the people. People’s Dly. 2019, (Version 1, September 20). Available online: http://www.hwswj.com.cn/news/show-171112.html (accessed on 28 November 2022).
  8. Haan, C. Livestock’s Long Shadow: Environmental Issues and Options; Food and Agriculture Organization of the United Nations (FAO): Rome, Italy, 2006; Available online: https://www.fao.org/3/a0701e/a0701e00.htm (accessed on 18 August 2022).
  9. Chen, X.; Meng, Q.; Shi, J.; Liu, Y.; Sun, J.; Shen, W. Regional Differences and Convergence of Carbon Emissions Intensity in Cities along the Yellow River Basin in China. Land 2022, 11, 1042. [Google Scholar] [CrossRef]
  10. Chen, M.H.; Yue, H.J.; Hao, Y.F.; Liu, W.F. The Spatial Disparity, Dynamic Evolution and Driving Factors of Ecological Effificiency in the Yellow River Basin. J. Quant. Tech. Econ. 2021, 38, 25–44. [Google Scholar]
  11. West, T.O.; Marland, G. A synthesis of carbon sequestration, carbon emissions, and net carbon flux in agriculture: Comparing tillage practices in the United States. Agric. Ecosyst. Environ. 2002, 91, 217–232. [Google Scholar] [CrossRef]
  12. Dong, H.M.; Li, Y.E.; Tao, X.P.; Peng, X.P.; Li, N.; Zhu, Z.P. Technical Countermeasures for Greenhouse Gas Emissions from Agricultural Sources and Reduction in China. China J. Agric. Eng. 2008, 24, 269–273. [Google Scholar]
  13. Lal, R. Carbon emission from farm operations. Environ. Int. 2004, 30, 981–990. [Google Scholar] [CrossRef]
  14. Li, G.Z.; Li, Z.Z. An Empirical Analysis of Factors Decomposing Carbon Emissions in China’s Agricultural Energy Consumption—Based on the LMDI Model. J. Agric. Econ. 2010, 10, 66–72. [Google Scholar] [CrossRef]
  15. Tian, Y.; Zhang, J.B.; Li, B. Research on China’s agricultural carbon emissions: Measurement, spatio-temporal comparison and decoupling effect. Res. Sci. 2012, 34, 2097–2105. [Google Scholar]
  16. Min, J.S.; Hu, H. Calculation of Greenhouse Gas Emissions from Agricultural Production in China. China Popul. Res. Environ. 2012, 22, 21–27. [Google Scholar]
  17. Tian, Y.; Yin, H.H. Re-estimation of China’s agricultural carbon emissions: Basic status quo, dynamic evolution and spatial spillover effects. China Rural Econ. 2022, 3, 104–127. [Google Scholar]
  18. Liu, D.J.; Zhou, Q. Calculation and convergence test of agricultural total factor productivity under carbon emission constraints. J. Fujian Agric. 2017, 32, 99–106. [Google Scholar] [CrossRef]
  19. Zhao, X.C.; Song, L.M. Research on the relationship between carbon emissions from agricultural land use and agricultural economy in Hunan Province. J. Ecol. Rural Environ. 2018, 34, 976–981. [Google Scholar]
  20. Yao, C.S.; Qian, S.S.; Li, Z.T.; Bai, C.Q. Research on the relationship between agricultural carbon emissions, technological investment and economic growth in Heilongjiang Province. Chin. J. Agric. Res. Reg. Plan. 2017, 38, 8–15. [Google Scholar]
  21. Li, K.Q.; Ma, D.D. Research on the relationship between economic development, technological progress and agricultural carbon emission growth in Jiangsu Province. Sci. Tech. Mgt. Res. 2018, 38, 77–83. [Google Scholar]
  22. Tian, W.; Yang, L.J.; Jiang, J. Measurement and Analysis of China’s Agricultural Environmental Efficiency from a Low-Carbon Perspective: An SBM Model Based on Undesirable Output. China Rural Obs. 2014, 5, 59–71. [Google Scholar]
  23. Li, G.Z.; Li, Z.Z.; Zhou, M. An Empirical Analysis of the Relationship between Carbon Emissions and Agricultural Economic Growth. Agric. Econ. Mgt. 2011, 4, 32–39. [Google Scholar]
  24. Li, Z.M.; Song, K.; Sun, Y.H. An Empirical Measurement of Decoupling Indicators between Carbon Emissions and Economic Growth. Stat. Decis. 2011, 31, 86–88. [Google Scholar] [CrossRef]
  25. Holtz-Eakin, D.; Selden, T.M. Stoking the fires? CO2 emissions and economic growth. J. Public Econ. 1995, 57, 85–101. [Google Scholar] [CrossRef] [Green Version]
  26. Moomaw, W.R.; Unruh, G.C. Are environmental Kuznets curves misleading us? The case of CO2 emissions. Environ. Devel. Econ. 1997, 2, 451–463. [Google Scholar] [CrossRef]
  27. Zhang, L.; Pang, J.X.; Chen, X.P.; Lu, Z.M. Carbon emissions, energy consumption and economic growth: Evidence from the agricultural sector of China’s main grain-producing areas. Sci. Total Environ. 2019, 665, 1017–1025. [Google Scholar] [CrossRef] [PubMed]
  28. Tian, Y.; Lin, Z.J. Coupling and Coordination of Agricultural Carbon Emission Efficiency and Economic Growth in China’s Provinces. China Popul. Res. Environ. 2022, 32, 13–22. [Google Scholar]
  29. Wang, Y.N.; Gong, X.Y. Analysis of the Coupling Coordination between Agricultural Carbon Emissions and High-quality Economic Development in the Yangtze River Economic Belt. Reform Open. Up 2021, 40, 1–10. [Google Scholar] [CrossRef]
  30. Zheng, C.D.; Liu, S. Analysis of Carbon Emissions and Economic Growth Based on Spatial Econometrics. China. Popul. Res. Environ. 2011, 21, 80–86. [Google Scholar]
  31. Song, M.; Hao, X.G.; Liu, J.B. Spatio-temporal evolution characteristics of carbon balance and decoupling effect of economic growth in the Yellow River Basin. Urban Probl. 2021, 07, 91–103. [Google Scholar]
  32. Li, Z.G.; Wang, J. Spatiotemporal Transition Effects of Carbon Intensity in the Economic Accumulation of the Yellow River Basin. East China Econ. Mgt. 2020, 34, 61–71. [Google Scholar]
  33. Song, M.; Zou, S.J. Regional Differences, Convergence and Influencing Factors of Carbon Emissions Efficiency in the Yellow River Basin. Yellow River 2022, 44, 6–12. [Google Scholar]
  34. Guo, S.D.; Qian, Y.B.; Zhao, R. Efficiency and Convergence Analysis of Agricultural Carbon Emissions in Western China–Based on SBM-Undesirable Model. Rural Econ. 2018, 11, 80–87. [Google Scholar]
  35. Tone, K. A slacks-based measure of efficiency in data envelopment analysis. Eur. J. Oper. Res. 2001, 130, 498–509. [Google Scholar] [CrossRef] [Green Version]
  36. Xu, W.X.; Li, L.; Zhou, J.P.; Liu, C.J. The dynamic evolution of the coupling coordination between rural revitalization and new urbanization and its driving mechanism. China J. Nat. Res. 2020, 35, 2044–2062. [Google Scholar]
  37. Fan, J.; Wang, Y.F.; Wang, Y.X. Research on Regional High-Quality Development Based on Geographical Units–Also on the Differences and Key Points of the Development of the Yellow River Basin and the Yangtze River Basin. Econ. Geogr. 2020, 40, 1–11. [Google Scholar] [CrossRef]
  38. Liu, K.; Qiao, Y.R.; Shi, T.; Zhou, Q. Study on Coupling Coordination and Spatiotemporal Heterogeneity between Economic Development and Ecological Environment of Cities Along the Yellow River Basin. Environ. Sci. Pollut. Res. 2021, 28, 6898–6912. [Google Scholar] [CrossRef] [PubMed]
  39. Zhou, Y.; Li, W.; Li, H.; Wang, Z.; Zhang, B.; Zhong, K. Impact of Water and Land Resources Matching on Agricultural Sustainable Economic Growth: Empirical Analysis with Spatial Spillover Effects from Yellow River Basin, China. Sustainability 2022, 14, 2742. [Google Scholar] [CrossRef]
  40. Lan, F.; Hui, Z.; Bian, J.; Wang, Y.; Shen, W. Ecological Well-Being Performance Evaluation and Spatio-Temporal Evolution Characteristics of Urban Agglomerations in the Yellow River Basin. Land 2022, 11, 2044. [Google Scholar] [CrossRef]
  41. Zhao, Y.; Hou, P.; Jiang, J.; Zhai, J.; Chen, Y.; Wang, Y.; Bai, J.; Zhang, B.; Xu, H. Coordination Study on Ecological and Economic Coupling of the Yellow River Basin. Int. J. Environ. Res. Public Health 2021, 18, 10664. [Google Scholar] [CrossRef]
  42. Li, S.; Cheng, Z.; Tong, Y.; He, B. The Interaction Mechanism of Tourism Carbon Emission Efficiency and Tourism Economy High-Quality Development in the Yellow River Basin. Energies 2022, 15, 6975. [Google Scholar] [CrossRef]
  43. An, S.; Zhang, S.; Hou, H.; Zhang, Y.; Xu, H.; Liang, J. Coupling Coordination Analysis of the Ecology and Economy in the Yellow River Basin under the Background of High-Quality Development. Land 2022, 11, 1235. [Google Scholar] [CrossRef]
  44. Zhang, Z.; Li, H.; Cao, Y. Research on the Coordinated Development of Economic Development and Ecological Environment of Nine Provinces (Regions) in the Yellow River Basin. Sustainability 2022, 14, 13102. [Google Scholar] [CrossRef]
  45. Zhang, Y.; Wang, Z.; Hu, S.; Song, Z.; Cui, X.; Afriyie, D. Spatial and Temporal Evolution and Prediction of the Coordination Level of “Production-Living-Ecological” Function Coupling in the Yellow River Basin. Int. J. Environ. Res. Public Health 2022, 19, 14530. [Google Scholar] [CrossRef] [PubMed]
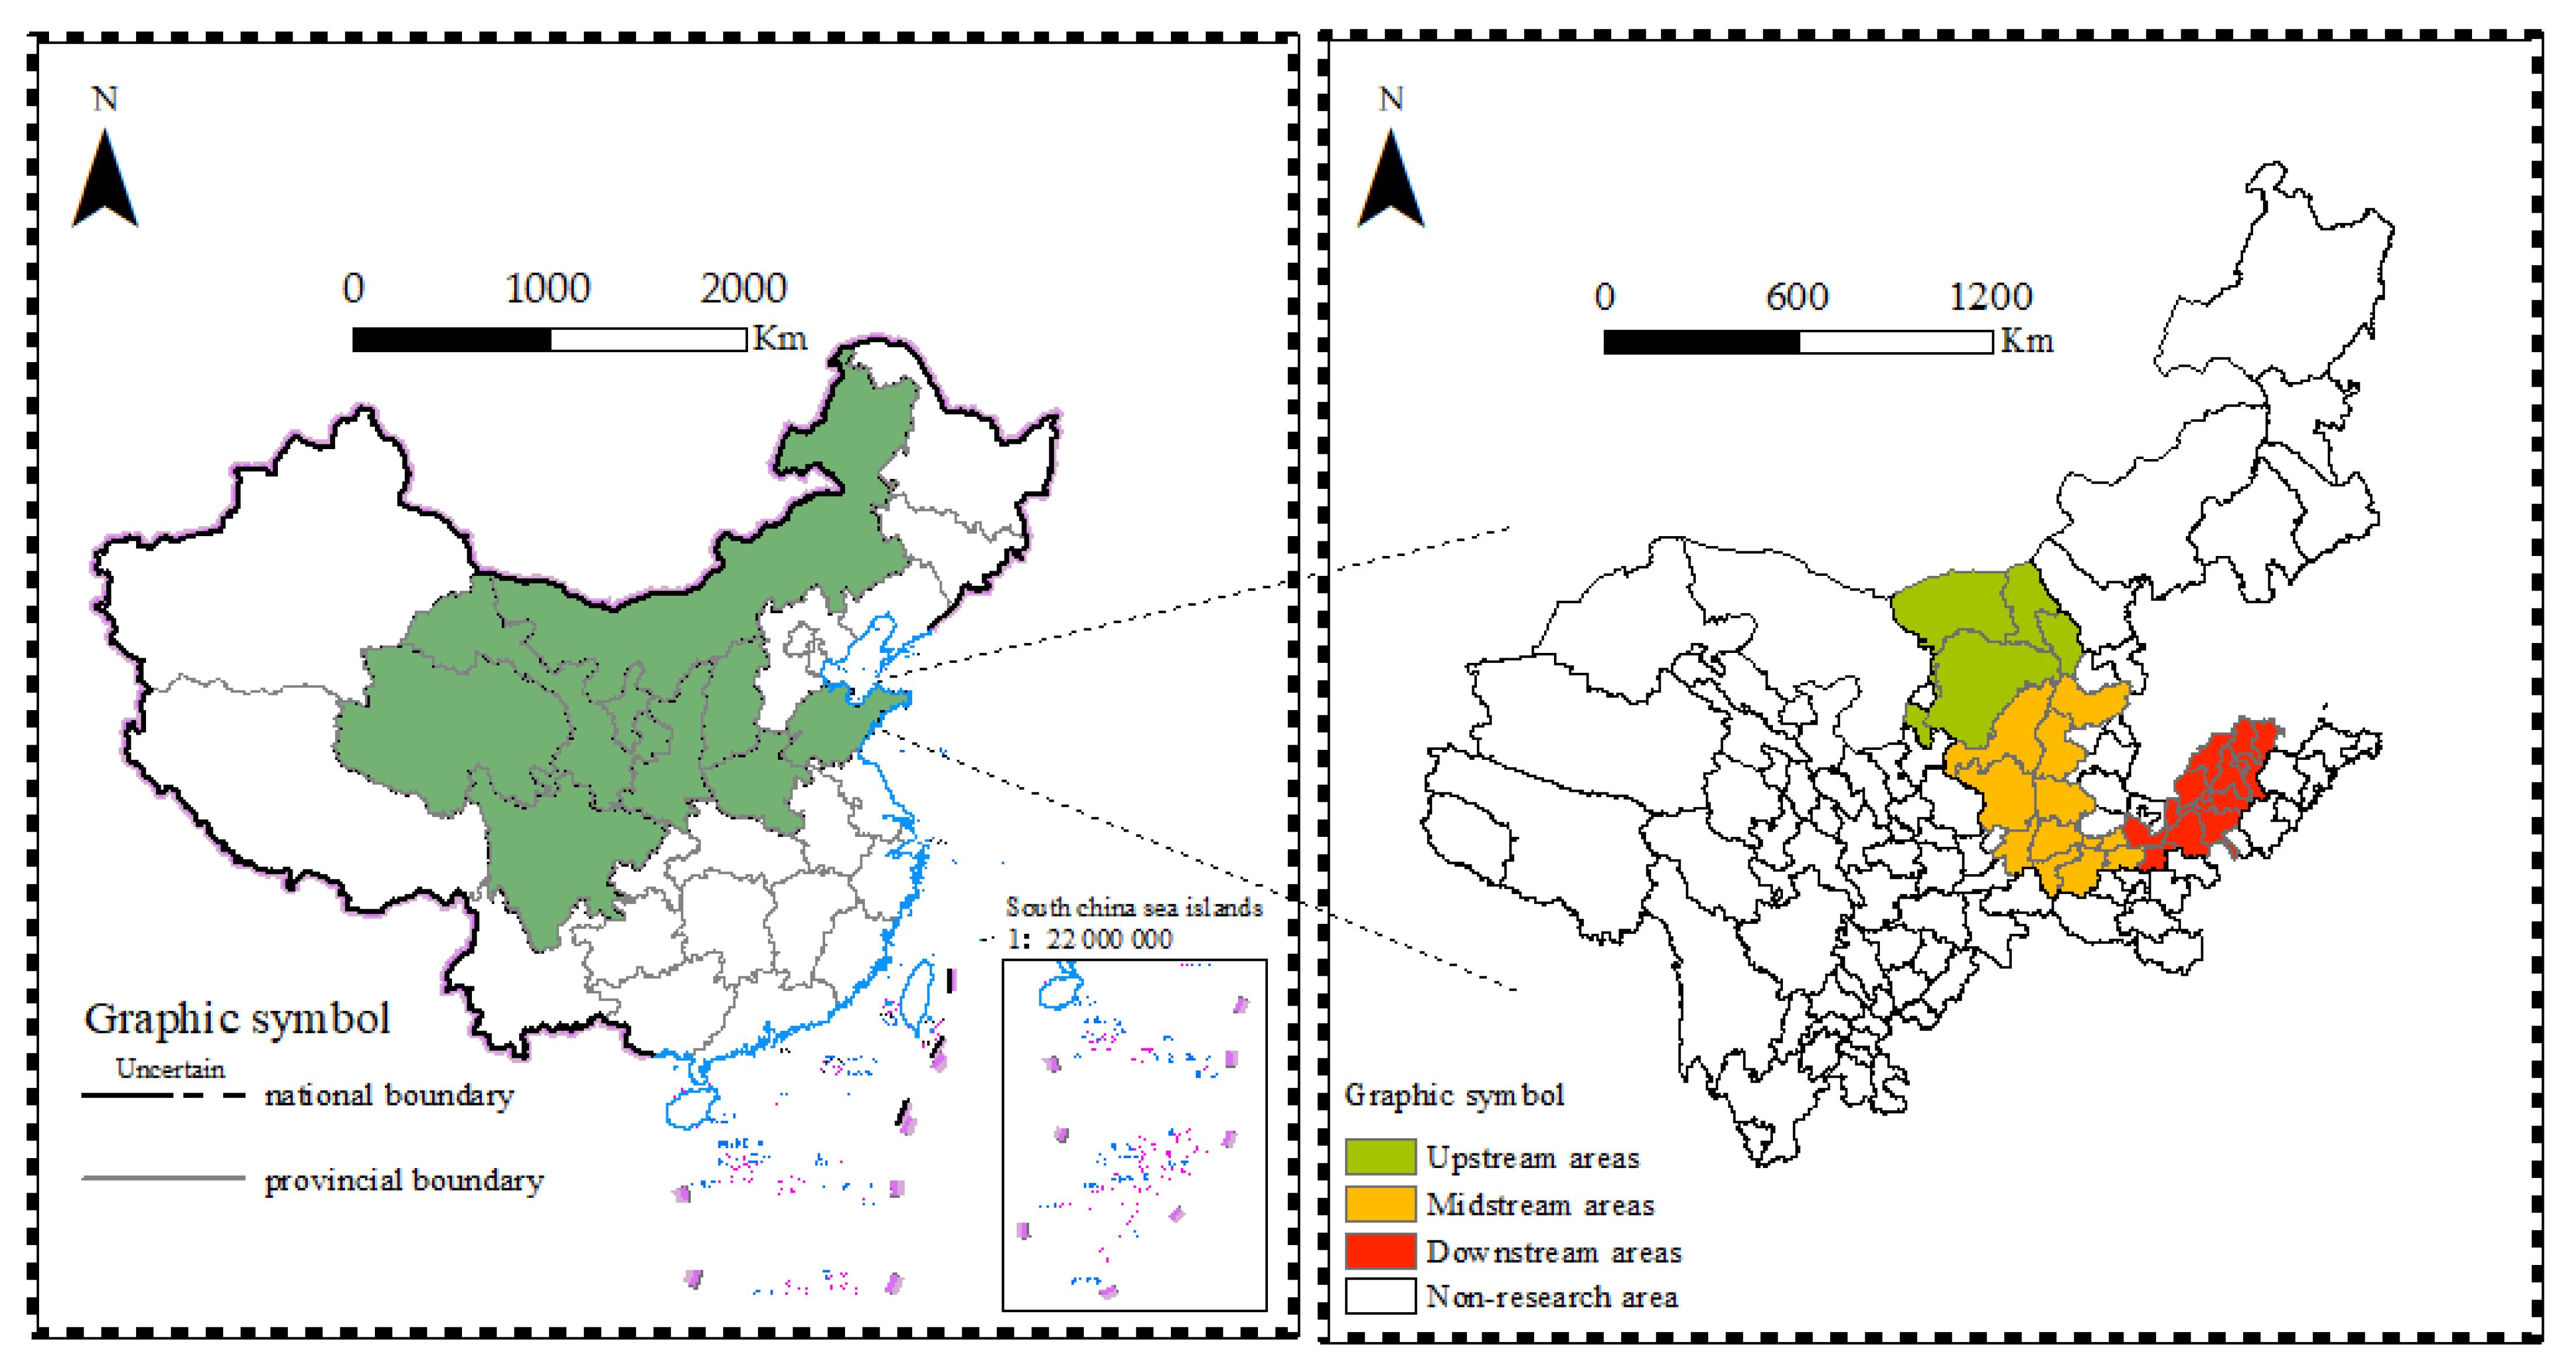
Figure 1. Overview of the distribution of cities along the YRB.
Sustainability 15 00971 g001
Figure 2. Evolution of the coupling and coordination of agricultural carbon emissions efficiency and economic growth in the YRB.
Sustainability 15 00971 g002
Figure 3. The magnitude of spatial variation and contribution of the degree of coordination between agricultural carbon emission efficiency and economic growth coupling in the YRB: (a) Overall and intra-regional Gini coefficients; (b) inter-regional Gini coefficients; and (c) sources of spatial variation and their contributions.
Sustainability 15 00971 g003
Figure 4. Dynamic evolution of the degree of coupling and coordination between agricultural carbon emissions efficiency and economic growth in the YRB.
Sustainability 15 00971 g004
Figure 5. Dynamic evolution of the degree of coupling and coordination between upstream agricultural carbon efficiency and economic growth.
Sustainability 15 00971 g005
Figure 6. Dynamic evolution of the degree of coordination between the efficiency of agricultural carbon emissions and economic growth in the midstream.
Sustainability 15 00971 g006
Figure 7. The dynamics of the degree of coordination between downstream agricultural carbon emission efficiency and economic growth.
Sustainability 15 00971 g007
Table 1. Distribution of cities in the upper, middle, and lower reaches of the YRB.
RegionsNumberCities
Upstream1–6Yinchuan, Bayannur, Baotou, Erdos, Hohhot, and Wuhai
Midstream7–18Jiaozuo, Linfen, Luoyang, Sanmenxia, Jiyuan, Weinan, Yuncheng, Xinzhou, Yan’an, Yulin, Zhengzhou, and Luliang
Downstream19–30Puyang, Xinxiang, Kaifeng, Liaocheng, Binzhou, Dezhou, Dongying, Heze, Jinan, Jining, Tai’an, and Zibo
Table 2. The YRB agricultural carbon emission efficiency evaluation index system.
CategoryDimensionsSpecific IndicatorsUnits
Input VariablesLabour inputPrimary sector workersTen thousand people
Land inputCrop sown areaHectares
Agriculture
capital
input
Fertilizer application rateMillion tons
Pesticide usedMillion tons
Agriculture film usageTons
Total power of agricultural
machinery
Million kW
Water inputEffective irrigated areaHectares
Output variablesExpected outputsGross output value of agriculture, forestry, animal husbandry, and fisheryBillions of CNY
Non-desired outputsAgricultural carbon emissionsMillion tons
Table 3. Classification of coupling coordination levels.
TypeNumerical ValueLevel of Coordination
Coordinated Development0.7 ≤ D < 1Advanced Coordination
Transformational development0.6 ≤ D < 0.7Intermediate Coordination
0.5 ≤ D < 0.6Primary Coordination
Dysfunctional decline0.3 ≤ D < 0.5Near Disorder
0 ≤ D < 0.3Mild Disorder
Table 4. The efficiency of agricultural carbon emission in the YRB from 2010 to 2020.
RegionsCities2010201320162020
UpstreamYinchuan0.4661.0490.2460.248
Bayannur0.4940.3170.3140.319
Baotou1.1081.0051.0170.366
Erdos1.1220.4290.4650.258
Hohhot1.2661.0811.0470.365
Wuhai1.1931.3791.3121.308
Mean0.9410.8770.7330.477
MidstreamJiaozuo1.1910.4551.0241.043
Linfen0.4420.2530.1970.245
Luoyang1.0481.1290.6381.052
Sanmenxia1.0761.0231.0491.050
Jiyuan0.4660.2251.1641.512
Weinan0.2940.2580.3700.354
Yuncheng0.4300.2840.3401.003
Xinzhou0.4300.2620.1860.254
Yan’an1.2631.3031.2541.220
Yulin1.1451.0961.1421.283
Zhengzhou0.6920.3420.4141.764
Luliang0.2770.2190.4770.426
Mean0.7290.5710.6880.934
DownstreamHeze0.2160.140.1970.107
Kaifeng0.5120.5410.9421.301
Jinan0.4960.3150.4110.258
Xinxiang0.6420.3320.6261.017
Binzhou0.320.190.2690.116
Puyang0.6380.3320.3270.27
Zibo0.3910.2340.2940.197
Jining0.4180.291.0250.194
Liaocheng0.1530.1150.1520.113
Tai’an0.4230.2490.2920.186
Dezhou0.2350.1770.2570.102
Dongying0.2370.1350.170.105
Mean0.390.2540.4130.331
Table 5. The coupling and coordination degree of agricultural carbon emissions efficiency and economic growth in the YRB between 2010 and 2020.
Cities2010201320162020
Yuncheng0.566Primary coordination0.386Near disorder0.366Near disorder0.397Near disorder
Xinzhou0.553Primary coordination0.342Near disorder0.460Near disorder0.409Near disorder
Linfen0.545Primary coordination0.610Intermediate coordination0.427Near disorder0.411Near disorder
Lvliang0.540Primary coordination0.335Near disorder0.617Intermediate coordination0.571Primary coordination
Huhehaote0.804Advanced coordination0.841Advanced coordination0.567Primary coordination0.565Primary coordination
Baotou0.692Intermediate coordination0.849Advanced coordination0.568Primary coordination0.527Primary coordination
Wuhai0.890Advanced coordination0.529Primary coordination0.726Advanced coordination0.645Intermediate coordination
Erdos0.560Primary coordination0.639Intermediate coordination0.521Primary coordination0.517Primary coordination
Bayannur0.548Primary coordination0.618Intermediate coordination0.407Near disorder0.509Primary coordination
Jinan0.662Intermediate coordination0.673Intermediate coordination0.462Near disorder0.374Near disorder
Zibo0.574Primary coordination0.353Near disorder0.529Primary coordination0.418Near disorder
Dongying0.476Near disorder0.478Near disorder0.371Near disorder0.401Near disorder
Jining0.649Intermediate coordination0.487Near disorder0.600Intermediate coordination0.346Near disorder
Tai’an0.658Intermediate coordination0.616Intermediate coordination0.466Near disorder0.363Near disorder
Dezhou0.481Near disorder0.509Primary coordination0.392Near disorder0.397Near disorder
Liaocheng0.392Near disorder0.493Near disorder0.402Near disorder0.294Mild disorder
Binzhou0.508Primary coordination0.512Primary coordination0.412Near disorder0.412Near disorder
Heze0.369Near disorder0.470Near disorder0.504Primary coordination0.402Near disorder
Zhengzhou0.655Intermediate coordination0.393Near disorder0.573Primary coordination0.718Advanced coordination
Kaifeng0.523Primary coordination0.782Advanced coordination0.630Intermediate coordination0.578Primary coordination
Luoyang0.855Advanced coordination0.882Advanced coordination0.580Primary coordination0.601Intermediate coordination
Xinxiang0.536Primary coordination0.383Near disorder0.629Intermediate coordination0.594Primary coordination
Jiaozuo0.626Intermediate coordination0.742Advanced coordination0.633Intermediate coordination0.539Primary coordination
Puyang0.763Advanced coordination0.648Intermediate coordination0.519Primary coordination0.375Near disorder
Sanmenxia0.834Advanced coordination0.867Advanced Coordination0.782Advanced coordination0.533Primary coordination
Weinan0.615Intermediate coordination0.713Advanced Coordination0.520Primary coordination0.448Near disorder
Yan’an0.735Advanced coordination0.554Primary coordination0.748Advanced coordination0.631Intermediate coordination
Yulin0.723Advanced coordination0.529Primary coordination0.734Advanced coordination0.649Intermediate coordination
Yinchuan0.605Intermediate coordination0.485Near disorder0.518Primary coordination0.489Near disorder
Jiyuan0.685Intermediate coordination0.603Intermediate coordination0.630Intermediate coordination0.566Primary coordination
Table 6. The regional differences in the degree of coupling between the efficiency of agricultural carbon emissions and economic growth, as well as their respective contributions.
YearOverall
G
Intra-RegionalInter-RegionalContribution Rate
UpperMiddleLowerUpper–MiddleUpper–LowerMiddle–LowerIntra-RegionalInter-RegionalSuper Variable Density
20100.31280.18030.27800.22700.25400.42950.367626.84%57.99%15.17%
20110.37150.28650.34570.20980.33620.48640.417727.32%55.77%16.91%
20120.36040.25120.32360.24530.31090.47490.416427.33%55.91%16.76%
20130.40070.23170.37040.24080.35550.55950.446625.55%61.71%12.73%
20140.39390.30490.39370.23970.36780.47560.436228.97%48.33%22.70%
20150.37260.29610.35790.35140.33510.40290.411032.45%32.51%35.05%
20160.35780.30610.31740.34430.31750.40490.398231.74%34.82%33.44%
20170.39020.30100.30170.47790.30700.43600.441333.51%18.39%48.10%
20180.37340.22430.28650.45150.27220.42960.466830.86%42.92%26.22%
20190.41330.29380.33750.43260.33360.46080.508130.60%44.11%25.28%
20200.44850.32970.28750.49430.43740.47490.564427.96%53.69%18.35%
Average0.38140.27320.32730.33770.32970.45770.443129.37%46.01%24.61%
Disclaimer/Publisher’s Note: The statements, opinions and data contained in all publications are solely those of the individual author(s) and contributor(s) and not of MDPI and/or the editor(s). MDPI and/or the editor(s) disclaim responsibility for any injury to people or property resulting from any ideas, methods, instructions or products referred to in the content.