Abstract
The global energy transformation is moving forward slowly, along with the continent of Africa. Although the momentum developed thus far is encouraging, there is an increasing need for transformative solutions to lessen climate change and its effects on the continent. In this article, we analyze the connection between green growth, entrepreneurship, and their effects on sustainable development in South Africa using the Quintuple Helix Innovation Model (QHIM). Hence, the purpose of the study is to foster the need for entrepreneurship and green growth for sustainable development. The quintuple helix model’s (QHIM) theoretical premise that the natural environment of society and the economy are the two fundamental factors behind innovation and the understanding that a knowledge economy requires sustainable growth are mainly supported by our findings. We accomplish this study by determining which entrepreneurial and green growth dimensions should be prioritized, respectively. Using ordinary least squares (OLS) and generalized linear model (GLM) we examine the association. We measured green growth with two main indicators which are environmental resource productivity and natural capital. Entrepreneurship was measured using entrepreneurial activity and entrepreneurial attitudes. Our findings revealed that more attention needs to be geared towards natural capital and entrepreneurial activity in South Africa. Decision-makers and the government will utilize the study’s findings as a guide for the zealous implementation of stated policies; recommendations are also highlighted in this study.
1. Introduction
In light of the National Development Plan (NDP) (2018), is a long-term South African development plan to address several problems that South Africans face, including poor educational quality, high unemployment, poor infrastructure, and an unbalanced economy, as well as South Africa’s first-ever national Green Economy Summit, which took place in 2010 and aimed to spur efforts toward a path of resource efficiency, low carbon emissions, and employment-friendly growth [1], there are encouraging signs of increased entrepreneurial activity and supportive environment. One of the forces behind sustainable development is entrepreneurship, which has several positive effects on the economy including the spread of knowledge, increased competition, increased variety in the products and services offered, the emergence of innovations, and the creation of jobs and employment opportunities [2,3]. Entrepreneurs can aid in the identification of consumer preferences and provide information in advance about the viability of new inventions by presenting new versions of existing goods and services to the market. Existing research indicates that a country’s level of economic development affects how entrepreneurship affects economic growth [2].
Green growth is a method of resolving environmental issues that places trust in developing science and innovation. A few of the relationships it has are with the economy, resources, environment, technology, politics, market, culture, and people. It is a sustainable approach that puts resource conservation, economic growth, and environmental friendliness first [4,5,6]. A new source of wealth generation and employment, the “green economy” is thought to have a higher local content than conventional fossil fuel-based economic activities [7,8]. According to some, a green economy will enable economic expansion and employment creation that is stronger than the current environmentally unsustainable growth. The South African government acknowledges the potential for a green economy to transition to a low-carbon economy, resource efficiency, and the creation of jobs that benefit the disadvantaged. It is possible that poor institutions and a lack of infrastructure will hinder development in this direction while raising negative externalities such as pollution and congestion [9,10,11]. The great majority of the nation’s coal-fired power plants and minor oil production are responsible for the majority of South Africa’s carbon emissions, which have been relatively stable over the past ten years. Entrepreneurship on the other hand is a driver of economic development. Numerous studies highlight that business activity is a powerful source of economic growth and job creation and that productive entrepreneurship is crucial in terms of economic welfare [12].
South Africa was among the top 15 countries in the emission of carbon dioxide as of 2019. Although the momentum developed against the emission of carbon dioxide thus far is encouraging, there is an increasing need for transformative solutions to lessen climate change and its effects on our continent [13]. According to [14], South Africa ranks 116th globally with a score of 37.2, which is below the average of all other nations. Because coal contributes so much to South Africa’s carbon emissions (it provides 80% of the country’s electricity), closing coal facilities and boosting renewable energy are the quickest ways to achieve a sustainable economy by 2030 [15]. A survey conducted by GEM SA also shows that new business rose to 6.7% from 2019 to 2021 and if these rates can continue an upward path it should lead to a greater depth of established businesses in South Africa thereby contributing to economic growth and the creation of jobs. However, the optimism of South Africa’s entrepreneurs in creating new jobs in 2021 declined from the 2019 new job creation increment.
This study, therefore, analyzes the connection between green growth, entrepreneurship, and their effects on sustainable development in South Africa. Hence the purpose of the study is to foster the need for entrepreneurship and green growth for sustainable development. One framework that considers these sectors is the quintuple helix model of innovation (QHIM). This is a model of innovative cooperation or an innovative environment, in which innovation users—(citizens), companies, universities, and public authorities—cooperate to generate socially significant innovations.
We accomplish this study by determining which entrepreneurial and green growth dimensions should be prioritized. This study is the first to analyze entrepreneurship and green growth using the QHIM in South Africa. There are not many theoretical and empirical studies that connect QHIM with the identified indicators in this study, as far as we know, thus, this study adds to the academic literature on the push toward sustainable development. By using the suggested models, the study hopes to close the gaps that have been found and promote sustainable growth. As a result, the study is unique and beneficial to policymakers such as governments, as it will allow them to optimize the assignment of resources to address priority issues.
2. Theoretical Background and Literature Review
2.1. The Quintuple Helix Innovation Model (QHIM)
People, corporations, governments, and non-governmental organizations must commit to collaborate with various groups for development to be sustainable. One of the models that is both interdisciplinary and transdisciplinary is the quintuple helix innovation model, which is based on the quality management of efficient development, restoring harmony with nature, and maintaining Earth’s biological diversity [16]. The quintuple helix innovation model, which consists of five spiral frameworks that are the education system, economic system, political system, civil society, and the natural environment. QHIM suggests that the constant engagement of the entire disciplinary spectrum is necessary for a thorough analytical comprehension of all spirals. Each helix represents a knowledge subsystem that connects to the other systems in a spiral fashion and, in turn, has a local, regional, and global impact [16,17]. The QHIM can be described as a theoretical and practical model for the exchange of knowledge resources, based on the five social (societal) subsystems with capital at its disposal to generate and promote sustainable development of society—it is the pivoted force and driver for progress [18,19].
According to the quintuple helix innovation model, developed by E.G. Crayannis and F.J. Campbell, the natural environment of society (green growth) and the economy (entrepreneurship) are the two main forces behind innovation [20]. With the awareness that the sustainable growth of a knowledge economy necessitates co-evolution with the knowledge society through fulfilling roles which impact each other, this model emphasizes the required socioecological transition of society and economy in the 21st century [17,19]. The second subsystem is the economic system, which includes business (industry) that focuses on entrepreneurship, machines, food, technologies, and money, among others. The natural environment, which is the fifth subsystem and contains natural capital including resources, climate, air quality, and geological stability, is essential for sustainable development. Figure 1 depicts the various sub-systems. The quintuple helix’s subsystems all carry out tasks that have an impact on one another, as well as on how we view and structure entrepreneurship [16,17,21].
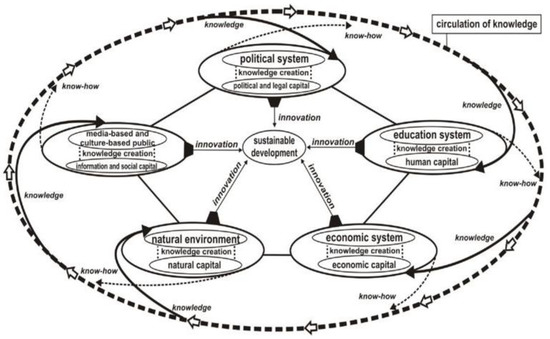
Figure 1.
The Quintuple Helix Innovation Model (QHIM) and its function. Source: Elias G. Carayannis, Thorsten D. Barth and David F. J. Campbell 2012 [19].
2.2. Sustainable Development
Only by protecting natural resources can long-term economic and social change be positive and sustainable. The Brundtland Report significantly contributed by highlighting the significance of sustainable development, which is thought to be based on ongoing economic growth. Natural capital must be preserved in its entirety for sustainable development, and the guidelines for renewable natural capital must be followed. Quantitative expansion in populations of people and goods must eventually come to a stop, but qualitative advancement can go on under a sustainable development regime [22]. Sustainable development is described in the literature as the capacity of systems to meet current demands and facilitate how people view themselves and the society they live in [23]. This incorporates the definition put forward by the Brundtland study, which is now the one that all significant institutions use the most. All of these definitions hold the same belief that long-term economic and social transformation can only be constructive and sustainable provided the natural resources that support development are protected [24]. The integration of three factors, including social, environmental, and economic sustainability, is known as sustainable development [25]. The 17 SDGs make clear the importance of sustainable development, recognizing that social, economic, and environmental sustainability must be balanced and that actions in one area can have an impact on results in other areas [23].
2.3. Entrepreneurship—Sustainable Development
Due to its crucial role in the process of economic development, entrepreneurship has gained support on a global scale. It boosts technical innovation, expands employment prospects, and encourages economic expansion [26]. Both as a standalone objective and as a tool that can increase employment, income, and creativity, entrepreneurship is valued [27,28]. Increased resource efficiency of small and medium-sized businesses has a positive impact on production, competitiveness, and ability to generate growth, according to [29]. Numerous studies have shown that entrepreneurship can be considered a micro driver of innovation and economic growth [3,28,30]. According to [31], macroeconomic uncertainty has a favorable effect on high-level innovation and is correlated with urban economies and locations.
To achieve the study’s goals and close a knowledge gap, [32] stated that when faced with significant unemployment, it is preferable to concentrate primarily on job creation, meaning that encouraging young people to start their businesses is advised. The measurements that evaluate these concerns will be helpful for policymakers in determining how many people become entrepreneurs, grow their firms, and create jobs for others. South Africans suffer several problems, including poor educational quality and high unemployment. Another approach recommended by academics [33] is the three aspects of entrepreneurship that are entrepreneurial attitudes, entrepreneurial activities, and entrepreneurial aspirations. These offer a more thorough understanding of the influence of entrepreneurship on sustainable development. These dimensions were used in this study to gauge entrepreneurship.
GEM data have essentially filled the definitional and analytical measurement gap that existed for entrepreneurship. These three aspects of entrepreneurship—entrepreneurial attitudes, activity, and aspirations—have been distinguished by the Global Entrepreneurship Monitor (GEM) as indicated in Table 1. An entrepreneurial mindset aids in the reduction of social issues like graduate unemployment. In an ongoing process of adaptation and learning, entrepreneurship involves seeking possibilities that facilitate the adoption of solutions [33,34]. Other study [35] concluded that self-efficacy and entrepreneurial education can effectively motivate college students to pursue their own business ventures and therefore promote sustainable development.

Table 1.
Components and definitions of entrepreneurship.
Table 1 shows the entrepreneurial components, definitions, and indicators according to the GEM. Together these factors foster the creation of new companies and influence the entrepreneurial climate, thereby affecting sustainable development and employment [2]. Based on the literature we posit that:
H1:
There is a positive and significant relationship between entrepreneurial attitude and sustainable development.
H2:
There is a positive and significant relationship between entrepreneurial activity and sustainable development.
2.4. Green Growth—Sustainable Development
To determine which flagship initiatives in South Africa best exemplify the green economy, we should start at the Green Economy Summit. The Summit Report claims that the basis of the green economy, which is envisioned as a path toward sustainable development, is addressing the interdependence between economic growth, social protection, and natural ecosystems. Combating inclusion and inequality, localizing employment (such as manufacturing), obtaining investment, and enhancing competitiveness were the key areas of attention [1]. The growth of the green economy is linked to resource consumption, energy production, and environmental management. One of the fundamental markers to gauge a nation’s level of sustainable development is energy consumption [6].
Much literature has been written about the idea of the “green economy” and related ideas such as “green growth,” “transition to a green economy,” “greener economies,” and “inclusive green growth” [36]. Some experts assert that balancing economic expansion with concern for the environment and people is entirely doable [16]. According to authors such as [37], who measured green growth using renewable energy, forest area, and natural resources, the correlation between these indicators and green growth is positive, and the higher the value, the greener the nation’s development will be. According to [38], a green economy is one that successfully provides a response to three sets of challenges facing humanity, that is, persistent poverty, overstepped planetary boundaries, and inequitable sharing of growing prosperity.
The green economy should be a component of a broader transition to sustainability that goes beyond resource efficiency and decarburization to include initiatives to decrease inequality and poverty. The “green” problem for developing countries is how to grow and urbanize with low levels of carbon emissions after avoiding the rise in per capita emissions during the initial phase of fast expansion and urbanization [10,39]. The main goal of green growth strategies is to make sure that natural resources may fulfill their full economic potential and in a sustainable way, by providing essential services for human health and well-being and life support systems such as clean air and water [40].
The framework of green growth indicators from OCED 2012 served as the main point of comparison for measurement. A framework for assessing green growth has been developed by the OECD, providing developed and developing countries with a way to organize their ideas about indicators and discover meaningful condensed facts. The component and definition of green growth is seen in Table 2. The framework demonstrates the interrelated nature of green growth by highlighting four of the most crucial aspects that must be tracked: natural resources, environmental quality, economic opportunities, and the environmental and natural resource productivity of the economy.
Table 2.
Component and definitions of green growth.
The set of OECD indicators based on SDGs offers the comparatively broadest, fullest, and most equal scope for measuring of green growth, according to authors that investigated the subject [41]. Based on the above literature we posit that:
H3:
There is a positive relationship between resource productivity and sustainable development.
H4:
There is a positive relationship between natural capital and sustainable development.
3. Methodology
3.1. Data and Methods
In South Africa, we use the Quintuple Helix Innovation Model (QHIM) to analyze the relationship between entrepreneurship and green growth, and their effects on sustainable development. Using SPSS, a quantitative, correlative, and explanatory empirical analysis is performed to determine the causal links among the variables. The information from official sources covers the years 2000 to 2019. Indicators for the measurement of entrepreneurship were based on prior literature such as [2], and were sourced from Global Entrepreneurship Monitor (GEM). In prior literature 14 indicators were identified for entrepreneurship. Measurements for green growth were based on OCED measure criteria which were also based on prior literature such as [37,41]. In prior literature 26 indicators were identified. To minimize the number of variables, identify the factors and prevent multicollinearity problems from occurring, we thus employ principal component analysis (PCA), as used in past research [42]. An Eigenvalue greater than one is used to determine the total number of components. Furthermore, the exclusion of any variables is not desirable as they all may contain pertinent information which could explain sustainable development. Two dimensions represent entrepreneurship (entrepreneurial activity and attitude) and two dimensions represent green growth (resource productivity and natural capital) which indicate the QHIM as an analysis criterion that is associated with the sustainable development goals (SDGs) [17]. Using the quintuple helix model is the most applicable for this research because it incorporates several domains that resonate and work together to address shared problems [19]. In all, the study uses 15 indicators, one indicator for measuring sustainable development, two dimensions for measuring entrepreneurship, two dimensions for measuring green growth, and one indicator for our control variable as indicated in Table 3. Following [43], the factors are then rotated using the varimax rotation which contains estimates of the correlations between each of the variables and the estimated components. Using Cronbach’s alpha and composite reliability, we assess the variables’ validity and reliability. Bartlett’s test and Kaiser–Meyer–Olkin (KMO) test were also used to make sure our data was suitable for factor analysis. The study employed the Shapiro–Wilk test to evaluate whether the data were normal. Pearson’s correlation was utilized to examine the correlation coefficients between the selected variables. The amount that each selected QHIM subsystem contributes to sustainable development was then analyzed utilizing ordinary least squares (OLS). A robust check was finally assessed using a generalized linear model (GLM). To assess the total contribution of the chosen QIHM subsystems to sustainable development, we finally sum up all the variables, including the controlling variable.
Table 3.
Measurement of variables.
3.2. Measurement of Variables
3.2.1. Dependent Variable
Sustainable development, which served as the dependent variable, was measured using Human Development Index (HDI) [44]. The HDI is a composite indicator that considers people and their capacities when evaluating a country’s progress. It is based on three components: life expectancy (health), average years of schooling (education), and gross national income per capita (GNI). It serves as a more accurate gauge of societal well-being than the GDP. In contrast to GDP, HDI incorporates a wider range of information and is not bound to a single metric, using two types of social data—health and education—and one type of economic data—GNI. As a result, it is a considerably more precise indicator than GDP. The HDI was developed to underline that, rather than relying solely on economic growth to gauge a nation’s development, consideration should be given to people and their potential. Data were obtained from Human Development Index.
3.2.2. Independent Variables
Entrepreneurship
This study measured entrepreneurship by entrepreneurial attitudes and entrepreneurial activity. Data was obtained from the Global Entrepreneurship Monitor (GEM), which examines entrepreneurs in key areas such as entrepreneurial attitudes and entrepreneurial activity. These indicators were also selected based on prior studies [2].
Four metrics were used to assess the attitudes of entrepreneurs: Entrepreneurial intention (percentage of the population aged 18 to 64 who are latent entrepreneurs and plan to launch a firm within three years, excluding those already engaged in entrepreneurial activity); Fear of failure (percentage of adults between the ages of 18 and 64 who believe that they see attractive opportunities but would not launch a business out of concern that it would fail; note that this is not the percentage of adults overall but rather the proportion of adults who perceive excellent opportunities); Perceived capabilities (percentage of 18–64 population who believe they have the required skills and knowledge to start a business); Perceived opportunities (percentage of 18–64 population who see good opportunities to start a firm in the area where they live).
Using two indicators, entrepreneurial activity was assessed: Existing Company Ownership (percentage of 18–64 population who are currently an owner-manager of an established business, i.e., owning and managing a running business that has paid salaries, wages, or any other payments to the owners for more than 42 months); Early-stage entrepreneurial activity (TEA) in its entirety (percentage of 18–64 population who are either a nascent entrepreneur or owner-manager of a new business).
Green Growth
The productivity of a nation’s environmental and resource components serves as a barometer for green growth. The greener the country’s development is, the better the value. Green growth was measured using two indicators: environment and resource productivity, and natural capital [37,41].
Resource productivity was measured using renewable energy consumption (percent of total final energy consumption), and CO2 emissions (metric tons per capita) data obtained from World Development Indicators (WDI), material footprint per capita (tons) data obtained from the Sustainable Development Index.
Natural capital was measured using four indicators: forest area (percent of land area), oil rent, natural gas and coal rent data was obtained from World Development Indicators (WDI).
3.2.3. Control Factors
Data on population density (the number of people per square kilometer of land area) from the World Development Indicators are used to account for alternative explanations in the context of sustainable development. A huge population has a significant impact on the environment [37]. As a result, we anticipate a strong correlation between population growth and sustainable development. After determining that the data can be modelled using ordinary least squares, we fitted our baseline as follows:
where is the dependent variable, is resource productivity, is natural capital, entrepreneurial attitude, entrepreneurial activity, is control variables and is the error term. All the variables and their sources are shown in Table 3; the regression coefficients indicate the factor by which a change in must be multiplied to provide the corresponding average change in y, enabling the prediction of y by giving a better overview of the link between the variables.
Table 3 shows a tabular presentation of the measurement of the indicators’ variables and sources.
4. Results
This study looks at how entrepreneurship and green growth are related, as well as how they affect sustainable development. Cronbach’s alpha and composite reliability are used to determine the reliability and validity of the modified measures. When Cronbach’s alpha is larger than or equal to 0.7, the construct is considered to have internal consistency [30]. All of the Cronbach alpha values are more than or equal to 0.7, as shown in Table 4. In addition, every composite reliability number is higher than the benchmark of 0.60. This study also uses Bartlett’s test and Kaiser–Meyer–Olkin (KMO) test to ensure that our data are appropriate for factor analysis. When the value of KMO is greater than 0.5 and the significance level for Bartlett’s test is less than 0.005 [35], it is determined that there is a significant correlation in the data. Table 4 demonstrates that the Bartlett test statistic is significant (p = 0.00), as expected, and that the Kaiser–Meyer–Olkin (KMO) measure is 0.685, which is suitable.
Table 4.
Reliability and normality test.
The Shapiro–Wilk test is used in the study to determine normality, which is a crucial step in determining the measures of central tendency and statistical methods for data analysis [45]. Since our sample size is 20, the Shapiro–Wilk test, which is the most extensively used method and is specifically suited for small sample sizes (n < 50) [45,46], is utilized. It measures how closely the sample data fit a normal distribution [47]. It is known that if the Shapiro–Wilk test results are greater than 0.05, the data are normal, but if they are lower than 0.05 (n < 0.05), they considerably depart from a normal distribution. According to our findings, the data’s deviation from normality was not severe as shown in Figure 2 because the Shapiro–Wilk test result was above 0.05. These all show that the correlation matrices share certain factors, making them a good candidate for factor analysis. Principal component analysis and Varimax rotation were used to identify the factors, and an Eigenvalue larger than one is used to calculate the total number of components. A correlation of less than 0.3 or 0.4 is regarded as trivial [48]. The factor loadings following rotation all surpass 0.563, as indicated in Table 4. The scale has strong construct validity as a result.
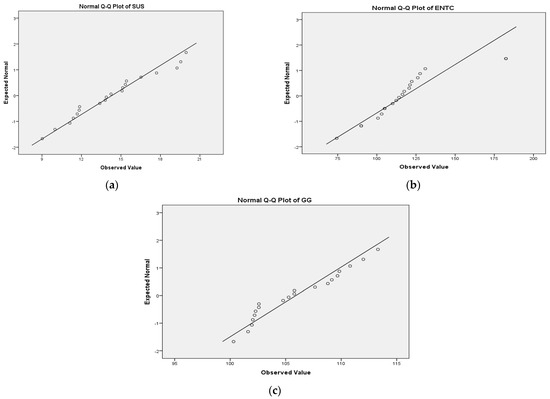
Figure 2.
Normal Q-Q plots for the variables: (a) sustainable development (SUS); (b) entrepreneurship (ENTC); (c) green growth (GG).
The descriptive statistics and Pearson’s correlation coefficient between the variables are shown in Table 5. All the independent indicators show a higher mean indicating that when entrepreneurship and green growth increase, sustainable development will also increase. Nearly all of the independent variables show significant variance, indicating that these variables could be able to explain sustainable development.
Table 5.
Descriptive analysis and Pearson correlation.
5. Regression Analysis and Discussions Using Ordinary Least Square (OLS)
A regression analysis using ordinary least square (OLS) was conducted to estimate how much each chosen QHIM subsystem contributes to sustainable development. This analysis looked at the direct correlation between the predictor factors and the dependent variable. This makes examining the study’s hypothesis testing simpler. This requires that the significant result fall below the study’s allowable level of significance for the study’s 95% confidence interval (p = 0.05). As a result, the predictor factors in this study (p = 0.000, R = 0.983 R2 = 0.966, Adjusted R2 = 0.955) explain 90% of the variables’ effects on sustainable development. VIF for the coefficients shows no multicollinearity, for green growth variables range from 1.096 to 1.786 which is within the range and entrepreneurship variables range from 1.23 to 2.56. The Durbin-Watson (DW) statistic assumes a value of 0–4. DW = 2 indicates that there is no autocorrelation. DW < 2 indicates positive autocorrelation and DW > 2 indicates a negative correlation. In this study DW = 1.439 indicates that there is a correlation among the variables. The results are presented in Table 6.
Table 6.
Regression results.
Green growth indicators were first set against the dependent variable in model 1 and model 2 that is resource productivity and natural capital indicators.
Renewable energy has a significant positive relationship with sustainable development by 0.902 (0.025) suggesting a 1% increase in renewable energy will increase sustainable development by 0.902%. As indicated by [49,50] indicating that renewal energy consumption is important for sustainable development in South Africa.
However, a highly substantial positive correlation between material footprint and sustainable development was found, with a value of 4.831 (p = 0.000). The entire amount of natural resources needed to support the operations of our economic and social systems.
The coefficient of CO2 emission remains negative and insignificant −0.367 (p = 0.457) suggesting that CO2 emission is less likely to be a significant determinant of sustainable development. This is in line with studies such as [51] who found a negative impact of CO2 emission with sustainable development. However, [52] concluded that sustainable development has a positive association with CO2 emissions when biomass is used and biotechnology is present.
Forest area as a percentage of land area remains negative and very significant with a coefficient of −6.171 (p = 0.000). Forest area had a higher coefficient which indicates that forest area is a substantial determinant of sustainable development in South Africa. From reducing the consequences of climate change to preventing soil erosion in agricultural lands. However, the adverse consequences demonstrate the necessity for South African land preservation and conservation to stop deforestation caused by, for example, forest clearing for agricultural purposes or timber demand. According to [53], urbanization, commodity-driven deforestation (oil and gas, minerals, etc.), and agricultural activity deforestation are the main causes of permanent deforestation in South Africa. Results of [54] who classified drivers of global forest loss indicate that 27% of global forest loss can be attributed to deforestation. This result is in line with [55].
Natural gas had a 10.186 (0.777) positive and insignificant correlation with sustainable development. We also discovered that the effects estimated size appears to be big, demonstrating that natural gas is the most environmentally friendly fossil fuel when compared to coal power plants. Natural gas users save an average of $69 per year on heating, cooking, water heating, and clothes drying. However, because methane, a potent greenhouse gas, is released while burning natural gas and seeps into the atmosphere in large quantities, it cannot be used to address the climate catastrophe [56,57] therefore the results obtained by the study.
Oil rent and coal rent were positively correlated with sustainable development but insignificant with a coefficient of 1.252 (0.904) and 0.617 (0.062). As indicated by [58,59,60], the insignificance of these two variables to sustainable development could be attributed to the need for sufficient energy sources owned as well as the need of substantial cost in the process for its use in South Africa.
Entrepreneurship was set against sustainable development in Model 3 and Model 4 which is entrepreneurial activity and entrepreneurial attitudes indicators. Entrepreneurial activity (TEA) has a positive and statistically significant impact of 1.606 (0.001) on sustainable development. This result suggests that the creation of new businesses is positively and statistically significant related to sustainable development. Our findings are consistent with the ones of previous studies [37], which also found a positive relation between TEA and sustainable development. The established business also has a positive and statistically significant impact of 0.464 (0.025) on sustainable development. A 1% increase in a business established will lead to a 0.464% increase in sustainable development.
Entrepreneurial intention has a positive and statistically significant impact of 1.078 (0.003) on sustainable development, indicating that the intention to go into entrepreneurship is a key to sustainable development. This is in line with prior studies such as [61,62]. Individual choice of not entering into entrepreneurship for fear of failure had a negative significant effect on sustainable development in South Africa. That is, when entrepreneurs worry about the potential of their idea or the inability to obtain funding for their venture, they tended to be affected more negatively and become less proactive [63]. Entrepreneurial capabilities is negatively correlated with sustainable development and insignificant. Entrepreneurial opportunities, on the other hand, have a positive and statistically significant impact on sustainable development 0.645(0.002). This type of entrepreneurs exhibit innovative skills and take advantage of previously undiscovered prospects, which increases their ability to contribute to economic progress. This is in line with prior research such as [64,65].
The control variable is displayed in Model 5. Population has a significant and favorable coefficient of 1.418 (p = 0.002) correlation with sustainable development. According to [66,67], population growth in India and the region of Eastern and Southern Africa positively affects sustainable development. The average population ages will be young and dependency rates will be high due to high population growth rates. Sub-Saharan Africa’s high population of children will limit growth as dependents, but as they enter the workforce, these nations can anticipate a “demographic dividend” that will accelerate sustainable development. However, if countries in Sub-Saharan Africa do not complete the demographic transition to slow population growth rates in the upcoming years, this dividend may be reduced [68].
Finally, we aggregate all the variables to evaluate the overall influence of the selected subsystems of the QHIM on sustainable development, as shown in Model 6 (Table 6). The inclusion of the natural environment within QHIM constitutes the majority of its contribution, contextualized as a contextualization of the four helices of the quintuple helix.
According to our results, resource productivity which is an important indicator of sustainable development goals (SDG) is positively and significantly correlated with sustainable development in South Africa. Resource productivity reduces the amount that the economy requires and diminishes the associated environmental impacts. Factors such as material footprint and renewable energy make a tremendous contribution to sustainable development in South Africa according to our findings. Therefore, accepting our H1 we hypothesized that resource productivity has a positive relationship with sustainable development. Natural capital on the whole had a negative and significant relationship with sustainable development. The findings demonstrate the importance of natural capital valuation for sustainable development since it enables governments to take into consideration how nature affects the economy and human well-being. The inverse link, however, demonstrates that the loss of natural capital such as forest loss, pollution etc. comes at a cost to society and subsequent generations. Consequently, we reject H2.
In sum, renewable energy and natural resources significantly have influences on environmental performance hence sustainable development [69,70]. Scientists claim that the buildup of CO2 emissions has caused global warming and more unpredictable weather. All of this suggests that long-term environmental costs are rising as the economy grows [71]. According to [72] in South Africa, there are three significant environmental problems: pollution, a shortage of energy, and deforestation. Therefore, South Africa’s environmental issues will be resolved if the deforestation problem is resolved. The Global Forest Watch report shows that between 2001 and 2021, there was a 26% decrease in the loss of tree cover and 945 mt of CO2 emissions. This is consistent with research by [54] who discovered that deforestation caused by altering permanent land use for the production of goods accounts for more than a quarter of worldwide forest loss. According to authors [73], resource extraction and processing have a negative impact on the environment; as a result, the relationship between CO2 emissions and sustainable development has major implications for both environmental and economic policies [74]. Due to the fact that CO2 emissions are a measure of an environmental footprint [37], it is necessary to lower CO2 emissions while also bolstering the South African economy [51]. Authors [75] in their study, concluded that globalization and urbanization as a whole increase the ecological and material footprint.
The QHIM assumes a fundamentally new role for the business, the results of the QHIM subsystems in Table 6 show that entrepreneurial attitude on the whole has a significant but negative correlation with sustainable development. This can be attributed to the fact that those who see good opportunities however would not start a new business for fear of failure limiting the potential increase in the rate of business creation [76] and thereby employment opportunities. Therefore Hypothesis 3 is rejected.
Entrepreneurial activity shows a positive and significant relationship with sustainable development. These results show that a 1% increase in entrepreneurial activity will lead to a limited increase in sustainable development by 0.223%. This result can be attributed to many factors such as business discontinuance rate. South Africa experienced a high business closure rate from 4.9% to 13.9% in 2019 according to GEM research by [76].
Population had a significant and positive relationship with sustainable development However, there is a need for an increase in the investment of human capital in South Africa to prevent slower development. Due to underinvestment in human capital, many nations have increased public spending on health and education. A lot of African governments’ capacity to support the social sector for their expanding populations has also been constrained by slower sustainable development [77]. Addressing underlying social causes may be crucial in reducing slower sustainable development [78].
Robustness Check
In this section, we use the Generalize Linear Model (GLM) to test the robustness of the results potential of endogeneity problems. The GLM function allows the linear model to be related to the response variable through a link function allowing the magnitude of the variance of each measurement to be a function of its predicted value [79]. The results presented in Table 7 are qualitatively similar to those in the main result of Table 6 hence our results are not sensitive to potential endogeneity problems.
Table 7.
Endogeneity results.
6. Conclusions and Recommendations
Economic growth, resource consumption, and environmental impact have all emerged as crucial elements of sustainable development. In this article, we analyzed the connection between green growth, entrepreneurship, and their effects on sustainable development in South Africa using the Quintuple Helix Innovation Model (QHIM). Hence the purpose of the study is to foster the need for entrepreneurship and green growth for sustainable development. One framework that takes considers these sectors is the Quintuple Helix Innovation Model (QHIM). (QHIM) theoretical premise that the natural environment of society and the economy are the two fundamental factors behind innovation and the understanding that a knowledge economy requires sustainable growth are mainly supported by our findings. We do this by analyzing which entrepreneurial dimension focused must be geared into and which green growth dimension focused must be geared into. We used population as our control variable. Using ordinary least squares (OLS) we examine the association.
Based on prior studies we measured green growth using two main indicators that is resource productivity and natural capital. Resource productivity was measured using renewable energy, material footprint and carbon dioxide emission. Natural capital was measured using forest area, oil, natural gas, and coal rents. Entrepreneurship was also measured with two indicators entrepreneurial activity and entrepreneurial attitude.
Resource productivity was significantly and positively related to sustainable development while natural capital was significant but negatively related to sustainable development. Our results show that more emphasis needs to be geared towards the natural capital in the South African economy. This is because forest area, oil, natural gas, and coal rents which were used as a measurement in this study indicated that a 1% increase will lead to a huge increase in sustainable development in South Africa. Therefore, there is a need to maintain a resilient ecosystem and achieve prosperity by setting ecological limits and putting policy framework with an emphasis on implementation for the economy and society. This is because natural capital is the most fundamental of the core forms of capital thus providing the basic conditions for human existence.
Our results further show that entrepreneurial activity is positively and significantly correlated to sustainable development whiles entrepreneurial attitude is negatively correlated with sustainable development. However, entrepreneurial activity has a minimal impact on sustainable development. This result is due to several factors such as the closing down of businesses, and lack of finances to support the venture. Our results indicate that both indicators of entrepreneurship need to be encouraged more in South Africa. However, entrepreneurial activity needs more emphasis. This is because according to our results entrepreneurial attitude has a greater coefficients than entrepreneurial activity, a 1% increase in entrepreneurial attitude will lead to 0.341% decrease in sustainable development and a 1% increase in entrepreneurial activity will lead to 0.223% increase in sustainable development in South Africa. This result is not surprising because entrepreneurial attitude such as fear of failure is a state rather than a trait. Is a temporary cognitive and emotional reaction to a threat to potential achievement. However, if startups fail repeatedly, it will have a significant impact on the South African economy since people who are currently employed would join the unemployed, some of whom are hesitant to pursue entrepreneurship out of fear of failure, and others who do not have the intention to do so. South Africa’s unemployment rate will rise as a result of this.
Based on the indicators suggested by the QHIM, this study has determined that entrepreneurship and green growth are important for sustainable development, i.e., these variables are essential for the sustainable development of the South African economy. As much as these factors are important there is a need for the intervention of government policies and initiatives. With factors such as deforestation, urbanization, and business disclosure influencing South Africa’s sustainable development, it is obvious that an efficient and reliable system is an influential factor in establishing a good economy.
Given our findings, we, therefore, recommend that entrepreneurial education be pushed and that funds be invested in developing the capabilities of the next generation, such as by making skilled employment a requirement for admission to school. This will support the early development of the entrepreneurial spirit. Encouraging graduates to work for themselves, so raising the standard of living. Early-stage business needs to be supported financially and individual entrepreneur’s need to be educated on innovative ideas. This will prevent business closures that might be due to trends or technological inefficiencies. This will also address urbanization, one of South Africa’s biggest environmental problems. Urbanization process has a negative impact on the consumption of renewable energy because it has a positive influence on the consumption of non-renewable energy. If urbanization is curbed, deforestation and fire outbreaks will also decline, resulting in lower pollution levels and a greener South African economy. Therefore, there is a need for the preservation and protection of South Africans such as educating indigenous communities about the importance of protecting the land forest to prevent deforestation. South Africa must continue to focus on a green growth strategy to achieve the SDGs.
Author Contributions
Writing—original draft, D.Q. (Dinah Quacoe); Writing—review & editing, D.Q. (Daniel Quacoe); Supervision, Y.K. All authors have read and agreed to the published version of the manuscript.
Funding
This research was funded by National Natural science foundation of China funding number 71973054.
Institutional Review Board Statement
Not applicable.
Informed Consent Statement
Not applicable.
Data Availability Statement
Not applicable.
Conflicts of Interest
The authors declare no conflict of interest with respect to the research, and authorship of this article.
References
- Musango, J.K.; Brent, A.C.; Bassi, A.M. Modelling the transition towards a green economy in South Africa. Technol. Forecast. Soc. Chang. 2014, 87, 257–273. [Google Scholar] [CrossRef]
- Doran, J.; McCarthy, N.; O’Connor, M. The role of entrepreneurship in stimulating economic growth in developed and developing countries. Cogent Econ. Financ. 2018, 6, 1442093. [Google Scholar] [CrossRef]
- Stoica, O.; Roman, A.; Rusu, V.D. The nexus between entrepreneurship and economic growth: A comparative analysis on groups of countries. Sustainability 2020, 12, 1186. [Google Scholar] [CrossRef]
- Gazzola, P.; Del Campo, A.G.; Onyango, V. Going green vs going smart for sustainable development: Quo vadis? J. Clean. Prod. 2019, 214, 881–892. [Google Scholar] [CrossRef]
- Ling-ling, G.; Chun-you, W.; Jing-tao, Y. Influencing Factors Identification of Green Growth in China Based on Entropy-DEMATEL Model. In Proceedings of the AASRI International Conference on Industrial Electronics and Applications (IEA 2015), London, UK, 27–28 June 2015; pp. 568–571. [Google Scholar]
- Zhu, L.; Luo, J.; Dong, Q.; Zhao, Y.; Wang, Y.; Wang, Y. Green technology innovation efficiency of energy-intensive industries in China from the perspective of shared resources: Dynamic change and improvement path. Technol. Forecast. Soc. Chang. 2021, 170, 120890. [Google Scholar] [CrossRef]
- O’Neill, K.; Gibbs, D. Sustainability transitions and policy dismantling: Zero carbon housing in the UK. Geoforum 2020, 108, 119–129. [Google Scholar] [CrossRef]
- Borel-Saladin, J.M.; Turok, I.N. The impact of the green economy on jobs in South Africa: News & views. S. Afr. J. Sci. 2013, 109, 1–4. [Google Scholar]
- Ofori, I.K.; Armah, M.K.; Asmah, E.E. Towards the reversal of poverty and income inequality setbacks due to COVID-19: The role of globalisation and resource allocation. Int. Rev. Appl. Econ. 2022, 1–28. [Google Scholar] [CrossRef]
- Freire, M.E. Urbanization and Green Growth in Africa. 2017. Available online: www.growthdialogue.org (accessed on 13 September 2022).
- Smit, S.; Musango, J.K. Towards connecting green economy with informal economy in South Africa: A review and way forward. Ecol. Econ. 2015, 116, 154–159. [Google Scholar] [CrossRef]
- Angulo-Guerrero, M.J.; Pérez-Moreno, S.; Abad-Guerrero, I.M. Disparities in entrepreneurial activity and attitude across EU countries. Eur. Plan. Stud. 2017, 25, 680–702. [Google Scholar] [CrossRef]
- African Energy Transitioning to a Sustainable and Prosperous Future. Available online: https://energyindaba.co.za/african-energy-transitioning-to-a-sustainable-and-prosperous-future/ (accessed on 13 September 2022).
- Environmental Protection Index. Available online: https://global-reports.23degrees.eu/epi2022/root (accessed on 14 September 2022).
- Starre Vartan, E.M. Available online: https://www.treehugger.com/greenhouse-gas-emissions-by-country-5120253 (accessed on 13 September 2022).
- Lavrinenko, O.; Ignatjeva, S.; Ohotina, A.; Rybalkin, O.; Lazdans, D. The role of green economy in sustainable development (case study: The EU states). Entrep. Sustain. Issues 2019, 6, 1113–1126. [Google Scholar] [CrossRef]
- Barcellos-Paula, L.; De la Vega, I.; Gil-Lafuente, A.M. The Quintuple Helix of innovation model and the SDGs: Latin-American countries’ case and its forgotten effects. Mathematics 2021, 9, 416. [Google Scholar] [CrossRef]
- Grundel, I.; Dahlström, M. A quadruple and quintuple helix approach to regional innovation systems in the transformation to a forestry-based bioeconomy. J. Knowl. Econ. 2016, 7, 963–983. [Google Scholar] [CrossRef]
- Carayannis, E.G.; Barth, T.D.; Campbell, D.F.J. The Quintuple Helix innovation model: Global warming as a challenge and driver for innovation. J. Innov. Entrep. 2012, 1, 2. [Google Scholar] [CrossRef]
- Nabipour, I. The Fifth Generation University: Based on the Quintuple Helix of Carayannis and Campbell. ISMJ 2020, 23, 165–194. [Google Scholar]
- Baccarne, B.; Logghe, S.; Schuurman, D.; De Marez, L. Governing quintuple helix innovation: Urban living labs and socio-ecological entrepreneurship. Technol. Innov. Manag. Rev. 2016, 6, 22–30. [Google Scholar] [CrossRef]
- Daly, H.E. Toward some operational principles of sustainable development 1. In The Economics of Sustainability; Routledge: London, UK, 2017; pp. 97–102. [Google Scholar]
- Javed, A.; Yasir, M.; Majid, A. Is social entrepreneurship a panacea for sustainable enterprise development? Pak. J. Commer. Soc. Sci. (PJCSS) 2019, 13, 1–29. [Google Scholar]
- Warhurst, A. Sustainability indicators and sustainability performance management. Min. Miner. Sustain. Dev. [MMSD] Proj. Rep. 2002, 43, 129. Available online: www.wbs.warwick.ac.uk/ccu/ (accessed on 29 September 2022).
- Dzomonda, O. Social Entrepreneurship and Sustainable Development in South Africa. J. Rev. Glob. Econ. 2020, 8, 274–281. [Google Scholar] [CrossRef]
- Krueger, N.; Liñán, F.; Nabi, G. Cultural Values and Entrepreneurship; Taylor & Francis: Abingdon, UK, 2013; Volume 25, pp. 703–707. [Google Scholar]
- Pan, X.; Li, J.; Wei, J.; Yue, Y.; Liu, L. Measuring green development level at a regional scale: Framework, model, and application. Environ. Monit. Assess. 2022, 194, 1–22. [Google Scholar] [CrossRef]
- Galindo-Martín, M.-A.; Castaño-Martínez, M.-S.; Méndez-Picazo, M.-T. The relationship between green innovation, social entrepreneurship, and sustainable development. Sustainability 2020, 12, 4467. [Google Scholar] [CrossRef]
- Özbuğday, F.C.; Fındık, D.; Özcan, K.M.; Başçı, S. Resource efficiency investments and firm performance: Evidence from European SMEs. J. Clean. Prod. 2020, 252, 119824. [Google Scholar] [CrossRef]
- Méndez-Picazo, M.-T.; Galindo-Martín, M.-A.; Castano-Martínez, M.-S. Effects of sociocultural and economic factors on social entrepreneurship and sustainable development. J. Innov. Knowl. 2021, 6, 69–77. [Google Scholar] [CrossRef]
- Jin, P.; Peng, C.; Song, M. Macroeconomic uncertainty, high-level innovation, and urban green development performance in China. China Econ. Rev. 2019, 55, 1–18. [Google Scholar] [CrossRef]
- Desai, S. Measuring entrepreneurship: Type, motivation, and growth. IZA World Labor 2017. [Google Scholar] [CrossRef][Green Version]
- Jones, P.; Maas, G.; Dobson, S.; Newbery, R.; Agyapong, D.; Matlay, H. Entrepreneurship in Africa, part 2: Entrepreneurial education and eco-systems. J. Small Bus. Enterp. Dev. 2018, 25, 550–553. [Google Scholar] [CrossRef]
- Quacoe, D.; Yusheng, K.; Quacoe, D. Assessing Social Entrepreneurship in South Africa. Int. J. Econ. Bus. Manag. Stud. 2022, 9, 28–38. [Google Scholar] [CrossRef]
- Liu, X.; Lin, C.; Zhao, G.; Zhao, D. Research on the effects of entrepreneurial education and entrepreneurial self-efficacy on college students’ entrepreneurial intention. Front. Psychol. 2019, 10, 869. [Google Scholar] [CrossRef]
- Nhamo, G. Green economy readiness in South Africa: A focus on the national sphere of government. Int. J. Afr. Renaiss. Stud.-Multi-Inter-Transdiscipl. 2013, 8, 115–142. [Google Scholar] [CrossRef]
- Tawiah, V.; Zakari, A.; Adedoyin, F.F. Determinants of green growth in developed and developing countries. Environ. Sci. Pollut. Res. 2021, 28, 39227–39242. [Google Scholar] [CrossRef]
- Mikhno, I.; Koval, V.; Shvets, G.; Garmatiuk, O.; Tamošiūnienė, R. Green economy in sustainable development and improvement of resource efficiency. Cent. Eur. Bus. Rev. (CEBR) 2021, 10, 99–113. [Google Scholar] [CrossRef]
- Wen, X.; Quacoe, D.; Quacoe, D.; Appiah, K.; Ada Danso, B. Analysis on bioeconomy’s contribution to GDP: Evidence from Japan. Sustainability 2019, 11, 712. [Google Scholar] [CrossRef]
- OECD. Available online: https://www.oecd.org/greengrowth/whatisgreengrowthandhowcanithelpdeliversustainabledevelopment.htm (accessed on 29 September 2022).
- Adamowicz, M. Green Deal, Green Growth and Green Economy as a Means of Support for Attaining the Sustainable Development Goals. Sustainability 2022, 14, 5901. [Google Scholar] [CrossRef]
- Hassan, A.; Elamer, A.A.; Fletcher, M.; Sobhan, N. Voluntary assurance of sustainability reporting: Evidence from an emerging economy. Account. Res. J. 2020, 33, 391–410. [Google Scholar] [CrossRef]
- Lyytimäki, J. Renewable energy in the news: Environmental, economic, policy and technology discussion of biogas. Sustain. Prod. Consum. 2018, 15, 65–73. [Google Scholar] [CrossRef]
- Moran, D.D.; Wackernagel, M.; Kitzes, J.A.; Goldfinger, S.H.; Boutaud, A. Measuring sustainable development—Nation by nation. Ecol. Econ. 2008, 64, 470–474. [Google Scholar] [CrossRef]
- Mishra, P.; Pandey, C.M.; Singh, U.; Gupta, A.; Sahu, C.; Keshri, A. Descriptive statistics and normality tests for statistical data. Ann. Card. Anaesth. 2019, 22, 67. [Google Scholar]
- Bockarova, M. Does one truly need to belong?: A case for the need to meaningfully exist. Semiotica 2016, 2016, 251–257. [Google Scholar] [CrossRef]
- King, A.P.; Eckersley, R.J. Chapter 2—Descriptive Statistics II: Bivariate and Multivariate Statistics. In Statistics for Biomedical Engineers and Scientists; King, A.P., Eckersley, R.J., Eds.; Academic Press: Cambridge, MA, USA, 2019; pp. 23–56. [Google Scholar]
- Weide, A.C.; Beauducel, A. Varimax rotation based on gradient projection is a feasible alternative to SPSS. Front. Psychol. 2019, 10, 645. [Google Scholar] [CrossRef]
- Singh, N.; Nyuur, R.; Richmond, B. Renewable energy development as a driver of economic growth: Evidence from multivariate panel data analysis. Sustainability 2019, 11, 2418. [Google Scholar] [CrossRef]
- Apergis, N.; Danuletiu, D.C. Renewable energy and economic growth: Evidence from the sign of panel long-run causality. Int. J. Energy Econ. Policy 2014, 4, 578–587. [Google Scholar]
- Boamah, K.B.; Du, J.; Bediako, I.A.; Boamah, A.J.; Abdul-Rasheed, A.A.; Owusu, S.M. Carbon dioxide emission and economic growth of China—The role of international trade. Environ. Sci. Pollut. Res. 2017, 24, 13049–13067. [Google Scholar] [CrossRef] [PubMed]
- Quacoe, D.; Wen, X.; Quacoe, D. Nexus among biomass consumption, economic growth, and CO2 emission based on the moderating role of biotechnology: Evidence from China. Environ. Sci. Pollut. Res. 2021, 28, 15755–15767. [Google Scholar] [CrossRef]
- Global Forest Watch. Available online: https://www.globalforestwatch.org/dashboards/country/ZAF/? (accessed on 17 September 2022).
- Curtis, P.G.; Slay, C.M.; Harris, N.L.; Tyukavina, A.; Hansen, M.C. Classifying drivers of global forest loss. Science 2018, 361, 1108–1111. [Google Scholar] [CrossRef] [PubMed]
- Baumgartner, R.J. Sustainable development goals and the forest sector—A complex relationship. Forests 2019, 10, 152. [Google Scholar] [CrossRef]
- SoCalGas. Natural Gas Is Good for the Economy. Available online: https://www.socalgas.com/sustainability/benefits-of-natural-gas/economy (accessed on 15 November 2022).
- MetGroup. Natural Gas Environmental Impact: Problems and Benefits; MetGroup: Zug, Switzerland, 2020. [Google Scholar]
- Bildirici, M.E.; Bakirtas, T. The relationship among oil, natural gas and coal consumption and economic growth in BRICTS (Brazil, Russian, India, China, Turkey and South Africa) countries. Energy 2014, 65, 134–144. [Google Scholar] [CrossRef]
- Sasana, H.; Ghozali, I. The impact of fossil and renewable energy consumption on the economic growth in Brazil, Russia, India, China and South Africa. Int. J. Energy Econ. Policy 2017, 7, 194–200. [Google Scholar]
- Korkmaz, Ö. Do oil, coal, and natural gas consumption and rents impact economic growth? An empirical analysis of the Russian Federation. Resour. Policy 2022, 77, 102739. [Google Scholar] [CrossRef]
- Mustafa, F.; Khursheed, A.; Fatima, M.; Rao, M. Exploring the impact of COVID-19 pandemic on women entrepreneurs in Pakistan. Int. J. Gend. Entrep. 2021, 13, 187–203. [Google Scholar] [CrossRef]
- Koe, W.-L. The relationship between Individual Entrepreneurial Orientation (IEO) and entrepreneurial intention. J. Glob. Entrep. Res. 2016, 6, 1–11. [Google Scholar] [CrossRef]
- Cacciotti, G.; Hayton, J.C.; Mitchell, J.R.; Allen, D.G. Entrepreneurial fear of failure: Scale development and validation. J. Bus. Ventur. 2020, 35, 106041. [Google Scholar] [CrossRef]
- Angulo-Guerrero, M.J.; Pérez-Moreno, S.; Abad-Guerrero, I.M. How economic freedom affects opportunity and necessity entrepreneurship in the OECD countries. J. Bus. Res. 2017, 73, 30–37. [Google Scholar] [CrossRef]
- Fuentelsaz, L.; González, C.; Maícas, J.P.; Montero, J. How different formal institutions affect opportunity and necessity entrepreneurship. BRQ Bus. Res. Q. 2015, 18, 246–258. [Google Scholar] [CrossRef]
- Sethy, S.K.; Sahoo, H. Investigating the relationship between population and economic growth: An analytical study of India. Indian J. Econ. Bus. 2015. Available online: https://ssrn.com/abstract=2759165 (accessed on 17 September 2022).
- Tumwebaze, H.K.; Ijjo, A.T. Regional economic integration and economic growth in the COMESA region, 1980–2010. Afr. Dev. Rev. 2015, 27, 67–77. [Google Scholar] [CrossRef]
- Peterson, E.W.F. The role of population in economic growth. Sage Open 2017, 7, 2158244017736094. [Google Scholar] [CrossRef]
- Mačiulytė-Šniukienė, A.; Sekhniashvili, D. The eco-innovation impact on economic and environmental performance of EU Member States. Bus. Manag. Econ. Eng. 2021, 19, 212–228. [Google Scholar] [CrossRef]
- Bhuiyan, M.A.; Dinçer, H.; Yüksel, S.; Mikhaylov, A.; Danish, M.S.S.; Pinter, G.; Uyeh, D.D.; Stepanova, D. Economic indicators and bioenergy supply in developed economies: QROF-DEMATEL and random forest models. Energy Rep. 2022, 8, 561–570. [Google Scholar] [CrossRef]
- Pettinger, T. Economic Effect of a Devaluation of the Currency. 2021. Available online: https://economicshelp.org/macroeconomics/exchangerate/effects-devaluation/ (accessed on 17 September 2022).
- Woo, T. Available online: https://www.ics.uci.edu/~wmt/courses/ICS5_W13/SouthAfrica.html (accessed on 17 September 2022).
- Wang, H.; Wang, X.; Zhang, X.; Liu, G.; Chen, W.-Q.; Chen, S.; Du, T.; Shi, L. The coupling between material footprint and economic growth in the “Belt and Road” countries. J. Clean. Prod. 2022, 359, 132110. [Google Scholar] [CrossRef]
- Deviren, S.A.; Deviren, B. The relationship between carbon dioxide emission and economic growth: Hierarchical structure methods. Phys. A Stat. Mech. Its Appl. 2016, 451, 429–439. [Google Scholar] [CrossRef]
- Ansari, M.A.; Haider, S.; Khan, N. Environmental Kuznets curve revisited: An analysis using ecological and material footprint. Ecol. Indic. 2020, 115, 106416. [Google Scholar] [CrossRef]
- Bowmaker-Falconeer and Natanya Meyer. Fostering Entrepreneurial Ecosytem Vitality. Available online: https://www.gemconsortium.org/news/new-gem-south-africa-national-report%3A-early-stage-entrepreneurs-are-growing-into-established-businesses (accessed on 31 October 2022).
- Eggoh, J.; Houeninvo, H.; Sossou, G.-A. Education, health and economic growth in African countries. J. Econ. Dev. 2015, 40, 93. [Google Scholar] [CrossRef]
- Zaratin, P.; Bertorello, D.; Guglielmino, R.; Devigili, D.; Brichetto, G.; Tageo, V.; Dati, G.; Kramer, S.; Battaglia, M.A.; Di Luca, M. The MULTI-ACT model: The path forward for participatory and anticipatory governance in health research and care. Health Res. Policy Syst. 2022, 20, 1–9. [Google Scholar] [CrossRef] [PubMed]
- Fox, J. Applied Regression Analysis and Generalized Linear Models; Sage Publications: Thousand Oaks, CA, USA, 2015. [Google Scholar]
Disclaimer/Publisher’s Note: The statements, opinions and data contained in all publications are solely those of the individual author(s) and contributor(s) and not of MDPI and/or the editor(s). MDPI and/or the editor(s) disclaim responsibility for any injury to people or property resulting from any ideas, methods, instructions or products referred to in the content. |
© 2023 by the authors. Licensee MDPI, Basel, Switzerland. This article is an open access article distributed under the terms and conditions of the Creative Commons Attribution (CC BY) license (https://creativecommons.org/licenses/by/4.0/).