Article

Spatio-Temporal Evolution of City Resilience in the Yangtze River Delta, China, from the Perspective of Statistics

1
School of Business, Suzhou University of Science and Technology, Suzhou 215009, China
2
College of Management and Economics, Tianjin University, Tianjin 300072, China
*
Author to whom correspondence should be addressed.
Sustainability 2023, 15(2), 1538; https://doi.org/10.3390/su15021538
Submission received: 11 November 2022 / Revised: 3 January 2023 / Accepted: 3 January 2023 / Published: 13 January 2023

Abstract

:
The development of resilient cities has become a critical global issue with respect to the stimulation of sustainable economic, social, and ecological advancement. The Yangtze River Delta region, which is the most densely populated region in China, is undergoing the fastest urbanization and is achieving the highest level of economic development in the country. Thus, it is of great theoretical and practical significance to study the evolution of spatiotemporal city resilience in this region. For this study, the resilience of 41 core cities in the Yangtze River Delta in China from 2010 to 2020 was evaluated through a combination of game weighting and fuzzy matter-element analysis. Subsequently, the spatiotemporal differences in city resilience were revealed via the Dagum Gini coefficient and the Kernel density model. Further, the driving factors of city resilience were analyzed by a geographic detector model. The results revealed the following: (1) The resilience of the cities under study experienced a gradual upward trend (with Shanghai being consistently in the lead) and significant differences occurred between them. (2) The Dagum Gini coefficient indicated that the resilience of cities in the western portion of the Yangtze River Delta was quite diverse. This phenomenon was primarily due to the differences between sub-regions, for which the differences between the southeast and northwest were the most prominent. (3) The Kernel density indicated the absolute differences across the entire Delta as well as the northern sub-region, and there was a significant polarization phenomenon in the southern and western sub-regions. (4) Driving factor analysis revealed that the driving force of the income levels of residents was stronger and more stable, the driving force of economic development level was weakened, and the driving force of medical and health conditions, the degree of openness, and energy utilization efficiencies were strengthened. Overall, the driving factors of city resilience became more diversified and complex. Consequently, the Yangtze River Delta needs to improve city resilience levels in the northwest region in order to promote its balanced development. Our results suggested that more attention should be allocated to the improvement of the livelihoods of urban residents, the adjustment of energy consumption structures, and the optimization of the provision of medical resources.

1. Introduction

Global urbanization is one of the most transformational trends in the 21st century [1]. According to the World Risk Report 2020, risks to nature, economy, society, and ecology seriously threaten the healthy development of cities [2]. The 100 Resilient Cities, United Nations 2030 Sustainable Development Goals (SDGs), and New Urban Agenda programs are strongly focused on global environmental change and sustainable urban development [3]. “Safety, inclusiveness, plasticity and resilience” are listed as the core goals of sustainable urban development. Traditional urban risk management emphasizes the prevention and mitigation of major emergencies; compared to the traditional urban disaster mitigation approach, resilient cities focus more on the organizational capacity and coordination within the urban systems [4]. As a new concept for urban risk management, city resilience focuses on improving the capacity of urban systems to organize themselves, coordinate their functions, and adapt to uncertainties. It sets its focus on the plasticity of natural and anthropogenic factors and pursues the sustainable development of human and ecological systems [5]. At present, China is making great strides toward the development of regional spatial development layouts based on urban agglomeration and its integration. Agglomeration development closely integrates internal connections, as well as resource and benefit sharing between cities, which also encompasses risk sharing. Consequently, with the deepening integration of urban agglomeration, risk spillover frequently occurs. The associated risks inherent to spatial agglomeration patterns and the development of urban agglomeration are amplified. Thus, the development of resilience with respect to urban agglomeration should also become an important research topic [6]. This study focuses primarily on the reduction of risks associated with urban agglomeration and how its resilience might be enhanced. As the Yangtze River Delta Urban agglomeration is one of the three major urban agglomerations in China, we endeavored to identify various resilience improvement strategies for this region via an analysis of the measured temporal and spatial evolution characteristics and their driving factors.
Resilience derives from the Latin word “resilio”, which originally meant to “return to original condition” [7]. The concept of resilience originated in physics, was introduced into ecology, and was then extended to engineering and socio-economic studies. [8]. In terms of theory, Canadian ecologist Holling proposed the “hierarchy, chaos, adaptive cycle” theory [9], which comprehensively explained the connotations of sustainable development, thus breaking linear thinking and thought related to steady-state balance as well as realizing the breakthrough of cross-scale dynamic interactive cycles and system innovations. This laid the ideological foundations for city resilience theory. In 2002, the International Council for Sustainable Regional Development (ICLEI) initially proposed the concept of a “resilient city” and established it as a critical aspect of cities and disaster prevention, which set off a wave of research concerning city resilience. In 2005, the Second World Conference on Disaster Reduction included “resilience” as a focus of disaster discussions, wherein the preparedness for and prevention, mitigation, and reduction of urban vulnerability were included in the related sustainable development policies [10]. The early attention paid to city resilience only focused on disaster risk management. However, with the intensifying focus from different disciplines on city resilience, its connotations have gradually evolved from diversified and interdisciplinary perspectives to encompass economics, sociology, geography, urban planning, etc. Consequently, city resilience has been enriched and embodied as urban economic [11], social [12], institutional [13], ecological [14], and infrastructure resilience [15].
As a bridge between theory and practice, the assessment of city resilience evaluates the self-control, self-organization, and self-adaptation capacities of urban systems based on SESs and CAS theory. At present, these assessments set their focus on three different levels: the community [16], city [17], and region [18]. The evaluation procedures for city resilience include a comprehensive index evaluation, a remote-sensing model, resilience network evaluation, a function model, a threshold method, the resilience maturity model (RMM), scenario analysis, the graph-stacking method, etc. The highly recognized city resilience evaluation index system encompasses five dimensions: ecological, economic, social, institutional, and facility [19,20]. However, it should be noted that the development of city resilience cannot be achieved without the function of humanistic systems. A city’s cultural space is an important place for residents to spread knowledge and culture and serves as an important window for the construction of spiritual civilization. It has great potential in improving the resilience literacy of urban residents, building resilient communities, and shaping urban resilience culture. Although there are few studies on cultural Resilience at present, there are some explorations, such as Athens City Resilience Through Culture [21]. Therefore, this paper endeavors to introduce cultural indicators in order to improve the interpretability and application value of city resilience evaluation results.
The Yangtze River Delta is one of the three major urban agglomerations in China and one of six major urban agglomerations worldwide. In conjunction with improvements in regional economic development and urbanization levels, population density is growing and cities face increasing risks. Thus, improvements in the resilience thresholds of cities in the Yangtze River Delta region have practical significance. Considering that there are many cities in the Yangtze River Delta region, which spans three provinces and one large municipality, there are differences between these provinces and cities in terms of regional conditions, resource endowments, and economic and social development levels, which translate to spatiotemporal heterogeneity in city resilience. Consequently, it is essential to analyze regional differences and reveal the driving factors behind them. From the perspective of regional difference analysis, the spatial and temporal characteristics of resilience within a city are the main focus of the current study, as there are relatively few studies on regional differences. Furthermore, compared with the Theil Index, which measures inequality and difference based on the concepts of information content and entropy, Dagum Gini coefficient decomposition can more accurately identify the sources of regional disparities. At the same time, the Dagum Gini coefficient considers the distribution of subsamples and cross-overlap between samples, and its conclusions are more accurate. [22]. To effectively overcome the shortcomings of the existing research strategies, this investigation employed the Dagum Gini coefficient to calculate the relative differences between—and sources of—city resilience levels in the Yangtze River Delta. This was combined with the kernel density estimation method to explore the absolute differences and evolutionary trends of city resilience levels. In terms of the driving factors, the existing research has focused mainly on the resilience of obstacle factor diagnosis at the city level [23] or the analysis of influencing factors [24]. However, the obstacle degree model cannot reveal internal driving factors, whereas the spatial regression model has certain applicability. Therefore, with the aid of a geographical probe model, this study determined the causes of spatial heterogeneity from the perspective of the spatial differentiation of city resilience in the Yangtze River Delta region. This study evaluated the resilience of 41 core cities in the Yangtze River Delta in China from 2010 to 2020 using a combination of game weighting and fuzzy matter-element analysis. Subsequently, the spatiotemporal differences in city resilience were revealed using the Dagum Gini coefficient and the Kernel density model, after which the driving factors of city resilience were analyzed via a geographic detector model.

2. Methods and Data Collection

2.1. Study Area

The Yangtze River Delta region (Figure 1), with 41 core cities including the Shanghai, Jiangsu, Zhejiang, and Anhui Provinces, is one of the most open, economically active, and innovative regions in China. In November 2018, the integrated development of the Yangtze River Delta region was elevated to a national strategy. In 2021, the permanent population of the Yangtze River Delta reached 236 million, and its regional GDP accounted for about 24.1% of the national total. However, issues such as serious environmental pollution, high carbon emissions, and intensified social risks in this area remain significant. Improving the resilience of cities is a key pathway to regional sustainable development.

2.2. City Resilience Assessments

2.2.1. Evaluation Index System of City Resilience

Existing studies develop index systems primarily from the four aspects of economy, society, ecology, and infrastructure [19,20], but neglect to add the cultural dimension. Therefore, this study incorporates the cultural dimension into the existing four-dimension index system to determine the significance of cultural resilience to city resilience. The selected indicators are shown in Table 1, among which economic indicators reflect economic levels, structure, vitality, and efficiency, whereas social indicators reflect population pressure, social employment, social management, talent bases, social health care, residents’ living standards, etc. Ecological indicators reflect environmental governance, ecological protection, and greening construction, while infrastructure- (engineering) level indicators reflect urban roads, transportation, communication, and basic water use. Finally, cultural indicators reflect investments in cultural education and the acquisition of knowledge. We draw a research framework as shown in Figure 2.

2.2.2. Comprehensive Weighting Method Based on Game Theory

The game combination weighting method was conceptualized to achieve Nash equilibrium; adjust the conflicts between different weights caused by different weight determination methods; and coordinate the subjective and objective weighting results, which is widely used in weight determination [25]. For this study, the subjective weighting method employed was the relatively common analytic hierarchy process (AHP). AHP is a comprehensive evaluation method proposed by American mathematician Satty T L in the 1980s [26]. The principle of this method is to divide all elements related to a given decision into several levels, and then use qualitative and quantitative analysis to obtain the weight of each level. The objective weighting method employs the entropy weighting method, which is widely used. Its basic principle is to assign values according to the variation degree of indicators. The smaller the variation degree is, the lower the weight will be, and vice versa [27]. Since the subjective weighting method is overly reliant on expert opinions and the objective weighting method is overly reliant on quantitative analysis of mathematics, this paper adopts a combination of subjective and objective weighting. In order to realize the scientific combination of the two, this paper selects the game combination weighting method, which uses concepts in game theory to coordinate the conflict between subjective weight and objective weight and seeks balance between the two, accounting for both subjectivity and objectivity so as to realize the scientific combination of subjective weight and objective weight. The specific calculation steps are provided in the following lines.
First, the subjective and objective weights were calculated as follows: the weights determined by the analytic hierarchy process are denoted as W 1 = ( a 1 , a 2 , a n ) T ; the weight determined by the entropy method is denoted as W 2 = ( b 1 , b 2 , b n ) T ; and n is the number of second-level indicators.
Second, the basic weight set was developed: W = ( W 1 , W 2 ) . Then, these weight vectors were combined linearly
W = k = 1 2 α k W k T ,   α k > 0
where α k is a linear combination coefficient.
Third, the linear combination coefficients were optimized.
min = j = 1 2 α j W j T W i T 2 , i = 1 , 2
According to the differential matrix properties [28], the optimal first derivative conditions of Equation (2) were as follows:
j = 1 2 α j W i W j T = W i W j T
Equation (3) was expressed as the following system of linear equations:
( W 1 W 1 T W 1 W 2 T W 2 W 1 T W 2 W 2 T ) ( α 1 α 2 ) = ( W 1 W 1 T W 2 W 2 T )
Fourth, the coefficient was obtained by normalization.
α k * = α k k = 1 2 α k
Fifth, the portfolio weight was calculated.
W * = k = 1 2 α k * W k T

2.2.3. Evaluation of City Resilience Based on Fuzzy Matter-Element Analysis

Fuzzy matter-element analysis is typically used to solve incompatibility problems and is widely employed in the field of comprehensive evaluation [29]. The specific steps are as follows.
First, construct the fuzzy matter element.
The fuzzy matter element of urban toughness is denoted by R = (M, C, X), where M represents the evaluation object of the resilient city, C represents the feature of the city to be evaluated, and X represents the feature value of the city to be evaluated.
R mn = ( M , C , X ) = M 1 M 2 M m c 1 c 2 c n [ X 11 X 21 X m 1 X 12 X 22 X m 2 X 1 n X 2 n X m n ]
Second, the degree of preferential membership is calculated.
Positive indicators:
μ m n = X m n / max ( X m n )
Negative indicators:
μ m n = min ( X m n ) / X m n
X m n represents the quantity value corresponding to the n th index of the m th city. max ( X m n ) and min ( X m n ) are the maximum and minimum values of all quantity values X m n of each feature, respectively.
The preferred membership matrix is
R mn = M 1 M 2 M m c 1 c 2 c n [ μ 11 μ 21 μ m 1 μ 12 μ 22 μ m 2 μ 1 n μ 2 n μ m n ]
Thirdly, the difference square fuzzy compound fuzzy matter element is established.
R Δ = M 1 M 2 M m c 1 c 2 c n [ Δ 11 Δ 21 Δ m 1 Δ 12 Δ 22 Δ m 2 Δ 1 n Δ 2 n Δ m n ]
Δ i j = ( μ o j μ i j ) , where μ 0 j is the maximum value of the superior membership degree of each evaluation index.
Fourth, the level of city resilience is calculated:
θ i = 1 j = 1 n w j Δ i j
where w j is the combined weight of J index in Equation (6).

2.3. Spatiotemporal Differences Analysis

The Dagum Gini coefficient decomposition method, which is widely employed for the study of regional differences, was used to measure the regional differences between city resilience levels in the Yangtze River Delta [30].
The overall Gini coefficient is:
G = j = 1 k h = 1 k i = 1 n j r = 1 n k | y j i y h r | 2 n y
where y j i ( y h r ) represents the resilience levels of cities in the region j ( h ) ; y represents the average resilience levels across all cities; n is the number of cities; k is the number of areas divided; and n j ( n h ) is the number of cities in the area j ( h ) . Prior to the decomposition of the Gini coefficient, the regions were ranked according to the average of the resilience level of the city: y h y j y k . The Gini coefficient, G, can be broken down into three parts: G = G w + G n b + G t , where G w is the difference contribution within a region, G n b is the difference contribution rate between regions, and G t is the contribution of super-variable density. The calculation formulae are (15), (17), and (18).
G j j = 1 2 y j n j 2 i = 1 n j r = 1 n j | y j i y j r |
G w = j = 1 k G j j p j s j
G j h = i = 1 n j r = 1 n h | y j i y h r | n j n h ( y j + y h )
G n b = j = 2 k h = 1 j 1 G j h ( p j s h + p h s j ) D j h
G t = j = 2 k h = 1 j 1 G j h ( p j s h + p h s j ) ( 1 D j h )
Equation (14) represents the Gini coefficient of region j, and Equation (16) represents the Gini coefficient between region j and h, p j = n j / n , s j = n j y j / n y j , j = 1 , 2 , 3 k .
D j h = d j h p j h d j h + p j h
d j h = 0 d F j ( y ) 0 y ( y x ) d F h ( x )
p j h = 0 d F h ( y ) 0 y ( y x ) d F j ( y )
In Equation (19), D j h represents the relative influence of city resilience levels in regions j and h. In Equation (20), d j h represents the difference in city resilience levels between regions, namely, the mathematical expectation of the sum of all y j i y n r > 0 sample values between regions j and h. In Equation (21), p j h represents the supervariable first moment, that is, the mathematical expectation of the sum of all sample values of y h r y j i > 0 between regions j and h, and F j ( F h ) is the cumulative distribution density function of region j ( h ) .

2.4. Kernel Density Estimation

Since the Dagum Gini coefficient can only reflect the relative differences in resilience levels of the Yangtze River Delta urban agglomeration, this study used kernel density estimation to reflect the relative differences and dynamic evolution trends of the study areas [31].
The density function f ( y ) of the random variable X may be calculated as follows:
f ( y ) = 1 N l i = 1 N K ( y i y l )
where N is the total number of cities; y i is the level of city resilience; l is the bandwidth (where the smaller the broadband, the higher the accuracy of the estimation); and K is the kernel function (which may be expressed in many forms). For this study, the widely used Gaussian kernel function was selected to study the absolute difference and evolutionary toughness trend levels for the entire Yangtze River Delta and its four major regions. The calculation formula applied is as follows:
K ( x ) = 1 2 π exp ( x 2 2 )

2.5. Driving Factor Analysis

Geodetector is a statistical analysis method developed by Wang et al. (2017) that explores the spatial heterogeneity of various entities and reveals the driving forces behind them [32]. The calculation of the factor detector principle is as follows:
q = 1 h = 1 L N h σ h 2 N σ 2
In Equation (24), h is the number of layers ( h = 1 , 2 L ); L is the number of layers, N h is the number of h; N is the number of cities; σ h 2 and σ 2 are the variance of layer h and global Y value, respectively; q represents the driving force; and the range is (0,1). The larger the value, the greater the impact of the corresponding factor on the level of city resilience.

2.6. Data Collection

The regional scope of the data in this study included Shanghai and prefecture-level cities in Jiangsu, Zhejiang, and Anhui Provinces from 2010 to 2020. The data were mainly obtained from the statistical yearbooks (2011 to 2021) of Shanghai; 13 cities in Jiangsu Province, Zhejiang Province, and its 11 cities; Anhui Province and its 16 cities; and the 2010–2020 cities for national economic and social development statistical bulletin, from the urban statistical yearbook of China “and” urban construction statistics in China Guide. The per capita data used in this paper were calculated based on the local resident population at the end of the year. Further, because some data were missing, we applied the average annual growth rate to interpolate them.

3. Results

3.1. Spatiotemporal Distribution of City Resilience in the Yangtze River Delta

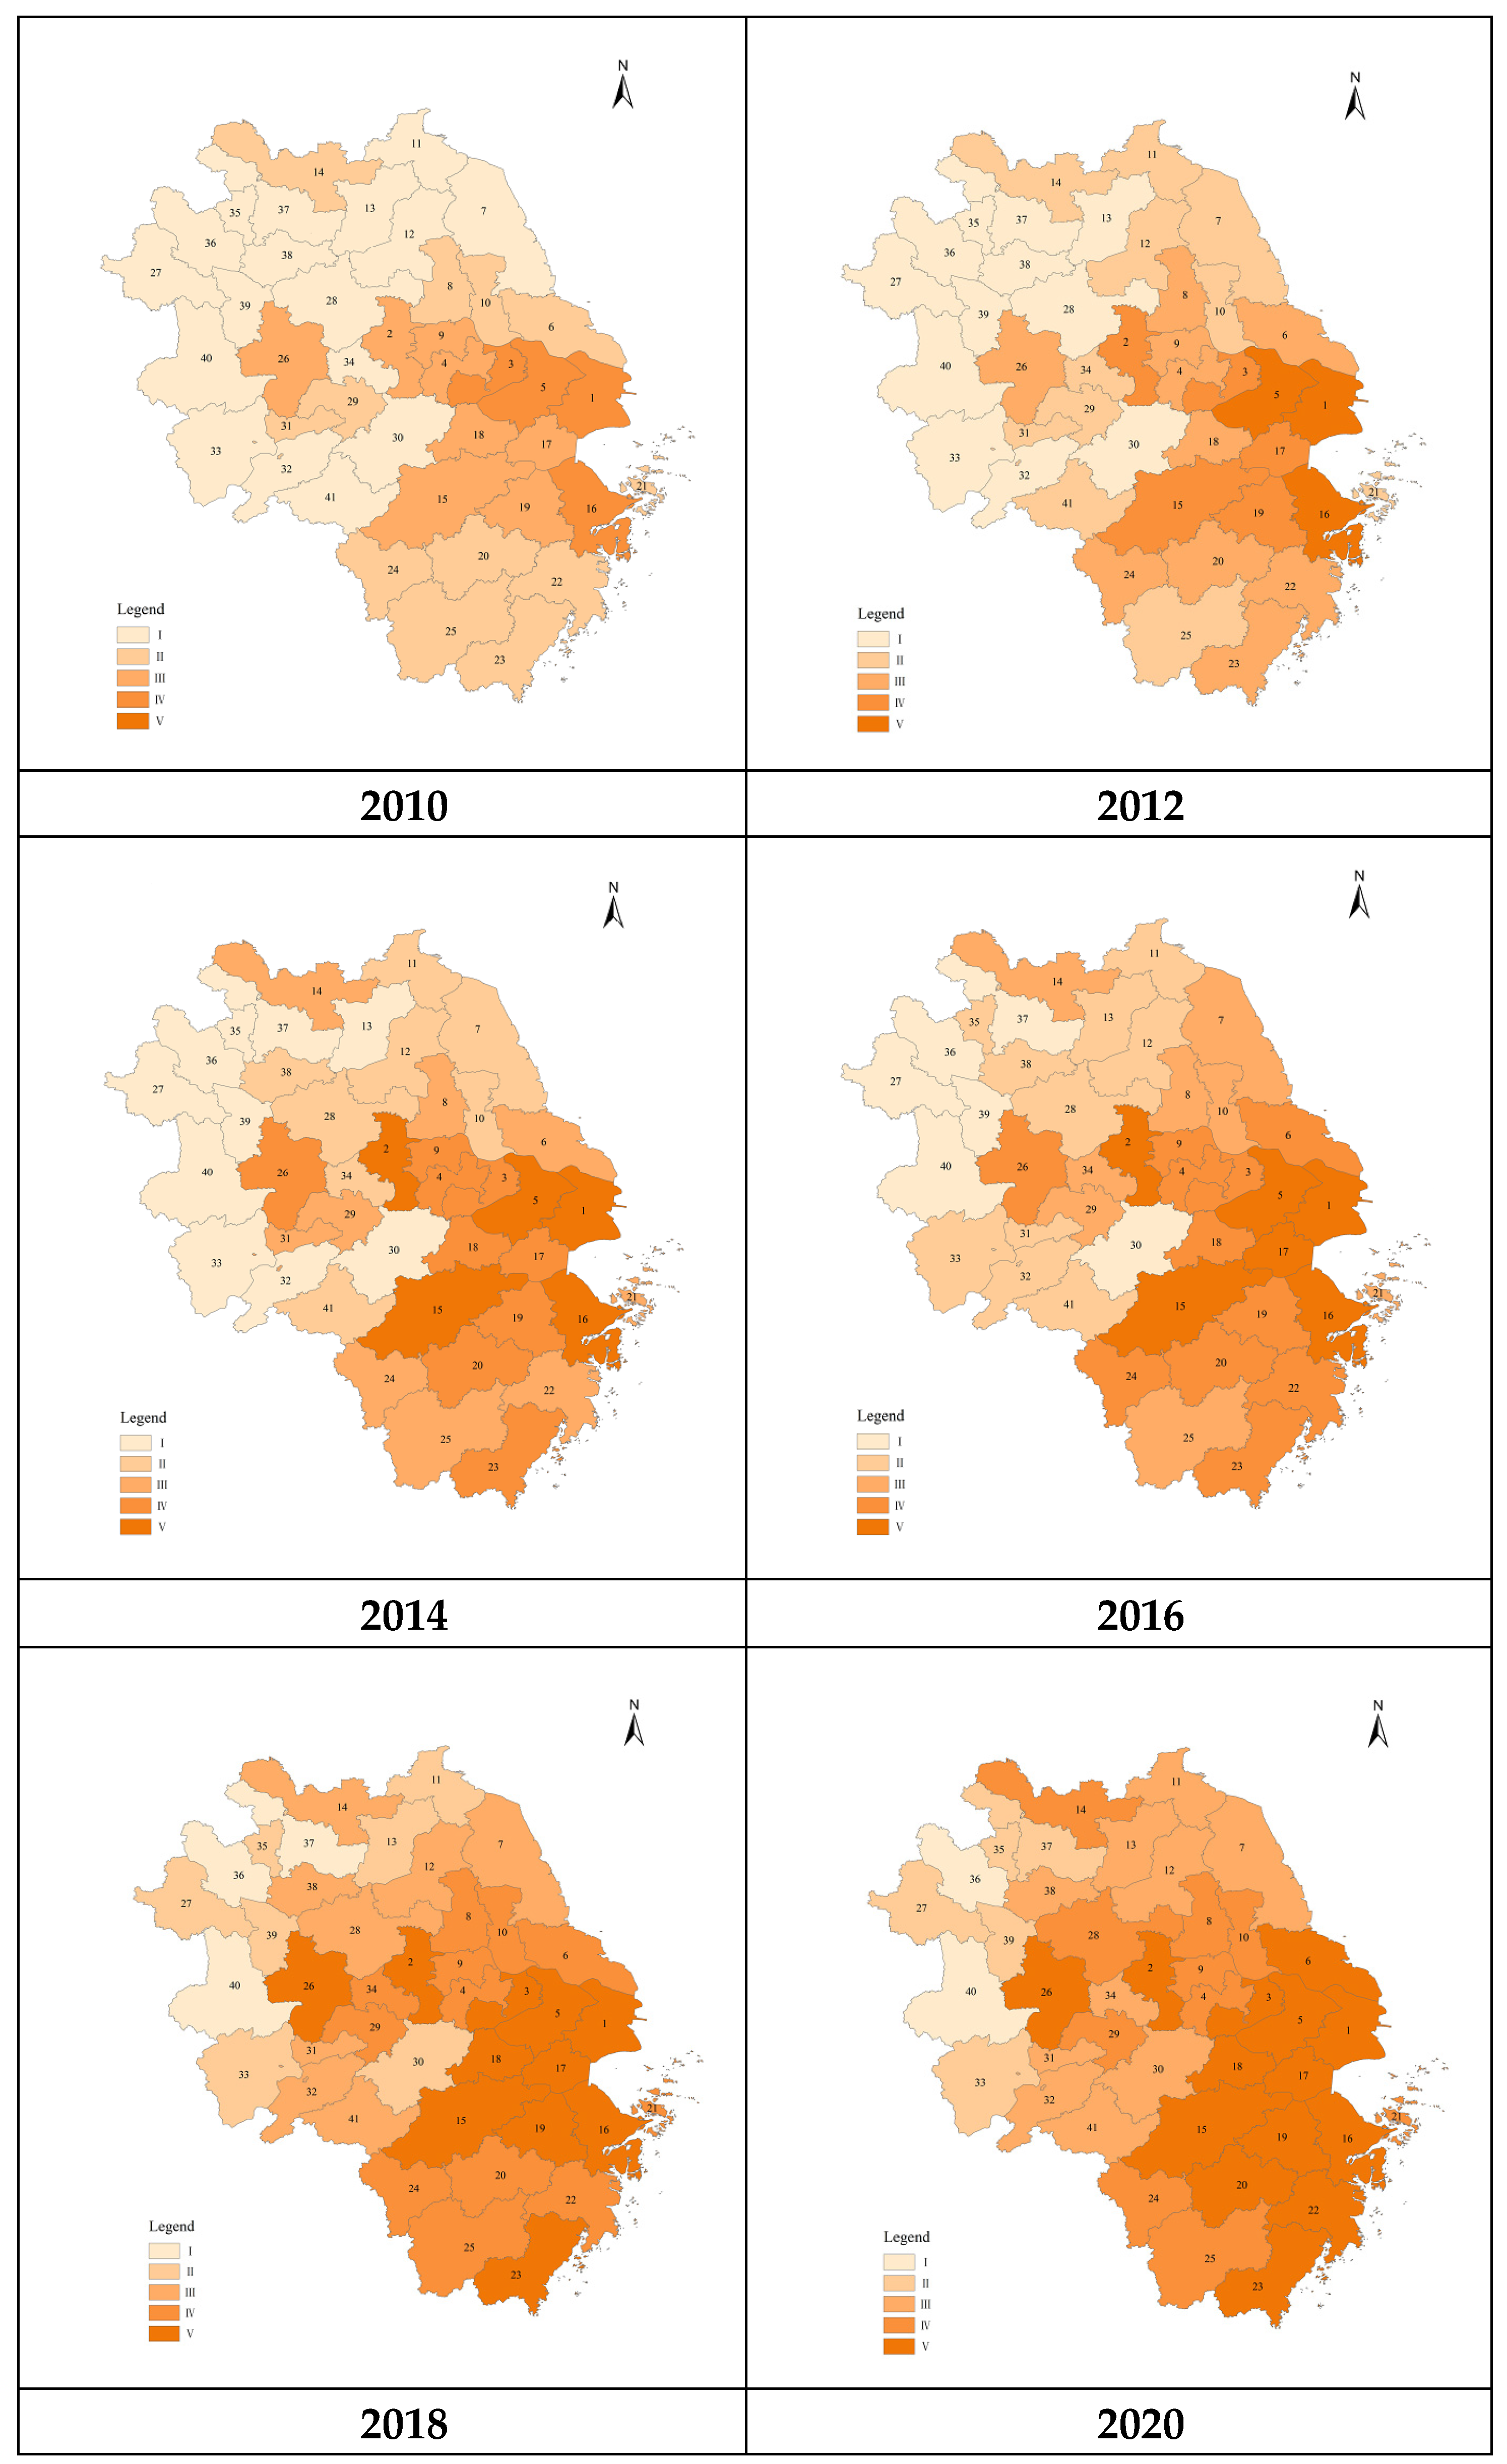
The natural discontinuity grading method (Jenks) was used to grade the data. In order to ensure the rationality of the grading level, the urban resilience level of the Yangtze River Delta region was divided into the following five levels based on the measurement results of the urban resilience level of the intermediate year 2015: Ⅰ(θ < 0.258); Ⅱ(0.258 ≤ θ < 0.295); Ⅲ(0.295 ≤ θ < 0.337); Ⅳ(0.337 ≤ θ < 0.395); and Ⅴ(θ ≥ 0.395). The resilience of the cities under study experienced a slow upward trend, with Shanghai consistently being in the lead (Figure 3). Significant differences occurred between cities, for which Ningbo, Hangzhou, Nanjing, and Suzhou exhibited high levels. Moreover, due to the impacts of the COVID-19 pandemic, the overall improvement of city resilience in the Yangtze River Delta slowed significantly in 2020. Table 2 shows our interpretation of the number in Figure 3.

3.2. Spatiotemporal Difference Analysis of City Resilience in the Yangtze River Delta

3.2.1. Dagum Gini Coefficient of City Resilience in the Yangtze River Delta

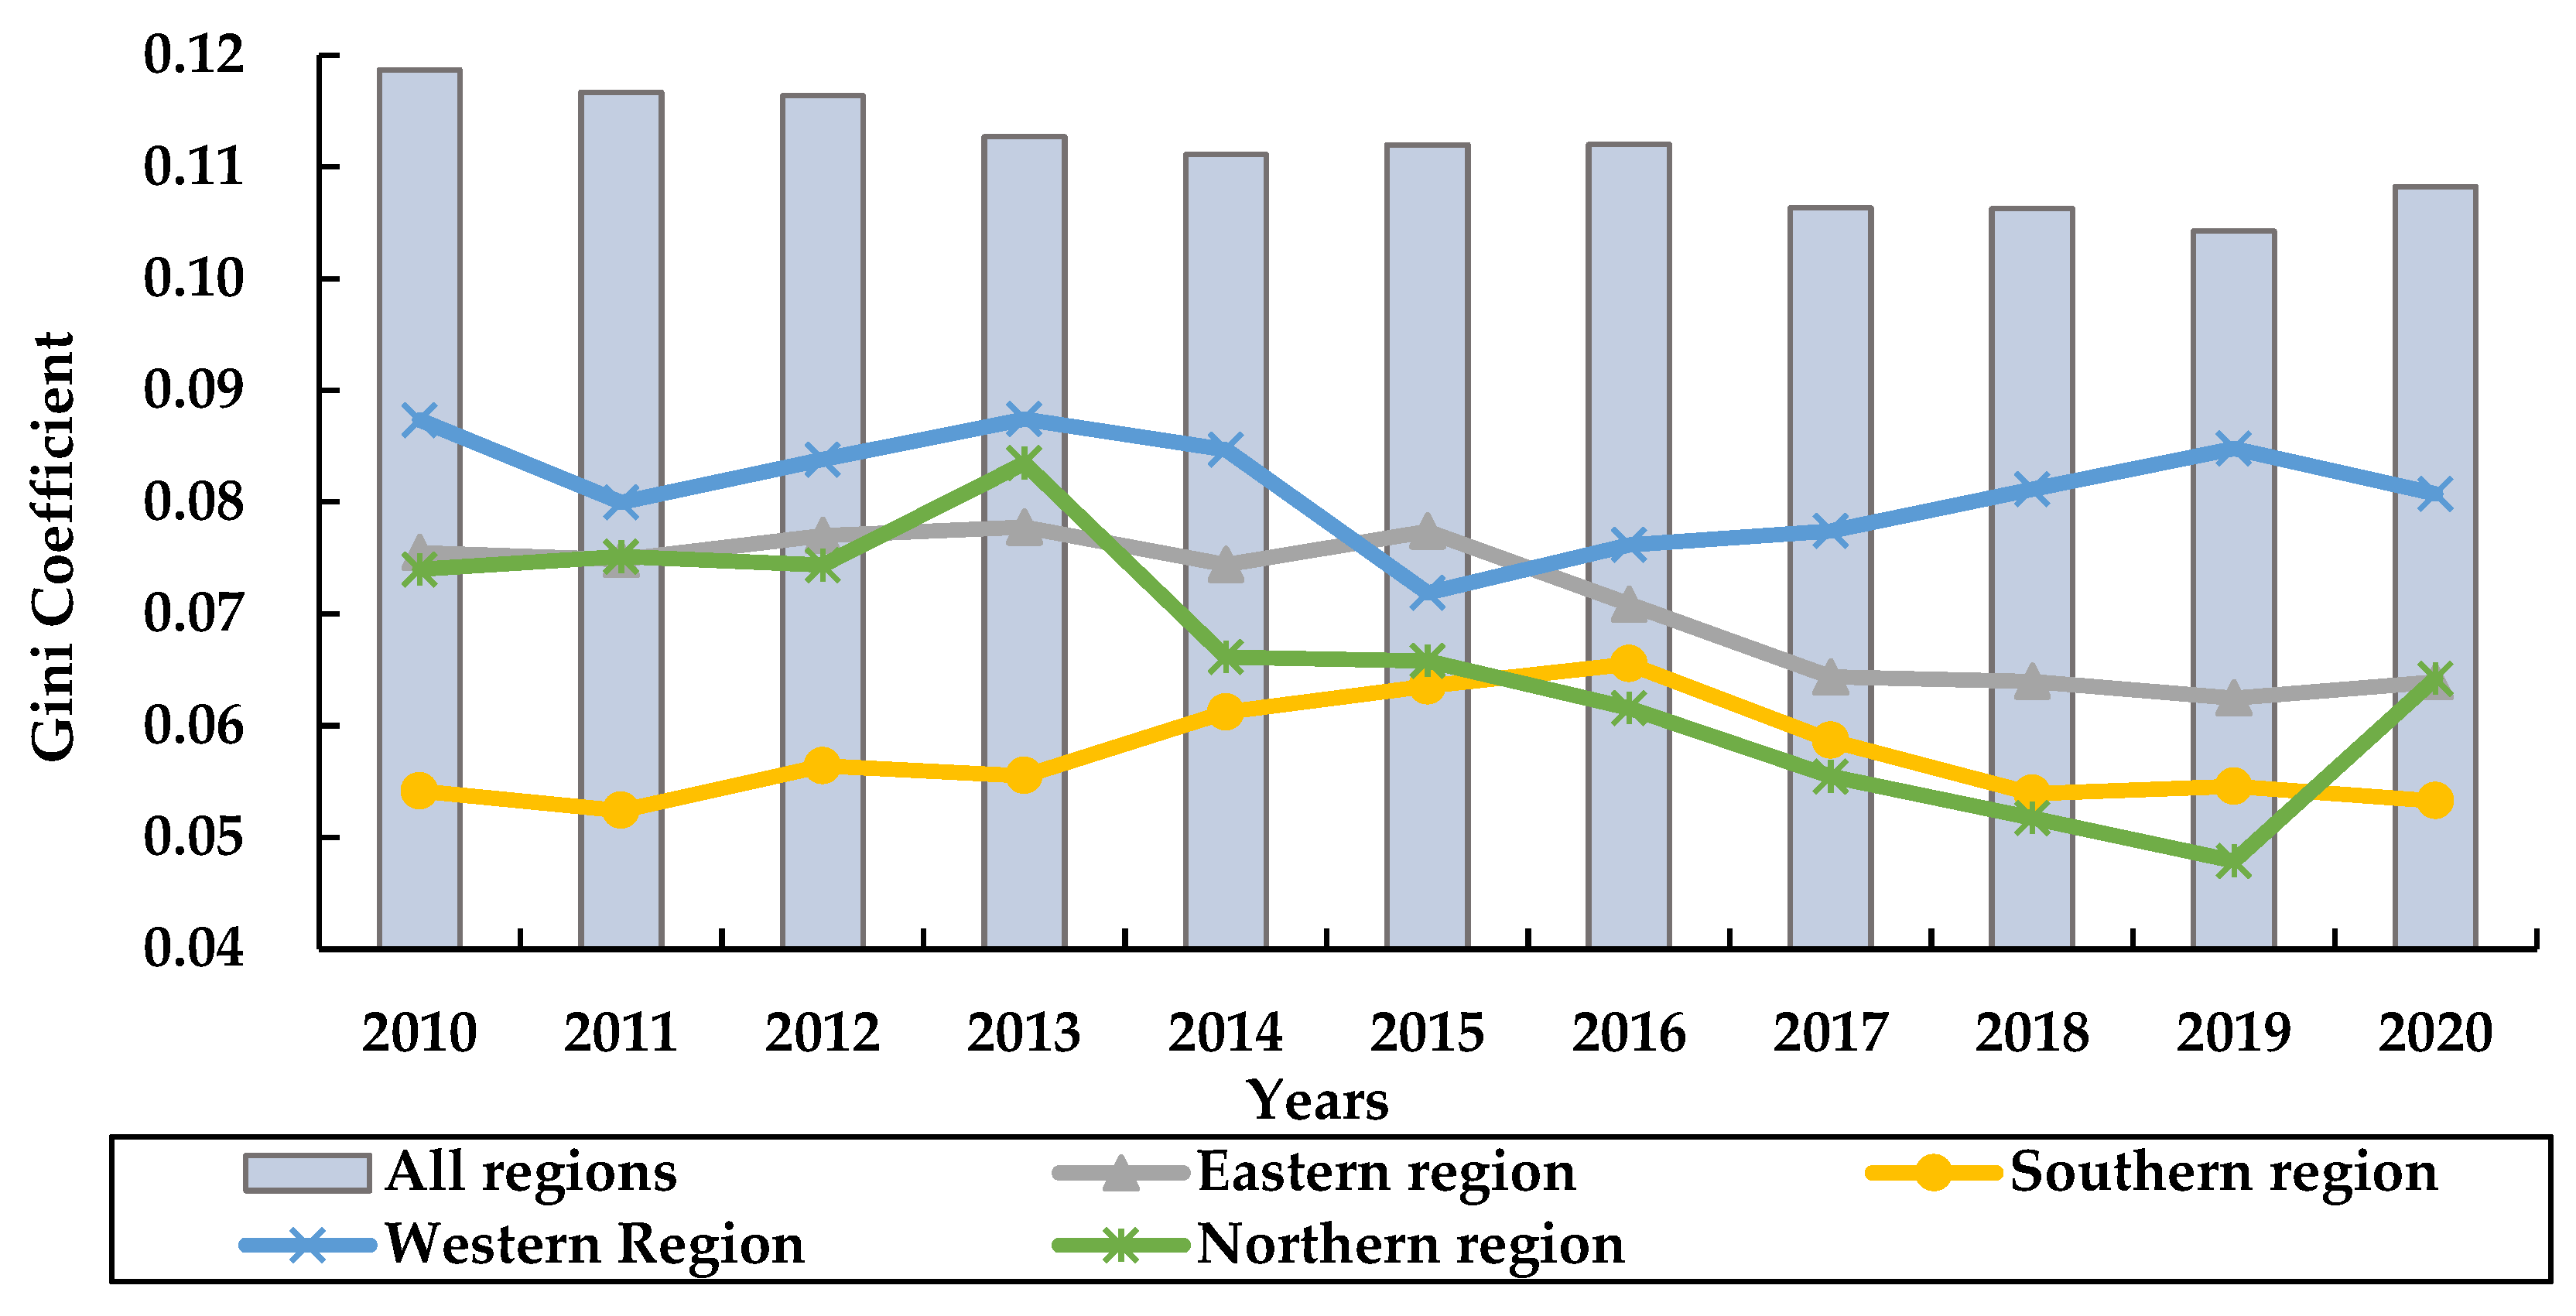
During the study period, the overall Gini coefficient of city resilience in the Yangtze River Delta fluctuated and decreased (Figure 4). From the perspective of the sub-regional Gini coefficient, the western sub-region exhibited the highest Gini coefficient during the study period. The main reason for this was that the resilience level of Hefei in the western sub-region was significantly higher than that of other cities in the region, which resulted in a large range of differences. The Gini coefficient of the eastern sub-region ranked second, and could be divided into two stages according to the changing trends. From 2010 to 2015, the difference of the resilience levels of cities in the eastern sub-region increased, while they shrank between 2015 and 2020.
The Gini coefficients in the northern and southern sub-regions were lower than those in the eastern and western sub-regions. The changes in the southern sub-region were relatively stable, while the northern subregion showed an obvious downward trend.
From 2010 to 2015, the Gini coefficient of the northern sub-region was much higher than that of the southern sub-region. Meanwhile, that of the northern sub-region was declining and the southern sub-region was increasing. From 2016 to 2019, the Gini coefficient of the southern sub-region began to surpass that of the northern sub-region, until the northern sub-region surpassed the southern sub-region once again in 2020.
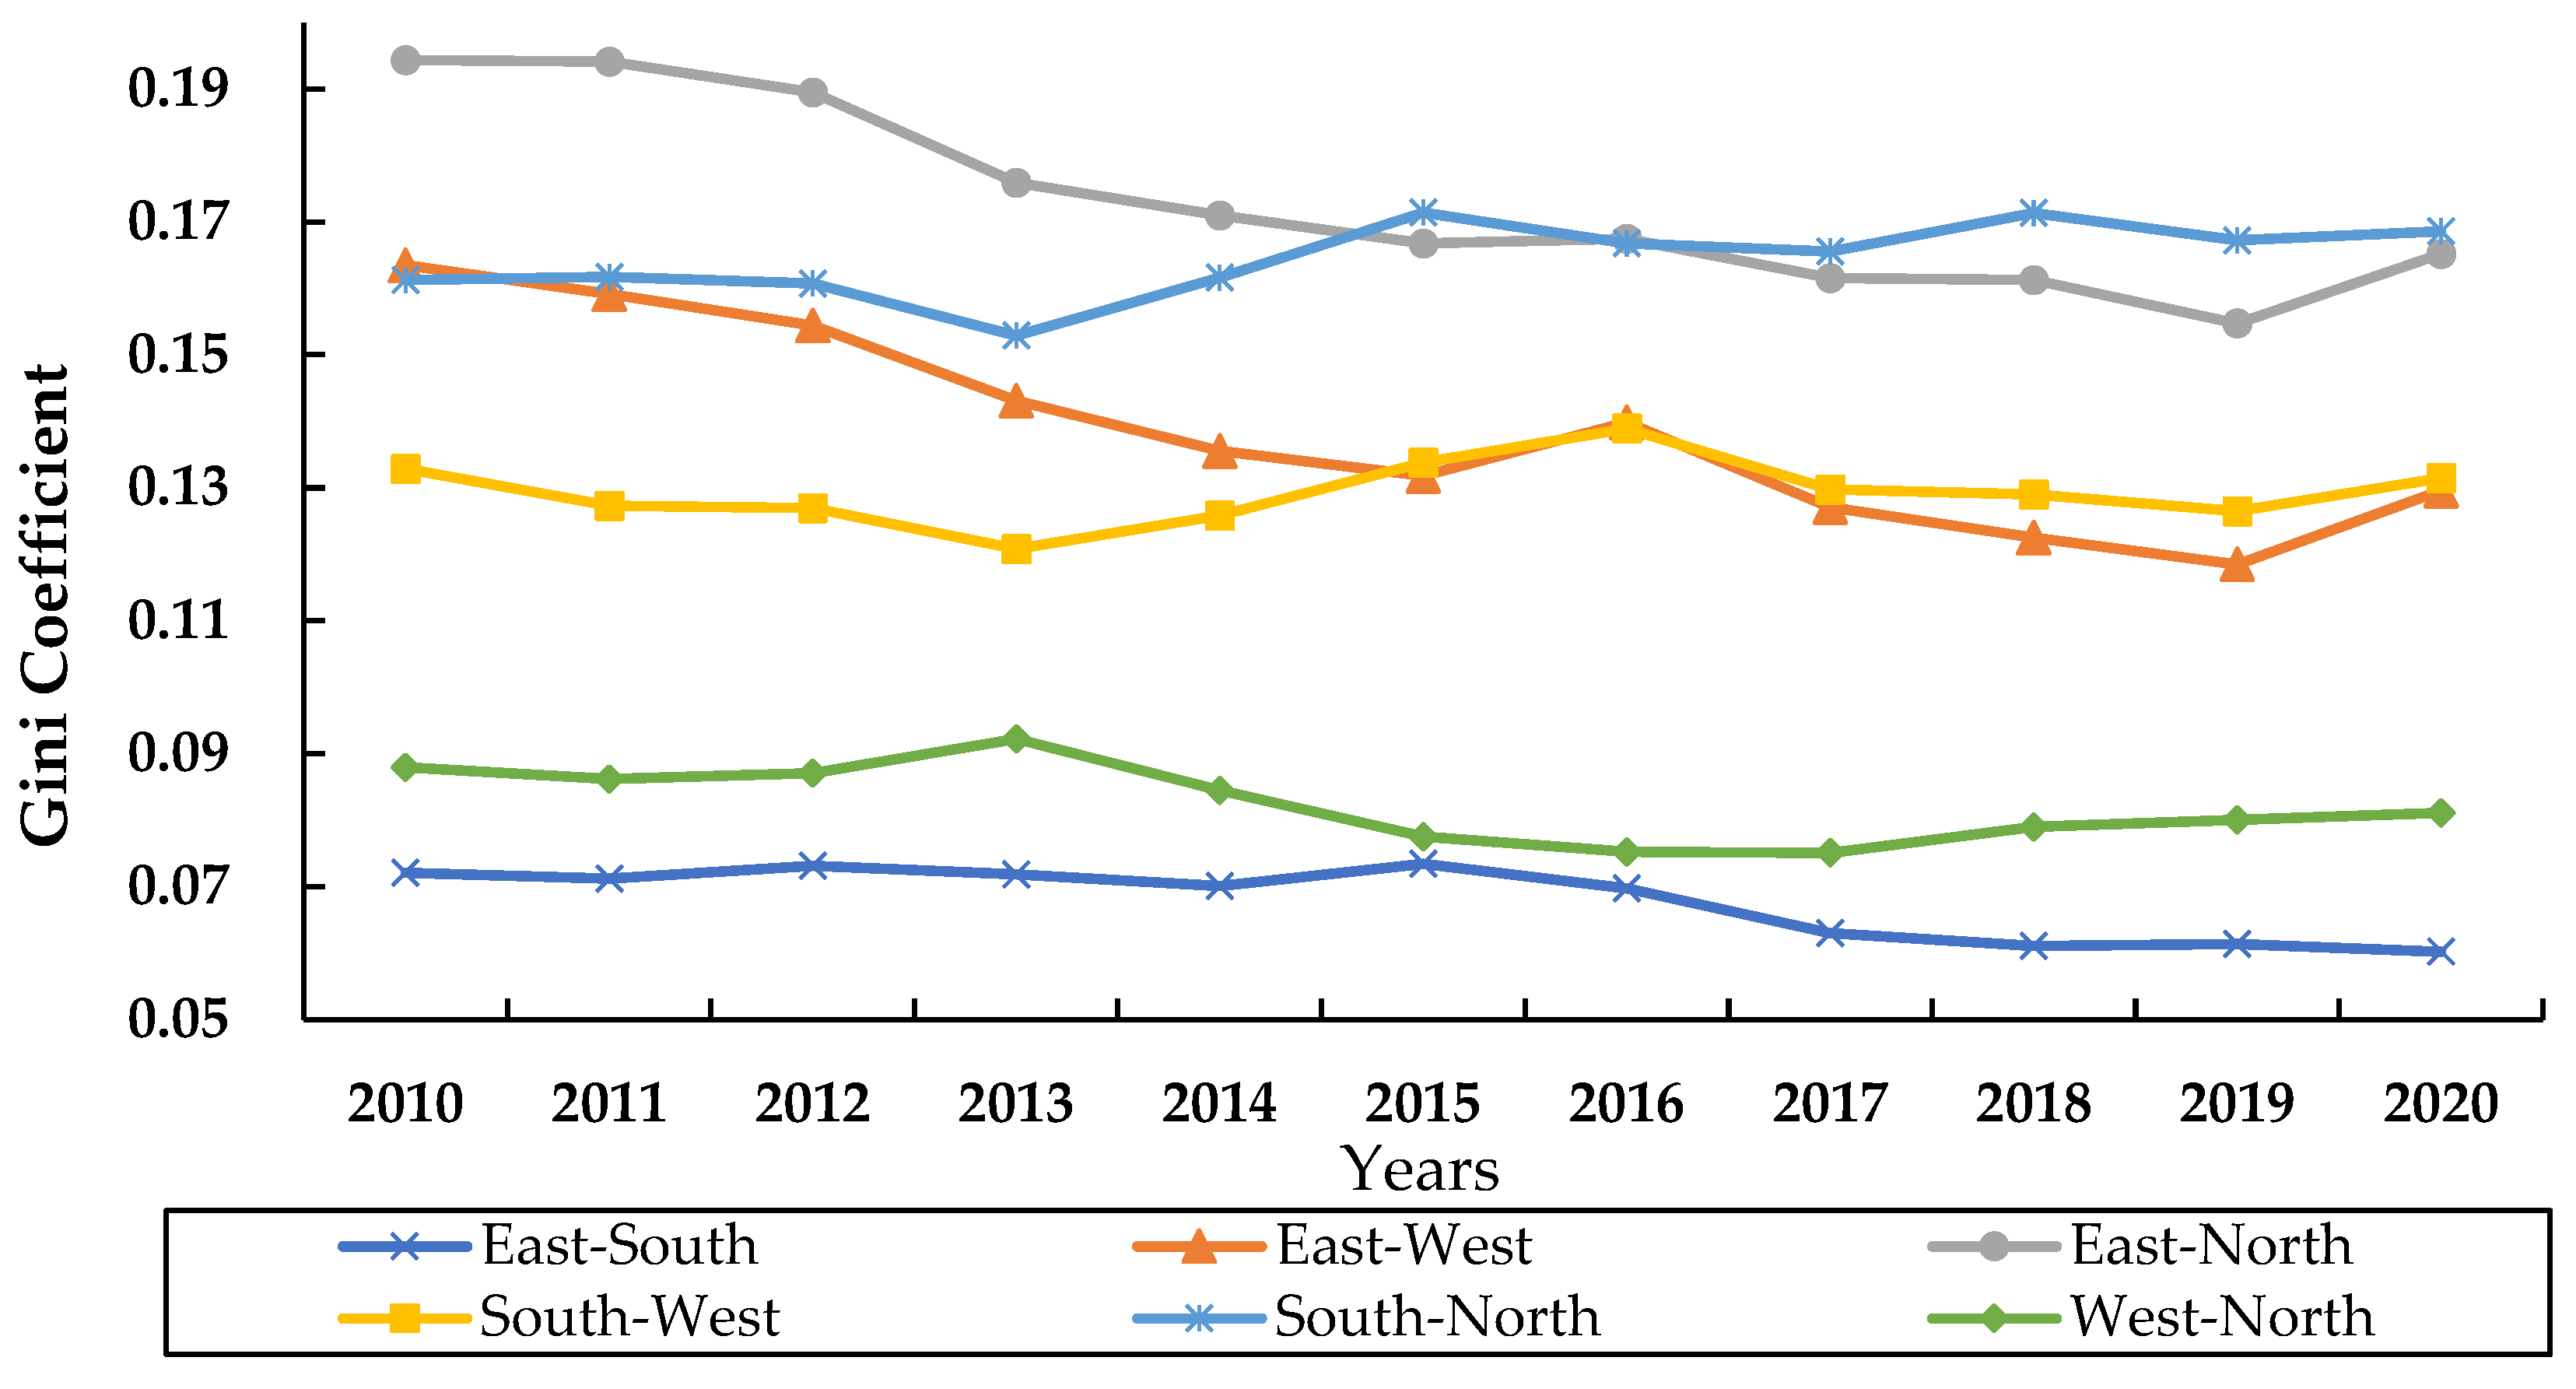
Figure 5 depicts the inter-regional Gini coefficient of city resilience in the Yangtze River Delta from 2010 to 2020, wherein the differences between the west–north and east–south were negligible. Furthermore, from 2010 to 2014, the east–north difference was the largest, followed by the north–south difference and then the east–west difference, while the south–southwest difference was small. However, from 2015, the north–south difference exceeded the north–east difference, and the south–southwest difference exceeded the east–west difference. From the horizontal axis trend, the Gini coefficient in the south, north, and southwest regions showed an obvious upward trend during the study period. The main explanation for this may be that the resilience levels of the cities in the southern region increased more quickly, which resulted in a larger gap between the resilience levels of cities in the southern, northern, and western regions. The differences between the east and south, east and west, east and north, and west and north showed a fluctuating decline. The largest decline was in the east and west with an average annual decline of 4.54% during the study period. Overall, the differences in the city resilience levels were reflected in those between the southeast and northwest regions.

3.2.2. Decomposition

Table 3 reveals the differences in the contribution rates of the YRD city resilience with respect to three dimensions (intra-regional, inter-regional, and super-variable density) from 2010 to 2020. It was found that the differences in city resilience within the YRD were primarily due to the level of the differences between regions with annual contribution rates as high as 72.57%. From the perspective of the variation trend of the contribution rate, the contribution rates within the region initially increased and then decreased. The contribution rates between regions exhibited fluctuations, and those of supervariable density had an increasing fluctuational trend.

3.2.3. Kernel Density Analysis

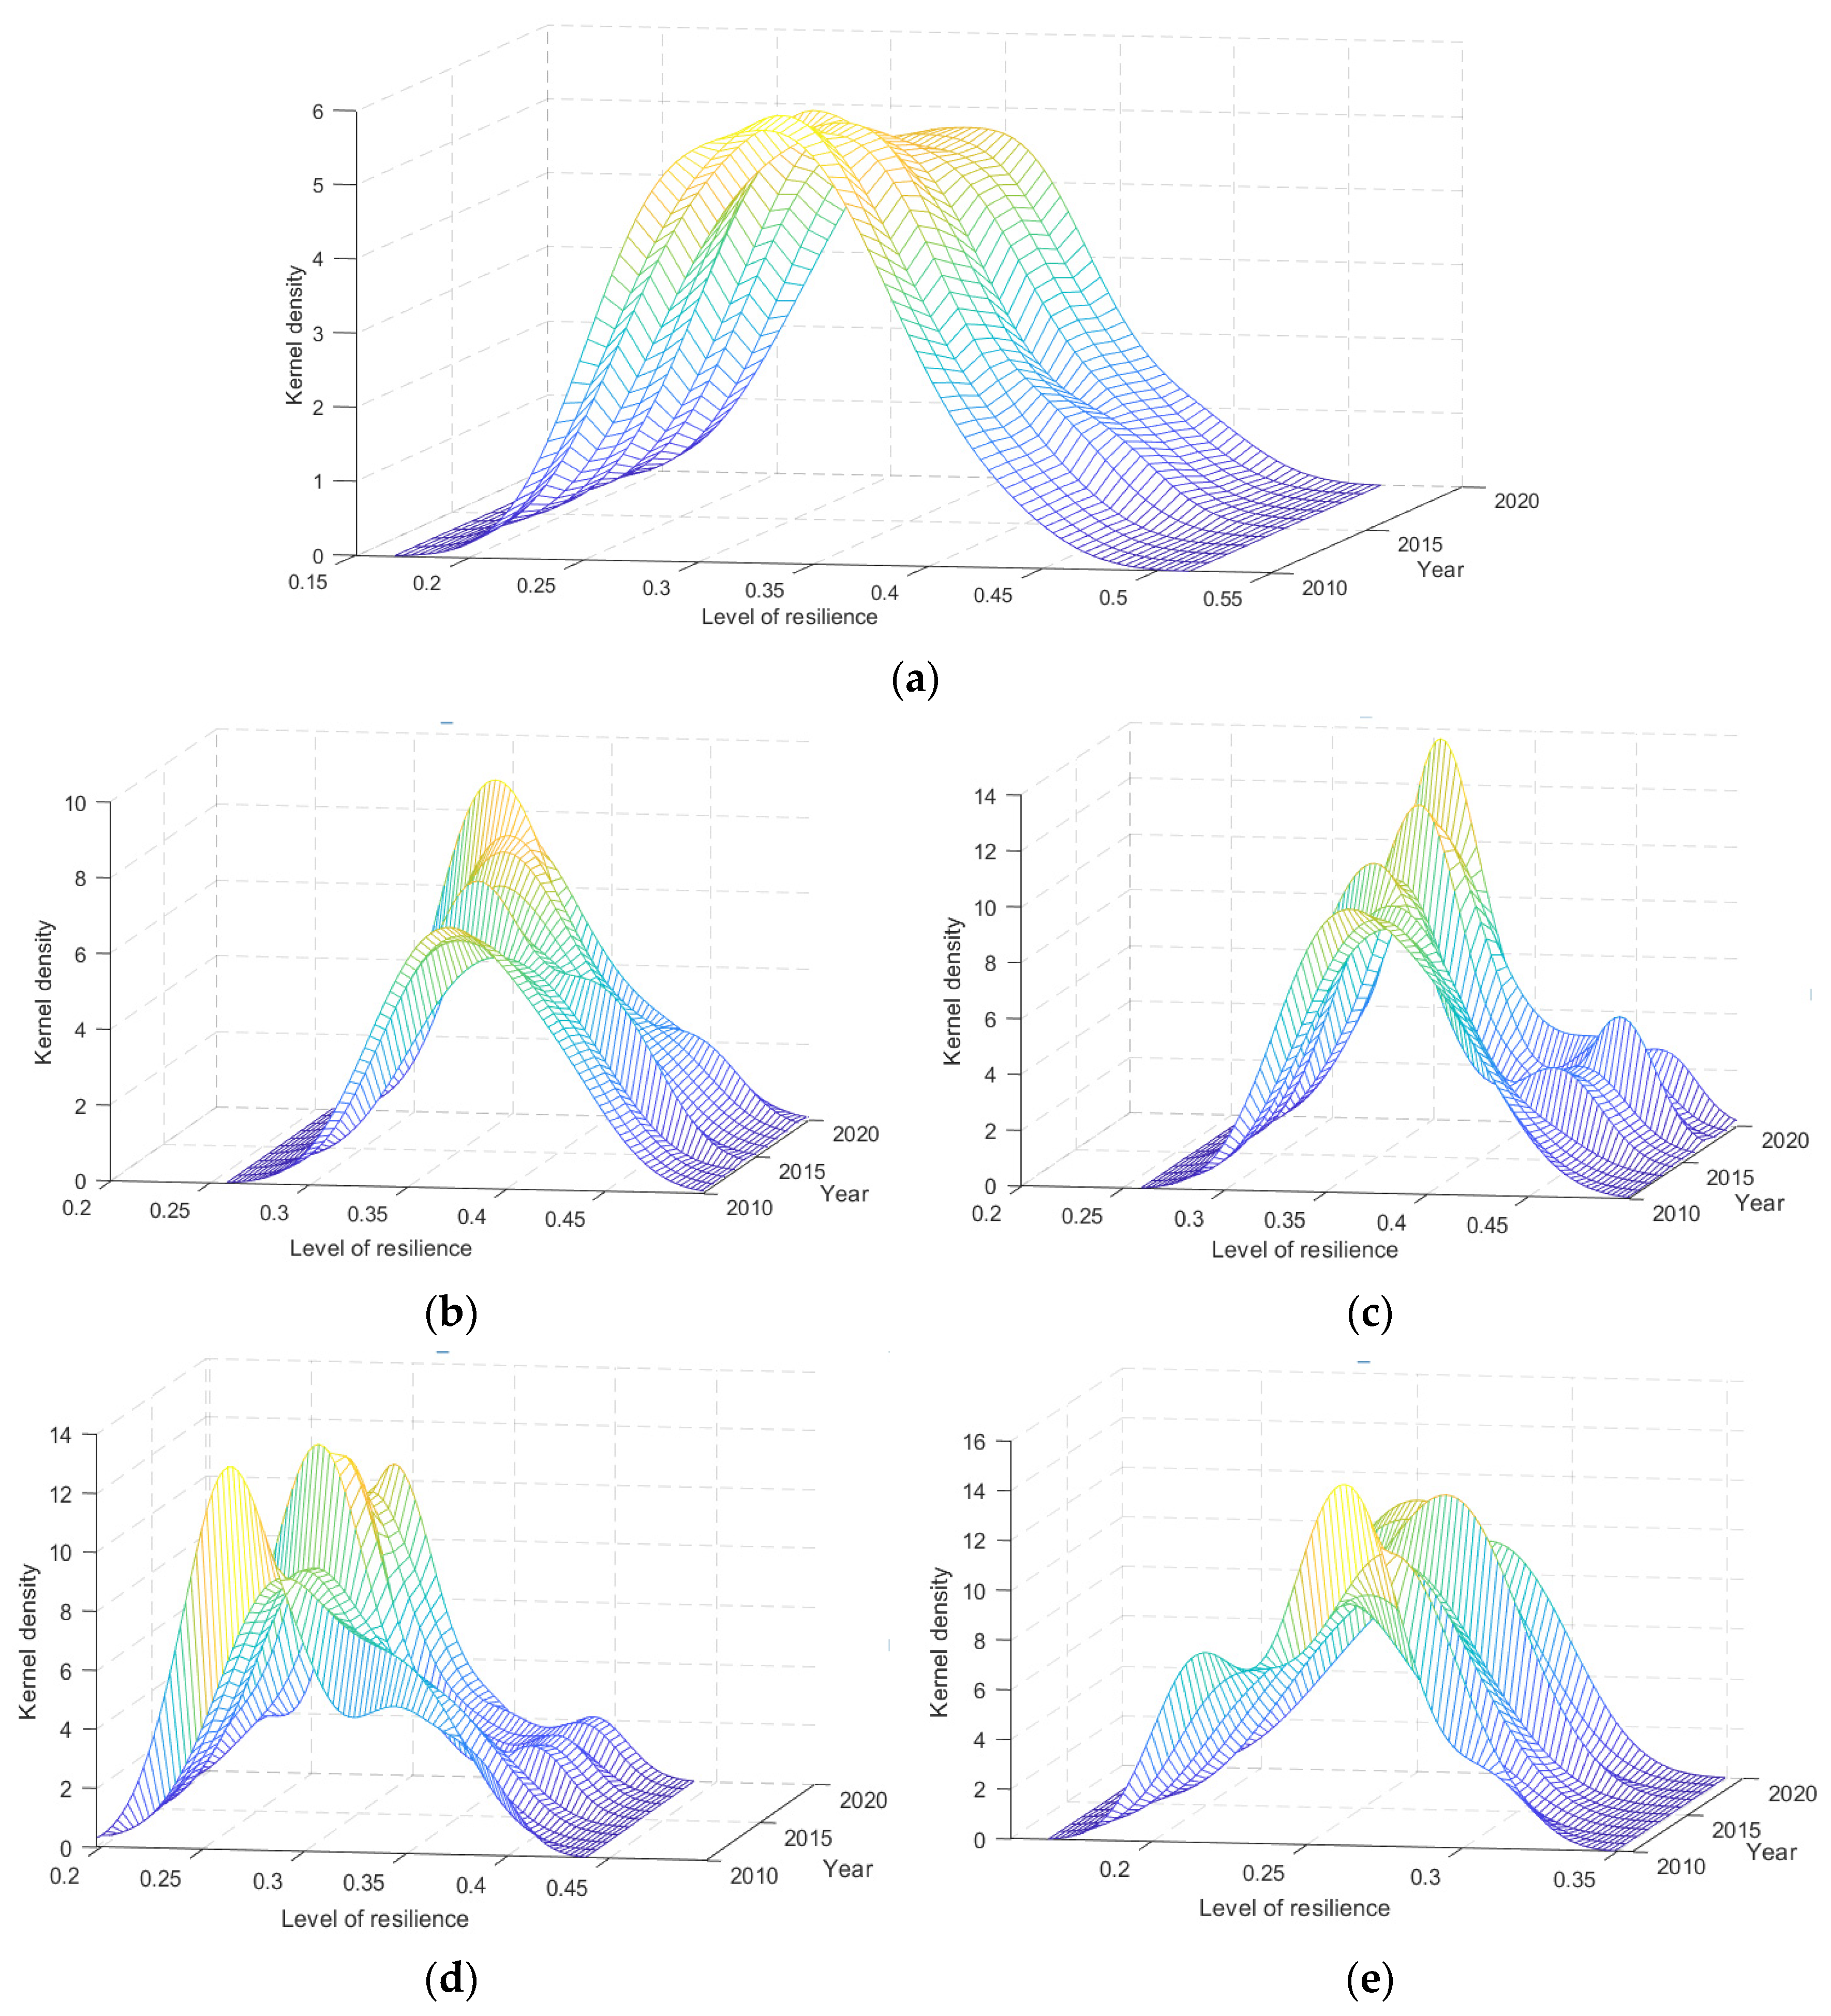
Figure 6a shows the kernel density map of the city resilience of the YRD from 2010 to 2020. As can be seen from the distribution’s positioning, the center point of the kernel density function shifted only slightly to the left in 2015, and then slowly to the right, which confirmed that the city resilience of the YRD improved from 2010–2020. From the distribution state, the peak width of the kernel density function remained essentially unchanged during the study period; however, the peak value showed a downward trend, which indicated that the absolute difference of the overall city resilience level of the YRD had widened. Regarding the polarization phenomenon, the kernel density function from 2010 to 2020 had only one main peak without a lateral peak, which signified that there was no polarization phenomenon in the resilience level of the YRD’s cities during the study period.
Figure 6b–e show nuclear density maps of the four sub-regions from 2010 to 2020. As can be seen, all the center points of the four sub-regions shifted to the right during the study period, while the western sub-region moved most significantly. This indicated that the city resilience of the four sub-regions exhibited an overall upward trend, with the western sub-region increasing more quickly. With respect to the distribution pattern, the height of the main peaks in the eastern and southern sub-regions steadily increased, while the width of the main peak gradually decreased, which indicated that the absolute difference in city resilience for the two sub-regions was progressively diminishing. The height of the main peak in the western sub-region initially decreased and then increased, and the width of the main peak narrowed annually. This meant that the resilience level of the cities in the western sub-region tended to be concentrated from dispersion, and the absolute difference tended to be narrowed. The height of the main peak in the northern sub-region fluctuated, while the width of the main peak experienced a trend of narrowing at first and then widening. Overall, the absolute difference in city resilience for the northern sub-region exhibited a slightly expanding trend. In terms of the polarization phenomenon, the southern and western sub-regions exhibited an obvious trailing phenomenon, while the eastern and northern sub-regions did not. During the study period, the eastern sub-region experienced the following change sequence: “unimodal–bimodal–unimodal”. The lateral peak was always lower than the main peak, whereas the central point of the lateral peak was close to the main peak. This implied that city resilience in the eastern sub-region appeared to show a polarization phenomenon during the study period; however, the gap was small and the polarization phenomenon dissipated at the conclusion of the study period. The southern sub-region experienced a transition from a single peak (2010–2013) to a “one main side” (2013–2020), which indicated that the southern sub-region exhibited a polarization phenomenon over time. In the western sub-region, there were always main and side peaks during the study period, wherein the heights of the side peaks began to decline significantly in 2015. However, the distances between the center points of the main side peaks were quite distant, which implied that the resilience of cities in the western sub-region was polarized, and the gap between cities with polarization was significant. In the northern sub-region, the left peak phenomenon appeared only in 2010, which indicated that the resilience of cities in the northern sub-region was concentrated, and the polarization phenomenon was not obvious.

3.3. Analysis of Driving Factors of City Resilience in the Yangtze River Delta

3.3.1. Set of Driving Factors

Zhang [33] and Liu [24] selected influencing factors according to the dimensions of government, market, innovation, and openness. Drawing from existing research, this study added dimensions such as resident life, ecological environment, information dissemination, resource utilization, and medical conditions to further enrich the index system of the factors influencing city resilience. The level of economic development was chosen to measure the GDP per capita. A city’s economic development directly affects urban construction, investment, and other aspects; therefore, a city’s economic level is an important influencing factor of urban resilience. The industrial structure is measured by the proportion of added value the tertiary industry contributes to GDP, which can optimize the production structure of cities and promote market development and is an important pillar of the sustainable and healthy development of urban economy. The residents' income level is measured by the amount of disposable income, which is a symbol of residents’ living standards and an important guarantee of residents’ quality of life. Fiscal policy is measured by the proportion of public expenditure to GDP, which supports the construction of urban infrastructure and the optimization of the urban environment and medical facilities, and also reflects whether the government policy is inclined towards urban construction. Scientific and technological innovation is measured by the proportion of scientific and technological expenditure to fiscal expenditure; innovation, especially scientific and technological innovation, is important for cities to continuously improve their level of resilience and achieve sustainable development. The openness to the outside world is measured by the proportion of total import and export to GDP, which affects the industrial structure and employment rate of the city and is an important factor with which to enhance the vitality of the city. The ecological environment is measured by the area of green space per capita, which is an important guarantee for the healthy life of city residents and constitutes a buffer zone for natural disasters. Information dissemination is measured by the Internet penetration rate. The development and popularity of the Internet has accelerated the flow of information in the city, which is more conducive to the promotion and implementation of policies and management measures. Resource utilization is measured by the proportion of total energy consumption to GDP, and the resource utilization efficiency of the city is important for building a low-carbon green city and mitigating secondary disasters brought about by climate change. Medical conditions are measured by the number of health technicians per 10,000 people, and health technicians are key to the city’s health care infrastructure. Health care conditions are measured by the number of health technicians per 10,000 people; it is important that the adequacy of this factor is guaranteed so that cities can respond to major health emergencies. The results are shown in Table 4.

3.3.2. Influence of Driving Factors

Table 5 shows the analysis results of driving factors. Temporally, the driving factors could be segregated as dominant and secondary factors. From 2010 to 2020, the leading factors remained basically unchanged, and the means of their Q values (from large to small) were as follows: urban per capita disposable income (X3) > per capita GDP (X1) > Internet penetration rate (X8) > number of health technicians per 10,000 people (X10), and the Q values of the leading factors for each year that passed the significance test of 1%. The secondary factors had relatively low driving forces. The mean order of the Q value is the proportion of the added value of tertiary industries in terms of GDP (X2) > the proportion of total imports and exports with respect to GDP (X6) > the per capita green areas of parks (X7) > the total energy consumption per unit with respect to GDP (X9) > the percentage of scientific and technological expenditure in fiscal expenditure (X5) > the percentage of public financial expenditure in terms of GDP (X4).
In terms of factors, it can be divided into the following three categories (1) driving force weakening factor: the q value of per capita GDP (X1) from 0.801 in 2010 to 0.653 in 2020. During the study period, the Yangtze River Delta continuously promoted the coordinated development of regional integration, and the gap between the per capita GDP of 41 cities was constantly narrowed, which led to the weakening of the impact of economic development on the spatial heterogeneity of the resilience level of cities in the Yangtze River Delta. The q value of the tertiary industry added value/GDP (X2) increased from 0.406 in 2010 to 0.641 in 2012 and then fluctuated, dropping to 0.349 in 2020. In the early stage of the study, the tertiary industry in the Yangtze River Delta was in a rapid development stage, at which time the tertiary industry had a strong influence on the resilience level of the city. However, as the tertiary industry structure tended to be stable, the driving force also dropped; the q values of public financial expenditure/GDP (X4) and scientific and technological expenditure/fiscal expenditure (X5) rose and fell alternately during the study period and generally exhibited a downward trend. The q-values of these two indicators were low and passed the significance test only in some years, which may be due to the small difference between the indicator values of X4 and X5 in the study area on the one hand, and the insignificance of the data due to the small sample size in the study area on the other hand. The q-value of park green space per capita (X7) decreased from 0.453 in 2010 to 0.349 in 2020, which is a decreasing trend but passes the significance test in all years, showing that the urban green environment has a significant impact on the level of urban resilience. The q-value of Internet penetration (X8) decreased from 0.817 in 2010 to 0.553 in 2020. Internet penetration was a strong driver in the early stage of the study, and with the construction and development of Internet facilities in the Yangtze River Delta region, the penetration rate in the region tended to saturate to the extent that the driver of Internet penetration weakened. (2) The driving force enhancement factor. The q value of total import and export/GDP (X6) increased from 0.311 in 2010 to 0.493 in 2015; then, it fluctuated in a small range, but showed an upward trend during the study period. The reason for this phenomenon is that the southeast of the Yangtze River Delta has numerous cities and ports and strong policy support, which is conducive to foreign trade. Therefore, the total volume of import and export accounts for a large proportion of GDP. The driving force for urban resilience level is also on the rise. With the continuous expansion of the external development of cities in the northwestern part of the urban agglomeration, the internal gap of the Yangtze River Delta has decreased to some extent. Therefore, the q value starts to fluctuate after reaching the peak in 2015. The q value of total energy consumption/GDP (X9) fluctuated from 0.248 in 2010 to 0.409 in 2014, and then entered an alternating state of rise and fall. The driving force exhibited an increasing trend during the study period, but only passed the significance test for a few years. The q value of the number of health technicians per 10,000 people (X10) increased from 0.594 in 2010 to 0.694 in 2020, showing an obvious upward trend. There are obvious differences with respect to the allocation of health technicians in the Yangtze River Delta region. Developed cities exert strong efforts to train medical technicians, and the siphon effect on talent is also great. Thus, the driving force for the number of health technicians has increased significantly. (3) The driving force stability factor. The q value of urban per capita disposable income (X3) fluctuated from 0.831 in 2010 to 0.815 in 2020, with an annual average rate of change of only 0.2%, indicating that the per capita disposable income gap of urban residents in the Yangtze River Delta region has not significantly reduced during the study period, and the income gap still exists, leading to a strong driving force of per capita disposable income.
In conclusion, the urban per capita disposable income (X3) was the factor with the strongest driving force, which was relatively stable. This indicated that the improvement of resident income had a strong stimulative effect on the improvement of city resilience. Although the driving forces of per capita GDP (X1) and Internet penetration rate (X8) were strong, they weakened over time. The former indicated that the aim of resilient cities was no longer simply pursuing economic growth, while the latter may have been related to market saturation. The number of technical health personnel per ten thousand people (X10) was a remarkable leading factor and driving force for enhancing the level of basic urban medical and health conditions for city resilience. Specifically, following the COVID–19 outbreak, cities were faced with more complex emergent public health event risks; thus, the enhanced capacities of emergency medical systems were of particular importance. The driving forces behind some secondary factors—including the ratio of total imports and exports to GDP (X6) and the total energy consumption per unit GDP (X9)—increased, which indicated that the level of openness for the YRD and the key support of energy utilization efficiencies for the construction of resilient cities were increasing. This aligned with the current theme of cities as expanding entities that are opening to the outside world, replete with the new goals of energy conservation, emissions reduction, carbon control, and cooling.

4. Discussion

4.1. Mechanisms behind the Creation of City Resilience in the Yangtze River Delta

Various assessments revealed that city resilience in the YRD expressed spatiotemporal heterogeneity. From the regional perspective, city resilience in the YRD showed an upward trend, which was closely related to regional geographical advantages and policy dividends. The YRD, with convenient transportation and abundant resources, is situated on the east coast of China. In 2014, China decided that the YRD would be developed as an internationally competitive world-class city cluster, and in 2019, the integrated development of the YRD became a national strategy. Various favorable circumstances have gradually made the YRD a leading region with the best developmental foundation and institutional environment and presenting the strongest level of competitiveness in China, thus improving regional resilience.
From the provincial perspective, Shanghai has always been in the leading position in terms of city resilience, while Anhui Province has been relatively backward. The data revealed that the urban per capita disposable income (which is the largest driving force) for Shanghai in 2020 was CNY 76,400, which was 22% higher than Zhejiang Province, which was in second place. From the perspective of the actual development of the Yangtze River Delta, Shanghai’s economy, science, education, medical care, transportation, and social security have always been in the leading position, thus securing Shanghai’s leading position with respect to its level of resilience. From the geographical perspective, Jiangsu, Zhejiang, and Shanghai belong to the coastal area, while Anhui belongs to the inland area. In the history of urban development, wherein marine economies were dominant, Anhui was undoubtedly in an inferior position. In 2020, the total import and export volume of Anhui Province was USD 78.704 billion, which accounted for only 4.95% of the Yangtze River Delta urban agglomeration. In 2020, the GDP of the entire province was CNY 3.81 trillion, which accounted for only 15.58% of the Yangtze River Delta urban agglomeration. The knock-on effects of economic backwaters led to the low values of the indices with high weights, such as social and infrastructure levels. As a result, the resilience level of Anhui Province was always lower than the other provinces and cities in the Yangtze River Delta.
With regard to cities, high-resilience cities formed an ever-expanding pattern of development with Shanghai as the core. As the “One core, five circles and four belts” plan was put forward, the resilience within the metropolitan circle received a significant boost. This included the Suzhou–Wuxi–Changzhou metropolitan circle, the Nanjing metropolitan circle, the Hefei metropolitan circle on the line of westward development, and the Hangzhou and Ningbo metropolitan circles on the line of westward development.
From 2010 to 2019, the process of the regional integration of the YRD continued its acceleration. Coordinated development stimulated the agglomerative trend, which significantly reduced the differences in the resilience levels between cities in the YRD during the study period. In terms of sub-regions, the western sub-region exhibited greater intraregional differences. The main reason for this was that the resilience level of Hefei (the capital city of Anhui Province) was significantly higher than that of other cities in the region, and its radiative driving effect was not obvious, which led to significant diversity in this sub-region.
The difference in the resilience levels among the four regions constitutes the main reason for the spatial difference of the Yangtze River Delta. The spatial distribution shows that the resilience level of the southeast region is higher than the northwest region. The southeast region consists of Shanghai, Zhejiang Province, and cities in the central and southern portions of Jiangsu. The Jiangsu and Zhejiang economic belts, with Shanghai as the core, are the most developed regions in the Yangtze River Delta urban agglomeration, with the highest level of social development and the most complete infrastructure construction. From the perspective of economic, social and engineering aspects with high weight, the combined GDP of the eastern and southern regions was CNY 18.4091 trillion, in 2020, accounting for 74.65% of the Yangtze River Delta. The proportion of college students was 237 per 10,000 individuals, which was 8.91% higher than the average level of the urban agglomeration of the Yangtze River Delta. Internet penetration levels were an average of 4.2% higher than that of urban agglomeration, whereas the development of the economy, talent convergence, and the provision of optimal facilities in the southeast area showed an obvious gap in contrast to the northwest region. This resulted in the northwest city having low resilience levels, which also contributed to internal differences in urban agglomeration.
The western cities’ resilience levels increased more rapidly in the western region of the southern city of Anhui, which began with a low level of city resilience. In 2010, the State Council formally approved the Wan Jiang City belt’s plans to undertake industrial planning of a transfer demonstration area. The western regions of Hefei, Wuhu, Maanshan, and Tongling, as well as Anqing, Chizhou, Chuzhou, and Xuancheng, were eight cities that underwent rapid developmental periods. Furthermore, these cities, which are close to Southern Jiangsu and Northern Zhejiang with high resilience levels, could more quickly accept the radiative, driven roles of cities with high resilience levels. According to statistics, by 2020, the demonstration area received a total of CNY 6.2 trillion of investment projects worth more than CNY 100 million, with an average annual growth rate of 16.6%. The GDP amounted to CNY 2556.5 billion, with an average annual growth rate of 9.2%. The per capita GDP was CNY 85,000, reaching 81.9 percent of the average level of the Yangtze River Delta, which was 17.9 percentage points higher than in 2010. Therefore, during the study period, the resilience level of cities in the western region increased relatively quickly. Obvious polarization phenomena existed in the southern and western regions. The two deputy provincial cities of Hangzhou and Ningbo had higher resilience levels in the 11 cities of Zhejiang Province; this was in stark contrast to other cities of the southern areas, which led to polarization in the southern region. With the gradual emphasis on balance and coordination in the regional development of Zhejiang Province, the resilience level of the southern region also tended to be balanced and coordinated, with the polarization phenomenon being reduced at the conclusion of the study period. The primary reason for the occurrence of the polarization phenomenon in the western region was that there was a large gap between the resilience level of Hefei (the provincial capital city) and other prefecture-level cities. The intraregional difference was not significantly reduced during the study period, during which time the polarization phenomenon in the western region was not improved.

4.2. Exploration of the Construction Path of Resilient Cities in the Yangtze River Delta Based on the Characteristics of Driving Factors

4.2.1. City Resident Livelihoods

From the results of our driving factor analysis, it was seen that the driving force behind the per capita disposable income towards city resilience was always strong. Thus, an increasing per capita disposable income should have significant positive effects on the improvement of city resilience, wherein it is of particular importance to achieve stable employment. The government and market in the Yangtze River Delta should proceed by supporting advantageous industries to increase multi-level employment opportunities and encourage elite groups to innovate and establish businesses.

4.2.2. Adjustments to the Energy Consumption Structure

As observed from the changing trends in the driving factors, which constituted the dominant factor, the driving force corresponding to the level of economic development is weakening, while the driving force of the two secondary factors, namely the level of opening to the outside world and the efficiency of resource utilization, is increasing. Therefore, the Yangtze River Delta region needs to establish a low-carbon economic system, and adjust its urban energy consumption structure according to the “19” law concerning the achievement of “carbon neutrality”, which requires the consumption of fossil energy and non-fossil energy to reach a ratio of 1:9. According to statistics, the total energy consumption in the Yangtze River Delta region in 2020 was ~800 million tons of standard coal, among which non-fossil energy consumption accounted for about 13.48%, while fossil energy and non-fossil energy consumption accounted for ~6:1. It was observed that the current form of energy used in the Yangtze River Delta was mainly coal, which has high demands with respect to energy consumption. Thus, it is necessary to further develop non-fossil energy sources such as solar energy, wind power, and geothermal energy, while developing an entire industrial chain of clean and low-hydrocarbon energy.

4.2.3. Optimization of Medical Resource Allocation

Basic medical conditions are both leading and enhancing factors. Following the COVID-19 pandemic, urban health care emerged as a prime focus, wherein the Yangtze River Delta urban agglomeration has been prone to significant public health events due to its high population density and strong mobility. According to the 2020 Big Data Report on Convenience Services of the General Internet Platform of Shanghai Municipal Hospitals, in 2020, the proportion of non-local, registered individuals in Shanghai was as high as 61.61%, from which 27.33% were registered from Jiangsu, Zhejiang, and Anhui. The siphon effect of high-quality medical resources increased the burden on Shanghai and other cities with more developed medical conditions. Therefore, it is necessary to support the Yangtze River Delta urban agglomeration for the optimized allocation of medical resources. The Internet should be utilized to develop a cooperative, remote telemedical system that serves as a specialized subject hospital. Inter-regional cooperation can stimulate the development of high-quality medical resources for tending to residents by establishing diverse hierarchical diagnostic and therapeutic platforms. Common and chronic diseases can be resolved at the grassroots level, so as to drive an overall highly efficient regional medical capacity for the Yangtze River Delta.

5. Conclusions

City resilience has become an important connotation of sustainable city development, whose core is to effectively cope with various changes or shocks and reduce the uncertainty and vulnerability of development, which is also the common pursuit of city development around the world. In this study, the resilience of 41 core cities in the Yangtze River Delta in China from 2010 to 2020 were evaluated through the combination of game weighting and fuzzy matter-element analysis. Subsequently, the spatio-temporal differences in city resilience were revealed by the Dagum Gini coefficient and the Kernel density model. Further, the driving factors of city resilience were analyzed by a geographic detector model. The results show that the resilience level of the eastern cities in the Yangtze River Delta is generally higher than that of the western cities, and the spatial differences between different sub-regions are obvious. The urban per capita disposable income, the GDP per capita, Internet penetration rate, the number of technical health personnel per ten thousand people, the ratio of total imports and exports to GDP (X6), and the total energy consumption per unit GDP are the main influencing factors with differentiated influential abilities. Therefore, we suggest the development of alternative paths to improve city resilience in terms of urban livelihood, the regional ecological environment, and regional medical care.

Author Contributions

Conceptualization, Q.S. and J.C.; methodology, S.Z.; formal analysis, S.Z. and J.C.; writing—original draft preparation, S.Z. and J.C.; writing—review and editing, Q.S., C.Y. and Y.Z.; funding acquisition, Q.S. and J.C. All authors have read and agreed to the published version of the manuscript.

Funding

This research was funded by Key project of Jiangsu Social Science Fund (21WTA-017); Social Science Foundation of Jiangsu Province (21GLC015).

Institutional Review Board Statement

Not applicable.

Informed Consent Statement

Not applicable.

Data Availability Statement

All data were obtained from the statistical yearbooks (2011 to 2021) of Shanghai, Jiangsu Province, Zhejiang Province, and Anhui Province, as well as the national economic and social development statistical bulletin of studied cities (2010–2020).

Conflicts of Interest

The authors declare no conflict of interest.

References

  1. Korhonen, J.; Snäkin, J.P. Quantifying the relationship of resilience and eco-efficiency in complex adaptive energy systems. Ecol. Econ. 2015, 120, 83–92. [Google Scholar] [CrossRef]
  2. Franco, E.G. The global risks report 2020. In Proceedings of the World Economic Forum, Davos, Switzerland, 22 January 2020; pp. 6–7. [Google Scholar]
  3. Spaans, M.; Waterhout, B. Building up resilience in cities worldwide–Rotterdam as participant in the 100 Resilient Cities Programme. Cities 2017, 61, 109–116. [Google Scholar] [CrossRef] [Green Version]
  4. Tang, B. The Research on spatial-temporal evolution and influence factors of urban resilience: A Case Study in the Guangzhou Metropolitan Area. Front. Environ. Sci. 2022, 10, 1052930. [Google Scholar] [CrossRef]
  5. Ahern, J. From fail-safe to safe-to-fail: Sustainability and resilience in the new urban world. Landsc. Urban Plan. 2011, 100, 341–343. [Google Scholar] [CrossRef] [Green Version]
  6. Ma, F.; Wang, Z.; Sun, Q.; Yuen, K.F.; Zhang, Y.; Xue, H.; Zhao, S. Spatial–Temporal evolution of city resilience and Its Influencing Factors: Evidence from the Guanzhong Plain Urban Agglomeration. Sustainability 2020, 12, 2593. [Google Scholar] [CrossRef] [Green Version]
  7. Klein RJ, T.; Nicholls, R.J.; Thomalla, F. Resilience to natural hazards: How useful is this concept? Glob. Environ. Chang. Part B Environ. Hazards 2003, 5, 35–45. [Google Scholar] [CrossRef]
  8. Yang, Q.; Yang, D.; Li, P.; Liang, S.; Zhang, Z. Resilient city: A Bibliometric analysis and visualization. Discret. Dyn. Nat. Soc. 2021, 2021, 5558497. [Google Scholar]
  9. Holling, C.S. Resilience and stability of ecological systems. Annu. Rev. Ecol. Syst. 1973, 4, 1–23. [Google Scholar] [CrossRef] [Green Version]
  10. Briceño, S. Building disaster-resilient communities: The road to the second World Conference on Disaster Reduction, January 2005, Kobe, Hyogo, Japan. In Natural Resources Forum; Blackwell Publishing Ltd.: Oxford, UK, 2004; Volume 28, pp. 234–236. [Google Scholar]
  11. Zhang, M.; Wu, Q.; Li, W.; Sun, D.; Huang, F. Intensifier of urban economic resilience: Specialized or diversified agglomeration? PLoS ONE 2021, 16, e0260214. [Google Scholar] [CrossRef]
  12. Moya, J.; Goenechea, M. An approach to the unified conceptualization, definition, and characterization of Social Resilience. Int. J. Environ. Res. Public Health 2022, 19, 5746. [Google Scholar] [CrossRef]
  13. Sjöstedt, M. Resilience revisited: Taking institutional theory seriously. Ecol. Soc. 2015, 20, 23. [Google Scholar] [CrossRef]
  14. Wang, S.; Cui, Z.; Lin, J.; Xie, J.; Su, K. The coupling relationship between urbanization and ecological resilience in the Pearl River Delta. J. Geogr. Sci. 2022, 32, 44–64. [Google Scholar] [CrossRef]
  15. Reynolds, H.L.; Mincey, S.K.; Montoya, R.D.; Hamlin, S.; Sullivan, A.; Thapa, B.; Wilson, J.; Rosing, H.; Jarzen, J.; Grove, J.M. Green infrastructure for city resilience: A trait-based framework. Front. Ecol. Environ. 2022, 20, 231–239. [Google Scholar] [CrossRef]
  16. Melendez, A.; Caballero-Russi, D.; Gutierrez Soto, M.; Giraldo, L.F. Computational models of community resilience. Nat. Hazards 2021, 111, 1121–1152. [Google Scholar] [CrossRef]
  17. Chen, M.; Lu, Y.; Peng, Y.; Chen, T.; Zhang, Y. Key elements of attentions for enhancing city resilience: A comparison of singapore, Hong Kong and Hangzhou. Buildings 2022, 12, 340. [Google Scholar] [CrossRef]
  18. Tabibian, M.; Rezapour, M. Assessment of city resilience; a case study of Region 8 of Tehran city, Iran. Sci. Iran. 2016, 23, 1699–1707. [Google Scholar] [CrossRef] [Green Version]
  19. Liu, X.; Li, S.; Xu, X.; Luo, J. Integrated natural disasters city resilience evaluation: The case of China. Nat. Hazards 2021, 107, 2105–2122. [Google Scholar] [CrossRef]
  20. Xun, X.; Yuan, Y. Research on the city resilience evaluation with hybrid multiple attribute TOPSIS method: An example in China. Nat. Hazards 2020, 103, 55. [Google Scholar] [CrossRef]
  21. Palmer, R. Athens City Resilience through Culture; British Council: Hong Kong, China, 2018. [Google Scholar]
  22. Xiao, L.; Zhang, R.; Xiao, Q. The dynamic evolution and regional gap of ecological livability level in rural China: Based on non-parametric estimation and Dagum Gini coefficient decomposition. Chin. J. Agric. Resour. Reg. Plan. 2021, 42, 119–130. (In Chinese) [Google Scholar]
  23. Zhao, R.; Fang, C.; Liu, J.; Zhang, L. The evaluation and obstacle analysis of city resilience from the multidimensional perspective in Chinese cities. Sustain. Cities Soc. 2022, 86, 104160. [Google Scholar] [CrossRef]
  24. Liu, L.; Luo, Y.; Pei, J.; Wang, H.; Li, J.; Li, Y. Temporal and spatial differentiation in City resilience and Its influencing factors in Henan Province. Sustainability 2021, 13, 12460. [Google Scholar] [CrossRef]
  25. Zhang, H.; Song, Y.; Wang, D.; Pan, S. Research on the construction of environmental pollution control evaluation system in coastal areas based on WSR methodology. Manag. Rev. 2021, 33, 290–300. (In Chinese) [Google Scholar]
  26. Xu, W.; Zhang, X.; Cui, Y.; Tian, T.; Lin, L.; Liu, Y. Study on comprehensive evaluation of urban water resource vulnerability. Sustainability 2022, 14, 4149. [Google Scholar] [CrossRef]
  27. Yang, J.; Jing, P.; Gao, D.; Cao, H.B. An analysis of the development obstacle factors of water resource recycling economy in Beijing-Tianjin-Hebei urban agglomeration. China Rural Water Hydropower 2020, 10, 131–136. (In Chinese) [Google Scholar]
  28. Chen, J. Research on portfolio weighting evaluation method based on game theory. Fujian Comput. 2003, 9, 15–16. (In Chinese) [Google Scholar]
  29. Xu, S.; Zuo, Y.; Zhang, M. Evaluation of tourism ecological security in China based on Fuzzy matter-element model and diagnosis of obstacle factors. Sci. Geogr. Sin. 2021, 41, 33–43. (In Chinese) [Google Scholar]
  30. Wang, S.; Zhang, Y.; Wen, H. Comprehensive measurement and regional imbalance of China’s green development performance. Sustainability 2021, 13, 1409. [Google Scholar] [CrossRef]
  31. Ge, X.; Xu, J.; Xie, Y.; Guo, X.; Yang, D. Evaluation and dynamic evolution of eco-efficiency of resource-based cities—A case study of typical resource-based cities in China. Sustainability 2021, 13, 6802. [Google Scholar] [CrossRef]
  32. Wang, H.; Qin, F.; Xu, C.; Li, B.; Guo, L.; Wang, Z. Evaluating the suitability of urban development land with a Geodetector. Ecol. Indic. 2021, 123, 107339. [Google Scholar] [CrossRef]
  33. Zhang, P.; Yu, W.; Zhang, Y. Spatial and temporal variation of city resilience in Shandong Province and its influencing factors. Urban Issues 2018, 9, 27–34. (In Chinese) [Google Scholar]
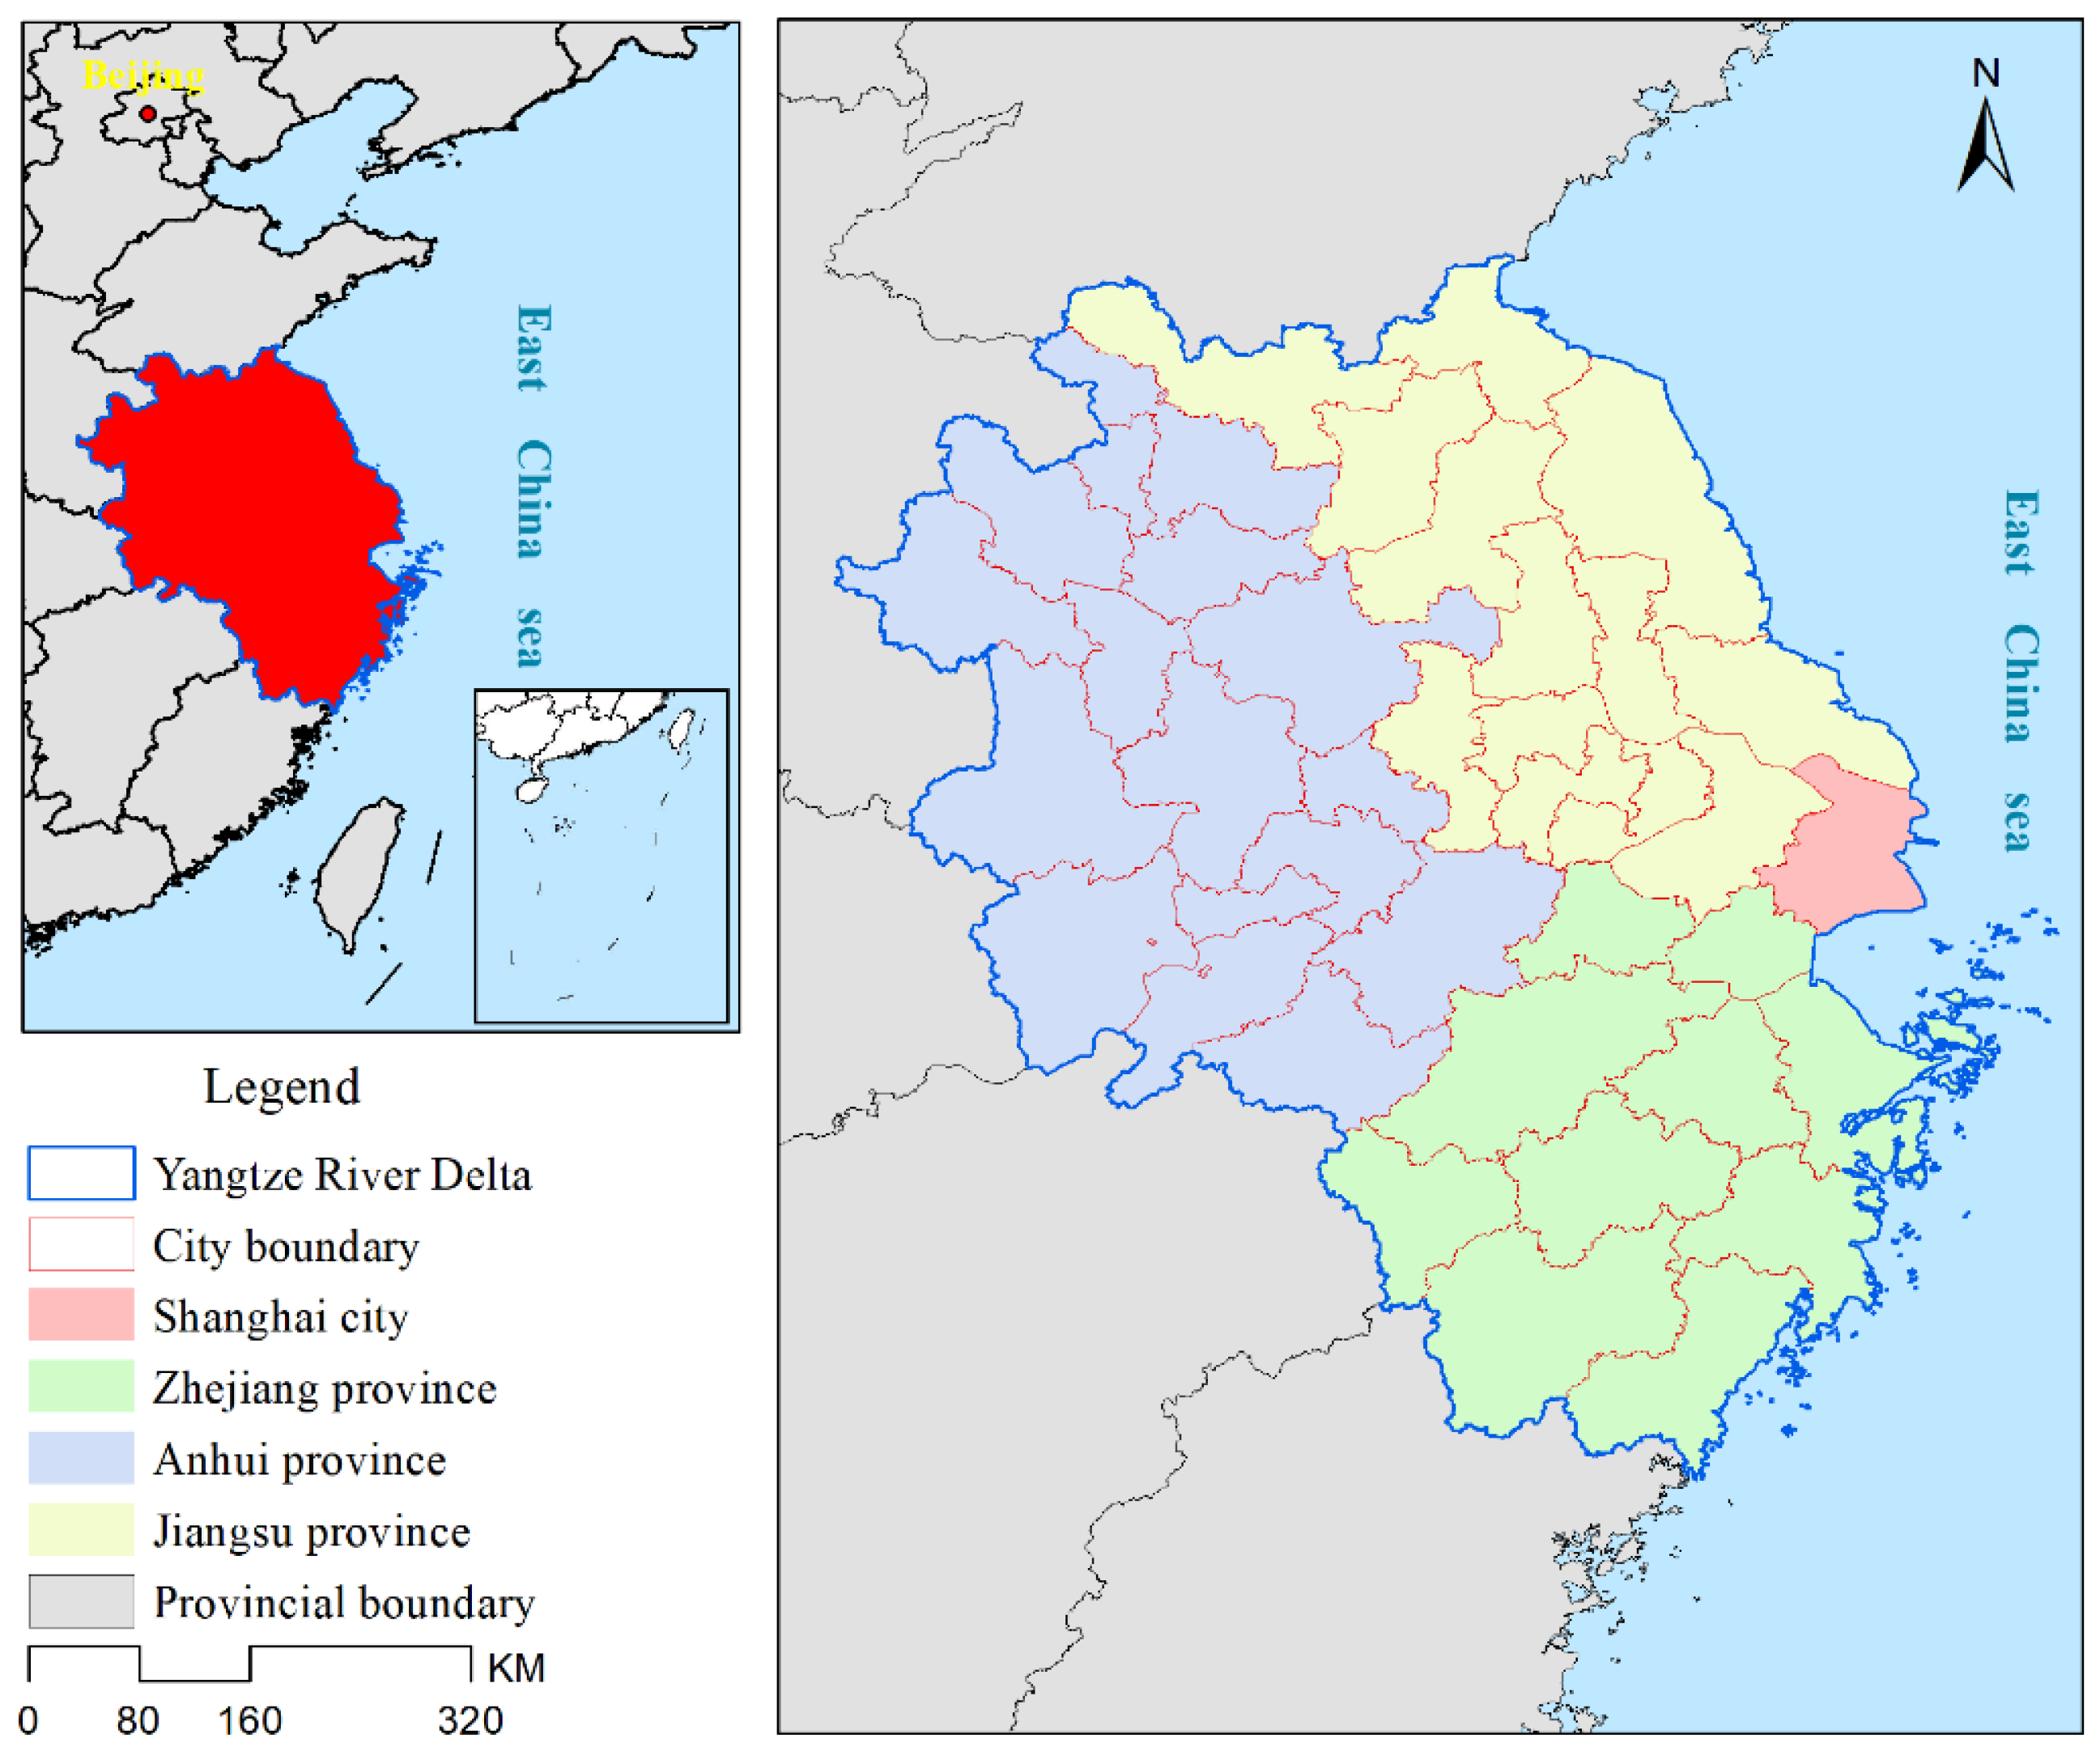
Figure 1. Study area.
Sustainability 15 01538 g001
Figure 2. Research framework.
Sustainability 15 01538 g002
Figure 3. Spatio-temporal distribution of city resilience in the Yangtze River Delta.
Sustainability 15 01538 g003
Figure 4. Gini coefficients of city resilience of the YRD and its four sub-regions.
Sustainability 15 01538 g004
Figure 5. Dagum Gini coefficients of city resilience in the Yangtze River Delta.
Sustainability 15 01538 g005
Figure 6. Dynamic evolution of city resilience distribution in the Yangtze River Delta. (a) Regional, (b) East sub-region, (c) South sub-region, (d) West sub-region, and (e) North sub-region.
Sustainability 15 01538 g006
Table 1. Evaluation index system of city resilience in Yangtze River Delta region.
First-Level IndicatorIndicator’s
Meaning
Secondary IndicatorsUnits and
Properties
Entropy Method WeightAnalytic
Hierarchy Process Weight
Game-Weighting Method Weight
Economic dimension
(0.249)
Economic levelGDP per capitaCNY/person (+)0.0370.0940.054
Economic structureThe proportion of GDP generated via secondary industry% (+)0.0110.0410.020
The proportion of GDP generated via tertiary industry% (+)0.0160.0390.023
Economic vitalityActual use of foreign direct investmentBillions of dollars (+)0.1330.0880.119
Economic efficiencyUnit GDP energy consumptionTon standard coal/ CNY 10,000 (−)0.0050.0440.017
Unit GDP carbon emissionsTons/CNY 10,000 (−)0.0020.0490.016
Social dimension
(0.260)
Population pressurePopulation densitySquare kilometers per person (−)0.0060.0200.010
Employment pressureUrban registration unemployment rate% (−)0.0220.0170.020
Social managementNumber of public management and social employeesTen thousand people (+)0.0660.0100.049
Talent baseNumber of college students per 10,000 peopleOne person (+)0.0680.0180.053
The number of sanitary technicians per 10,000 peopleOne person (+)0.0180.0300.021
Social medicineNumber of hospital beds per 10,000 people piece (+)0.0140.0320.020
Number of hospitals and health centersa (+)0.0280.0290.028
Social SecurityPer capita social security and employment expenditureCNY (+)0.0370.0200.032
Resident lifePer capita disposable income of urban residentsCNY (+)0.0310.0170.027
Ecological dimension
(0.122)
Environmental pressurePer capita wastewater dischargeTon (−)0.0060.0230.011
Environmental governanceEnvironmental investment in the proportion of fiscal expenditure% (+)0.0380.0430.040
Governance efficiencyComprehensive utilization of industrial solid waste% (+)0.0030.0210.008
Harmless treatment rate of domestic waste % (+)0.0060.0320.014
Green levelPer capita park green space areaSquare meters per person (+)0.0180.0640.032
Green coverage rate of building area% (+)0.0030.0510.017
Engineering dimension
(0.224)
Transportation FacilitiesNumber of buses per 10,000 peoplea (+)0.0290.0130.024
Water and electricity facilitiesPer capita power consumptionKilowatt hours per person (−)0.0490.0160.039
Per capita water consumptionCubic meters per person (−)0.1050.0200.079
Road facilitiesPer capita road areaCubic meters per person (+)0.020.0400.026
Communication facilitiesInternet broadband penetration rateStong-sde (+)0.0340.0250.031
Mobile phone popularization rateKhri-sde (+)0.0210.0320.024
Cultural dimension
(0.144)
Cultural ConstructionPer capita ownership of public booksCopies/person (+)0.1010.0390.082
Cultural investmentPer capita education fund investmentCNY/person (+)0.0730.0370.062
Note: In the above table, “+” indicates that the index is positive, and the larger the value, the better; “−” indicates that the index is negative, and the smaller the better.
Table 2. City distribution and labeling in Yangtze River Delta.
ProvinceCity (Label)
ShanghaiShanghai (1)
JiangsuNanjing (2), Wuxi (3), Changzhou (4), Suzhou (5), Nantong (6), Yancheng (7), Yangzhou (8), Zhejiang (9), Taizhou (10), Lianyungang (11), Huai’an (12), Suqian (13), Xuzhou (14)
ZhejiangHangzhou (15), Ningbo (16), Jiaxing (17), Huzhou (18), Shaoshing (19), Jinhua (20), Zhoushan (21), Taizhou (22), Wenzhou (23), Quzhou (24), Lishui (25)
AnhuiHefei (26), Fuyang (27), Chuzhou (28), Wuhu (29), Xuancheng (30), Tongling (31), Chizhou (32), Anqing (33), Maanshan (34), Huaibei (35), Bozhou (36), Suzhou (37), Bengbu (38), Huainan (39), Lu ’an (40), Huangshan (41)
Table 3. Rates of contribution to regional differences in city resilience in the Yangtze River Delta (%).
Years20102011201220132014201520162017201820192020
Within regions14.9014.7315.2916.4415.8615.4215.2214.8914.5014.7314.84
Between regions74.4675.6673.9369.9170.6371.2370.6872.2373.8473.1672.50
Supervariable density10.649.6110.7713.6513.5213.3514.1012.8711.6612.1012.66
Table 4. Driving factors of city resilience in the Yangtze River Delta.
VariableInfluential FactorsIndex and Calculation
X1Economic developmentGDP per capita
X2Industrial structureThe added value of the tertiary industry/GDP
X3Residence incomeUrban per capita disposable income
X4Fiscal policyPublic fiscal expenditure/GDP
X5Scientific and technological innovationScientific and technological expenditure/Fiscal expenditure
X6Openness to the outside worldTotal import and export/GDP
X7EcosystemPer capita Park green space area
X8Information disseminationInternet popularization rate
X9Resource utilizationTotal energy consumption/GDP
X10Medical conditionsThe number of sanitary technicians per 10,000 people
Table 5. Analysis of driving factors of city resilience in the Yangtze River Delta.
YearFactors
X1X2X3X4X5X6X7X8X9X10
20100.801 ***0.406 **0.831 ***0.265 *0.268 *0.3110.453 ***0.817 ***0.2480.594 ***
20110.801 ***0.560 ***0.822 ***0.283 **0.3170.384 **0.429 ***0.796 ***0.3160.629 ***
20120.811 ***0.614 ***0.748 ***0.2200.2910.3210.407 **0.765 ***0.3250.652 ***
20130.818 ***0.526 ***0.782 ***0.2280.2530.459 **0.334 **0.767 ***0.0620.598 ***
20140.765 ***0.433 **0.826 ***0.1710.276 **0.487 ***0.302 **0.705 ***0.409 **0.583 ***
20150.709 ***0.494 **0.787 ***0.225 **0.298 **0.493 **0.301 **0.744 ***0.1170.619 ***
20160.783 ***0.432 *0.775 ***0.221 **0.1940.399 **0.396 *0.756 ***0.324 *0.622 ***
20170.746 ***0.2700.773 ***0.285 **0.1940.357 **0.325 *0.709 ***0.1580.625 ***
20180.777 ***0.3510.836 ***0.1420.2090.449 **0.306 *0.680 ***0.274 *0.691 ***
20190.693 ***0.2450.731 ***0.0880.1470.3820.3110.558 ***0.1520.616 ***
20200.653 ***0.3490.815 ***0.2260.2270.371*0.349 **0.553 ***0.3110.694 ***
Note: ***, **, and * indicate significance at the 1%, 5%, and 10% levels, respectively.
Disclaimer/Publisher’s Note: The statements, opinions and data contained in all publications are solely those of the individual author(s) and contributor(s) and not of MDPI and/or the editor(s). MDPI and/or the editor(s) disclaim responsibility for any injury to people or property resulting from any ideas, methods, instructions or products referred to in the content.