Article

Simulation Study on the Coupling Relationship between Traffic Network Model and Traffic Mobility under the Background of Autonomous Driving

1
College of Architecture and Urban Planning, Tongji University, Shanghai 200092, China
2
Zhejiang Institute of Transportation Research, Hangzhou 310023, China
3
Hangzhou Urban and Rural Construction Development Research Institute, Hangzhou 310016, China
4
Hangzhou Juliang Engine Network Technology Co., Ltd., Hangzhou 311100, China
*
Author to whom correspondence should be addressed.
Sustainability 2023, 15(2), 1535; https://doi.org/10.3390/su15021535
Submission received: 10 December 2022 / Revised: 3 January 2023 / Accepted: 5 January 2023 / Published: 13 January 2023
(This article belongs to the Special Issue Sustainable Transportation Planning and Roadway Safety)

Abstract

:
Autonomous driving technology will bring revolutionary changes to the development of future cities and transportation. In order to study the impact of autonomous driving on urban transportation networks, this paper first summarizes the development status of autonomous driving technology, and then three space–traffic network coupling models are proposed based on the differences of speed and space, which are the traditional difference type, scale variation type, and slow-guided type. On this basis, a new 4 * 4 km grid city model is constructed. Based on the MATSim multi-agent simulation method, the traffic parameters of the three models are studied. The results show that under the same traffic demand, the service scale and level of the three traffic networks are significantly different. The optimal service level of the traditional differential type is 2.15 times the efficiency of the slow-guided type. Under the same demand and road network mode, the travel speed of the autonomous driving mode is 1.7–2.8 times that of the traditional mode. Under the same lane area ratio, the travel speed of traditional driving is much smaller than that of autonomous driving, which is about 2.6–3.6 times greater than the former. The research conclusion has certain reference significance for formulating urban spatial development strategies and policies under autonomous driving environments and for promoting the sustainable development of urban transportation.

1. Introduction

With the rapid development of a new generation of artificial intelligence and information and communication technologies, automobiles, as an important carrier for the application of new intelligent technologies, are accelerating their transformation towards the forms of intelligence and internet. Shared autonomous vehicles will become an important symbol of a new round of industrial transformation and upgrading, which will have a profound impact on humans’ travel patterns and lifestyles in the foreseeable future. Fully autonomous vehicles are seen as innovations that have a positive impact on the environment, the economy, safety, transportation, and travelers [1]. An autonomous vehicle (AV) is one that can give passengers the opportunity to use the car without restrictions, eliminate stopping time, release driving stress, and can let people drive without a driver’s license [2,3]. Taking full control of driving, autonomous vehicles can transform the driver into a passenger, which makes the experience of traveling in an AV more enjoyable than traveling in a car; for example, autonomous driving enables travelers to work in the car, which in turn may change negative perceptions of travel (i.e., better perceived travel time) [4,5,6].
Autonomous vehicles (AVs) will revolutionize our mobility and the way we move from point A to point B. In the foreseeable future, fundamental changes are expected in the mobility industry, which presents both opportunities and challenges.
At present, governments of various countries are making great efforts to promote the construction of green, circular, and low-carbon transportation systems, aiming at integrating resource conservation, environmental protection, and people-oriented services, and at realizing the sustainable development of urban transportation. With the coming of autonomous driving, the urban land layout and transportation network may also greatly change. How to design the future urban transportation network to adapt to this change and make the organic combination of autonomous driving and the sustainable development of urban transportation is a topic that planners need to focus on.
The remainder of this paper is organized as follows: Section 2 reviews the previous literature; Section 3 presents methods and the model parameters; Section 4 presents the simulation process and results; Section 5 presents the discussion; and finally, Section 6 closes with conclusions and recommendations for further research.

2. Literature Review

There is a large capacity of literature, both domestic and international, that explores the impact of autonomous driving on the development of traditional transportation modes. In terms of travel time, multiple studies have shown that autonomous vehicles could reduce the negative utility of travel time by enabling people to conduct more activities on board compared with conventional transport modes, thus positively affecting the feeling and satisfaction of travelers [7,8,9]. In terms of road capacity, Hoogendoorn, van Arem, and Hoogendoorn [10] concluded in their evaluation study that autonomous driving may reduce traffic congestion by 50%, and with the help of vehicle-to-vehicle and vehicle-to-infrastructure communication, traffic overload may be reduced even more. Fernandes, Nunes, and Member [11] proposed an algorithm regarding the localization and cooperation behavior of multilevel platooning in dedicated lanes. The simulation results showed that queueing systems can achieve a high road capacity (up to 7200 vehicles/h) and outperform conventional buses and light rail in terms of road capacity and travel time. Moreover, it was estimated that the highway capacity could be increased by 43% with vehicle sensors and up to 300% with vehicle-to-vehicle communications, as stated by Childress et al. [12] and Olia et al. [13], respectively. In addition, the emergence of shared travel modes and networked vehicles has facilitated the study of clustered vehicle travel. In a study by Bischoff et al. for Berlin, the authors studied the replacement of conventional cabs by autonomous cabs, where one autonomous vehicle could potentially replace ten conventional cabs if shared trips were made [14]. A study by Boesch et al. in Zurich showed that travelers were willing to wait about 10 or 15 min for an autonomous vehicle during peak hours, and nearly 5 min during normal hours, which is very close to the average waiting time of public transportation [15]. A study conducted in Budapest, Hungary, showed that 1 AV could replace 8 conventional vehicles with 7–10 min of waiting time for travelers [16]. Ortega et al. [17] showed that one AV can replace 2.4 conventional vehicles and minimize the travel time of workers and shoppers who use park-and-ride facilities in Budapest.
The development of technology has enabled the upgrade from slow travel to motorization, and shared autonomous driving technology, driven by smart technology, undoubtedly brings new opportunities and challenges to reshape the urban landscape and transportation system [18,19,20]. In general, the existing research focuses more on the object of autonomous driving itself, but less on transportation infrastructure [21]. This study investigated the coupling relationship between the urban transportation network and mobility with the maturity of shared autonomous driving and carried out relevant quantitative research based on MATSim simulations, which has certain theoretical and practical significance.

3. Methods and the Model Parameters

3.1. Technical Route

Three kinds of grid traffic network models were designed first in this study, and on this basis, a new 4 * 4 km grid city model was constructed. Based on the MATSim multi-agent simulation method, the traffic parameters of the three models were studied. The technical route was shown in Figure 1.

3.2. City Traffic Network Model Construction under Autonomous Driving

Autonomous driving cars have unique advantages compared with manned cars and existing cars. Compared with manned cars, they have characteristics such as predictable behavior, a fast response, accurate perception, and they never get tired; compared with existing cars, they are small, efficient, comfortable, and safe, with greater road capacity and better safety [22,23,24].
Considering the application scope of autonomous driving, the spatial layout followed the new urbanism and compact city concept, and the traffic network followed the square grid form. For the convenience of the study, the square grid type road network coupling model was established in this study.

3.2.1. Principles of Traffic Network Design

(1)
Distinction of fast from slow: transform the existing four-level system of expressways, main roads, secondary roads, and feeder roads into a three-level system of high expressways (for long-distance travel), medium-speed roads (for regional travel), and slow roads (within neighborhoods, for mixed pedestrian and vehicular traffic).
(2)
Adopt the square grid model as the main road network model, which has the natural advantage of being efficient and convenient for slow travel.
(3)
Significantly increase walking and cycling as well as green and open space.

3.2.2. Three Options for Traffic Network Design

(1)
Option 1: Traditional difference type
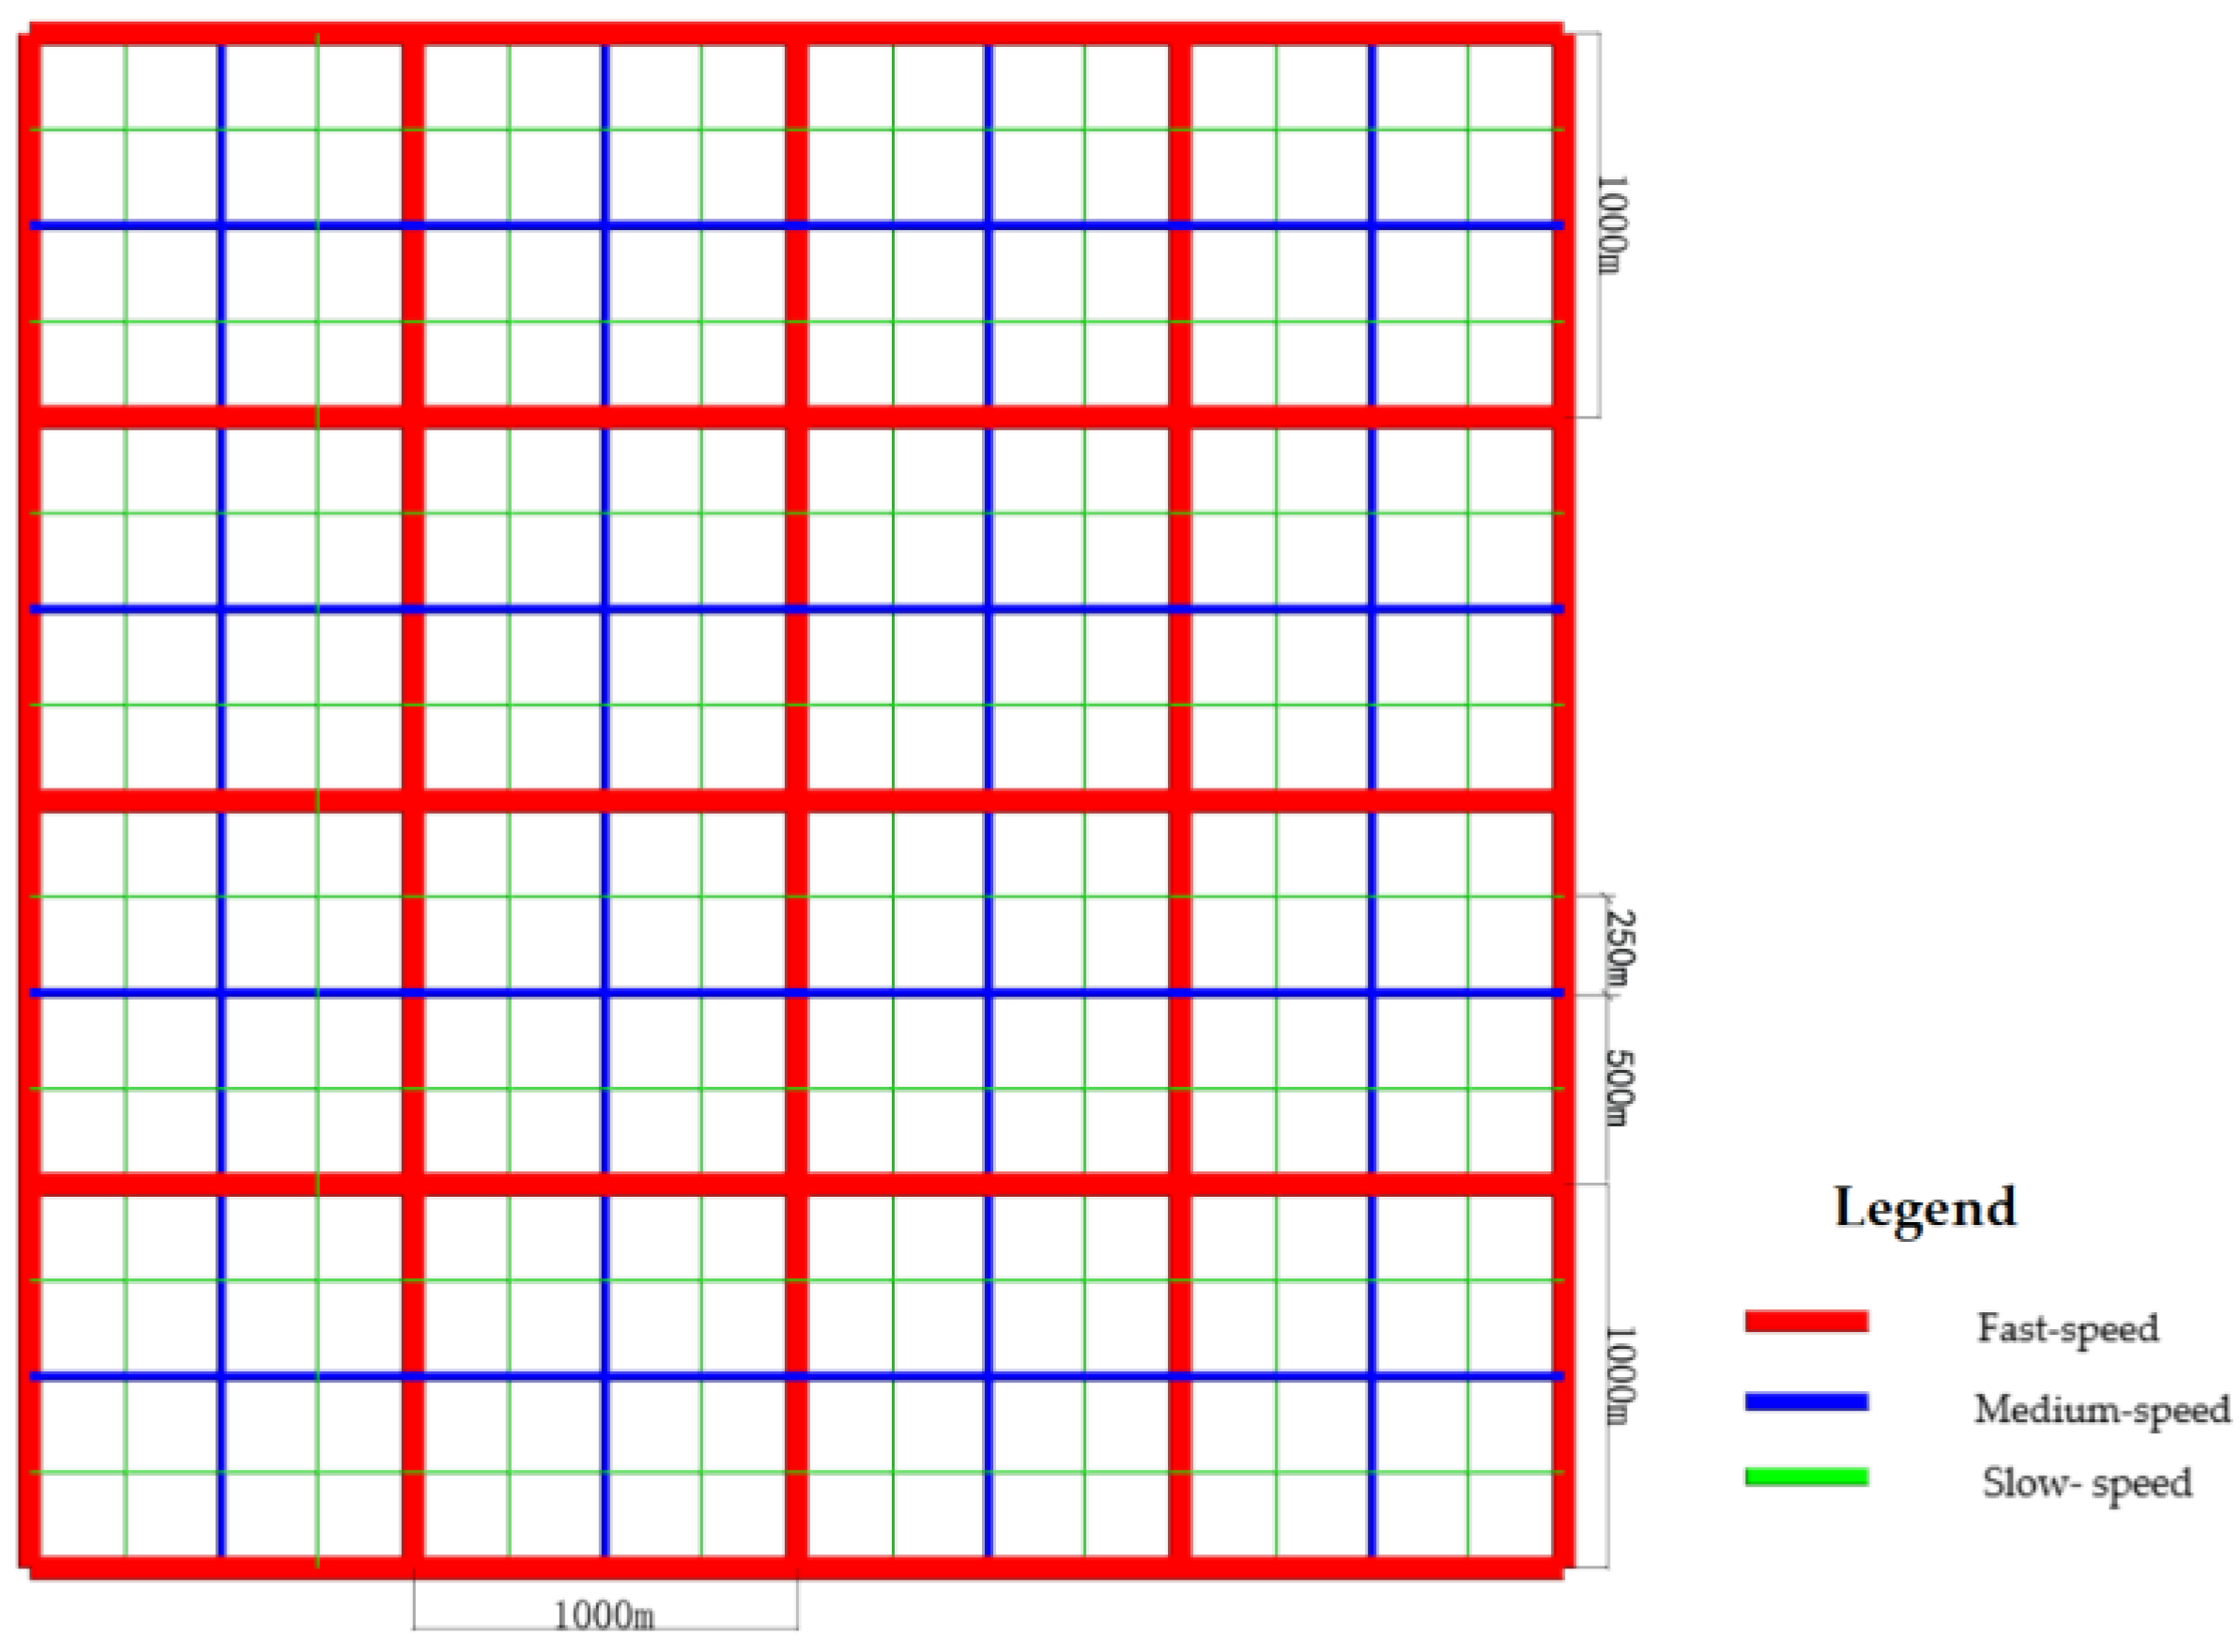
The so-called traditional difference type was mainly based on the current stage of road classification standards. Based on the characteristics of autonomous driving, the road network was further divided into three levels: expressways, medium-speed roads, and slow-speed roads. Among them, expressways were mainly underground, while medium-speed and slow roads were set above the surface; the details are as follows.
The square road network consisted of high and fast special road spacing 1 km enclosed, with a designed speed of 80–100 km/h, generally combined with underground rail transit. The number of road lanes was generally 3 one-way lanes, of which 2 lanes were the fast lane and the third lane on the outside was the transition lane to facilitate the conversion of slow and fast traffic and to guarantee the safety of ongoing and outgoing traffic.
The medium-speed road network was set at ground level, the design speed of which was 40–60 km/h, and the number of road lanes was generally 2 one-way lanes with 1 slow-speed lane, while the outer lane works as a transition interface for pedestrian and vehicle conversion. The road spacing was 500 m. Car space could be set to 10–12 m wide according to actual needs, and the other space could be designed as a walking and riding space, and also could be set as greening or resting space.
A mixed road network for people and vehicles was added inside the module, with a road network spacing of 150–300 m, suitable for walking and cycling and also suitable for slow driverless car operation, with a designed speed of 15–20 km/h. The service was connected to slow driverless vehicles, constituting a 150–300 m pedestrian scale neighborhood.
As shown in Figure 2, red is the expressway with a distance of 1000 m, blue is a medium-speed road with a distance of 500 m, and green is a slow road with a spacing of 250 m.
(2)
Option 2: Scale variant type
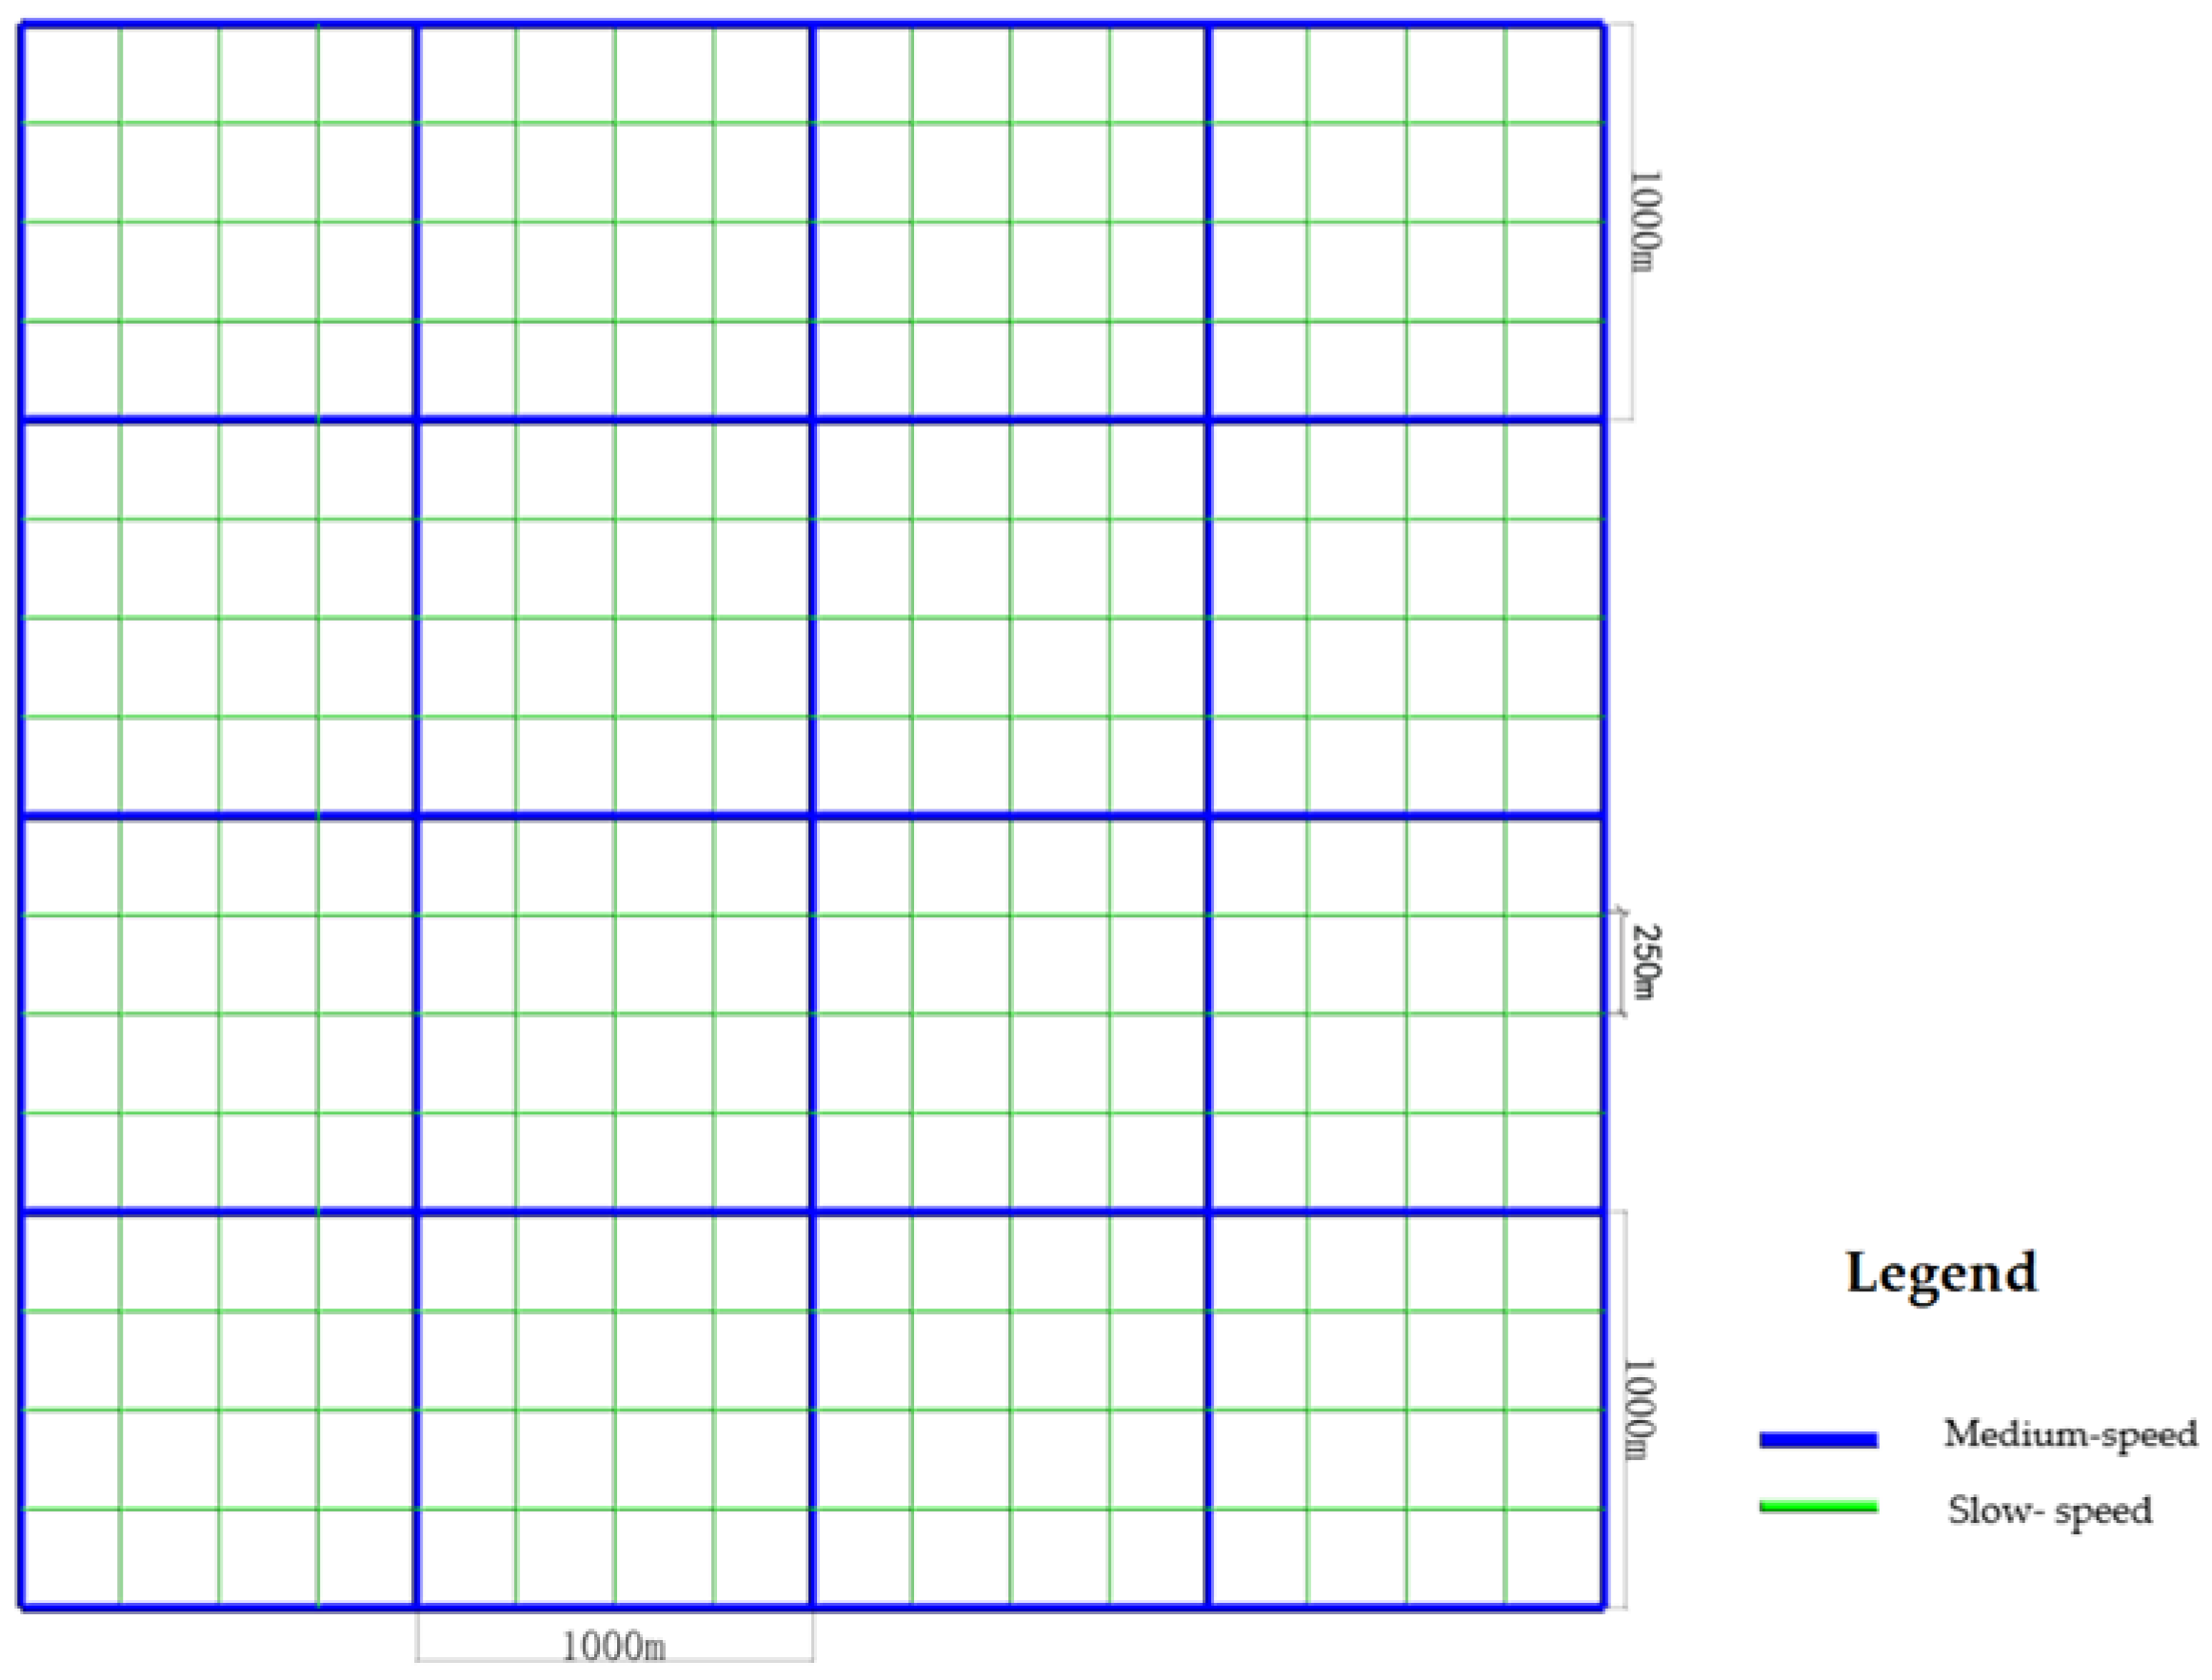
For the road network scheme of Option 1, the spacing of the medium-speed road was 500 m, basically following the spacing of the main and secondary roads of the traditional roads. Considering the higher efficiency of autonomous driving, the road spacing of the medium-speed road network was further expanded from 500 to 1000 m to reach the standard of the spacing of the fast road network, and the slow road network remained unchanged.
As shown in Figure 3, blue is a medium-speed road with a distance of 1000 m, and green is a slow speed road with a distance of 250 m.
(3)
Option 3: Slow-guided type
To further reduce the fragmentation of urban space by expressways, no medium-speed and high-speed roads were set on the ground, except low-speed roads with a road spacing of 250 m. In this way, the ground consisted of all slow roads, bicycles, walking, and motorized traffic with a smaller speed difference and more space for green space and open activities. As shown in Figure 4, green is the slow road with a distance of 250 m.
(4)
Three options for traffic network design
According to the above design, the parameters of the three network types are summarized in the Table 1:

3.3. Overview of MATSim

MATSim (multi-agent transport simulation) is a traffic simulation software platform developed by the research team of Prof. Kay W. Axhausen of the Swiss Federal Institute of Technology, Prof. Kai Nagel’s research team of the Technical University of Berlin, Germany, and the Swiss company Senozon. MATSim uses agents as simulation units, simulates all agents’ trips and activities, and optimizes the agents’ travel and activity plans for a day by interacting with multiple agents to realize the simulation of multiple traffic modes in large-scale traffic networks, the simulation process is shown in Figure 5 [25,26,27,28].

3.4. Basic Principle

  • Each agent selects one for execution based on the scoring of a day’s active travel chain;
  • All agents’ travel plans are loaded into the road network for a road network traffic simulation;
  • Evaluate this iteration process and score this activity travel chain;
  • A certain percentage of agents will modify and adjust their own activity travel chain. The adjustment usually includes 4 aspects: departure time, travel path, travel mode, and destination;
  • Cycle the iterative process until the average score of all agents reaches a stable level.

3.5. Autopilot Simulation

The simulation of this autonomous driving was implemented through the extended module of MATSim (DVRP) with a dynamic demand-responsive scheduling approach. For the simulation of large SAV fleets, a straightforward, rule-based scheduling algorithm was used, which has been applied to a study of over 100,000 vehicles. The algorithm was designed to reduce the number of vehicles required during peak hours, thus minimizing the size of the required fleet to satisfy all requests [29,30,31,32]. Its supply and demand balancing strategy is as follows:
When there is an excess supply, i.e., there is at least one idle autonomous vehicle, then when a new request for a vehicle arises, the nearest vehicle is dispatched to that request.
When there is an undersupply, i.e., there are no idle vehicles and there is at least one request for vehicle use, then when the vehicle is idle, it is dispatched to the nearest request for vehicle use. This situation may make the request wait time longer but helps to improve the service capacity of the system.

3.6. Parametric Simulation Analysis Based on MATSim Traffic Network Model

Land use and transportation systems are mutually influencing, constraining, and promoting; therefore, these two systems constitute a land-use–transportation complex system. We established a 16-square-kilometer square grid model with a planned population of about 160,000 people. According to relevant research data, it was assumed that the number of trips during the peak period within the block accounted to 20% of the total number of trips, and the number of trips per capita was measured to be 2.5 trips. Then, 80,000 trips were calculated during the peak period within the block.
Simulation model assumptions were as follows:
  • Population distribution: modular design with uniform population distribution and random generation;
  • Travel demand: the travel demand distribution was assumed to be normally distributed during the morning peak (6:30:00–9:30:00);
  • Initial distribution of shared autos: consistent with population density;
  • Shared autopilot service mode: used door-to-door service rather than going to a dedicated stop; walking time was ignored.

4. Simulation Process and Results

4.1. Fleet Size Determination

The simulation of AVs in MATSim required a selection of a random fleet size of AVs to simulate and optimize the daily activity of the travelers; this fleet size of AVs directly depended on the acceptable waiting time of the travelers and the locations of the travelers. The acceptable waiting time in this study was set to be around 10 min, which almost equaled the spent time in parking a car or the waiting time at a public transport stop, plus excess and egress walking time.
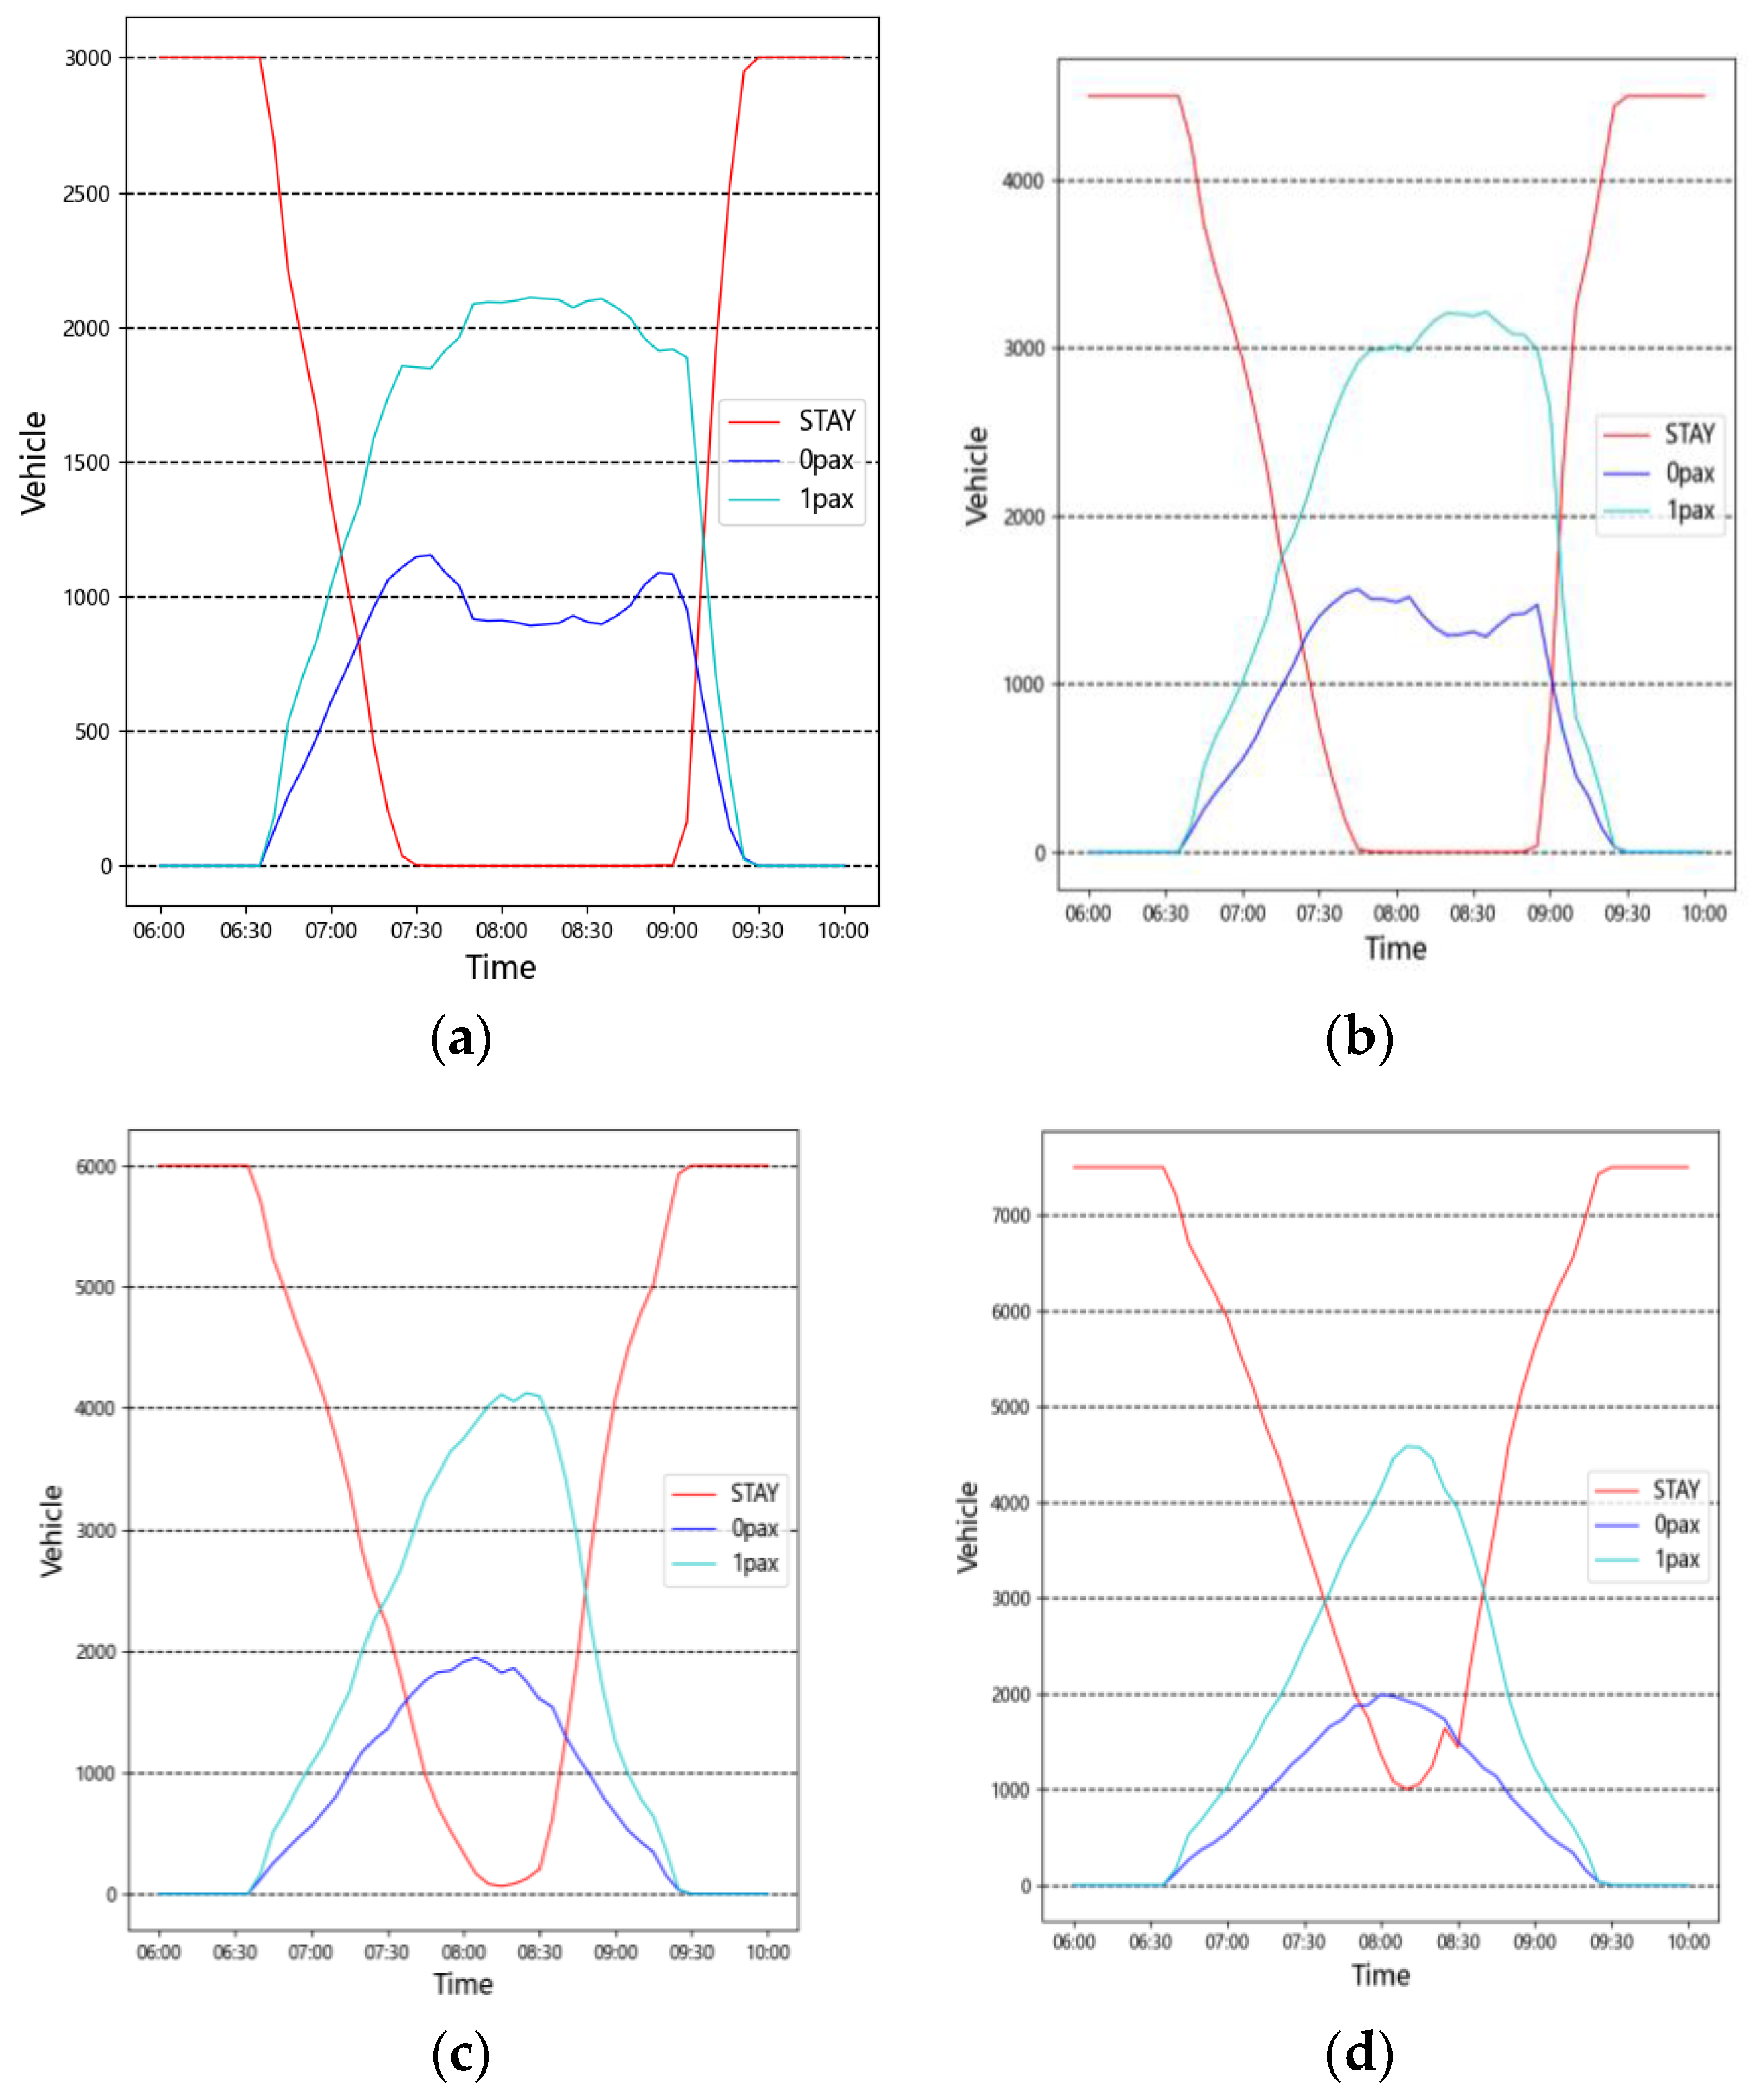
In order to estimate the impact of the fleet size on the service quality, the autonomous vehicles scenario was simulated with fleets with sizes of 3000, 4500, 6000, 7500.
Figure 6 shows the movement of a selected fleet size during the morning rush hour, with empty vehicles moving towards customers (blue), passengers picking up (cyan), and vehicles waiting for service (red). At the time of 3000 shared autonomous vehicles, there was a significant shortage of vehicles, and the data showed that only 64,958 trips were served, accounting for 81.2% of the total number of trips. When more than 6000 shared autonomous vehicles were served, the data showed that about 80,000 trips were served, but when there were 7500 vehicles, a large number of vehicles were idle, as shown in Table 2. Therefore, based on the simulation of the fleet sizes, we thought that a size of around 6000 was appropriate. With such a fleet size, the average waiting time for passengers was about 2.5 min, and the 95th percentile was less than 6 min; such a waiting time is acceptable.

4.2. Option 1: Traditional Difference Type

A larger size of fleet resulted in a large number of idle vehicles, which is not economic. In addition, a smaller fleet size resulted in a low overall service quality during the peak period, as there were a large number of passengers not served. Under the background of autonomous driving, after trial calculations and based on fleet size simulations, we believed that a size of around 6000 numbers was appropriate. With such a fleet size, the average passenger waiting time was about 2.51 min, and the 95th percentile was less than 6 min, which is an acceptable waiting time. Travel time: according to the calculation results, the average travel time during the morning peak was 7.05 min, the average travel distance was 3.1 km, and the average speed was 25.36 km/h. Under the same conditions, the average travel time of traditional driving was 20.98 min, and the average speed was only 9.04 km/h, as shown in Table 3.

4.3. Option 2: Scale Variation Type

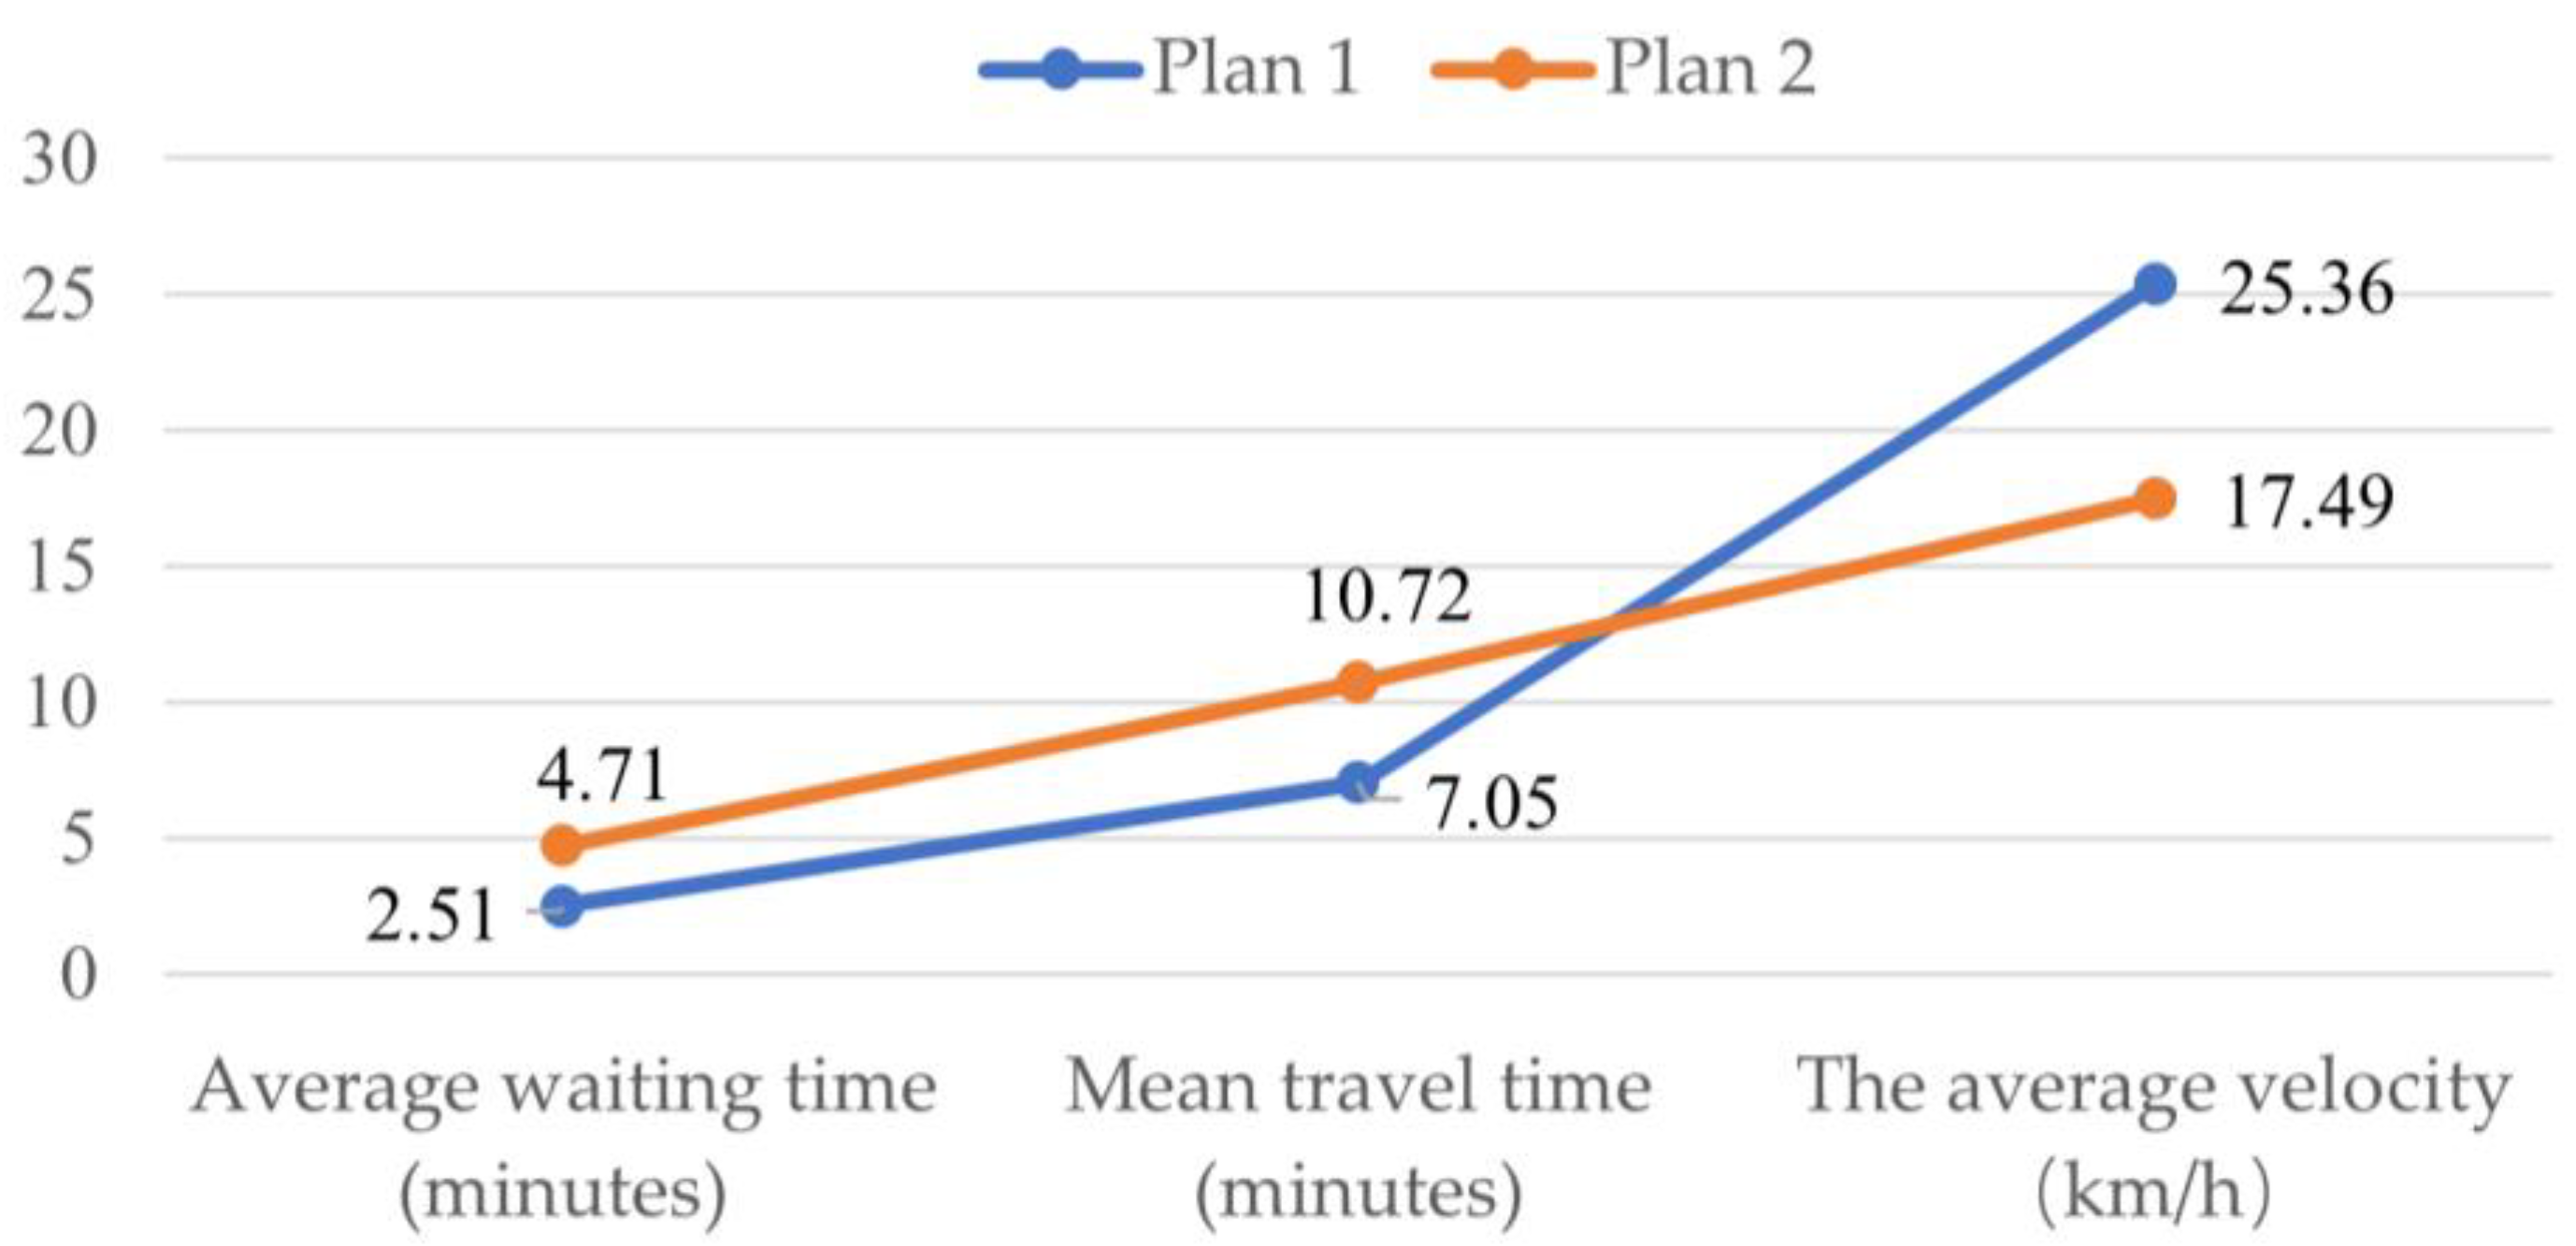
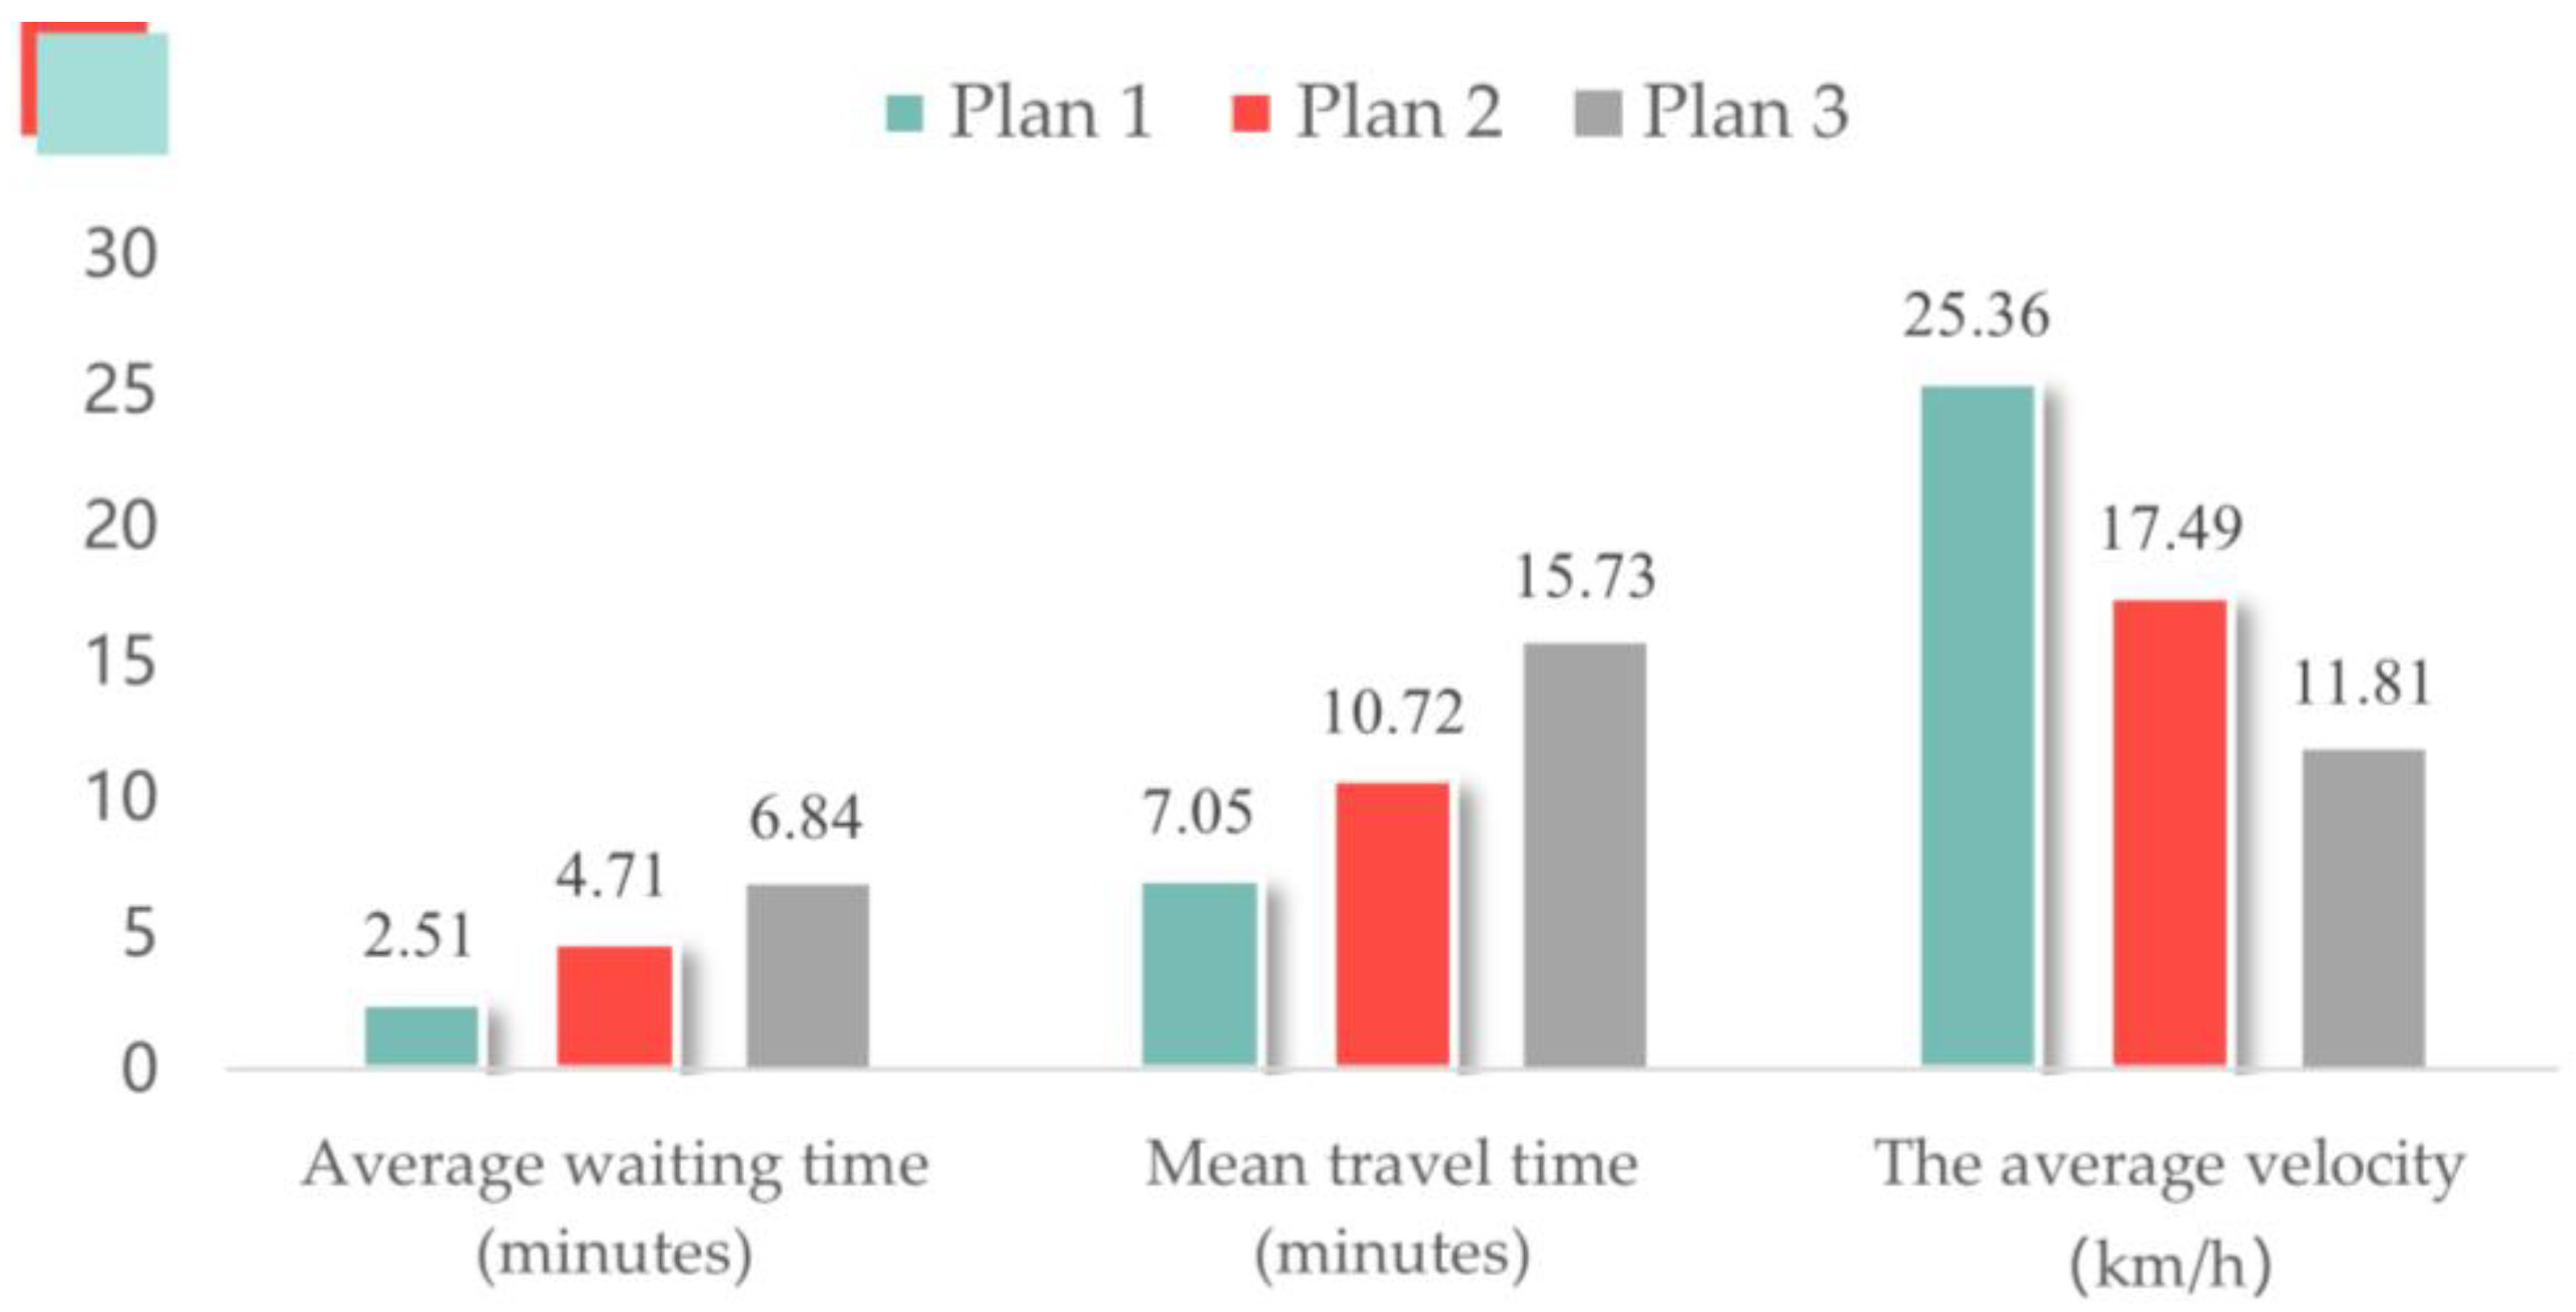
For the sake of comparison, under the background of autonomous driving, it was assumed that the release scheme of option 2 was the same as that of option 1, that is, the number of vehicles to be released in the scale-variant road network was still 6000. For option 2, the lane area decreased to 84.61% of that of option 1 due to the expansion of the spacing of the main roads. According to the simulation results, the average morning peak travel time decreased to 10.72 min, which was 3.67 min longer than that in Option I, and the average waiting time was 4.71 min, which was 2.2 min longer than that in Option I. From this comparison, it can be seen that the overall service capacity significantly decreased. Under the same conditions, the average travel time of traditional driving was 23.2 min, and the average speed was only 8.29 km/h, as shown in Table 4.

4.4. Option 3: Slow-Guided Type

Similarly, under the background of autonomous driving, suppose that the release scheme of option3 was the same as that of option 1, that is, 6000 vehicles would still be put into the slow-guided road network. For option 3, it was actually a bolder plan, with all the blocks being slow roads. According to the simulation results, the average travel time in the morning peak was 15.73 min, which was 8.68 min longer than that in Option I, and the average waiting time was 6.84 min, which was 4.33 min longer than that in Option I. From this comparison, it can be seen that the overall service capacity significantly decreased. Under the same conditions, the average travel time of traditional driving was 27.35 min, and the average speed was only 6.87 km/h, as shown in Table 5.

5. Discussion

The emergence of autonomous driving will undoubtedly have a profound impact on future urban traffic and planning. This study designed three urban models based on grids and conducted simulation studies based on different road networks to observe this impact under the background of autonomous driving. Considering the important role of road area in all urban planning, we also added the index of road–area proportion to quantitatively assess the changes of traffic indicators under different road areas, as shown in Table 6.
(1) Plan 1 designed a traditional urban model with a traditional urban traffic network and three levels of fast, medium, and slow road networks. Under autonomous driving, the road traffic area accounted for about 6.5% of the whole new town, which was much smaller than the traditional road network under the same conditions (9.1%). However, based on the same service vehicles (6000), the service level of autonomous driving was far better than that of traditional driving. For example, in terms of service groups, autonomous driving could cover 80,000 people, while the traditional driving could only cover about 59,832 people. The waiting time was also shorter, with an average waiting time of 2.51 min, compared to 9.36 min for traditional driving, as shown in Figure 7.
(2) The distance between the medium-speed roads in the traffic network of Plan 2 was further expanded to investigate the impact of this expansion on the road service level. The distance between medium-speed roads was expanded to 1000 m (this distance was generally the distance between the fast roads), and the overall road area after the expansion only occupied 5.5% of the whole new town. The waiting and travel times were further increased by 2.2 and 3.67 min, respectively, as shown in Figure 8, while the size of the service population barely decreased, suggesting that road spacing could be appropriately expanded under autonomous driving to create a more humanized activity space.
(3) The original intention of Plan 3 was to imagine a new garden city, where the cars on the ground were controlled under a certain speed, so that the ground was mainly slow traffic and more friendly to pedestrians. Under this condition, we can see that the road area was only 4.25% of the overall new town, the size of the service population still reached more than 85%, the waiting time was 6.84 min, and the average travel time was 15.73 min, as shown in Figure 9, which was better than that of the traditional driving state of Plan 1. Autonomous vehicles and their distributions can be further optimized in the future to cover more people and provide better services.
(4) Under the same proportion of lane area, the driving speed of traditional driving was much lower than that of autonomous driving. Taking the traditional driving in option 3 and the autonomous driving in option 1 as an example, the road area of the former was 91.3% of the latter, but the average speed was 27.9% of the latter, as shown in Figure 10.
(5) Under the background of autonomous driving, from options 1 to 3, the waiting and travel times gradually lengthened, increasing by 2.7 and 2.2 times, respectively, while the travel speed decreased by 2.14 times, as shown in Figure 11.

6. Conclusions and Recommendations for Further Research

With each technological change, the layout and size of cities will be revolutionized. It can be predicted that the advent of the era of autonomous vehicles will have a dramatic impact on the development of cities. Therefore, urban and transportation planning, as a discipline with strong applicability and practicality, must keep up with the pace of technological change and actively make systematic responses. Based on this goal, this study investigated the traffic service levels of different network models under the same demand, so as to make a preliminary exploration of urban planning under the influence of autonomous driving. Through a comparative analysis, we believe that:
  • In general, the transportation service under autonomous driving was obviously better than that under the traditional driving mode. Under the same demand mode, the autonomous driving mode was 1.7–2.8 times faster than the traditional mode.
  • In the context of autonomous driving, compared with the same travel demand, the overall travel time and number of vehicles required in option 1 were the smallest, and the travel time was also the shortest. Since option 3 was an all-slow road, the travel time of option 1 significantly increased, which was about 2.15 times that of option 1. Therefore, we believe that when planning and designing a new city, still controlling a certain number of slow- and medium-speed roads would be very beneficial to improve the peer efficiency of the whole block.
  • In the context of autonomous driving, even for the slow-guided type, its travel time and average speed were significantly better than those of the three road network models in the traditional driving mode. The average travel speed of option 3 was 1.3 times that of the traditional driving in option 1. Therefore, the use of slow roads all over the ground is a promising solution. This would greatly release the road space and provide a certain idea for the construction of an eco-city and a garden city.
In the future, with the continuous improvement and innovation of unmanned driving technology, subsequent studies on relevant planning strategies and impacts will be more targeted and instructive. A series of relevant studies should be carried out in combination with new opportunities and challenges in urban development, so as to promote the green, efficient operation and sustainable development of urban systems.

Author Contributions

Writing—original draft preparation, D.W.; methodology, T.S.; writing—review and editing, A.X.; software, Z.C. All authors have read and agreed to the published version of the manuscript.

Funding

This research received no external funding.

Institutional Review Board Statement

Not applicable.

Informed Consent Statement

Not applicable.

Data Availability Statement

Data are available from the corresponding author upon reasonable request.

Conflicts of Interest

The authors declare no conflict of interest.

References

  1. Schoettle, B.; Sivak, M. Motorists’ Preferences for Different Levels of Vehicle Automation; University of Michigan, Transportation Research Institute: Ann Arbor, MI, USA, 2015. [Google Scholar]
  2. Litman, T. Autonomous Vehicle Implementation Predictions: Implications for Transport Planning; Victoria Transport Policy Institute: Victoria, BC, Canada, 2020. [Google Scholar]
  3. Jing, P.; Hu, H.; Zhan, F.; Chen, Y.; Shi, Y. Agent-based simulation of autonomous vehicles: A systematic literature review. IEEE Access 2020, 8, 79089–79103. [Google Scholar] [CrossRef]
  4. Moody, J.; Bailey, N.; Zhao, J. Public perceptions of autonomous vehicle safety: An international comparison. Saf. Sci. 2020, 121, 634–650. [Google Scholar] [CrossRef]
  5. Wang, S.; Jiang, Z.; Noland, R.B.; Mondschein, A.S. Attitudes towards privatelyowned and shared autonomous vehicles. Transp. Res. Part F Traffic Psychol. Behav. 2020, 72, 297–306. [Google Scholar] [CrossRef]
  6. Salonen, A.O.; Haavisto, N. Towards Autonomous Transportation. Passengers’ Experiences, Perceptions and Feelings in a Driverless Shuttle Bus in Finland. Sustainability 2019, 11, 588. [Google Scholar] [CrossRef] [Green Version]
  7. Wiseman, Y. Autonomous vehicles. In Research Anthology on Cross-Disciplinary Designs and Applications of Automation; IGI Global: Hershey, PA, USA, 2022; pp. 878–889. [Google Scholar]
  8. Zhong, H.; Li, W.; Burris, M.W.; Talebpour, A.; Sinha, K.C. Will autonomous vehicles change auto commuters’ value of travel time? Transp. Res. Part D Transp. Environ. 2020, 83, 102303. [Google Scholar] [CrossRef]
  9. Hamadneh, J.; Esztergár-Kiss, D. Potential Travel Time Reduction with Autonomous Vehicles for Different Types of Travellers. Promet Traffic Transp. 2021, 33, 61–76. [Google Scholar] [CrossRef]
  10. Hoogendoorn, R.; van Arerm, B.; Hoogendoom, S. Automated driving, traffic flow efficiency, and human factors: Literature review. Transp. Res. Rec. 2014, 2422, 113–120. [Google Scholar] [CrossRef]
  11. Fernandes, P.; Nunes, U. Multiplatooning leaders positioning and cooperative behavior algorithms of communicant automated vehicles for high traffic capacity. IEEE Trans. Intell. Transp. Syst. 2014, 16, 1172–1187. [Google Scholar] [CrossRef] [Green Version]
  12. Childress, S.; Nichols, B.; Charlton, B.; Coe, S. Using an activity-based model to explore the potential impacts of automated vehicles. Transp. Res. Rec. 2015, 2493, 99–106. [Google Scholar] [CrossRef]
  13. Olia, A.; Razavi, S.; Abdulhai, B.; Abdelgawad, H. Traffific capacity implications of automated vehicles mixed with regular vehicles. J. Intell. Transp. Syst. Technol. Plan. Oper. 2018, 22, 244–262. [Google Scholar] [CrossRef]
  14. Bischoff, J.; Maciejewski, M. Autonomous taxicabs in Berlin—A spatiotemporal analysis of service performance. Transp. Res. Procedia 2016, 19, 176–186. [Google Scholar] [CrossRef]
  15. Boesch, P.M.; Ciari, F.; Axhausen, K.W. Autonomous Vehicle Fleet Sizes Required to Serve Difffferent Levels of Demand. Transp. Res. Rec. 2016, 2542, 111–119. [Google Scholar] [CrossRef] [Green Version]
  16. Hamadneh, J.; Esztergár-Kiss, D. Impacts of shared autonomous vehicles on the travelers’ mobility. In Proceedings of the 2019 6th International Conference on Models and Technologies for Intelligent Transportation Systems (MT-ITS), Kraków, Poland, 5–7 June 2019; pp. 1–9. [Google Scholar]
  17. Ortega, J.; Hamadneh, J.; Esztergár-Kiss, D.; Tóth, J. Simulation of the Daily Activity Plans of Travelers Using the Park-and-Ride System and Autonomous Vehicles: Work and Shopping Trip Purposes. Appl. Sci. 2020, 10, 2912. [Google Scholar] [CrossRef] [Green Version]
  18. Liu, J.; Jones, S.; Adanu, E.K. Challenging human driver taxis with shared autonomous vehicles: A case study of Chicago. Transp. Lett. 2020, 12, 701–705. [Google Scholar] [CrossRef]
  19. Nikitas, A.; Thomopoulos, N.; Milakis, D. The Environmental and Resource Dimensions of Automated Transport: A Nexus for Enabling Vehicle Automation to Support Sustainable Urban Mobility. Annu. Rev. Environ. Resour. 2021, 46, 167–192. [Google Scholar] [CrossRef]
  20. Patel, R.K.; Etminani-Ghasrodashti, R.; Kermanshachi, S.; Rosenberger, J.M.; Foss, A. Exploring willingness to use shared autonomous vehicles. Int. J. Transp. Sci. Technol. 2022, in press. [CrossRef]
  21. Soteropoulos, A.; Berger, M.; Mitteregger, M. Compatibility of Automated Vehicles in Street Spaces: Considerations for a Sustainable Implementation. Sustainability 2021, 13, 2732. [Google Scholar] [CrossRef]
  22. Zeng, Y.; Di, D.; Zhang, X. Study on a New Mobility Pattern Based on Autonomous Road Transportation System. In Proceedings of the 22nd COTA International Conference of Transportation Professionals, Changsha, China, 8–11 July 2022; pp. 757–768. [Google Scholar] [CrossRef]
  23. Hu, X.; Zheng, Z.; Chen, D.; Zhang, X.; Sun, J. Processing, Assessing, and Enhancing the Waymo Autonomous Vehicle Open Dataset for Driving Behavior Research. Transp. Res. Part C Emerg. Technol. 2022, 134, 103490. [Google Scholar] [CrossRef]
  24. Oke, J.B.; Akkinepally, A.P.; Chen, S.; Xie, Y.; Aboutaleb, Y.M.; Azevedo, C.L.; Zegras, P.C.; Ferreira, J.; Ben-Akiva, M. Evaluating the systemic effects of automated mobility-on-demand services via large-scale agent-based simulation of auto-dependent prototype cities. Transp. Res. Part A Policy Pract. 2020, 140, 98–126. [Google Scholar] [CrossRef]
  25. Horni, A.; Nagel, K.; Axhausen, K.W. The MultiAgent Transport Simulation MATSim; Ubiquity Press: London, UK, 2016. [Google Scholar]
  26. Ziemke, D.; Kaddoura, I.; Nagel, K. The MATSim Open Berlin Scenario: A multimodal agent-based transport simulation scenario based on synthetic demand modeling and open data. Procedia Comput. Sci. 2019, 151, 870–877. [Google Scholar] [CrossRef]
  27. Balac, M.; Hörl, S. Simulation of intermodal shared mobility in the San Francisco Bay Area using MATSim. In Proceedings of the 2021 IEEE International Intelligent Transportation Systems Conference (ITSC), Indianapolis, IN, USA, 19–22 September 2021; pp. 3278–3283. [Google Scholar]
  28. Lécureux, B.; Kaddoura, I. Sensitivity of the urban transport system to the value of travel time savings for shared autonomous vehicles: A simulation study. Procedia Comput. Sci. 2021, 184, 686–691. [Google Scholar] [CrossRef]
  29. Khan, M.A.; Etminani-Ghasrodashti, R.; Shahmoradi, A.; Kermanshachi, S.; Rosenberger, J.M.; Foss, A. Integrating Shared Autonomous Vehicles into Existing Transportation Services: Evidence from a Paratransit Service in Arlington, Texas. Int. J. Civ. Eng. 2022, 20, 601–618. [Google Scholar] [CrossRef]
  30. Wang, K.; Zhang, W. The role of urban form in the performance of shared automated vehicles. Transp. Res. Part D Transp. Environ. 2021, 93, 102744. [Google Scholar] [CrossRef]
  31. Zheng, L.; Wei, W.; Xu, W.; Cai, M. A Framework to Elicit User Needs of Autonomous Transportation System Based on Activity Theory. In Proceedings of the 22nd COTA International Conference of Transportation Professionals, Changsha, China, 8–11 July 2022; pp. 34–44. [Google Scholar] [CrossRef]
  32. Chouaki, T.; Hörl, S.; Puchinger, J. Implementing reinforcement learning for on-demand vehicle rebalancing in MATSim. Procedia Comput. Sci. 2022, 201, 134–141. [Google Scholar] [CrossRef]
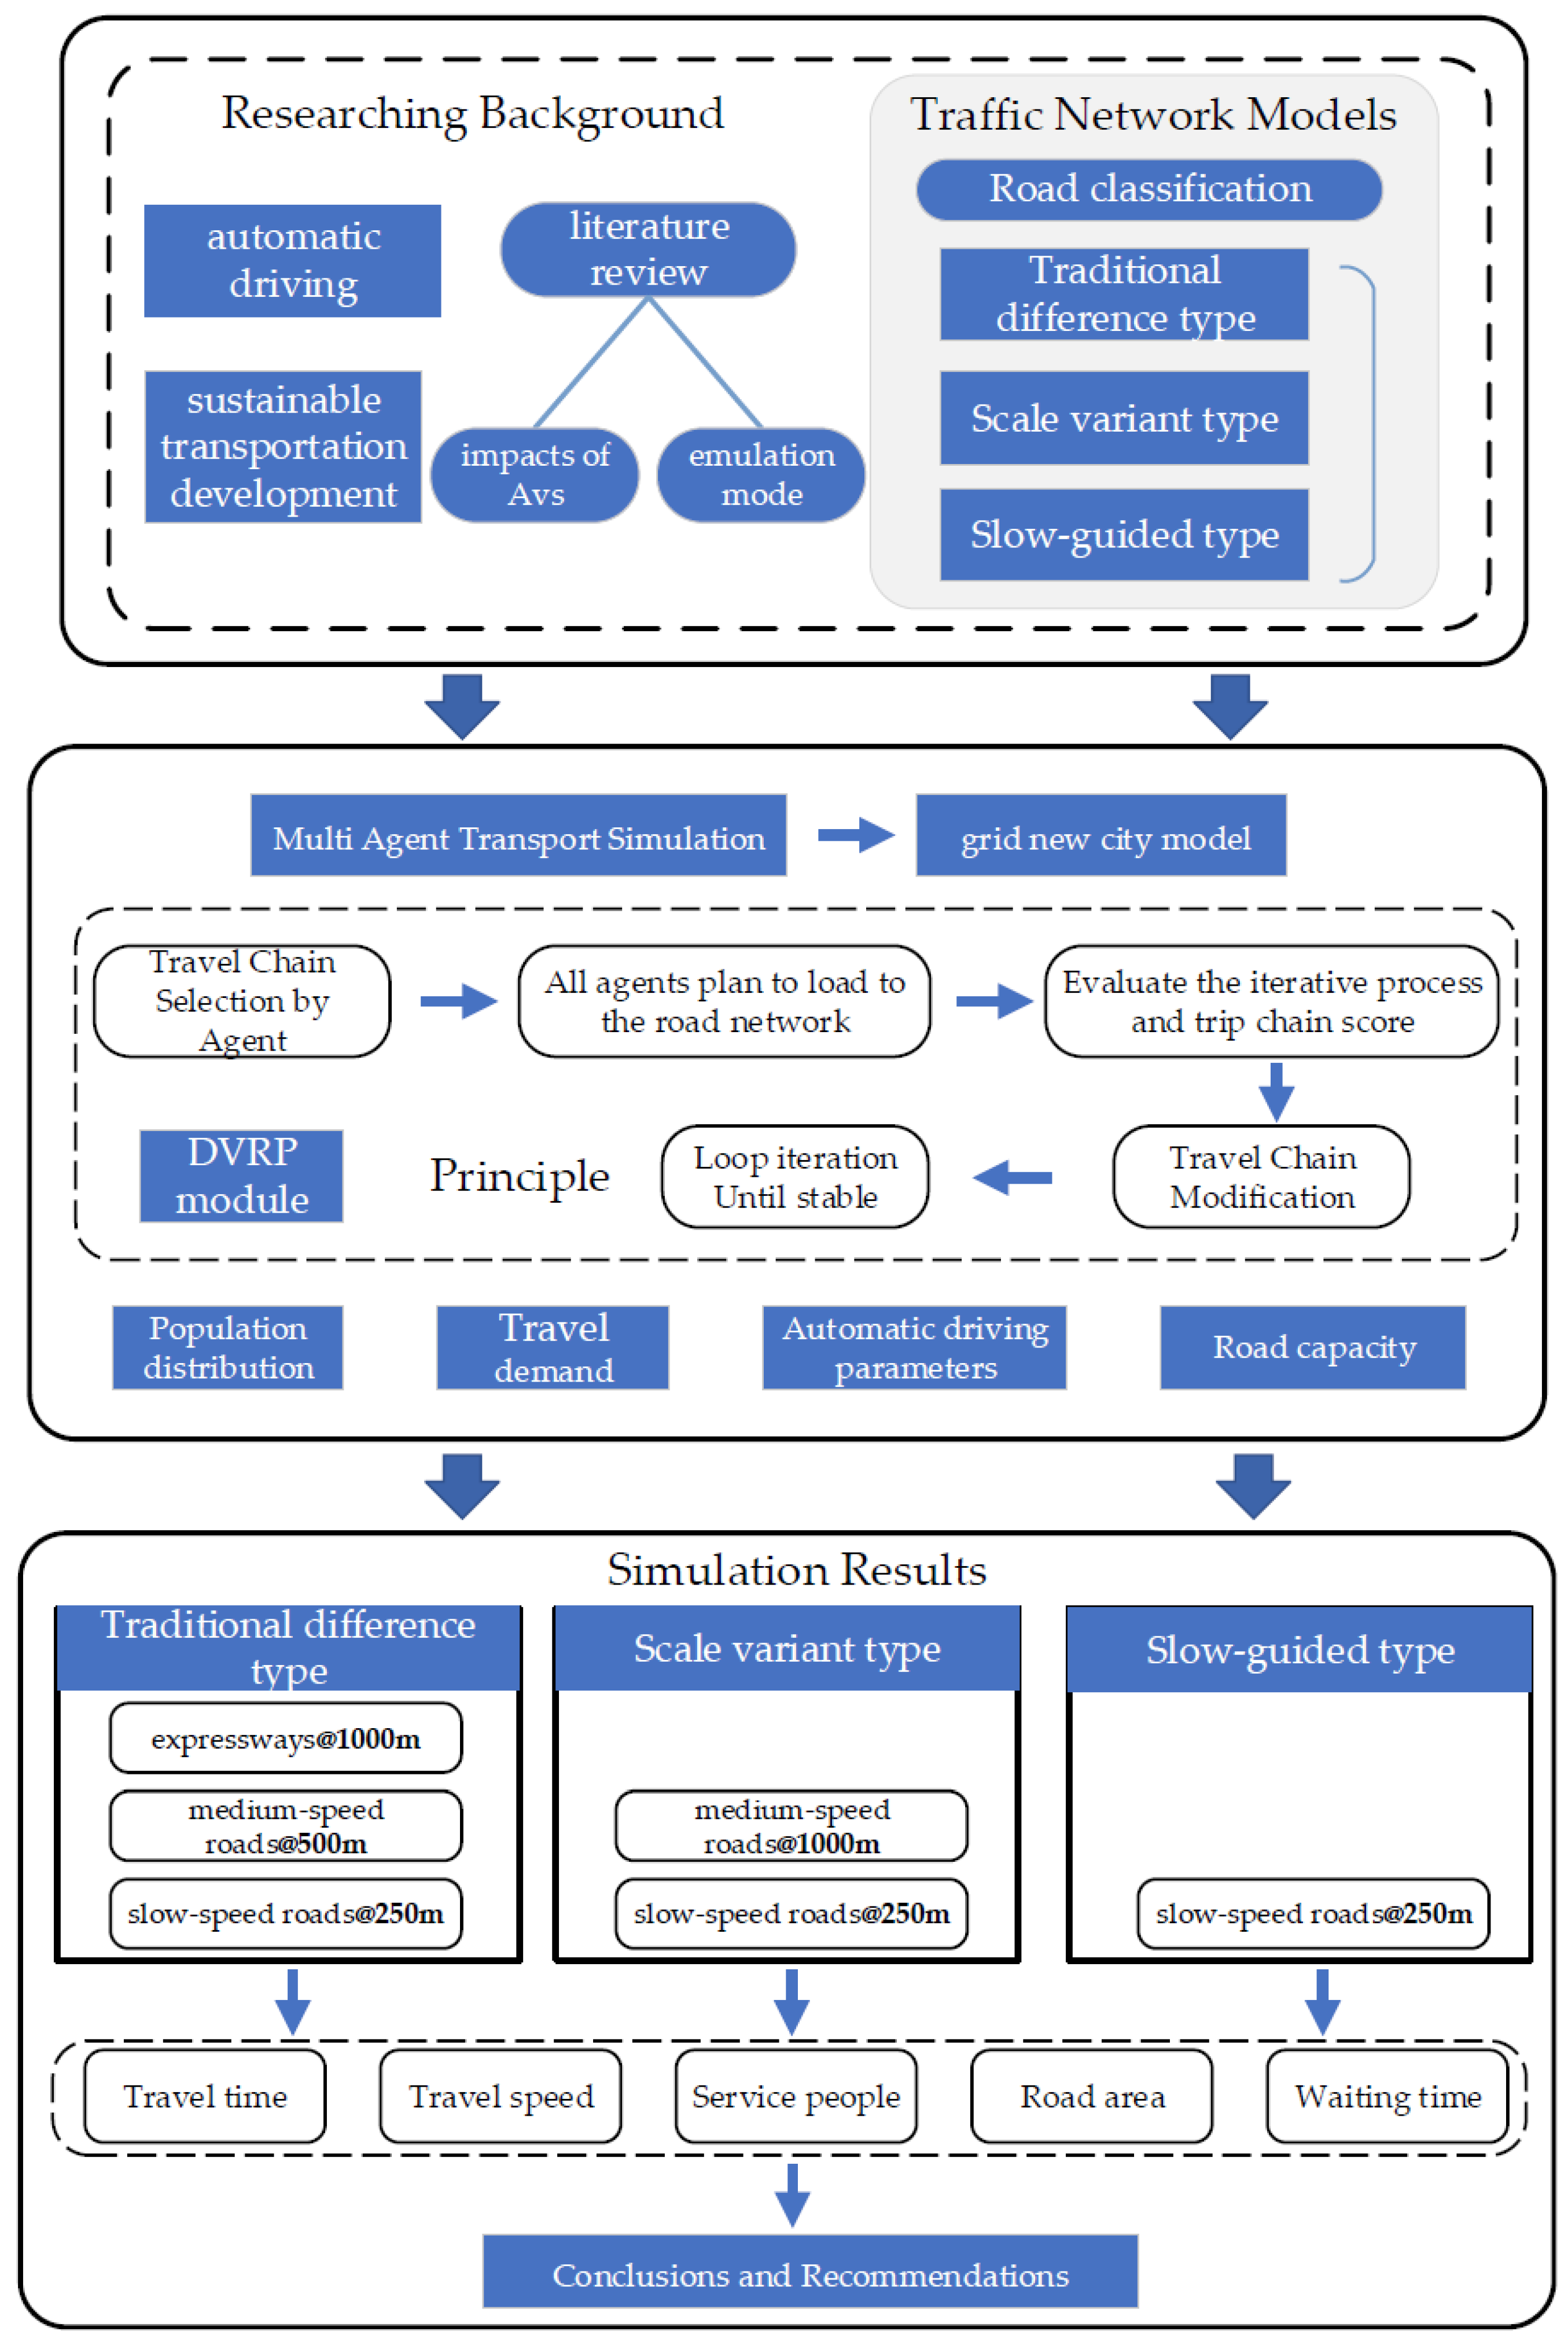
Figure 1. Figure of technical route.
Sustainability 15 01535 g001
Figure 2. Schematic diagram of the Option 1 traffic network.
Sustainability 15 01535 g002
Figure 3. Schematic diagram of the Option 2 traffic network.
Sustainability 15 01535 g003
Figure 4. Schematic diagram of the Option 3 traffic network.
Sustainability 15 01535 g004
Figure 5. Schematic diagram of the MATSim algorithm flow.
Sustainability 15 01535 g005
Figure 6. Operation time distribution of different vehicle fleet sizes: (a) 3000 vehicles, (b) 4500 vehicles, (c) 6000 vehicles, (d) 7500 vehicles.
Sustainability 15 01535 g006
Figure 7. Comparison diagram of autonomous and traditional driving in Plan 1.
Sustainability 15 01535 g007
Figure 8. Comparison diagram of autonomous driving in Plans 1 and 2.
Sustainability 15 01535 g008
Figure 9. Comparison diagram of autonomous driving in Plan 3 and traditional driving in Plan 1.
Sustainability 15 01535 g009
Figure 10. Comparison diagram of autonomous driving Plan 1 and traditional driving Plan 3.
Sustainability 15 01535 g010
Figure 11. Comparison chart of autonomous driving in different scenarios.
Sustainability 15 01535 g011
Table 1. Comparison table of the parameters of the three network types.
ModelsNetwork ShapeRoad Grade ClassificationRoad Grade TypeRoad
Spacing (Meters)
PositionStandard Lane Number
(One-Way)
Design Speed (Kilometers per Hour)
Traditional difference typesquare grid3expressways1000underground380–100
medium-speed roads500ground240–60
slow-speed roads250ground115–20
Scale variant typesquare grid3expressways1000underground380–100
medium-speed roads1000ground240–60
slow-speed roads250ground115–20
Slow-guided typesquare grid2expressways1000underground380–100
slow-speed roads250ground115–20
Table 2. List of services for different vehicle fleet sizes.
Size of Vehicle FleetNumber of Service TripsAverage Waiting Time (Minutes)
300064,9586.9
450076,8985.75
600080,0002.5
750080,0001.9
Table 3. Comparison table of autonomous and traditional driving under Scenario 1.
ModelService GroupsMean Travel Distance (Kilometers)Average Waiting Time
(Minutes)
Mean Travel Time
(Minutes)
The Average Velocity (Kilometers per Hour)
Traditional driving59,8323.169.3620.989.04
Autonomous driving80,0003.082.517.0525.36
Table 4. Comparison table of autonomous and traditional driving under Scenario 2.
ModelService GroupsMean Travel Distance (Kilometers)Average Waiting Time
(Minutes)
Mean Travel Time
(Minutes)
The Average Velocity (Kilometers per Hour)
Traditional driving55,4413.249.623.28.29
Autonomous driving79,3923.134.7110.7217.49
Table 5. Comparison table of autonomous and traditional driving under Scenario 3.
ModelService GroupsMean Travel Distance (Kilometers)Average Waiting Time
(Minutes)
Mean Travel Time
(Minutes)
The Average Velocity (Kilometers per Hour)
Traditional driving46,6103.1310.0727.356.87
Autonomous driving69,3253.106.8415.7311.81
Table 6. Service level comparison table of different schemes.
Transportation Network SchemeModelService GroupsArea of
Motor
Vehicle Lane (Square Kilometers)
ProportionMean Travel
Distance (Kilometers)
Average Waiting Time
(Minutes)
Mean Travel Time
(Minutes)
The
Average Velocity (Kilometers per Hour)
Plan 1traditional driving59,8321.469.10%3.169.3620.989.04
autonomous driving80,0001.046.50%3.082.517.0525.36
Plan 2traditional driving55,4411.237.70%3.249.623.28.29
autonomous driving79,3920.885.50%3.134.7110.7217.49
Plan 3traditional driving46,6100.955.95%3.1310.0727.356.87
autonomous driving69,3250.684.25%3.106.8415.7311.81
Note: The traditional driving lane was 3.5 m/lane, and the autonomous driving lane was 2.5 m/lane.
Disclaimer/Publisher’s Note: The statements, opinions and data contained in all publications are solely those of the individual author(s) and contributor(s) and not of MDPI and/or the editor(s). MDPI and/or the editor(s) disclaim responsibility for any injury to people or property resulting from any ideas, methods, instructions or products referred to in the content.