Article

Assessment of Influence Mechanisms of Built Environment on Street Vitality Using Multisource Spatial Data: A Case Study in Qingdao, China

College of Geography and Environmental Science, Northwest Normal University, Lanzhou 730070, China
*
Author to whom correspondence should be addressed.
Sustainability 2023, 15(2), 1518; https://doi.org/10.3390/su15021518
Submission received: 9 November 2022 / Revised: 8 January 2023 / Accepted: 10 January 2023 / Published: 12 January 2023

Abstract

:
Street vitality is a significant indicator of a city’s capacity for sustainable development. Significant progress has been made on the basis of measurements of a single indicator of street vitality, but few studies have used multisource data to measure street vitality in a comprehensive way. In this study, in order to explore the multidimensional vitality characteristics of streets, streets were taken as the analysis unit, and the Technique for Order Preference by Similarity to an Ideal Solution (TOPSIS) evaluation model with combined weights was used to identify the spatial pattern of streets vitality from social, economic, and cultural dimensions using multisource spatial data such as Baidu heat map, Meituan store rating, and cultural facilities points of interest in the main urban area of Qingdao City, China. Using a Multiscale Geographically Weighted Regression (MGWR) model, the spatial correlations and differences between street built environment components and multidimensional street vitality were examined, to reveal the influence mechanism of street vitality creation in each street. The study found that the comprehensive vitality of the streets in the main urban area of Qingdao City exhibits the spatial differentiation features of “weak east–west, strong central, multicenter, cluster type”. Furthermore, although commercial and public services are essential for enhancing street vitality and attracting crowds, a very high degree of functional mix has not resulted in a high degree of street vitality. Lastly, high spatial heterogeneity between built environment factors and street vitality necessitates considering the functional positioning and development basis of the street, tailoring to local conditions and policies, considering the street’s vitality development status and development needs, complementing strengths, promoting coordinated development, and releasing and enhancing the street’s vitality. Therefore, it is essential to explore street vitality and its influencing mechanisms to improve people’s quality of life and promote sustainable urban development.

1. Introduction

Urbanization has the advantages of improving the living environment and driving regional economic development [1]. The world is undergoing a process of urbanization. A new urban era has dawned, and it is conceivable that global urbanization levels will reach as high as 70% in the next 40 years. Sustainable urban development is one of the most serious challenges facing human society in the 21st century. As more and more people settle in cities, they will face the world’s greatest challenges at every level [2]. Stiglitz, the Nobel laureate in economics, predicted that China’s urbanization would be one of the two engines driving the world economy in the 21st century [3]. While China has made tremendous progress in urbanization, cities have experienced the serious aftermath of the mismatch between limited resources and the economy and population, the accumulation of various short-term behaviors, and the unreasonable configuration of urban infrastructure. In this regard, the general consensus has become to shift the focus of urbanization to the quality of life of the population and the quality of urban construction, and the development goal has become a new type of people-oriented urbanization [4]. How China’s urbanization has changed from “quantitative growth and scale expansion” to “quality improvement and efficiency enhancement”, as well as the fine-grained transformation of the urban spatial pattern in China, has received much attention [5].
With the increasingly frequent flow of people, materials, and information in cities, the characteristics of urban residents’ activities and production and lifestyle have become more complex and varied. Meanwhile, the disorderly expansion of urban space and inadequate development planning has led to a series of problems such as traffic congestion, population loss, and lack of public space, which eventually led to the problem of urban vitality dissipation and the lack of vitality in urban development has become a growing concern [6]. Street unit is an integral part of a city, and street vitality is an important factor to evaluate whether a city has vitality or not. The study of street vitality plays a key role in optimizing and improving urban vitality, and also provides a new perspective for the investigation of urban vitality, and can provide important theoretical reference significance for subsequent street planning research. Street vitality is an indicator of the level of urban development and a comprehensive embodiment of the quality of urban development [7]. Jacobs [8] was the first to introduce the concept of street vitality, rethink modern urban planning led by streets, and propose a theory of urban diversity. Lynch [9] used vitality as the primary indicator for evaluating the quality of urban spatial form. Maas [10] argued from a fine-grained perspective that street vitality has become an important indicator for assessing the attractiveness and potential for the sustainable development of urban communities. Calthorpe [11] proposed New Urbanism in response to a series of urban problems brought about by the sprawl and rapid expansion of cities. The core idea of this theory is that streets are defined as elements that constitute the basic architecture of the city, and that vitality is a necessary component of the street. Mouratidis [12] stated that vibrant cities and streets improve the residents’ wellbeing and social cohesion. In this context, streets are considered to be the most important public spaces in cities, with relatively independent functions and environments, and enhancing street vitality has become a rising goal [13].
Urban morphologists believe that street vitality can be understood as an activity based on street spatial patterns, where the built environment shapes and influences the life and activities of the city [14,15]. The built environment includes a variety of buildings and places created by manmade construction and renovation within the city limits [16]. The construction of and change in street vitality in the functioning of society are influenced and conditioned by the built environment that hosts human activities. The street built environment itself does not directly create vitality, but rather provides a place to accommodate and influence people’s activities [17]. How to enhance street vitality through built environment creation is also a hot topic of concern among scholars. Scholars claim that built environment characteristics, such as building density, accessibility, and transportation networks, have a significant influence on street vitality [15,18,19,20,21], providing guidance and practically meaningful recommendations and strategies for creating vibrant urban spaces.
Previous work on street vitality and physical indicators of the built environment typically involved qualitative and descriptive studies, including field surveys, questionnaires, and cognitive maps [22], lacking timeliness and scale. Jalaladdini [23] conducted a literature survey and questionnaire survey to analyze the street vitality of Salamis Street in Famagusta and Ziya Rızkı Street in Kyrenia, Cyprus, as well as its influencing factors. Zarin [24] investigated the vibrancy level of two streets in Tehran through a questionnaire. Fortunately, with the advent of the new era of Internet technology, big data have become a hot spot for academic research and practical activities in various industries. The new data environment has overcome the limitations of traditional research. Cell phone data, characterized by wide spatial coverage, real-time data collection, and continuous user tracking, have become an ideal data source for studying street vitality at the microlevel [25,26,27]. Sung [28] constructed a multilevel regression model to explore the correlation between the pedestrian environment and the built environment, using Seoul streets as an example and pedestrian activity as the dependent variable. Wu [29] used mobile location data as a proxy for street vitality, and we used an OLS model to examine whether there is a correlation between street vitality and the built environment in the high-density West Nanjing Road in Shanghai City. Liu [30] used Tencent location service data to characterize street vitality in Tianhe District, Guangzhou City, and then used Ordinary Least Squares (OLS) and Geographically Weighted Regression (GWR) models to construct a statistical relationship between the built environment and street vitality.
Taken together, these studies found that it has become a trend in today’s research to explore the distribution characteristics and influence mechanisms of street vitality at a finer scale, using the street as the analysis unit [31]. However, studies using multisource spatial data to measure the multidimensional streets vitality in an integrated manner are still limited and only discuss the regression coefficients of influence mechanisms based on traditional multiple linear regression models, lacking research on their spatial heterogeneity [32]. GWR models can successfully explore the spatial parameter variations of local modeling and are widely used in studies such as urban development. However, the GWR model does not consider spatial scale benefits, and all indicators are influenced by the same spatial scale [33]. Therefore, using multisource spatial big data to comprehensively measure the multidimensional street vitality and to explore the extent to which built environment factors influence street vitality is a hot direction for future research.
In this study, we examined two research questions: (1) What are the spatial distribution characteristics of multidimensional street vitality? (2) How does the relationship between the built environment and street vitality at the street level manifest under different spaces? We chose Qingdao City, China as the study area, took streets as the study unit, used social, economic, and cultural vitality as evaluation indicators [6], revealed the spatial distribution of street vitality in social, economic, and cultural dimensions, established a comprehensive evaluation system, and used big data for a comprehensive evaluation and ranking according to the Technique for Order Preference by Similarity to an Ideal Solution (TOPSIS) method. In this context, the introduction of Multiscale Geographically Weighted Regression (MGWR) models overcomes the limitations of OLS global regression models and GWR to effectively address the problem of spatial non-smoothness [34] and to quantitatively explore the mechanism of examining street vitality and the influence of built environment on it at a finer spatial scale. This research aims to (1) reveal the multidimensional distribution characteristics of street vitality at a fine spatial scale and explore the differences between different functional streets in conjunction with the functional nature of streets, so as to identify the basis for street vitality creation, and (2) explore the correlation between street vitality and street built environment, reveal the influence mechanism of each street vitality creation, and provide more comprehensive insight into the formation of street vitality. The objective of this research is to provide better guidance for urban planning practice and for improving street vitality in a large number of emerging cities around the world, promoting healthy and sustainable people-centered urban development.

2. Study Area, Data, and Methods

2.1. Study Area

Qingdao City is known as a “vibrant marine city and a wonderful city for people”. Qingdao City has excellent socioeconomic conditions and is the economic center of Shandong Province, a sub-provincial mega-city and an international port city. Qingdao City has significant geographical advantages, located in East China, east of the Yellow Sea, is an international shipping hub in Northeast Asia, the maritime sports base, the main node city of the Belt and Road Initiative New Asia-Europe Continental Bridge economic corridor and the strategic pivot point of maritime cooperation. At the same time, Qingdao City, the origin of the May Fourth Movement and the national historical and cultural city, has a wide variety of exotic architecture and is called the “Universal Architecture Fair”, which is the city of modern civilization showing the cultural strength of the country. The main urban area is the core area of Qingdao City, bearing the political, economic, and cultural center of the city, with a variety of functions such as political exchange, finance, and commerce, industrial production, living services, education services, cultural tourism, etc. The high degree of crowd gathering and significant changes in vitality are conducive to the evaluation and analysis of vitality in this paper. The main urban area of Qingdao City was selected as the research object, with a population of about 3.6 million and an area of 1177 square kilometers. As shown in Figure 1, Qingdao City’s main urban areas are the five districts of Shinan, Shibei, Licang, Laoshan (removing the nature reserve part), and Chengyang, which are the most important dynamic gathering areas in Qingdao City [35]. The administrative data were obtained from the National Basic Geographic Information Center (“http://www.ngcc.cn/ (accessed on 11 November 2021)”).
From 1978 to the present, Qingdao City has grown rapidly from a former fishing village by the sea to a world-renowned international metropolis. Rapid urbanization has brought great challenges to the sustainable development of the city, and it is urgent for Qingdao City to change from the process of urbanization growth rate to the stage of urbanization quality development. In the critical period of urban development transformation, exploring the characteristics of street vitality is conducive to the creation of local vitality and overall vitality enhancement of the city. Therefore, this study used streets as the study unit, which was generated by road segmentation and modified on the basis of high-resolution remote sensing images, rivers, and natural feature distribution, and the study area was divided into 3415 streets with an average unit size of 0.21 km2.

2.2. Study Data

The data used in this study mainly included basic geographic data and web open-source data, which were obtained through government department applications, official website downloads, and web crawlers, as shown in Table 1.

2.2.1. Open Street Map (OSM)

OSM data have good integrity but need to be experimentally preprocessed to generate road data with topological relationships. For the OSM data, firstly, the highways, main roads, primary roads, secondary roads, tertiary roads, and some residential roads in the OSM road network were screened out, and the topology of the road network was processed, pruning the overhanging roads and independent road sections in the road network. Secondly, buffers of different distances were generated according to the different levels of urban roads, and then the road space was built. Lastly, combined with vector data of the main urban area of Qingdao City, independent plot units were generated, and the road space was removed from the study area to eliminate the street units that were too small to perform socioeconomic functions [36].

2.2.2. Points of Interest (POI)

We used the Application Programming Interface (API) of Gaode Map and python crawler technology to obtain the POI data of the main urban area of Qingdao City in January 2022. After the initial screening process, 116,000 valid data were obtained, from which 749 cultural facilities such as science and technology museums and art museums were selected. According to The Urban Land Classification and Planning for Construction Land Standard [37] and the actual situation of Qingdao City, the POI level 1 classification was divided into six major categories: residential land, commercial land, industrial land, public service land, scientific, educational and cultural land, and green space and square land (Table 2).

2.2.3. Baidu Heat Map Data

The Baidu heat map is a type of Internet open-source data that can dynamically reflect the characteristics of urban population gathering, which can effectively reduce the cost of data analysis and make up for the lack of temporal scale and dynamism in traditional population data. Existing studies have shown similar results for the analysis of weekday heat map characteristics from Monday to Friday, along with similar travel behavior of residents on Saturday and Sunday rest days [38]. Therefore, the Baidu heat map for the main urban area of Qingdao City on 6 April 2022 (working day) and 10 April 2022 (rest day) was selected as the data source, and the data for these 2 days were not affected by unexpected events such as major events and extreme weather, thus being representative. Baidu map heat map time intervals were 7:00 a.m.–12:00 p.m., generated every hour for a total of 38.

2.2.4. Meituan Store Rating Data

As a third-party consumer review website, the Meituan network has a huge number of users and accumulated rating data over the years, which makes the store rating data representative. The store rating data of different industries in the main urban area of Qingdao City, including 11 industry categories (e.g., food, leisure, entertainment, hotel, sports, fitness, life service, medical, and health) were obtained. Since some stores in the original data had no ratings or a very low number of ratings, in order to ensure the objectivity of the data, those stores with fewer than 10 ratings were eliminated, and a total of 19,000 valid ratings were finally obtained for the study area, which were divided into three categories: leisure and entertainment, living services, and education and training, considering the different radiation ranges of different stores.

2.2.5. Building Profile Data

Python crawler technology was used to obtain the data of Gaode buildings in the main urban area of Qingdao City, constituting about 240,000 pieces, including the number of floors, building height, and other attributes.

2.3. Methods

To achieve the research objectives, we established a research framework (Figure 2), including two major parts: (1) the measurement of street vitality by combining multisource spatial big data; (2) the introduction of the MGWR model to explore the mechanism of built environment’s influence on street vitality.
Table 3 presents the nomenclature for the parameters in the formulas closely related to this study to give the reader a better understanding of the methods used in this paper.

2.3.1. FD-CR Model

The POI data were used to divide the main urban area of Qingdao City into functional areas, and the functional area identification model [39] was constructed as shown in Equations (1) and (2):
F i = n i N i
C i = F i i = 1 n F i
where Fi is the frequency density of POI category i, i is the number of POI categories (i = 1, 2, 3, 4, 5, 6), ni is the number of POI category i in the street units, Ni is the total number of POI category I, and Ci is the proportion of POI category i functional type, which is the proportion of the frequency density of POI category i in the street to the frequency density of all POI categories in the street.
The FD-CR model was used to determine the functional type of a street unit by setting the type ratio value of 50% as the threshold value. When the size of the type ratio value of a certain type of POI in a street unit was 50% or more, the street unit was classified as a single function, and the type was used as the main function of the street unit; when the type ratio of all types of POI in the street unit was less than 50%, the street unit was classified as mixed function, and the first two POI types with higher type ratio values in the street unit were used as the main function of the street unit; and when the street unit did not have any type of POI, the type ratio value was empty, and the street unit was classified as unclassified. After the initial identification of street function types according to the FD-CR model, the final identification results of street functions were obtained by recalibration using high-definition satellite remote sensing images.

2.3.2. Measure of Street Vitality

For the measurement of street vitality, separate quantitative assessments were performed using social vitality, economic vitality, and cultural vitality. Economic vitality is the basis of street vitality and a prerequisite for generating vitality; social vitality is the core of street vitality and a concrete expression of vitality; and cultural vitality is the connotation requirement of street vitality [6]. Street social vitality is closely related to residents’ activities and trips, and drawing on existing studies and considering the nature of the data [40,41], Baidu heat map data were selected to measure social vitality. Using Meituan store rating data to measure economic vitality, the spatial association of stores with specific streets through the latitude and longitude coordinates of Meituan rating data stores was followed by a kernel density estimation algorithm based on the diffusion of rating influences to quantify the economic activities people perform in streets. Cultural vitality was measured using the POI nuclear density of cultural facilities, where cultural facilities include art galleries, museums, planetariums, libraries, cultural palaces, theaters, concert halls, exhibition halls, and convention centers in the region. Lastly, in order to make the scale uniform, the street economic, social, and cultural vitality values were standardized, and the objective weights of the indicators were measured by evaluating the contrast intensity, conflict, and dispersion of the indicators. In order to make the combined weights as close as possible to the two weights, the combined weights were obtained according to the principle of minimum discriminative information. The TOPSIS evaluation model with combined CRITIC and entropy weights was used for comprehensive evaluation. Hwang and Yoon (1981) first proposed the TOPSIS method in 1981, which ranks finite evaluation objects according to their proximity to an idealized target by measuring their distance from the optimal and inferior solutions [42]. The combined use of the CRITIC method, entropy weighting method, and TOPSIS method can effectively overcome the shortcomings of the traditional TOPSIS method, which cannot reflect the correlation between variables and bias toward a certain indicator; the inverse order problem can also be effectively avoided by dimensionless processing. The combined weights were calculated as follows [43]:
w j = α j β j j = 1 n α j β j
where Wj is the combined weight of the j-th indicator, αj is the weight obtained using the CRITIC method, and βj is the weight obtained using the entropy weight method.

2.3.3. Measurement of Street Built Environment

Considering the variables used in existing studies and the 5D urban built environment indicators proposed by Cervero [44] and Ewing [45], the urban built environment was measured in five aspects: density, design, diversity, distance to transit, and destination accessibility (Table 4).

2.3.4. K-Means Clustering

As a type of unsupervised learning, cluster analysis is a data categorization technique that groups observations by similarity, making observations in the same cluster as similar as possible. K-means clustering is one of the two most commonly used clustering methods. A key issue in this method is how to choose the number of clusters K [46]. The most commonly used method is the contour coefficient method combined with the Sum Squared Error (SSE). The average contour coefficient is obtained by finding the contour coefficients of all samples and then averaging them. The closer the distance of the samples within the cluster and the farther the distance of the samples between the clusters are, the larger the average contour coefficient and the better the clustering effect is. Thus, the k with the largest average contour coefficient is the optimal number of clusters. SSE is the clustering error of all samples, which represents the success of clustering between clusters.

2.3.5. Getis–Ord Gi* Hotspot Index

The Getis–Ord Gi* hotspot index [47] is a spatial clustering method proposed by J. Keith Ord of the McDonough School of Business at Georgetown University and Arthur Getis of the Department of Geography at San Diego State University; the method identifies hot and cold spots of significance by analyzing the location of high- and low-value elements clustered in space. It considers not only the number of elements, spatial location, and neighboring elements but also spatial units’ data attributes and weights. It is now widely used in the research of economic geography, traffic accident analysis, population distribution, town development, etc.

2.3.6. Multiscale Geographically Weighted Regression Model

Brunsdon [48] introduced spatial location information into the regression model and proposed the GWR model to weight regression on the basis of the spatial properties of the data, meaning that the GWR model can allow for spatial variation in the relationship between the dependent and independent variables. Although the GWR model can deal with spatial heterogeneity, all independent variables have the same spatial scale (bandwidth), which can easily lead to unrobust regression results. The emergence of MGWR models overcame this problem [49]. MGWR supports that each independent variable has an appropriate and independent bandwidth, that the bandwidth of a variable reflects the magnitude of the spatial effect of that variable on the dependent variable, and that the spatial process model constructed using the multibandwidth approach is more effective and realistic. In order to avoid the model being unstable and, thus, affecting the analysis results due to the consistent scale of influence of the independent variables, the MGWR model was used to explore the difference in the scale of influence between the independent variables and street vitality, and the results were compared with the classical GWR model to select a better model to analyze the main influencing factors of street vitality.
M G W R : y m = n = 1 k β b w n ( μ m , ν m ) x m n + ε m
where ym is the response variable, xmn is the covariate, βbwn represents the n-th local regression coefficient with MGWR bandwidth bw, (um,vm) represents the spatial geographic location of the sample points, and εi is the model regression residual.

3. Results

3.1. Spatial Characteristics of Street Vitality in the Main Urban Area of Qingdao City

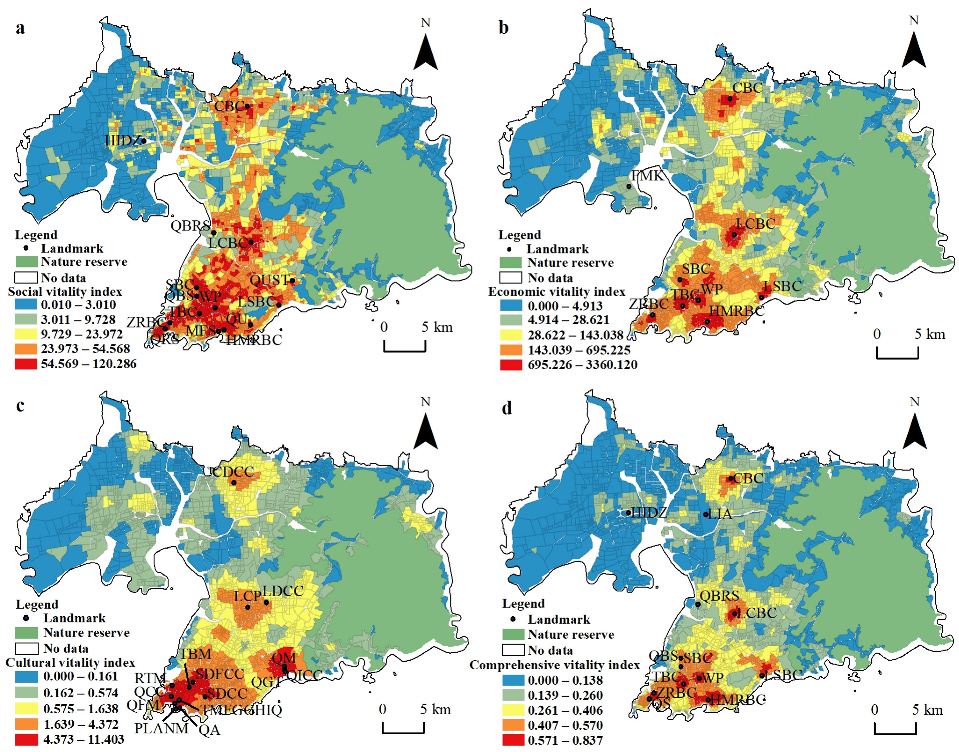
The natural breakpoint method was used to classify the values of comprehensive vitality, economic vitality, social vitality, and cultural vitality in the main urban area of Qingdao City, and the distribution of various types of street vitality in the main urban area of Qingdao City was obtained. The comprehensive vitality of the streets in the main urban area of Qingdao City showed the spatial differentiation characteristics of a “weak east–west, strong central, multicenter, cluster type”, and the spatial distribution was extremely uneven (Figure 3). The overall performance of comprehensive vitality decreased outward from each business circle. The areas with higher comprehensive vitality were usually distributed in a strip along the central part of the main urban area of Qingdao City, while the eastern part of Chengyang district had lower comprehensive vitality. High-value areas of social vitality were more dispersed and not just confined to central areas. The higher values of economic vitality were concentrated in the downtown area, mainly in the area of commercial activity centers. The distribution of high-value areas of cultural vitality was more concentrated, often culturally related to historical and scenic preservation areas and expo areas.
Due to urban planning and natural development, streets exhibit different functional types, and, due to the different activities they carry, different functional types of streets show different characteristics of changing vitality levels. On the basis of the results of the FD-CR model’s identification of street functions, we explored the dynamic characteristics of different functional streets. According to the mean vitality values of different functional streets (Figure 4), it can be seen that there were large differences in vitality among different functional types of streets.
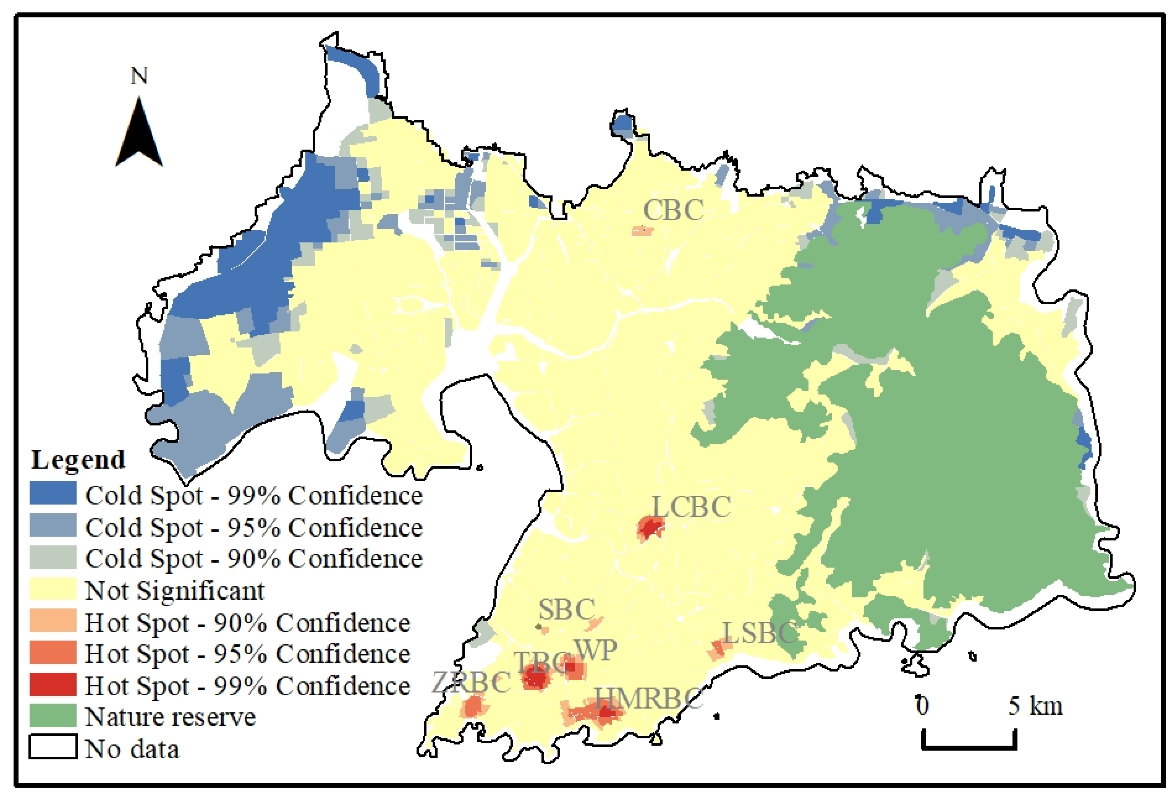
Using the Getis–Ord Gi* hotspot index to further identify the vitality poles in the study area (Figure 5), the spatial distribution of the identified vitality poles was essentially the same as the low and high-value areas of the combined street vitality. Qingdao City, with the main urban area to Zhongshan Road Street, Taidong business district, and LiCun business district as the core to form a large dynamic pole, as well as the smaller vitality pole of the Chengyang and Laoshan central business circle, is breeding vitality.

3.2. Spatial Distribution of Various Types of Dynamic Areas

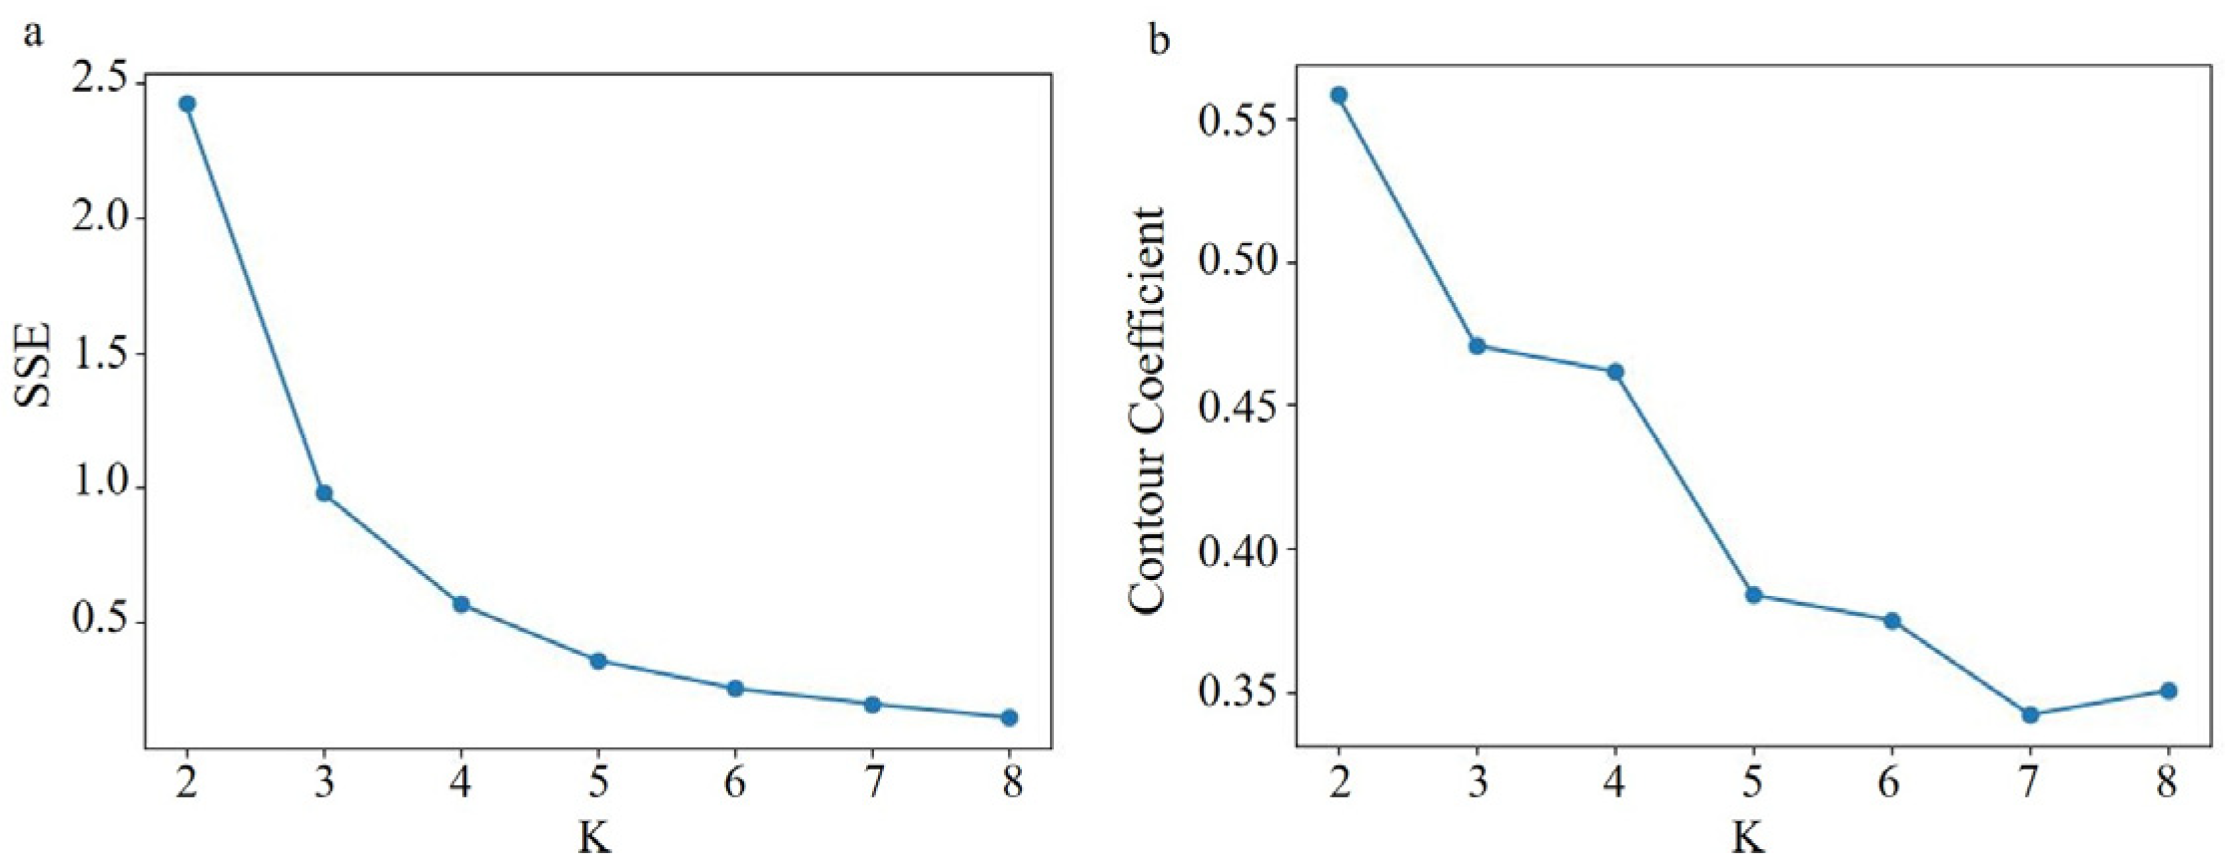
From Figure 6b, it can be seen that the maximum value of k for the contour coefficient was 2. However, it is worth noting that, as shown in Figure 6a, the SSE was still very large when k was taken as 2, which is a less reasonable number of clusters. Therefore, it is necessary to retreat and consider the k values as 3 and 4 with larger contour coefficients when the SSE is already at a lower level. Accordingly, the best clustering coefficient was taken from k values of 3 and 4 instead of 2.
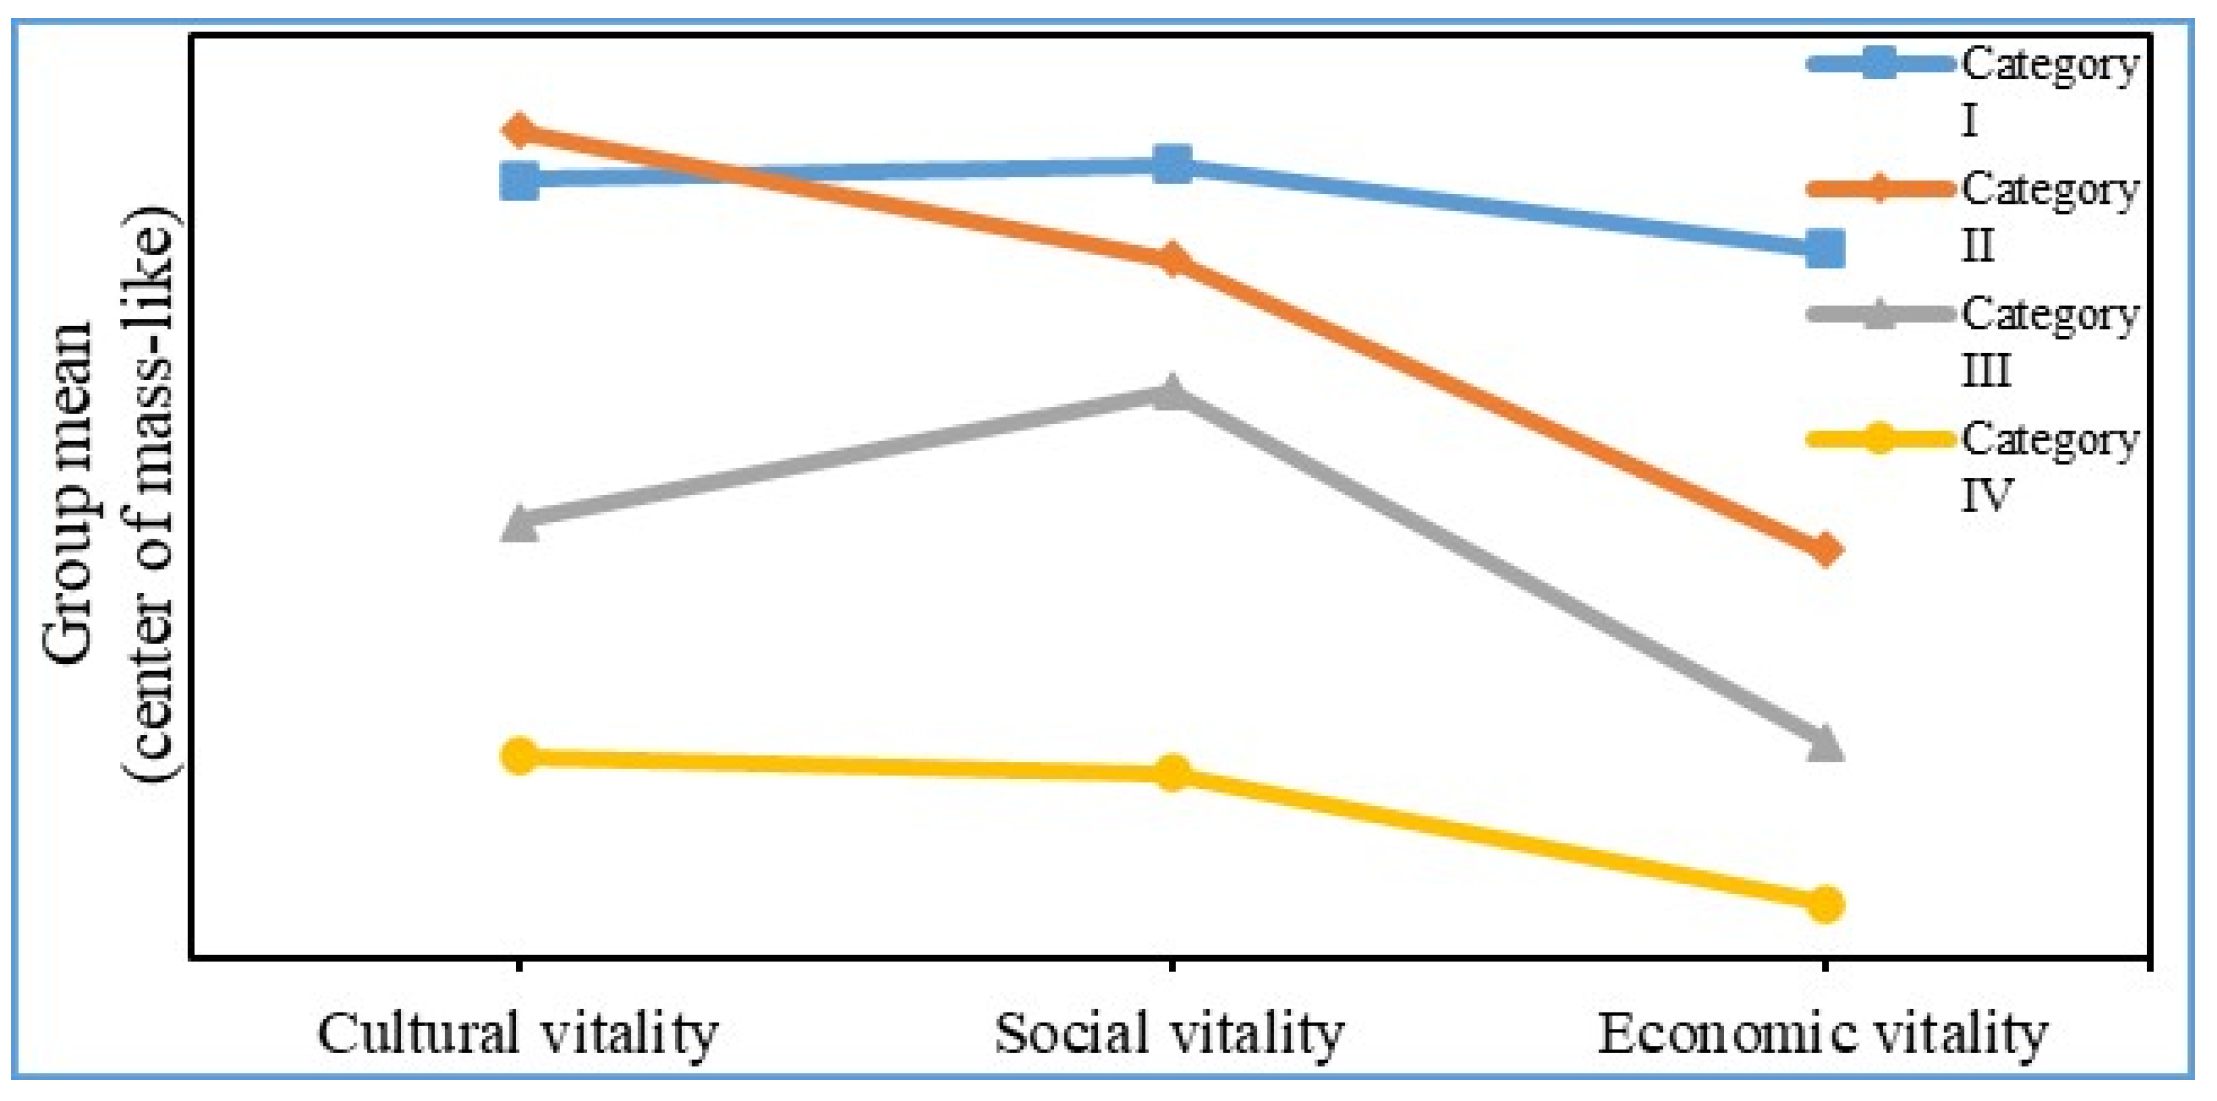
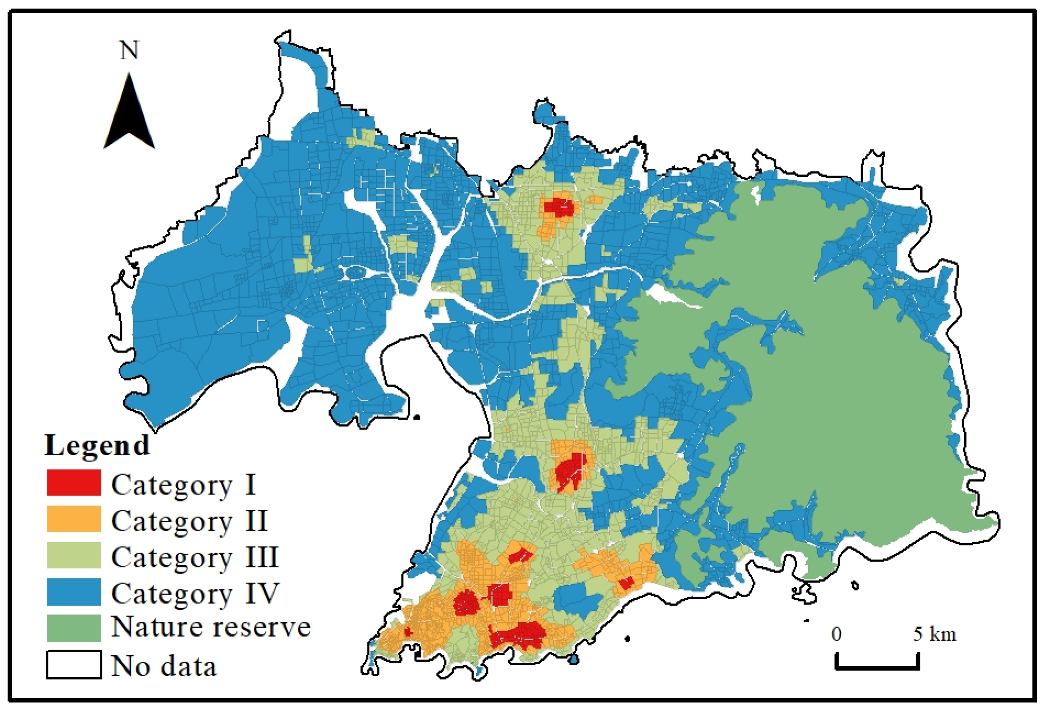
On the basis of the multidimensional perception results of street vitality, the regional characteristics of the main urban area of Qingdao City were obvious when k = 4, and the vitality characteristics of each category are different (Figure 7 and Figure 8):
  • Category I—high cultural vitality, highest social vitality, and highest economic vitality, with economically oriented streets;
  • Category II—highest cultural vitality, high social vitality, and medium economic vitality, with culturally oriented streets;
  • Category III—medium cultural vitality, medium social vitality, and low economic vitality, with socially oriented streets;
  • Category IV—lowest cultural vitality, lowest social vitality, and lowest economic vitality, with all-around deficient streets.

3.3. Influence of Built Environment on Street Vitality

In this paper, we used the quadratic kernel function and AICc to construct MGWR and GWR models of street vitality and each influencing factor using MGWR software [34] to compare the fitting effect of GWR and MGWR. The built environment indicators all passed significance and covariance tests; by comparison (Table 5), the RSS and AICc of the MGWR model were significantly lower than those of the GWR model, with the highest goodness-of-fit R2, effectively improving the robustness of the model. Compared with the classical GWR model, the MGWR model takes into account the scale of action of the independent variables and provides support for exploring the spatial effect of each influencing factor. Therefore, this paper chooses the MGWR model to explore in depth the factors influencing street vitality.
The statistical regression coefficients of the factors with significant global and local effects on street vitality in MGWR are described in Table 6. The results show the following influence of each factor on the comprehensive vitality of the street in descending order: distance from the business circle > street area > public transportation accessibility > density of public service facilities > distance from the subway station > POI density > greening rate > floor area ratio > building density > distance from the bus stop > compactness > mixing degree. The standard deviation indicator reflects the degree of dispersion of the influence of each variable on street vitality, with larger standard deviations representing greater variation in the degree of influence across street vitality. The influence of distance from the business circle on street vitality varied widely in spatial terms, and POI density and compactness did not vary much. The model was analyzed visually using ArcGIS software (Figure 9), and the regression coefficients were divided into five categories using the natural interruption point method, to show the spatial distribution pattern of street vitality influencing factor regression coefficients. The east and west streets of the main urban area of Qingdao City were not sensitive to the effects of most built environment factors. Built environment factors that had a strong influence on the northern streets of Qingdao City’s main urban area were POI density, floor area ratio, building density, distance from the business circle, distance from subway stations, and public transportation accessibility; the built environment factors that had a strong influence on the southern street were compactness, greening rate, and street area. POI density, compactness, building density, street area, distance to the business circle, distance to the subway station, and public transportation accessibility had a concentrated spatial differentiation pattern, while the spatial differentiation pattern of mixing degree, greening rate, floor area ratio, density of public service facilities, and distance from the bus stop were more dispersed.

4. Discussion

4.1. Analysis of the Spatial Characteristics of Street Vitality in the Main Urban Area of Qingdao City

Multisource spatial big data provide a good basis for fine-grained, multidimensional street vitality. There are certain differences in the spatial distribution of street vitality in three dimensions: social, economic, and cultural in the main urban areas of Qingdao City, and these differences are mainly related to the functional characteristics of the streets and the activities of the residents. High levels of social vitality are mainly scattered in various agglomeration centers related to production and living activities; economic vitality is related to commercial agglomeration areas, while areas with high cultural vitality values are relatively concentrated in the streets of downtown centers. The analysis of Figure 4 shows that the commercial-related functional streets had the highest vitality and the industrial-related functional streets had the lowest vitality. Mixing functions is conducive to enhancing street vitality, and mixed-function streets are more vital than corresponding single-function streets. This validates that mixed-function streets can complement each other to enhance vitality [50]. The difference between the vitality of mixed residential, mixed public service, mixed industrial, and mixed science and education streets was larger than that of the corresponding single-function streets, and the difference between the vitality of single-function and mixed-function streets related to commercial services and green space was smaller. Industrial and industrial mixed functional streets had the most significant increase in vitality, and green space and green space mixed functional streets had a small increase in vitality.
A comparison of the various street vitality values is presented in Figure 7. Streets with high economic vitality values generally had high social vitality values, indicating that various consumer places attract a large number of people for economic activities, thus generating high social vitality values. Conversely, streets with high social vitality values had both high and low economic vitality values, indicating that, despite high people flows in the street, there was still a low level of economic vitality and a mismatch with social vitality. This finding is consistent with previous studies [7]. Previously, it was believed that areas with high cultural vitality were concentrated in urban centers, but streets with high cultural vitality values did not have high social and economic vitality values. This paper found that streets with high cultural vitality values also had high and low economic vitality values. This was mainly due to the fact that cultural places such as museums and exhibition centers were located in the center of the city, and there were many economic places around for people to talk about their cultural excitement and exchange their feelings, while cultural places such as cultural parks were far away from the center of the city, and people were more interested in relaxing and cultivating their emotions, but less dependent on economic places. This result indicates that k-means clustering analysis is more advantageous than correlation analysis; by carrying out multidimensional and refined sensing of street vitality with the help of multisource spatial data, we could more comprehensively grasp the complex economic and cultural phenomena and social development status in the street space, as well as provide more scientific and accurate spatial resource allocation solutions for future urban development.

4.2. Analysis of the Influence of Built Environment on Street Vitality

Built environment indicators were closely related to street vitality. At the macroscopic scale, distance from business circles, street areas, public transportation accessibility, the density of public service facilities, distance from subway stations, and POI density were closely related to street vitality, which confirms that urban streets derive their vitality from their living people and various activities [6,51]. As shown in Table 6, public transportation accessibility, the density of public service facilities, distance from the subway stations, POI density, floor area ratio, compactness, and mixing degree had a positive and significant relationship on the influence of street vitality, with the degree of influence decreasing in order. The mixing degree had the lowest degree of influence on the street vitality, but the functional mixing was beneficial to enhance the street vitality, which indicates that there was a certain degree of functional mixing in the street; when the mixing is too high, the urban street loses all its own functional attributes and uniqueness, but it plays a hindering role in street vitality. Accessibility and public service density had a higher influence on street vitality, indicating that accessibility improves the people flow and circulation of the street. A higher level of public services generally denotes a higher quality of life and convenience for residents, and their overall quality of life services can be better guaranteed, thus contributing significantly to street vitality creation. The proximity to a subway station may lead to a decrease in the level of street vitality due to the fact that subway stations are mainly located on regional roads such as arterials, and the road segmentation may lead to a lack of vitality in the surrounding areas, a result that is consistent with the idea that the design of major urban arterials may create “junctional vacuums” that lead to a lack of vitality and diversity, as suggested in the book The Death and Life of Great American Cities [8]. Distance to the business circle, street area, greening rate, building density, and distance from the bus stop had a negative significant relationship with the street vitality, with the degree of influence decreasing in order. The distance from the business circle had the greatest influence on the street vitality, and it was verified that the high-vitality areas of the street in Figure 3d were in the business circle and its nearby areas. The greening rate, an important indicator of environmental quality, was negatively correlated with street vitality, reflecting the mismatch between vitality and environmental issues. Established studies have concluded that building density has a positive effect on street vitality [39] and that floor area ratio promotes street vitality. However, this study found that building density had a suppressive effect on street vitality. This is because previous studies used a single data source to measure street vitality, and areas with high building density have more pedestrian traffic, but areas with high building density include not only large shopping malls and residential areas, but also urban villages, industrial areas, etc. The low economic and cultural vitality and low level of public services in urban villages and industrial areas are detrimental to the development of street vitality. Research discrepancies suggest that the integration of multiple data sources is critical to a comprehensive understanding of the distribution patterns of street vitality.
At the meso/microscale, the spatial differences in the influence of the built environment on street vitality were explored. As shown in Figure 9, street vitality was most influenced by destination accessibility. The regression coefficient of distance from the business circle ranged from −5.522 to 2.472, and the positively influenced streets were mainly concentrated in the junction zone of Licang and Chengyang districts, indicating that a new business center was being nurtured in the area, which played a role in promoting the development of Chengyang district. On the other hand, the eastern part of the main urban area was insignificant, being too far from the business circle, which urgently necessitates the introduction of a new business center to promote the development of these streets. The regression coefficient of distance from the subway station ranged from −1.419 to 1.069, and the negative influence was concentrated in the southern part of the main urban area, while the positive influence was concentrated in the northern part of the main urban area, and the spatial difference was significant. When the northern part of the main urban area, as the pivotal area with internal and external connections, was closer to the subway station, more people flowed. The regression coefficient of distance from the bus stop ranged from −0.431 to 0.372, and the positively influenced streets were located near nature reserves, long-distance bus stops, and railway stations, where the main means of transportation for people to travel in these streets was not the bus; thus, a farther distance from the bus stop resulted in higher street vitality.
Distance to transit had a large influence on street vitality. The regression coefficient of public transportation accessibility ranged from −0.654 to 0.965. For the positively influenced streets, because transportation links all kinds of urban spaces, urban residents can freely flow within the city, as well as communicate, exchange, and participate in all kinds of spatial activities; negatively influenced streets were located near rivers, and these streets were usually established with places such as villa areas and sanatoriums that make people relax, which necessitates their placement away from the hustle and bustle of the environment.
In terms of design, the regression coefficient of public service facilities ranged from −0.351 to 0.552. Most of the negatively influenced streets were urban parks, which provide people with resting places despite the low street vitality, and the range of public service facilities could be moderately reduced according to the actual situation; the positively influenced streets indicate that the place is in urgent need of public service facilities to promote street vitality. Street area regression coefficients ranged from −1.352 to 0.317, with negative influences being high-value vitality areas; positively influenced streets were located in urban parks close to nature reserves. The promotion of the street system is not to make all the streets into small street forms; small streets mainly apply to two kinds of areas: urban high-density areas, which are naturally dense, mainly commercial and residential, and more suitable for open small street form; and new residential areas, which refer to the construction guidelines for small streets and build a smaller street form more suitable for urban development. Urban squares, public green space, historical preservation areas, etc., need the form of the main street district; therefore, the promotion of the street system should be adapted to local conditions, rather than a blanket adoption of all open small street forms. The compactness regression coefficients ranged from −0.020 to 0.036, with positive effects concentrated in high-vitality streets and nonsignificant states concentrated in low-vitality streets, indicating a shift from high speed to high quality, which requires a certain regularity of the streets [52]. The regression coefficient of the greening rate ranged from −0.260 to 0.253. The government should protect streets with a positive influence and promote healthy and sustainable development; on the other hand, the government should guide streets with negative influence and promote the harmonious development of the environment and human activities.
In terms of density, the building density regression coefficient ranged from −0.095 to 0.050, which mainly showed a negative effect except for the Laoshan district business circle. The range of the regression coefficient of the floor area ratio was −0.133 to 0.301, and the positively influenced streets were mainly concentrated in the Chengyang district, where the streets have low vitality, and increasing the floor area ratio was beneficial to attract human activities. The negatively influenced streets were in some closed residential areas, where the floor area ratio was high but the flow of people was low, and human activities mainly involved the flow of commuting to and from work, in contrast to the implementation of openness in residential streets. POI density regression coefficients ranged from −0.022 to 0.107; the influenced streets were mainly concentrated in the northern part of the main urban area and Laoshan district, and other streets in addition to Shinan and Shibei districts showed positive effects because increasing POI density in other streets enhanced the attraction ability of human activities; meanwhile, the functional density of Shinan and Shibei districts has reached saturation and they are already in a congested state, whereby too high POI density instead hindered the street vitality. This is similar to previous work [29] which found that, for high-vitality streets, increasing the intensity of development of building features did not necessarily enhance street vitality. This illustrates the importance of considering spatial heterogeneity to reveal microlocal features of the influence of the built environment on street vitality.
In terms of diversity, the regression coefficients of the mixing degree ranged from −0.245 to 0.280, with similar levels of positive and negative influence. From Figure 9c, it can be seen that the positively influenced streets were mainly monofunctional urban streets, and they need to increase the degree of mixing in the streets to complement each other and further enhance the street vitality; the negatively influenced streets were located near the high-vitality areas and had a high mixing degree, and they need to reduce the functional mixing degree and form their own street functions and characteristics.
Most of the streets in the eastern part of the main urban area were insignificant areas, with a low people flow and a low social, economic, and cultural level, but these areas were pivotal with inward and outward connections, and they should be centered near the subway station, while public service facilities and commercial centers should be introduced in the nearby areas to increase people flow and drive the development of the surrounding areas. The southern part of the main urban area was a high-vitality concentration area, which needs to improve the street compactness, improve the efficiency and quality of space utilization, and reduce the POI density to disperse the congested traffic and make the streets sustainable. Efforts are being made to expand the scope of its dynamic field to make an impact on a larger region while playing a demonstrative role. For medium-vitality streets, it is necessary to reduce the street area and form a street with its own function and uniqueness. It is also necessary to improve the living and human environment and public services. A good living and human environment can provide people with a happy living environment, and the improvement of the public service environment can enhance people’s convenience and satisfaction in living and doing business.
The study of the spatial distribution characteristics and influence mechanism of street vitality revealed that there is spatial heterogeneity in street vitality, and its spatial variability is large and unevenly distributed. Since the functional positioning and basic conditions of different streets are different, it is necessary to consider the functional positioning and development basis of the streets when formulating relevant policies and to maintain and optimize the vitality of high-level streets while focusing on improving the vitality of lower level streets according to the local conditions and policies. After defining the functional nature and vitality characteristics of the streets, we adopted corresponding vitality creation and enhancement strategies for local optimization and overall enhancement of vitality, taking into account the characteristics of vitality changes and influence mechanisms of different functional streets, so as to dilute district and county boundaries, promote the linked development of urban areas, strengthen inter-regional linkage and cooperation, promote development coordination, and build a new pattern of coordinated and stable street development. In addition, environmental issues are critical to China, which has serious environmental problems, and China can use tools such as a carbon tax to mitigate environmental pollution.
MGWR is one of the most important tools for analyzing spatial heterogeneity. As an optimization model of GWR, which allows each study variable to have different bandwidths and, thus, obtain more credible model results, the model has a better explanatory strength for studying spatial heterogeneity characteristics [53,54,55]. Some scholars explored the influence mechanism of the resilience of 281 cities in China using the MGWR model [56], showing that the model can be applied to any region. The framework proposed in this paper is robust, and the big data used were all open-source spatial data, which can provide scientific reference for other regions to achieve sustainable and high-quality urban development.

4.3. Innovation

Most of the previous studies assessed street vitality using a single data source and used OLS and GWR models to explore the influence mechanisms of street vitality. The OLS model cannot be used to study spatial heterogeneity characteristics. The GWR model does not consider spatial scale benefits, and all indicators are influenced by the same spatial scale. The MGWR model can overcome the limitations of these two models. The innovations of this paper were (1) its use of multisource spatial big data to comprehensively assess urban street vitality, and (2) its use of the MGWR model to analyze the extent to which the built environment affects street vitality in different regions, considering spatial scale benefits and heterogeneity characteristics.

4.4. Limitations

On the basis of multisource spatial big data, this paper analyzed the distribution characteristics of street vitality in the main urban area of Qingdao and the influence mechanism of the built environment on it, having certain significance for the study of street vitality. However, given the limitations of relevant data and other conditions, there were some shortcomings. Firstly, the Baidu heat map data and Meituan store rating data used in this paper have their own advantages; they reflect the degree of population clustering, they are relatively easy to obtain, and the data scale can adequately meet the needs of street vitality measurement. However, due to problems such as Internet penetration, the usage rate of older middle-aged and elderly groups is usually low. In the future, we may consider supplementing the elderly group sample with other forms of data to improve the accuracy of the street vitality measure. Secondly, the Meituan store rating data and POI data, which reflect the economic and cultural vitality of the street, as well as their proxy data, do not have temporal attributes. It is one-sided to use only the Baidu heat map data, which characterizes social vitality, to respond to the temporal characteristics of street vitality; therefore, only the spatial scale was considered in this paper to evaluate the comprehensive vitality. In the future, spatial data of continuous time series will be collected to characterize economic vitality and cultural vitality provided that these data are available, to improve the depth of street vitality research.

5. Conclusions

Taking streets as the unit of analysis and using multisource spatial big data, this paper quantitatively evaluated and analyzed the street vitality of the main urban area of Qingdao City in three dimensions: social, economic, and cultural. The MGWR model was used to detect the influence mechanism of the built environment on street vitality, which is conducive to the local optimization and overall improvement of street vitality. The main conclusions are as follows:
  • The overall development of street comprehensive vitality in the main urban area of Qingdao City is uneven. Streets with high vitality are mainly located in the downtown area, with the core of the business district decreasing outward in a group-like manner.
  • The historical influence of street development leads to significant differences in various types of vitality in different streets. Vitality is higher in all categories in the southern streets and weaker in all categories in the western and eastern streets. The vital poles in the southern part of the main urban area are already developed, and there are smaller vital poles in the west and east that are being nurtured and need to continue to improve their attractiveness. The distribution of social vitality is relatively balanced, with economic vitality gathered in the streets where commerce, leisure, and entertainment are concentrated, while cultural vitality is gathered in the city center and the convention center of Laoshan.
  • The degree of functional mix in a street affects its vitality. Mixed-function streets are more vital than single-function streets, avoiding the need for people to have their other requirements met on a larger scale.
  • The improvement of the built environment is the key to the enhancement of street vitality. Built environment factors with significant spatial heterogeneity inhibit or enhance street vitality in Qingdao City’s main urban areas to different degrees, and measures to enhance vitality need to be taken according to local conditions.

Author Contributions

Conceptualization, J.P.; methodology, M.L. and J.P.; software, M.L.; validation, M.L.; formal analysis, M.L.; data curation, M.L.; writing—original draft preparation, M.L.; writing—review and editing, J.P.; visualization, M.L.; supervision, J.P.; project administration, J.P.; funding acquisition, J.P. All authors have read and agreed to the published version of the manuscript.

Funding

This research was funded by the National Natural Science Foundation of China (Award Number: 42071216).

Institutional Review Board Statement

Not applicable.

Informed Consent Statement

Not applicable.

Data Availability Statement

The data and statistical analysis methods are available upon request from the corresponding author.

Acknowledgments

The authors thank the editors and anonymous reviewers for their thoughtful and helpful suggestions on improving the manuscript, as well as the financial support from the National Natural Science Foundation of China under grant number 42071216.

Conflicts of Interest

The authors declare that they have no known competing financial interest or personal relationship that could have appeared to influence the work reported in this paper.

References

  1. Turok, I.; McGranahan, G. Urbanization and economic growth: The arguments and evidence for Africa and Asia. Environ. Urban. 2013, 25, 465–482. [Google Scholar] [CrossRef]
  2. Halepoto, I.A.; Sahito, A.A.; Uqaili, M.A.; Chowdhry, B.S.; Riaz, T. Multi-criteria assessment of smart city transformation based on SWOT analysis. In Proceedings of the 2015 5th National Symposium on Information Technology: Towards New Smart World (NSITNSW), Riyadh, Saudi Arabia, 17–19 February 2015; pp. 1–6. [Google Scholar]
  3. Zhang, L.; Wang, Y.H.; Guo, Y.N. A Research on the Coordination of Land Urbanization and Economic Urbanization in China. East China Econ. Manag. 2016, 30, 111–117. [Google Scholar]
  4. Zhang, R.T.; Jiao, H.F. A review on new urbanization research in China. World Reg. Stud. 2016, 25, 59–66. [Google Scholar]
  5. Montgomery, M.R. The urban transformation of the developing world. Science 2008, 319, 761–764. [Google Scholar] [CrossRef] [Green Version]
  6. Jiang, D. On the Vitality of Urban Form; Southeast University Press: Nanjing, China, 2007. [Google Scholar]
  7. Li, Q.; Cui, C.; Liu, F.; Wu, Q.; Run, Y.; Han, Z. Multidimensional urban vitality on streets: Spatial patterns and influence factor identification using multisource urban data. ISPRS Int. J. Geo-Inf. 2021, 11, 2. [Google Scholar] [CrossRef]
  8. Jacobs, J. The Death and Life of Great American Cities; Random House: New York, NY, USA, 1961. [Google Scholar]
  9. Lynch, K. Good City Form; MIT Press: Cambridge, MA, USA, 1984. [Google Scholar]
  10. Maas, P.R. Towards a theory of urban vitality. Ph.D. Thesis, University of British Columbia, Vancouver, BC, Canada, 1984. [Google Scholar]
  11. Calthorpe, P. The Next American Metropolis: Ecology, Community, and the American Dream; Princeton Architectural Press: Princeton, NJ, USA, 1993. [Google Scholar]
  12. Mouratidis, K.; Poortinga, W. Built environment, urban vitality and social cohesion: Do vibrant neighborhoods foster strong communities? Landsc. Urban Plan. 2020, 204, 103951. [Google Scholar] [CrossRef]
  13. Gehl, J.; Kaefer, L.J.; Reigstad, S. Close encounters with buildings. Urban Des. Int. 2006, 11, 29–47. [Google Scholar] [CrossRef]
  14. Marcus, L. Spatial capital. J. Space Syntax 2010, 1, 30–40. [Google Scholar]
  15. Racine, F. Developments in urban design practice in Montreal: A morphological perspective. Urban Morphol. 2016, 20, 122–137. [Google Scholar] [CrossRef]
  16. Moffatt, S.; Kohler, N. Conceptualizing the built environment as a social–ecological system. Build. Res. Inf. 2008, 36, 248–268. [Google Scholar] [CrossRef]
  17. Zhou, H.; He, S.; Cai, Y.; Wang, M.; Su, S. Social inequalities in neighborhood visual walkability: Using street view imagery and deep learning technologies to facilitate healthy city planning. Sustain. Cities Soc. 2019, 50, 101605. [Google Scholar] [CrossRef]
  18. Fu, R.; Zhang, X.; Yang, D.; Cai, T.; Zhang, Y. The relationship between urban vibrancy and built environment: An empirical study from an emerging city in an Arid Region. Int. J. Environ. Res. Public Health 2021, 18, 525. [Google Scholar] [CrossRef] [PubMed]
  19. Jiang, Y.; Han, Y.; Liu, M.; Ye, Y. Street vitality and built environment features: A data-informed approach from fourteen Chinese cities. Sustain. Cities Soc. 2022, 79, 103724. [Google Scholar] [CrossRef]
  20. Long, Y.; Huang, C.C. Does block size matter? The impact of urban design on economic vitality for Chinese cities. Environ. Plan. B-Urban 2019, 46, 406–422. [Google Scholar] [CrossRef] [Green Version]
  21. Oliveira, V. Morpho: A methodology for assessing urban form. Urban Morphol. 2013, 17, 21–33. [Google Scholar] [CrossRef]
  22. Sung, H.G.; Go, D.H.; Choi, C.G. Evidence of Jacobs’s street life in the great Seoul city: Identifying the association of physical environment with walking activity on streets. Cities 2013, 35, 164–173. [Google Scholar] [CrossRef]
  23. Jalaladdini, S.; Oktay, D. Urban public spaces and vitality: A socio-spatial analysis in the streets of Cypriot towns. Procedia Soc. Behav. Sci. 2012, 35, 664–674. [Google Scholar] [CrossRef] [Green Version]
  24. Zarin, S.Z.; Niroomand, M.; Heidari, A.A. Physical and social aspects of vitality case study: Traditional street and modern street in Tehran. Procedia Soc. Behav. Sci. 2015, 170, 659–668. [Google Scholar] [CrossRef] [Green Version]
  25. Candia, J.; González, M.C.; Wang, P.; Schoenharl, T.; Madey, G.; Barabási, A.-L. Uncovering individual and collective human dynamics from mobile phone records. J. Phys. A Math. Theor. 2008, 41, 224015. [Google Scholar] [CrossRef] [Green Version]
  26. Griffin, M.; Nordstrom, B.W.; Scholes, J.; Joncas, K.; Gordon, P.; Krivenko, E.; Haynes, W.; Higdon, R.; Stewart, E.; Kolker, N. A case study: Analyzing city vitality with four pillars of activity—L live, work, shop, and play. Big Data 2016, 4, 60–66. [Google Scholar] [CrossRef]
  27. Shi, L.; Chi, G.; Liu, X.; Liu, Y. Human mobility patterns in different communities: A mobile phone data-based social network approach. Ann. GIS 2015, 21, 15–26. [Google Scholar] [CrossRef] [Green Version]
  28. Sung, H.; Lee, S. Residential built environment and walking activity: Empirical evidence of Jane Jacobs’ urban vitality. Res. Part D Transp. Environ. 2015, 41, 318–329. [Google Scholar] [CrossRef]
  29. Wu, W.; Niu, X.; Li, M. Influence of built environment on street vitality: A case study of West Nanjing Road in Shanghai based on mobile location data. Sustainability 2021, 13, 1840. [Google Scholar] [CrossRef]
  30. Liu, W. Spatial Impact of the Built Environment on Street Vitality: A Case Study of the Tianhe District, Guangzhou. Front. Environ. Sci. 2022, 10, 966562. [Google Scholar]
  31. Li, Y.; Yabuki, N.; Fukuda, T. Exploring the association between street built environment and street vitality using deep learning methods. Sustain. Cities Soc. 2022, 79, 103656. [Google Scholar] [CrossRef]
  32. Liu, C.; Lu, J.; Fu, W.; Zhou, Z. Second-hand housing batch evaluation model of zhengzhou city based on big data and MGWR model. J. Intell. Fuzzy Syst. 2022, 42, 4221–4240. [Google Scholar] [CrossRef]
  33. Tu, J. Spatially varying relationships between land use and water quality across an urbanization gradient explored by geographically weighted regression. Appl. Geogr. 2011, 31, 376–392. [Google Scholar] [CrossRef]
  34. Fotheringham, A.S.; Yang, W.; Kang, W. Multiscale geographically weighted regression (MGWR). Ann. Am. Assoc. Geogr. 2017, 107, 1247–1265. [Google Scholar] [CrossRef]
  35. Zhang, W. Planning: Qingdao made clear the 12 strategic tasks of the “Fourteenth Five Year Plan”. Toward. World 2021, 16, 8–9. [Google Scholar]
  36. Liu, X.; Long, Y. Automated identification and characterization of parcels with OpenStreetMap and points of interest. Environ. Plan. B-Plan. Des. 2016, 43, 341–360. [Google Scholar] [CrossRef]
  37. National Standard (Mandatory) of the People’s Republic of China: Code for Classification of Urban Land Use and Planning Standards of Development Land; China Planning Press: Beijing, China, 2012.
  38. Shi, P.; Xiao, Y.; Zhan, Q. A study on spatial and temporal aggregation patterns of urban population in Wuhan City based on Baidu heat map and POI data. Int. Rev. Spat. Plan. Sustain. Dev. 2020, 8, 101–121. [Google Scholar] [CrossRef] [PubMed]
  39. Gu, C.; Wang, Y.; Shao, Y.; Gu, J. Research on administrative divisions based on functional areas analysis: A case of Shaoxing metropolitan area. Acta Geogr. Sin. 2015, 70, 1187–1201. [Google Scholar]
  40. Xia, C.; Yeh, A.G.O.; Zhang, A. Analyzing spatial relationships between urban land use intensity and urban vitality at street block level: A case study of five Chinese megacities. Landsc. Urban Plan. 2020, 193, 103669. [Google Scholar] [CrossRef]
  41. Wu, W.; Ma, Z.; Guo, J.; Niu, X.; Zhao, K. Evaluating the Effects of Built Environment on Street Vitality at the City Level: An Empirical Research Based on Spatial Panel Durbin Model. Int. J. Environ. Res. Public Health 2022, 19, 1664. [Google Scholar] [CrossRef]
  42. Tzeng, G.H.; Huang, J.J. Multiple Attribute Decision Making: Methods and Applications; CRC Press: Boca Raton, FL, USA, 2011. [Google Scholar]
  43. Soofi, E.S.; Retzer, J.J. Adjustment of importance weights in multiattribute value models by minimum discrimination information. Eur. J. Oper. Res. 1992, 60, 99–108. [Google Scholar] [CrossRef]
  44. Cervero, R.; Arrington, G.B. Vehicle trip reduction impacts of transit-oriented housing. J. Public Transp. 2008, 11, 1–17. [Google Scholar] [CrossRef]
  45. Ewing, R.; Tian, G.; Goates, J.P.; Zhang, M.; Greenwald, M.J.; Joyce, A.; Kircher, J.; Greene, W. Varying influences of the built environment on household travel in 15 diverse regions of the United States. Urban Stud. 2015, 52, 2330–2348. [Google Scholar] [CrossRef]
  46. Guo, X.; Chen, H.; Yang, X. An evaluation of street dynamic vitality and its influential factors based on multi-source big data. ISPRS Int. J. Geo-Inf. 2021, 10, 143. [Google Scholar] [CrossRef]
  47. Ord, J.K.; Getis, A. Local spatial autocorrelation statistics: Distributional issues and an application. Geog. Anal. 1995, 27, 286–306. [Google Scholar] [CrossRef]
  48. Brunsdon, C.; Fotheringham, A.S.; Charlton, M. Some notes on parametric significance tests for geographically weighted regression. J. Reg. Sci. 1999, 39, 497–524. [Google Scholar] [CrossRef]
  49. Oshan, T.M.; Li, Z.; Kang, W.; Wolf, L.J.; Fotheringham, A.S. MGWR: A python implementation of multiscale geographically weighted regression for investigating process spatial heterogeneity and scale. ISPRS Int. J. Geo-Inf. 2019, 8, 269. [Google Scholar] [CrossRef] [Green Version]
  50. Wang, Z.; Ma, D.; Sun, D.; Zhang, J. Identification and analysis of urban functional area in Hangzhou based on OSM and POI data. PLoS ONE 2021, 16, e0251988. [Google Scholar] [CrossRef] [PubMed]
  51. Zeng, C.; Song, Y.; He, Q.; Shen, F. Spatially explicit assessment on urban vitality: Case studies in Chicago and Wuhan. Sustain. Cities Soc. 2018, 40, 296–306. [Google Scholar] [CrossRef]
  52. Burton, E.; Jenks, M.; Williams, K. The Compact City: A Sustainable Urban Form? Routledge: London, UK, 2003. [Google Scholar]
  53. Wu, C.; Ren, F.; Hu, W.; Du, Q. Multiscale geographically and temporally weighted regression: Exploring the spatiotemporal determinants of housing prices. Int. J. Geog. Inf. Sci. 2019, 33, 489–511. [Google Scholar] [CrossRef]
  54. Lao, X.; Gu, H. Unveiling various spatial patterns of determinants of hukou transfer intentions in China: A multi-scale geographically weighted regression approach. Growth Chang. 2020, 51, 1860–1876. [Google Scholar] [CrossRef]
  55. Shabrina, Z.; Buyuklieva, B.; Ng, M.K.M. Short-term rental platform in the urban tourism context: A geographically weighted regression (GWR) and a multiscale GWR (MGWR) approaches. Geog. Anal. 2021, 53, 686–707. [Google Scholar] [CrossRef]
  56. Chen, Y.; Zhu, M.; Zhou, Q.; Qiao, Y. Research on spatiotemporal differentiation and influence mechanism of urban resilience in China based on MGWR model. Int. J. Environ. Res. Public Health 2021, 18, 1056. [Google Scholar] [CrossRef] [PubMed]
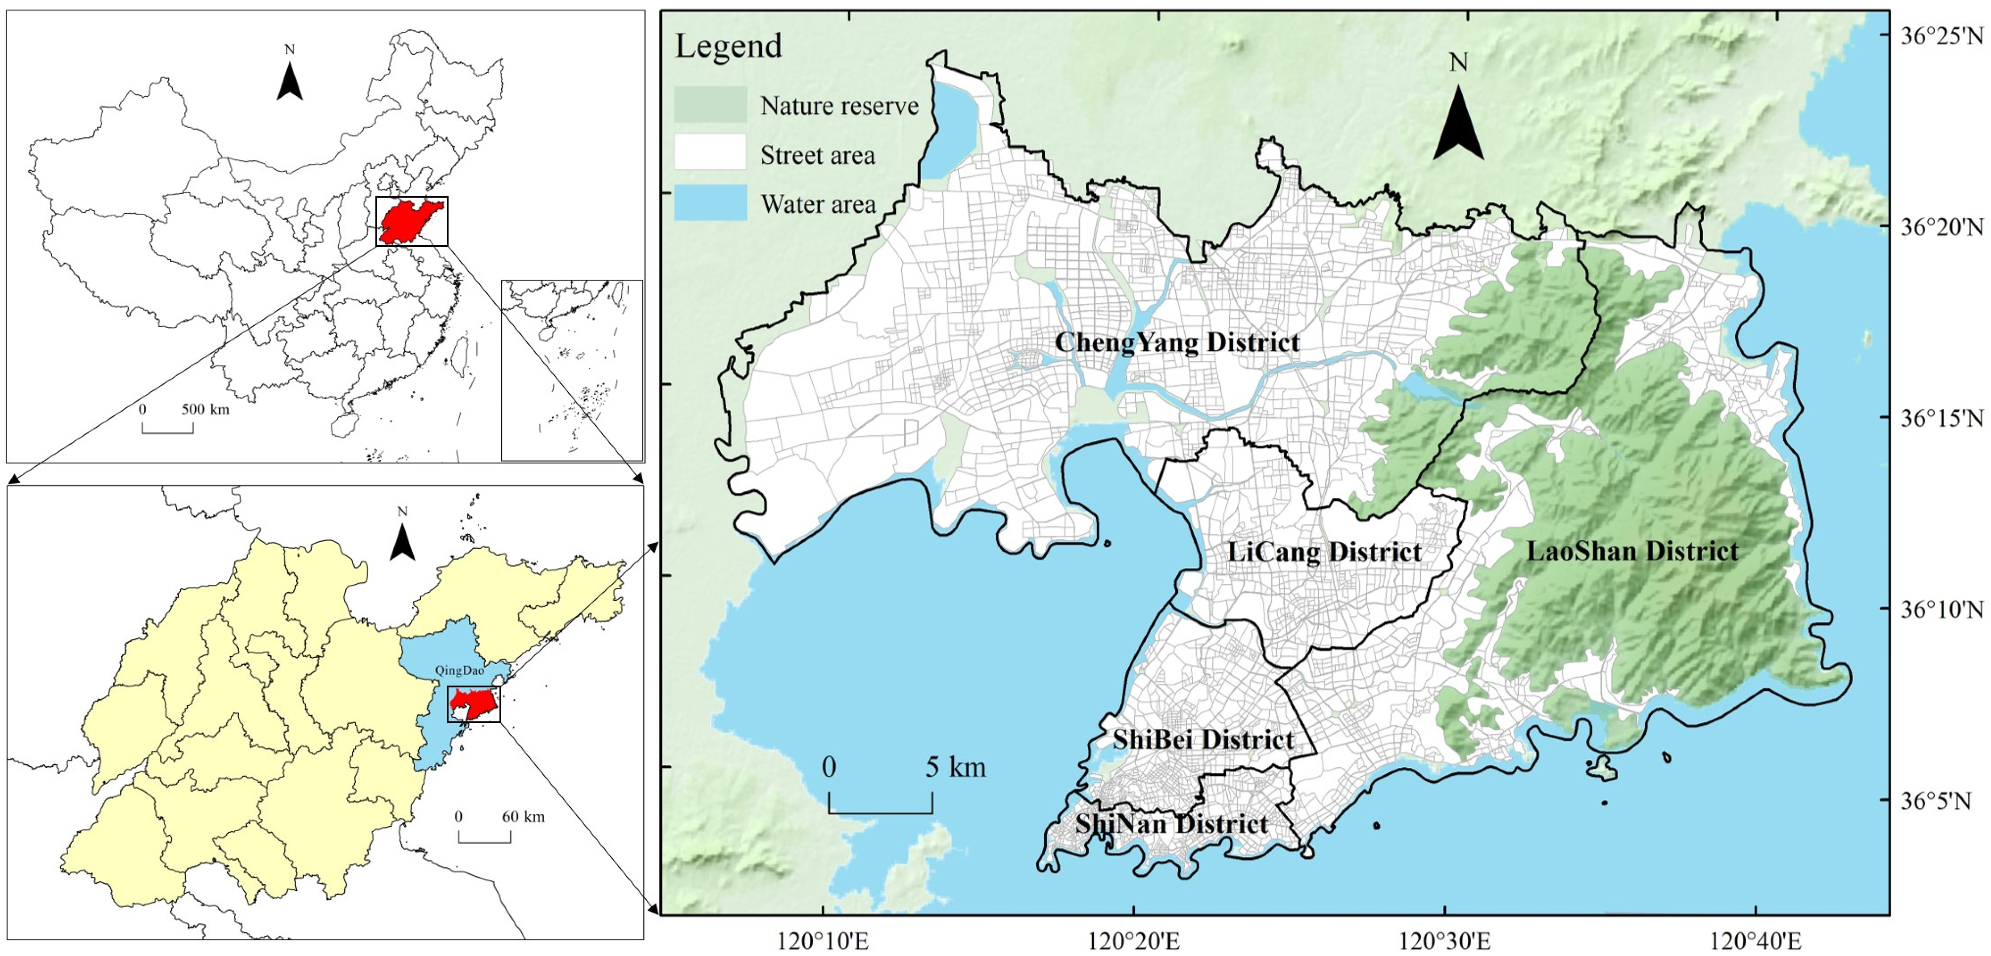
Figure 1. Location of the study area.
Sustainability 15 01518 g001
Figure 2. Research framework on street vitality and its influencing mechanisms.
Sustainability 15 01518 g002
Figure 3. Spatial pattern of street vitality: (a) social vitality; (b) economic vitality; (c) cultural vitality; (d) comprehensive vitality. Note: Abbreviations: QRS = Qingdao Railway Station, QBS = Qingdao Bus Station, QUST = Qingdao University of Science and Technology, QBRS = Qingdaobei Railway Station, WP = Wanda Plaza, LSBC = Laoshan Business Circle, TBC = Taidong Business Circle, MFS = May Fourth Square, LCBC = Licun Business Circle, ZRBC = Zhongshan Road Business Circle, SBC = Sifang Business Circle, HMRBC = Hong Kong Middle Road Business Circle, HIDZ = High-tech Industrial Development Zone, CBC = Chengyang Business Circle, QU = Qingdao University, FMK = Fangte Magic Kingdom, RTM = Road Transport Museum, SDCC = Shinan District Cultural Center, SDFCC = Shibei District First Cultural Center, QA = Qingdao Aquarium, QCC = Qingdao Cultural Center, QFM = Qingdao Folk Museum, QM = Qingdao Museum, PLANM = PLA Navy’s Museum, TBM = Tsingtao Beer Museum, QICC = Qingdao International Convention Center, TMFGGHIQ = The Museum Former German Governor’s House In Qingdao, QGT = Qingdao Grand Theater, LCP = Licang Cultural Park, LDCC = Licang District Cultural Center, CDCC = Chengyang District Cultural Center, LIA = Liuting International Airport (relocated).
Sustainability 15 01518 g003
Figure 4. Differences in the vitality of different functional streets.
Sustainability 15 01518 g004
Figure 5. Spatial distribution of vitality poles in the main urban area of Qingdao City.
Sustainability 15 01518 g005
Figure 6. Street vitality K-means clustering: (a) SSE; (b) contour coefficient.
Sustainability 15 01518 g006
Figure 7. Folding line graph of the change in the mean value of the clustering variables of the four categories. Note: the group mean of class centroids represents the centroids of various active regions in different dimensions. Size is a relative concept with no unit.
Sustainability 15 01518 g007
Figure 8. Regional spatial distribution of four types of street vitality characteristics in Qingdao City’s main urban area.
Sustainability 15 01518 g008
Figure 9. Spatial distribution of regression coefficients in the MGWR: (a) POI density; (b) compactness; (c) mixing degree; (d) greening rate; (e) floor area ratio; (f) building density; (g) street area; (h) density of public service facilities; (i) distance from the business circle; (j) distance from the subway station; (k) distance from the bus stop; (l) public transportation accessibility.
Sustainability 15 01518 g009
Table 1. Study data.
Data TypeData NameData SourceYearLink
Basic geographic dataChina map vector dataNational basic geographic information center2021http://www.ngcc.cn/ (accessed on 11 November 2021)”
Road network dataOpen Street Map official website2021https://www.openstreetmap.org/ (accessed on 7 December 2021)”
Web open-source dataPOI dataGaode map crawler2022https://ditu.amap.com/ (accessed on 18 January 2022)”
Baidu heat map dataBaidu map crawler2022https://map.baidu.com/ (accessed on 10 April 2022)”
Meituan store rating dataMeituan web crawler2022https://qd.meituan.com/ (accessed on 19 February 2022)”
Building profile dataGaode map crawler2021https://ditu.amap.com/ (accessed on 28 December 2021)”
Table 2. POI types in Qingdao City’s main urban area.
First-Class ClassificationSecondary ClassificationTertiary Classification
Residential landResidential area, business housing-related areasVillas, residential communities, community centers, etc.
Commercial landShopping services, catering services, accommodation services, leisure and entertainment, financial and insurance servicesSupermarkets, hotels, restaurants, shopping centers, cinemas, banks, etc.
Industrial landCompanies, industrial and mining plantsCompanies, factories, technology parks, industrial parks, etc.
Public service landGovernment agencies, medical care, public facilities, etc.Government agencies, social organizations, hospitals, emergency centers, railway stations, airports, docks, public facilities, etc.
Scientific, educational and cultural land.
Green space and square
land
Higher-education institutions, vocational institutions, secondary schools, elementary schools, science and education sites, etc.
Tourist attractions, parks, and squares
Universities, high schools, elementary schools, kindergartens, vocational colleges, museums, libraries, etc.
Scenic spots, zoos, botanical gardens, parks, squares, etc.
Table 3. Nomenclatures of parameters in equations.
NomenclatureParameter
iNumber of POI categories
FiFrequency density of POI category i
niNumber of POI category i in the street units
NiTotal number of POI categories i
CiProportion of POI category i functional type
αjWeights obtained by the Criteria Importance Through Intercriteria Correlation (CRITIC) method for the j-th indicator
βjWeight obtained by the entropy weighting method for the j-th indicator.
WjCombined weight of the j-th indicator
εiModel regression residual
ymResponse variable
xmnCovariate
βbwnn-th local regression coefficient with MGWR bandwidth bw
(um,vm)Spatial geographic location of the sample points
Table 4. Street built environment 5D detection index system.
DimensionalityDetection IndexDescription
DensityPOI density (pieces/km2)Reflects the density of various functional POIs in the street
Floor area ratio (%)Reflects the intensity of street development
Building density (%)Reflects the vacancy rate and building density of the street
DesignCompactness (%)Reflects the efficiency of street space form
Greening rate (%)Reflects the environmental quality of the street
Street area (m2)Street unit area
Density of public service facilities (pieces/km2)Reflects the livability of the street
DiversityMixing degreeReflects the mixing degree of different types of POI and land use diversity
Distance to transitPublic transportation accessibility (pieces/km2)Reflects the accessibility of the street
Destination accessibilityDistance from the business circle (km)Reflects the extent to which the street vitality is influenced by the business circle
Distance from the subway station (m)Reflects street subway accessibility
Distance from the bus stop (m)Reflects street transit accessibility
Table 5. Comparison of two regression models.
ModelRSSAICcR2Adjusted R2Bandwidth
GWR33.881−2505.2990.990.98574
MGWR25.654−3826.3250.9920.989(44,554)
Table 6. Statistical description of MGWR coefficients.
VariableMeanStandard
Deviation
MinMedianMax
Intercept−1.9120.836−3.391−1.767−0.599
POI density0.0340.028−0.0220.0390.107
Compactness0.0110.014−0.020.0160.036
Mixing degree0.0090.051−0.2450.010.28
Greening rate−0.0320.059−0.26−0.0260.253
Floor area ratio0.0240.24−1.1330.0450.301
Building density−0.0170.054−0.095−0.0290.214
Street area−0.2530.279−1.352−0.1920.33
Density of public service facilities0.0760.129−0.3510.0630.552
Distance from the business circle−2.6872.272−5.522−2.9772.472
Distance from the subway station0.0380.496−1.4190.0791.069
Distance from the bus stop−0.0150.092−0.431−0.0090.372
Public transportation accessibility0.1740.281−0.6540.1750.965
Disclaimer/Publisher’s Note: The statements, opinions and data contained in all publications are solely those of the individual author(s) and contributor(s) and not of MDPI and/or the editor(s). MDPI and/or the editor(s) disclaim responsibility for any injury to people or property resulting from any ideas, methods, instructions or products referred to in the content.