Article

A Simulation Analysis of Land Use Changes in the Yarlung Zangbo River and Its Two Tributaries of Tibet Using the Markov–PLUS Model

1
Resources and Environment College, Tibet Agricultural and Animal Husbandry University, Nyingchi 860000, China
2
School of Management, Hubei Business College, Wuhan 430069, China
3
School of Public Administration, China University of Geosciences, Wuhan 430074, China
4
State Key Laboratory of Remote Sensing Science, Aerospace Information Research Institute, Chinese Academy of Sciences, Beijing 100094, China
5
College of Resources and Environment, University of Chinese Academy of Sciences, Beijing 101408, China
6
Center for Turkmenistan Studies, China University of Geosciences, Wuhan 430074, China
7
School of Foreign Languages, China University of Geosciences, Wuhan 430074, China
8
China-Africa Institute (Wuhan), China University of Geosciences, Wuhan 430074, China
*
Author to whom correspondence should be addressed.
Sustainability 2023, 15(2), 1376; https://doi.org/10.3390/su15021376
Submission received: 21 October 2022 / Revised: 27 December 2022 / Accepted: 6 January 2023 / Published: 11 January 2023

Abstract

:
Since the beginning of the 21st century, the economic development of Tibet has been accelerating. The Yarlung Zangbo River and its two tributaries, as the region with the largest population concentration and the fastest economic development in Tibet, has been under the dual influence of global climate warming and the intensification of human social and economic activities, where a high number of land types, such as woodland, grassland, and water areas, have been transformed into other land types, and the residential area has expanded in a disorderly manner. The ability to maintain sustainable regional development has been severely damaged. To meet the requirements of different stages of social and economic development and regional social development goals, in this study, we use the Yarlung Zangbo River and its two tributaries of Tibet as an example. Based on the Markov–PLUS model and considering the natural, social, and cultural conditions of the basin, combined with the multi-landscape simulation of land use, we predict the land use situation of the Yarlung Zangbo River and its two tributaries of Tibet in 2038. We observed the following: (i) the Markov–PLUS model has a high simulation accuracy for different land types in the study area, and can sufficiently simulate the changes in different land types in the Yarlung Zangbo River and its two tributaries of Tibet; and (ii) the simulation settings of the three landscapes basically meet the different development modes and paths of the basin in the future. There were obvious differences in the structure of land use in the basin, among which there were obvious differences, especially agricultural land and water areas. Use of the Markov–PLUS model can provide data support and references for the implementation in terms of ecological scrutiny, landscape planning, and early warnings for food production consumption security and unreasonable land use, in order to achieve the sustainable development of the basin.

1. Introduction

In recent decades, under the dual influence of global warming and the intensification of human-engineered development activities, large areas of forest land, grassland, and water have been utilized. Changed to other types of land use, the disorderly expansion of residential areas has severely affected the capacity for regional sustainable development [1,2,3]. The changed land use methods, such as urbanization, and development of townships and wet lands, have led to considerable changes in the land use patterns. Consequently, development of townships and wet lands has meant a high number of natural lands have been transformed into artificial land use types. Material flow also has a great impact on this. To study the dynamic changes occurring in regional land resource utilization and analyze its spatial relationship with the natural environment and human disturbance, it is important to understand the ecological and socioeconomic value levels of regional land resources and reveal the dynamic changes occurring in the land. It is of great significance and value to realize the sustainable development of regional resources and the environment.
The change in land resource use is a concrete manifestation formed under the combined action of the natural environment and human activities [4]. With the rapid development of the global economy, changes in land resource use and land use cover are more intense and frequent. The research on the Land-Use and Land-Cover Change (LUCC) at home and abroad has been a hot research object for a long period of time. Because LUCC is constrained by both natural and human factors, its formation process and mechanisms are very complicated. There are four research paradigms in land use change simulation in academia [5]. It mainly focuses on land use classification, the driving force of land use change, The relationship between land use change and environment, and simulation prediction [6]. To study such changes, many simulation models are in use including the Markov model, CA model, SLEUTH model, SD model, CLUE-S model, FLUS model, ABM model and PLUS model [7,8,9,10,11,12]. The change in the demands for watershed development land is the most important factor affecting the utilization and planning of regional territorial space. The development status of different watersheds determines the spatial development orientation of land in different regions. Setting up simulations and predictions of watershed development in different landscapes can provide different conditions for watershed development. It is of great significance for the harmonious and sustainable development of watershed or regional resources and the environment to assist the region to better predict the future spatial pattern of land use. However, from the research status at present, the lack of effective observations and monitoring makes it difficult to detect land use and cover changes [13,14,15,16,17,18,19,20,21,22,23,24,25].
Previous studies have mainly focused on the improvement of technical modeling procedures, and few studies have focused on advancing the understanding of the underlying nonlinear relationships of the Land-Use/Land-Cover (LULC). The lack of ability to reflect the evolution of patch landscapes also limits the applicability of CA model for policymaking. The PLUS model is an improved land use simulation prediction model based on the FLUS model. The PLUS model is different from the previous CA model. It is based on geographic raster data to explore the contribution of land expansion factors and limiting factors to land use change [26,27,28,29,30]. Therefore, this study uses the PLUS model combined with the Markov chain to simulate the land use changes occurring in the Yarlung Zangbo River and its two tributaries of Tibet. Simulating regional land use patterns under different development landscapes and exploring regional land use patterns under different development goals are of great significance for regional sustainable development and the optimization of the ecological environment.
The Yarlung Zangbo River and its two tributaries of Tibet are an important agricultural production area on the Qinghai–Tibet Plateau. Its area accounts for 5.48% of the area of the Tibet Autonomous Region, and its population accounts for more than one-third of the population of the Tibet Autonomous Region. The natural and geographical conditions have transitional characteristics. Since the beginning of this century, with the rapid development of the regional economy and the intensification of human activities, there are considerable changes evident in land use pattern of the Yarlung Zangbo River and its two tributaries, and the research on the land use of the region has focused more on the research related to the ecological environment. Based on LUCC and multi-landscape land use, this study uses the PLUS model to reveal the land use pattern in the Yarlung Zangbo River and its two tributaries of Tibet and its relationship with the natural environment and human disturbances from 2010 to 2018, and also simulates the future development of the region under different development landscapes. The land use pattern is expected to provide a reference for the rational use of land and other, ecological resources in Tibet. Therefore, this study proposes the following research objectives:
  • On the basis of land use and cover change, propose the regional development goals of the Yarlung Zangbo River and its two tributaries of Tibet.
  • Analyze the driving mechanism of land use expansion in the Yarlung Zangbo River and its two tributaries of Tibet, and simulate the land use situation in future landscapes.
  • Provide different decision-making perspectives and a basis for the future spatial pattern of land use.

2. Study Area and Data
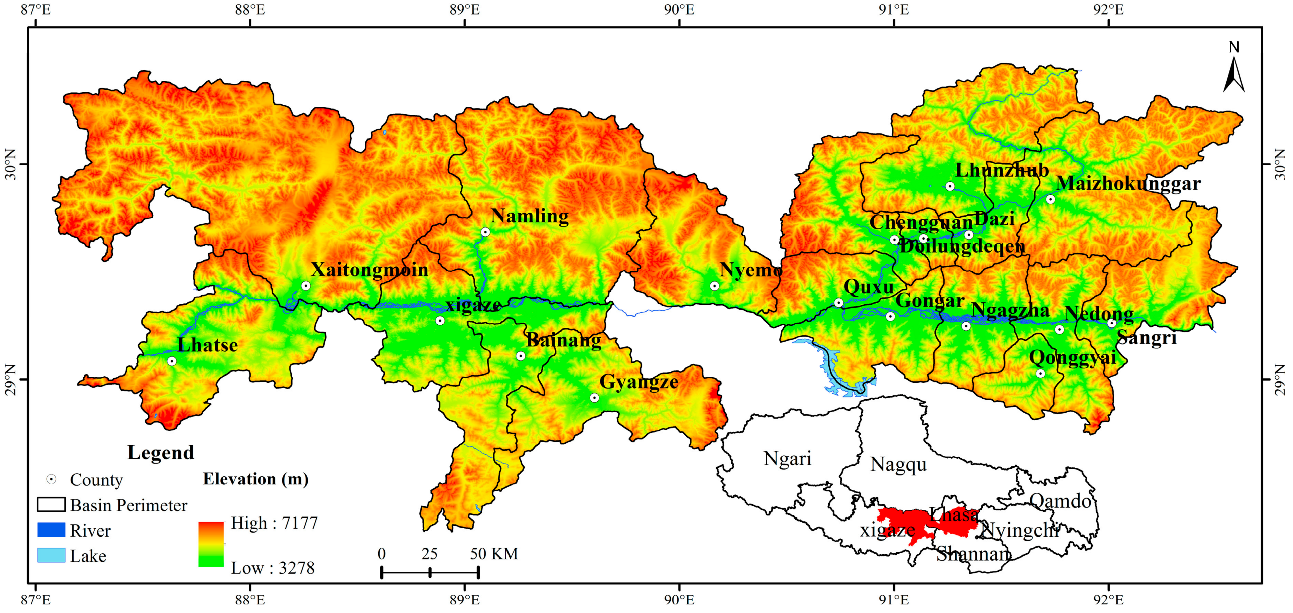
2.1. Study Area

The Yarlung Zangbo River and its two tributaries of Tibet refer to the area between the Yarlung Zangbo River and the first-class tributaries of the Yarlung Zangbo, Lhasa, and Nyang Qu Rivers. The administrative division includes the cities of Lhasa, Shannan, and Shigatse. A total of 18 districts and counties, a geographical range of 87°10′–92°38′ E, 28°18′–30°37′ N, and an area of 66,700 km2 were also utilized (Figure 1). The basin is located on the plateau with a temperate, semi-arid climate. The average temperature is 5–11 °C, the average annual rainfall is between 200–550 mm, and the average annual relative humidity is between 40–50%. The terrain in the basin is highly undulating, and the terrain is relatively high in the north and south, with the middle relatively flat. Both sides of the river are mostly developed into alluvial terraces, floodplains, and alluvial fans. The precipitation has a typical seasonality, and the rainy season occurs between June and September. It is the most important planting base in Tibet, with an area of 1229 km2 of arable land; the population in the basin is relatively dense, with a population of 1128,500 (2018), accounting for about one-third of the total population of Tibet, with a relatively high number of towns and a relatively developed economy. The road network density is high, and the GDP in 2018 reached CNY 69.475 billion; the vegetation is mainly alpine meadows, the soil type is mainly sandy loam, and the soil organic matter content is low. In recent years, with the continuous acceleration of the development intensity of the watershed, the population in the region has rapidly increased, resulting in increased tension in the relationship between people and land in the region [31,32,33,34,35,36].

2.2. Data and Preprocessing

LUCC is a complex dynamic change process occurring under the dual driving forces of human action and the natural environment. Referring to previous scholars’ relevant results of land use simulation and the actual development of plateau regions, we focused on two aspects: human and natural factors. Considering the actual development of the Yarlung Zangbo River and its two tributaries of Tibet, we then selected 17 driving factors as well as the elevation, temperature, and ecological function zoning as the limiting factors for regional development [37].
The land use data was adopted from the Resource and Environmental Science and Data Center of the Chinese Academy of Sciences (https://www.resdc.cn, accessed on 28 March 2022), the spatial resolution of the data was 30 m × 30 m, and the data years were 1990, 1995, 2000, 2005, 2010, 2015, 2018, and 2020. The land types were divided into six categories: forest land, grassland, agricultural land, water area, unused land, and residential area according to the land cover situation in the Yarlung Zangbo River and its two tributaries of Tibet. The results we re-evaluated, and the final overall classification accuracy attained a result higher than 90% [38]. The DEM data adopted the data from Geospatial Data Cloud (https://www.gscloud.cn, accessed on 28 March 2022). The slope extraction was completed on the basis of the DEM data. The resolution was 30 m × 30 m; the basic data, such as temperature, precipitation, and dryness, were obtained from the Tibet Autonomous Region Meteorological Bureau; the spatial resolution was 30 m × 30 m; and the soil data was obtained from the Institude of Tibetan Plateau Research, Chinese Academy of Sciences (https://www.tpdc.ac.cn, accessed on 28 March 2022). Distance values obtained from the government, highways, and railways were calculated using Euclidean distance; the grazing data in the Yarlung Zangbo River and its two tributaries of Tibet were adopted from the grid livestock density dataset of the FAO (https://data.apps.fao.org/, accessed on 28 March 2022), and the data were revised based on the actual surveys that were conducted. The night-light data were adopted from the data of the Institude of Tibetan Plateau Research, Chinese Academy of Sciences (https://www.tpdc.ac.cn, accessed on 28 March 2022); the ecological function zoning data was obtained from the Natural Resources Department of the Tibet Autonomous Region (Table 1).

3. Methods

The PLUS model adopts the cellular automata (CA) model based on the deep mining technology of land expansion rules and multiple types of random patch seeds. The CA model can better represent the complex land use/land cover (LULC) system. This study utilized the rule mining framework of the Land Expansion Analysis Strategy (LEAS) and a multi-type random seed (CARS)-based CA model, which can mine the drivers of land expansion and landscape change. Compared to the other models, the PLUS model (Figure 2) can achieve greater simulation accuracy and more similar landscapes, and LEAS can help researchers to investigate potential land use-conversion rules [28,39,40].

3.1. Landscape Presets

Three landscapes were set up for the study of future land use changes of the Yarlung Zangbo River and its two tributaries of Tibet; the periodic land use change landscape, the agricultural land conservation landscape, and the ecological conservation landscape, and the land expansion probability under each landscape was projected following a land use adaptation probability matrix which considered the following factors:
(1)
Periodic land use change landscape. In total, 17 driving factors were selected based on the past land use changes and regional land expansion factors (GDP, population, night lights, etc.) and natural factors (precipitation, dryness, elevation, rivers, etc.). In the actual development of the two rivers region, elevation, temperature, and ecological function were selected as the restrictive factors of regional development, and the Markov model was used to predict the scale of various types of land in the future without considering the restrictions of major policies.
(2)
Agricultural land conservation landscape. In the Markov model, the transfer matrix is modified to strictly control the conversion of agricultural land to residential areas, while reducing the conversion probability by 60% to strictly conserve agricultural land.
(3)
Ecological conservation landscape. Ecological restoration and ecological conservation have become an important part of regional and watershed developments. The ecological conservation landscape adds ecological function zoning; severely restricts the transformation of ecological conservation red line areas; and reduces the probability of converting waters (natural and artificial waters) to 30%, grassland and forest land to 50%, and agricultural land to residential areas to 30%. The reduced agricultural land is further converted into forest land, and making provisions for water systems and 100 m buffer zones also reduces the probability of land use changes.

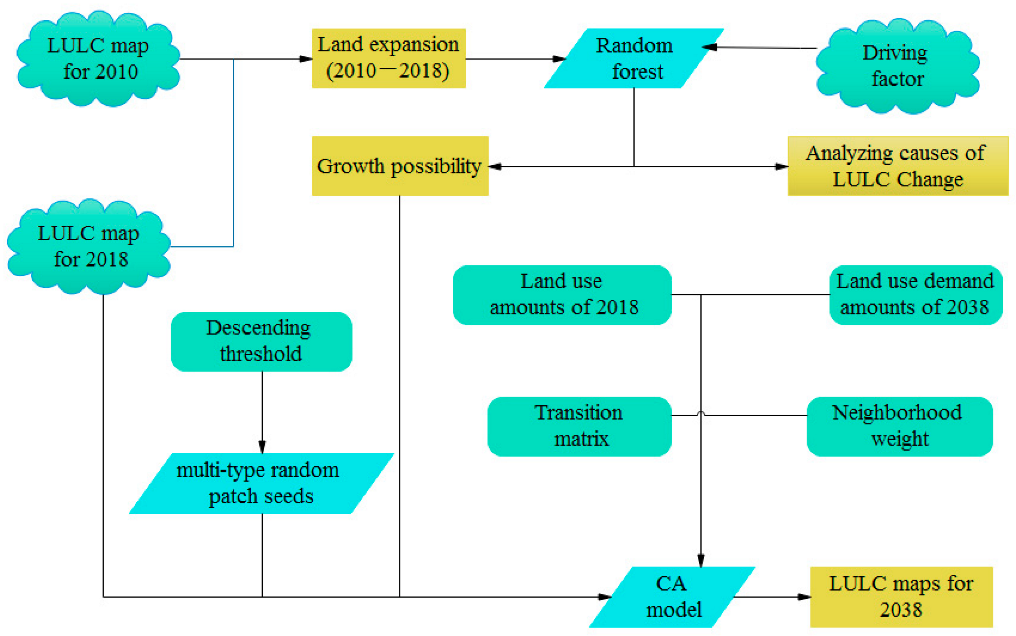
3.2. Land Use Multi-Landscape Simulation Parameter Setting

(1)
Forecast of Land use change
The PLUS model needs to determine the scale of various types of land in the future and use this as an input parameter. It will affect the final results obtained due to the differences in various land use types in the region in different landscapes. Therefore, we used the Markov model to predict the scale of land use changes in different landscapes considering these differences [41,42,43].
(2)
Spatial Neighborhood Weight Calculation
The spatial neighborhood weight indicates the difficulty of conversion between different land use types in the region. The parameter range was between 0 and 1. The closer the value to 1, the stronger the expansion ability. With reference to the existing research [38] and the actual situation of the Yarlung Zangbo River and its two tributaries of Tibet, the neighborhood weights that were in line with the actual region were set (Table 2).
(3)
Numerical calculation of adaptive inertial coefficient
The adaptive inertia is based on the difference between the predicted demand value of different types of local land use and the actual value of different land use types to adjust adaptively, which is close to the expected target [28], and its calculation format is as follows:
Y d t = { Y d t 1                 ( | X d t 1 | | X d t 2 | ) Y d t 1 × X d t 2 X d t 1                 ( | X d t 1 < X d t 2 < 0 | ) Y d t 1 × X d t 1 X d t 1                 ( | 0 < X d t 2 < X d t 1 | )
Y d t represents the inertia coefficient value of land use type d at time t ; Y d t 1 represents the difference between land use changes for land use type and actual land use type land value at time t 1 [29,44].
(4)
Restricted area setting and cost transfer matrix
The cost transfer matrix represents whether different land types in a region or watershed can be converted. A total of 0 means that different land types in a region or watershed cannot be converted, and 1 means that different land types in a region or watershed can be converted. With the formulation of regional ecological environment policies and the improvement of environmental conservation awareness, the possibility of the conversion of residential areas into other land types is very unlikely. Therefore, in all three landscapes, it is determined that a residential area cannot be converted into other land types [45,46,47]. The conversion between them needs to be considered in relation to the specific application of the landscape. For periodic land use changes, other land types can be converted; in the agricultural land conservation landscape, all other land types can be converted into agricultural land, but agricultural land cannot be converted; in an ecological conservation landscape; forest land and water areas cannot be converted into other land types. See Table 3 for details.
Considering Tibet’s special ecological environment status and ecological value [38], in the spatial pattern of regional land use, the natural reserves, ecological function zoning, restricted development areas, prohibited development areas, and national parks cannot be transformed into three landscapes. Converting it into a restricted area, its grid value is represented by 0, which is used as a restriction factor in the model [48,49,50].

4. Results

A cross-validation of the various types of periodic land use changes in the Yarlung Zangbo River and its two tributaries of Tibet in 2018 simulated by the Markov–PLUS model and the actual land use data of various types in the region in 2018 could be obtained. The kappa value was 0.93, indicating that the statistical precision reached a high level.
(1)
Quantity accuracy check
It can be observed from Table 4 that the simulation accuracy is generally at a high level, with an average of 95.867%. Except for the water area, which is 86.512%, the simulation accuracy of the rest of the land types exceeds 90%. Therefore, it can be determined that the accuracy of the different land types simulated by the Markov–PLUS model is high, and it can simulate well the land use changes in different land types in the Yarlung Zangbo River and its two tributaries of Tibet. Since there are many small rivers and mountain lakes in the Yarlung Zangbo River and its two tributaries of Tibet, they are easily replaced by other land types in the transformation of land type simulations. Therefore, this is also one of the reasons for the low accuracy of a water-land-type simulation.
(2)
Spatial matching accuracy
By comparing the actual land use data of the Yarlung Zangbo River and its two tributaries of Tibet in 2018 with the simulated land use data of the region in 2018, it was observed that the land use data presented a high degree of similarity in space. By constructing the confusion transition matrix of the land use simulation, the kappa value was calculated to be 0.93, which further shows that the model can simulate well the state of regional land use changes.

4.1. The Overall Change of the Landscape Pattern in the Study Area

In 1990, the main land types in the districts and counties in the Yarlung Zangbo River and its two tributaries of Tibet were agricultural land, grassland, and unused land, with areas of 259,717.77 hm2, 5,267,936.7 hm2, and 784,635.57 hm2, respectively. The categories were grassland, woodland, and unused land, with areas of 3,159,581.76 hm2, 1,031,285.16 hm2, and 1,326,928.14 hm2, respectively. These three land use types accounted for 90% of the total area of the watershed. In the past 30 years, due to the intensification of regional development and human activities, the residential area had a high expansion capacity, reaching figures of 32.4%, 29.57%, and 26.17% for the periodic land use change landscape, the agricultural land conservation landscape, and the ecological conservation landscape, respectively.
From the perspective of landscape ecology and the overall landscape pattern, the Shannon diversity and Shannon evenness indices both showed a fluctuating trend from 1990 to 2005, were in a state of rapid increase from 2005 to 2010, and have continued to increase in a fluctuating manner since then (Figure 3a). This indicates that the types of landscape patches increase or that each patch type presents a balanced trend distribution in the landscape, and the influence of the dominant components in the landscape structure on the overall landscape pattern is weakened, the fragmentation degree of the overall landscape is gradually increasing, and the dominant or dominant types of landscapes appear evenly distributed in the region as a whole [51,52].
From the perspective of a single land use type, the dynamic changes in the landscape pattern present their own characteristics. (1) The agglomeration degree of agricultural land was at the middle level throughout the study period (Figure 3b), showing a continuous patchy distribution in general, but its shape index (Figure 3c) was at the middle level and declined in recent years. The development of large-scale standardized farmland construction, the conservation of basic farmland, and the occupation of fragmented farmland by residential area tend to make the farmland relatively concentrated. (2) After 1995, the agglomeration degree of the residential area rapidly increased, the patch density and landscape shape index were in an oscillating state, and the patch size and landscape connectivity steadily increased. After 1998, the aggregation degree of the residential area (Figure 3b) significantly increased. (3) The aggregation degree of grassland as a whole slightly decreased, and the shape index slightly increased. The average patch area decreased, and the patch density increased. Although it tended to be stable after 2010, there was a trend towards morphological complexity and fragmentation. (4) The forest land indices fluctuated considerably in the early stage of the study, and after 2010. The various landscape indices maintained a relatively stable state. (5) The water indices fluctuated considerably in the early stage of the study, and the water connectivity index (Figure 3d) was in a state of high fluctuation, indicating that the water landscape had a strong ability to respond to the disturbance of human activities. The intensified agricultural and animal husbandry activities disrupted the landscape connectivity of the waters and exacerbated the fragmentation of the water landscape. (6) The types of unused land were in a state of shock throughout the study period. After 2010, the landscape indices of the types of unused land tended to be in a stable state. Due to the increased management efforts of the government, the development of unused land indiscriminately resulted in a relatively great improvement.

4.2. Analysis of the Driving Mechanism of Land Expansion

Combined with the contribution factor results (Figure 4) for the various types of transformations occurring in the driving mechanism of species expansion in the study area, a driving mechanism analysis was performed according to each type of transformation. The results show that the evolution of species in the Yarlung Zangbo River and its two tributaries of Tibet is affected by a combination of factors; the basic geographical conditions and socio-economic levels lead to obvious spatial differences, and different driving factors in significant differences in the increase or decrease in the scale of species in the basin.

4.3. Analysis of Multi-Landscape Simulation Results

In the setting of various landscapes, the land use types of watershed land have significant differences.
(1)
Periodic land use change landscape
The periodic land use change landscape presents the changes occurring in regional land use only from human and natural driving factors, without considering the regional development policy. Under the periodic land use change landscape, the forest area of the Yarlung Zangbo River and its two tributaries of Tibet in 2038 will be 725,488.20 hm2. In comparison to 2018, this figure will decrease by 29.65%, while grassland and agricultural land will increase by 2% and 0.13%, respectively, the water area will decrease by 2.95%, the residential area will increase by 32.44%, and unused land will increase by 18.22%. From the data perspective, under the influence of human activities, the residential area in the river basin rapidly increased to meet the needs of regional social and economic development without being constrained by policies. The transferred land was mainly forest land and a water area. The expansion of the residential area mainly occurred along the river valley in the original land space, mainly distributed in the Chengguan District, DuilongDeqing District, Dazi District, Sangzhuzi District, Gyantse, and Nedong District of Shannan City. Zhanang and Gonggar mainly occupy areas with typical ecological functions and values, such as water areas and forest land (Figure 5a). If no restrictions are imposed, the regional ecological environment will be severely damaged. In general, under the periodic land use changes, because it is not subject to the rigid constraints of the policy, the residential area in the basin will rapidly expand, while the ecological land, such as forest land and water area, will be considerably reduced, and the overall socio-economic–ecological system in the basin will be challenged and at high risk [53].
(2)
Agricultural land conservation landscape
Agricultural land conservation is based on strict conservation of agricultural land, prohibiting or restricting the conversion of agricultural land into other land use types. Compared to other landscape, agricultural land increased by 3.12% compared to 2018; the forest land and water area decreased by 27.28% and 6.62%, respectively, compared to 2018; the grassland area increased by 1.79% compared to 2018; and unused land type increased by 16.9% (Figure 5b).
(3)
Ecological conservation landscape
In response to the policy of “adhering to the integrated conservation and systematic management of mountains, rivers, forests, fields, lakes, grass, sand and ice on the Qinghai–Tibet Plateau”, the ecological conservation landscape was set up. The simulation results show that the ecological conservation landscape can effectively conserve the forest land, water area, and grassland present in the basin. Compared to 2018, in 2038, the forest area in the basin will be 1,076,375.16 hm2, an increase of 4.37%; the grassland area will be 3,232,238.67 hm2, an increase of 2.3%; the water area will be 190,270.53 hm2, an increase of 9.01%; and the area of unused land types will be 1,214,428.05 hm2, a decrease of 8.48%. Under the ecological conservation landscape, the land types with considerable changes in land use types are mainly concentrated in the agricultural, water, and residential areas. Compared to 2018, the area of agricultural land will decrease by 25,514.28 hm2, a decrease of 11.44%; the expansion of residential areas is still evident, and the expansion rate will reach 26.17% (Figure 5c).

4.4. Dynamics of Land Landscape Pattern in Multi-Landscape Simulation

Due to the inclusion of three landscape settings, the periodic land use changes, the agricultural land conservation, and the ecological conservation landscape, the landscape pattern in the basin presented different characteristics [54]. In terms of the overall landscape pattern from the perspective of landscape ecology, the differences in the Shannon diversity and evenness indexes in the three landscapes in 2038 were not significant (Figure 3a), indicating that the intensity of residential area expansion and agricultural and animal husbandry production activities will not significantly increase in the three landscapes.
From the perspective of a single land use type, the dynamic changes occurring in the landscape pattern presented their own characteristics:
(1)
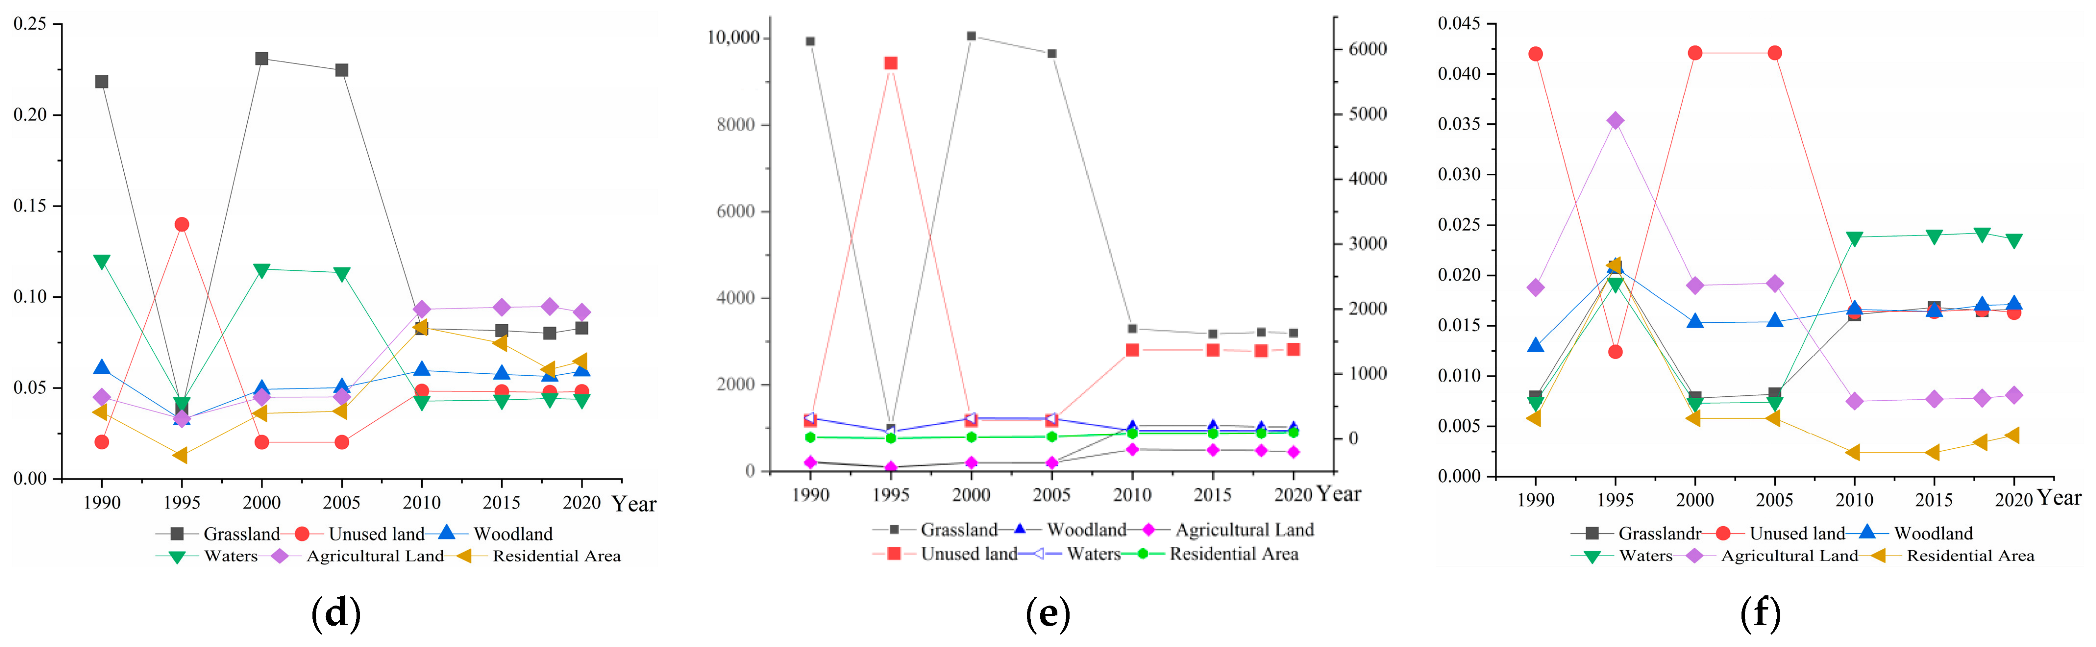
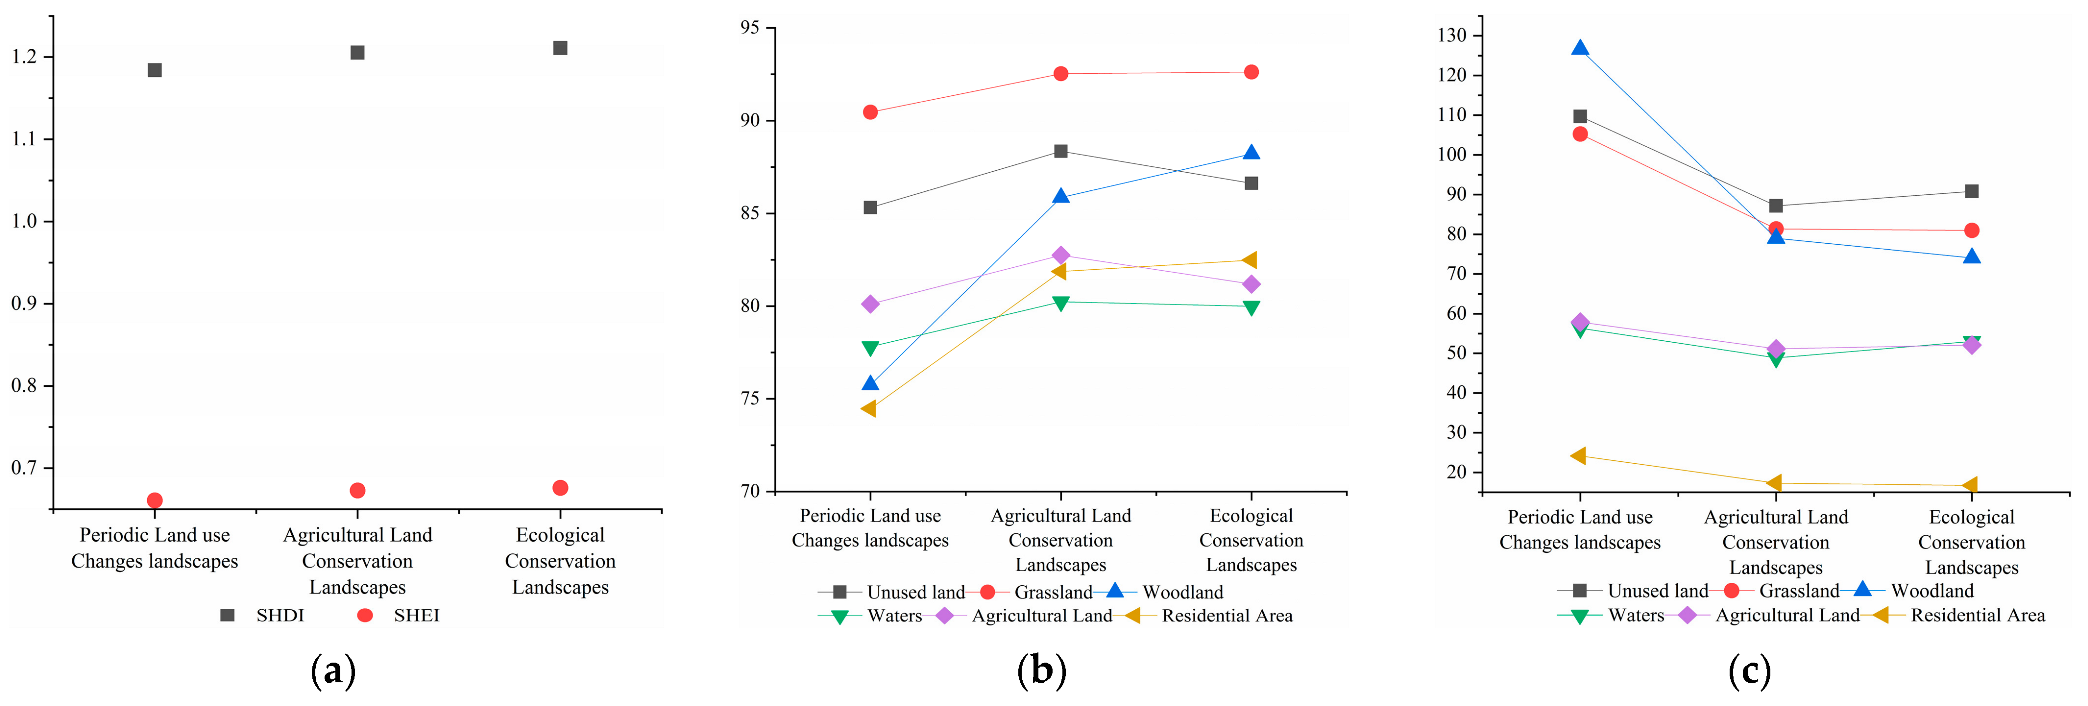
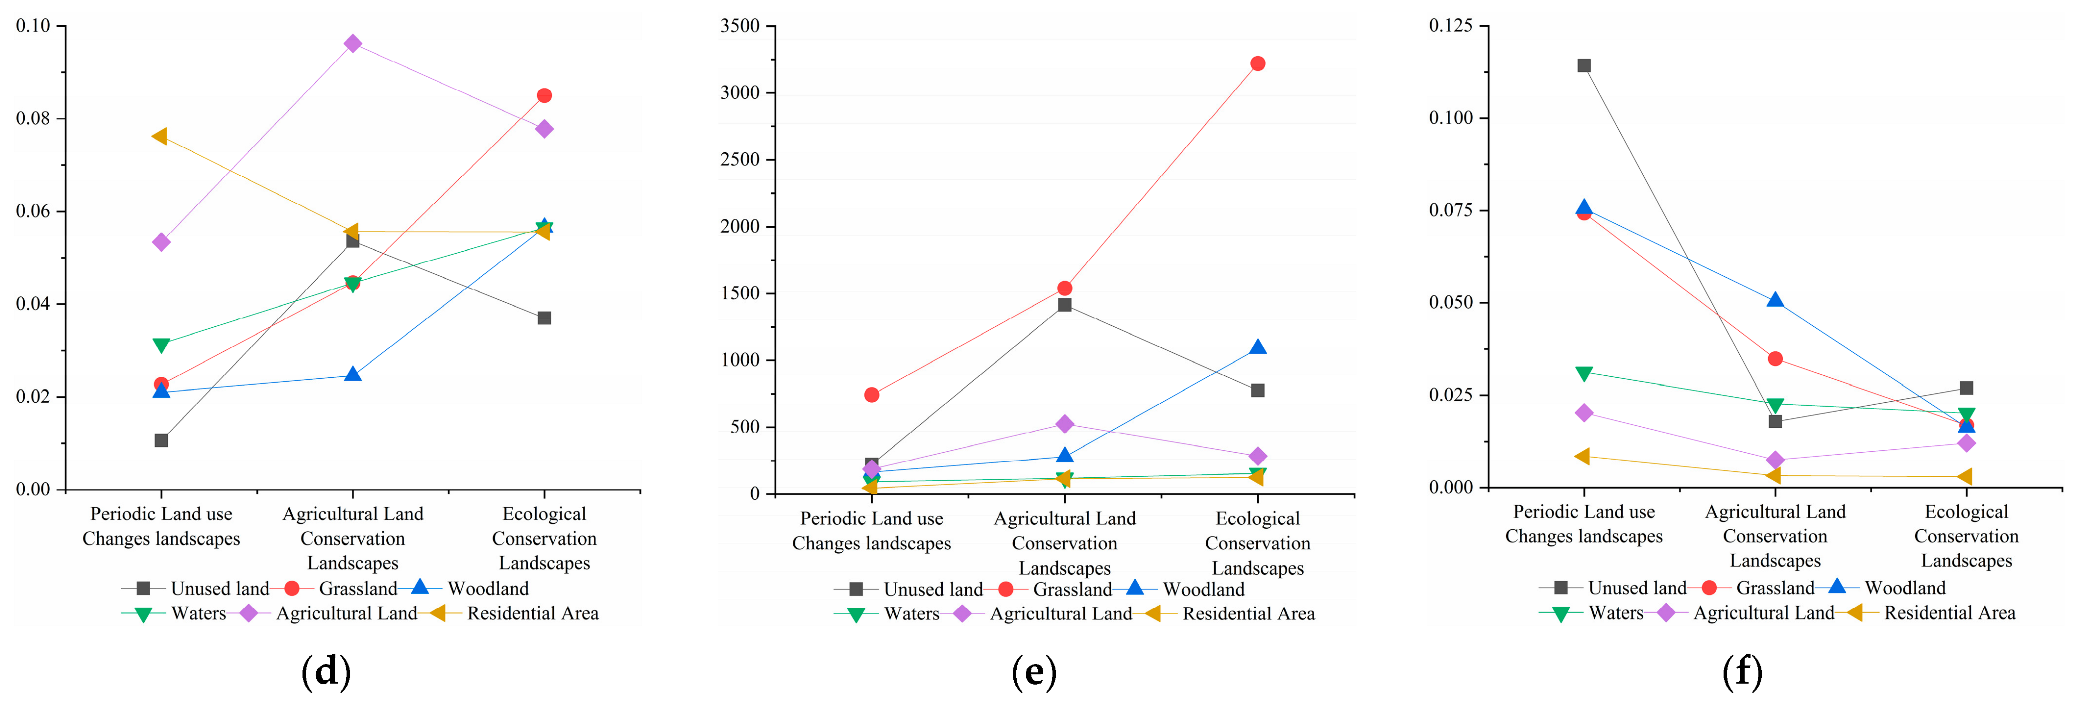
The periodic land use changes landscape, due to the lack of regional policies and national development guidelines, each type of landscape pattern presents agricultural land, ecological land landscape fragmentation, a complex shape, and low connectivity compared to the other two landscapes. The aggregation index of grassland in the periodic land use change landscape is only 90.46%, which is less than that of the agricultural land conservation and ecological conservation landscapes. The aggregation index of forest land is only 75.75% in the periodic land use changes landscape, much lower than the agricultural land conservation landscape and the ecological conservation landscape. The aggregation index values of agricultural land and residential area in the periodic land use change landscape are 80.12% and 74.47%, respectively, which are also lower than those in the agricultural land conservation landscape, and the result for the ecological conservation landscape is 0.053, which is lower than the agricultural land conservation landscape and the ecological conservation landscape (Figure 6). It is also explained that under the development situation at present, there is a risk of hindering the improvement of agricultural productivity due to the fragmentation of agricultural land landscapes, and there is also the fragmentation and complication of the ecological landscape, which will lead to the migration of organisms, plant production efficiency and other activities. The problem of a negative impact reflects the urgent need for scientific management and the configuration of future land use activities.
(2)
In agricultural land conservation, the connectivity index and the average patch size of the agricultural land were significantly higher than those of the other two landscapes, and their indices were 0.096 and 524.812, respectively (Figure 6). The shape index and patch density of the landscape are less than those of the other two landscapes, with their indices being 51.139 and 0.0075, respectively (Figure 6). In this landscape, the agricultural landscape tends to be concentrated, the degree of fragmentation is reduced, and the landscape shape is regular and orderly. The trend shows that agricultural land has been better conserved in agricultural land conservation practices. However, in the arable land conservation priority development landscape, the landscape connectivity and average patch density of forest land, water area, and grassland are lower than the ecological conservation landscape, and the ecological-type landscape shows a fragmentation trend. Contradictions are still prominent.
(3)
Under the ecological conservation landscape, due to the establishment of a regional sustainable development path for the coordinated development of regional ecological environment conservation and economic development, compared with the periodic land use change and ecological conservation landscapes, the landscape connectivity and fragmentation of the ecological land are higher. Both the degree and connectivity have been considerably improved. The aggregation index values of woodland and water are 88.21% and 80.00%, respectively, the landscape shape index values are 74.06 and 52.99, and the average patch size values are 1088.14 and 155.76 (Figure 6). However, there is also the risk of the fragmentation of agricultural land and reduced landscape connectivity, with the patch size and landscape connectivity index of agricultural land being 283.89 and 0.078, respectively (Figure 6), thereby hindering the risk of agricultural productivity improvement. The landscape connectivity index is only 0.056, which hinders the development of large- and medium-sized cities in the region. Therefore, how to balance regional ecological environment conservation and the sustainable and healthy development of the regional economy has become a challenge for regional development practices.

5. Discussion

Based on the Markov–PLUS model, this study selected 17 driving factors from two different aspects, including human and natural factors, after comprehensively considering the actual situation of the affected area, and selected elevation, temperature, and ecological functions in combination with the actual development of the Yarlung Zangbo River and its two tributaries of Tibet. Zoning is a limiting factor for regional development, and by controlling the efficiency of land use conversion, it can better simulate the land use status of various types of land in the study area in the future. The simulation results can provide data support and reference for the early implementation of ecological security warnings, territorial spatial planning, and food production consumption security in the study area.
The landscape pattern can reflect the spatial structure characteristics of the regional landscape and the spatial distribution and spatial combination of land patches [55]. The changes in the landscape pattern profoundly affect the evolution of the regional ecological environment [56,57]. The research conducted on the dynamic change in landscape patterns can reflect the changes occurring in the regional ecological environment [58]. The dynamic research of landscape pattern has become a hot topic in landscape ecology research at home and abroad [59,60]. At present, regional landscape patterns are qualitatively characterized by extracting ground object images using analytical [61] and mathematical model methods [62]. Analysis methods are also used to evaluate the security of the regional ecological environment.
Under the condition of periodic land use changes, due to the absence of restrictions of regional policies and national development guidelines, the expansion rate of residential areas is rapidly increasing, types of important ecological land such as forest land and water areas are rapidly decreasing, and the ecological security of the river basin is under serious threat. Arable land is also at risk of diminishing, and there is a food security crisis (Table 5). Under the condition of agricultural land conservation, agricultural land has been conserved to a certain extent, and the expansion of residential areas has been restrained to a certain extent. Forest land and water areas have become the main types of land to be transferred out, mainly being turned into agricultural land extrusion areas (Table 5). Under the condition of ecological conservation landscape, areas of ecological land, such as forest land, grassland, and water areas, are increasing, and other land use types have been regulated to a certain extent. It is considered that, no matter what type of regional development landscape exists, due to the intensification of human activities and the rapid development of the regional social economy, the momentum of residential area expansion cannot be prevented (Table 5). If regional policies are not restricted, it will inevitably lead to major changes in regional land use structures, which is a serious challenge to regional ecological and food security, and it is difficult to achieve the harmonious development of a regional ecology–economy–society–food balance. Different land use results can be obtained by simulating regional land use changes for different landscape developments, and unreasonable land use practices can be adjusted further in combination with the land use simulation results in order to achieve sustainable development practices in the region. Although the research to date can better understand the reality of future land use development practices, several shortcomings remain evident.
(1)
The use and change of land resources is a complex and dynamic process of change. Although 17 driving factors, restrictive factors, and regional policy restrictions were selected by combining human and natural factors in the study, the climate change occurring in Tibet is drastic. The influence of climate change is not considered separately, and the influence factors of the model will be further optimized in the follow-up research in the future [63,64].
(2)
The study determined that the simulation accuracy of various types of land use practices was highly dependent on the pixel size. The smaller the pixel, the higher the simulation accuracy, indicating that the research accuracy can be improved further with the refinement of the study area.
(3)
There is a certain degree of subjectivity in the setting of model parameters. For example, the spatial neighborhood weight basically refers to the research results of previous studies, and is determined according to the human influence of different land types in the Yarlung Zangbo River and its two tributaries of Tibet. Although the simulation is achieved after continuous debugging, in the future, more objective model parameters need to be consistently determined in the research.
(4)
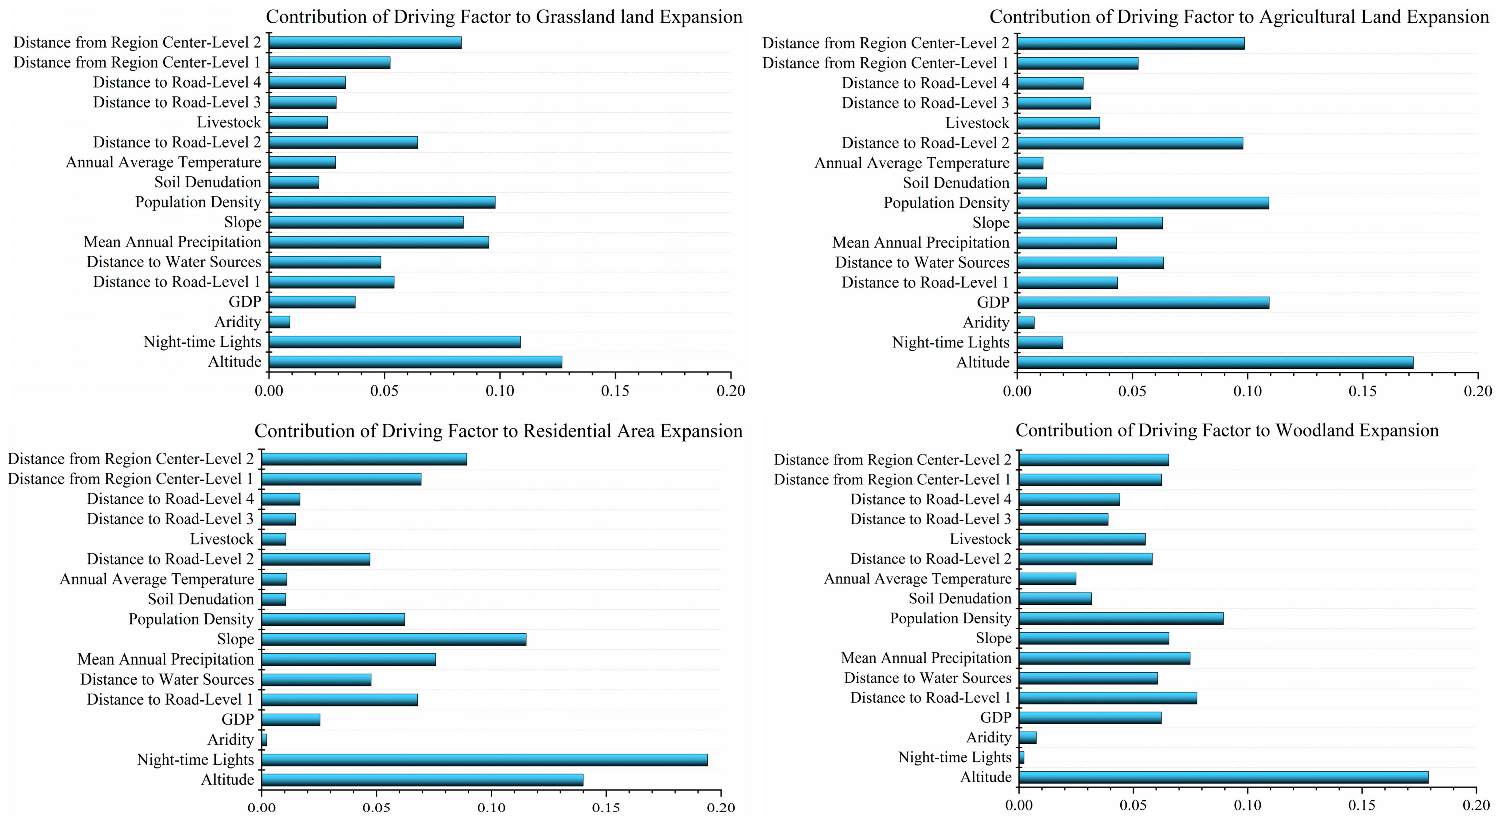
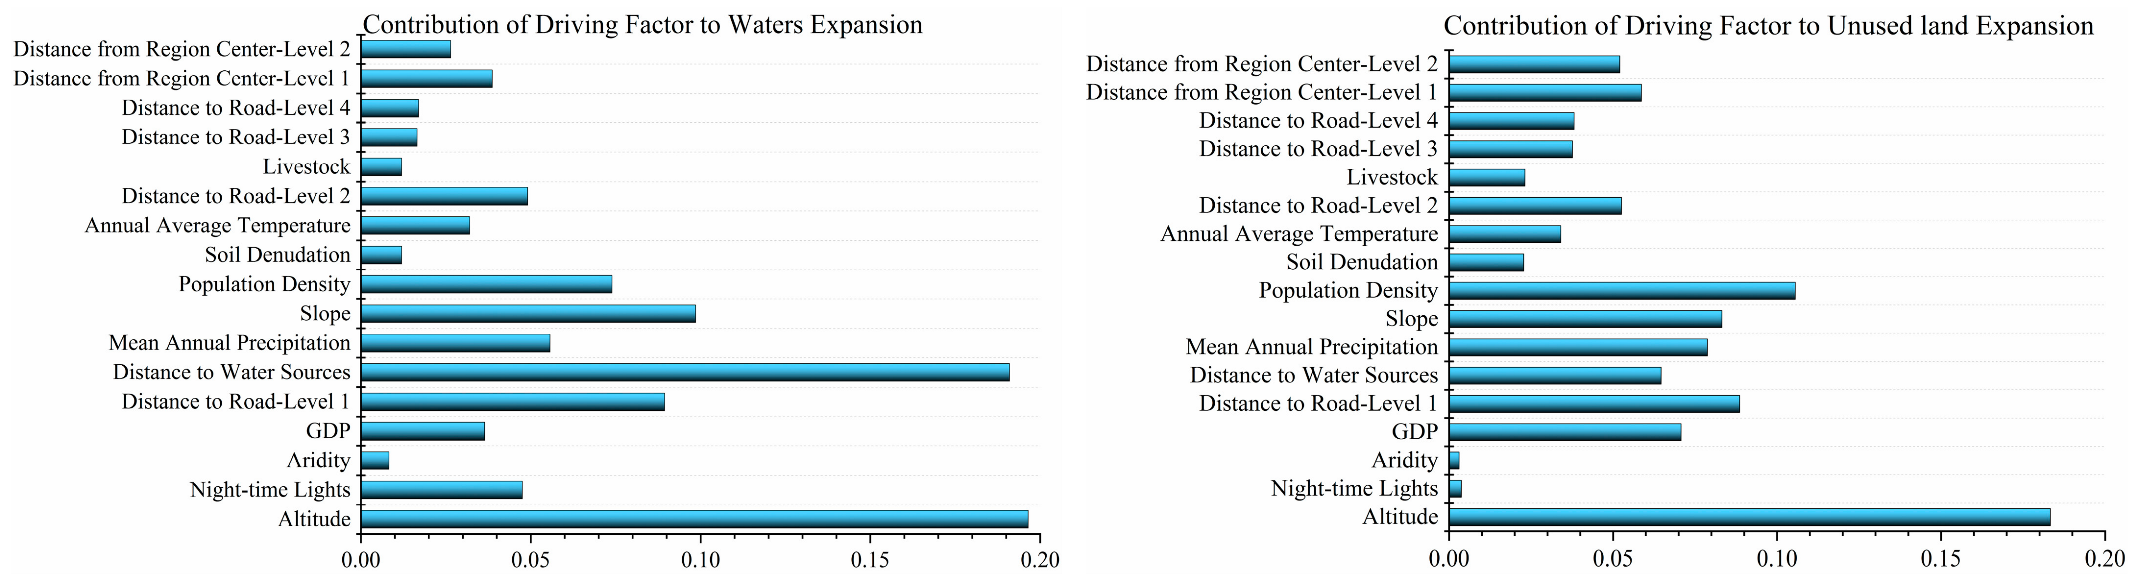
Grassland expansion is mainly affected by altitude, population density, precipitation, topography, and distance from the roads (Figure 4). The expansion of agricultural land is mainly affected by altitude, GDP, population density, and road distance (Figure 4). The expansion of forest land is mainly affected by altitude, population density, and precipitation (Figure 4). The water expansion is mainly affected by altitude, distance from rivers, slopes, and road distances (Figure 4). The expansion of residential areas is mainly affected by lighting conditions at night, altitude, slope, and the distance from the city (Figure 4).

6. Conclusions

By obtaining the land use data of the districts and counties present in the Yarlung Zangbo River and its two tributaries of Tibet in 2000, 2005, 2010, and 2018 as the benchmark data, on the basis of verifying the model fit, a simulation of the region in 2038 based on the Markov-PLUS model was conducted. The spatial pattern of land use types in three land use landscapes in the Yarlung Zangbo River and its two tributaries of Tibet, and its changes, were analyzed, and the following conclusions were obtained:
(1)
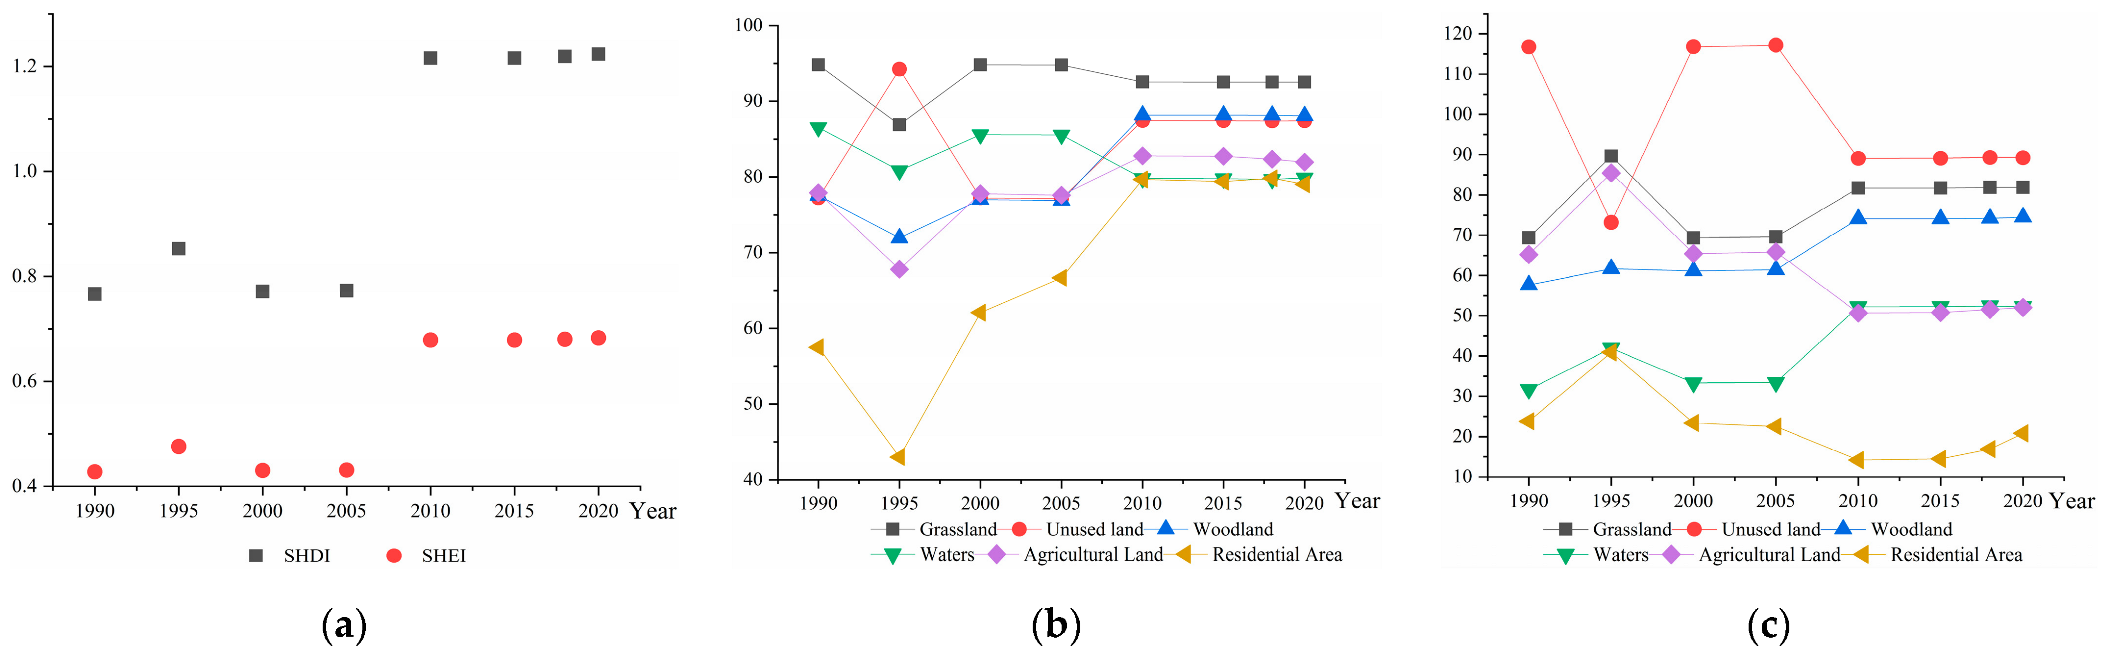
The landscape pattern of the watershed drastically changes, and the landscape pattern of different land types is different. Due to the rapid expansion of residential areas, the intensity of agricultural and animal husbandry production activities increased. In the past 30 years, each patch type of the watershed landscape presented a balanced distribution in the landscape, the dominant components in the landscape structure weakened the influence of the overall landscape pattern, and the overall trend was fragmented and balanced. In all kinds of land use landscapes, in addition to the trend towards regularization of agricultural land, affected by the development trends of fragmentation of residential areas, ecological land also showed a trend of fragmentation and a complex shape, and the conflict between urban development and ecological conservation in the river basin was intensified (Figure 4).
(2)
The Markov–PLUS model has a high simulation accuracy for different land types in the study area, and can sufficiently simulate the changes in the demand for different land types in the Yarlung Zangbo River and its two tributaries of Tibet (Table 4). The cross-validation of the various types of periodic land use changes in the Yarlung Zangbo River and its two tributaries of Tibet in 2018 simulated by the Markov–PLUS model and the actual land use data of various types in the region in 2018 shows that the kappa value is 0.93. This model can be used to predict the changes in land use and land types in the districts and counties of the river basin, and even the plateau basin.
(3)
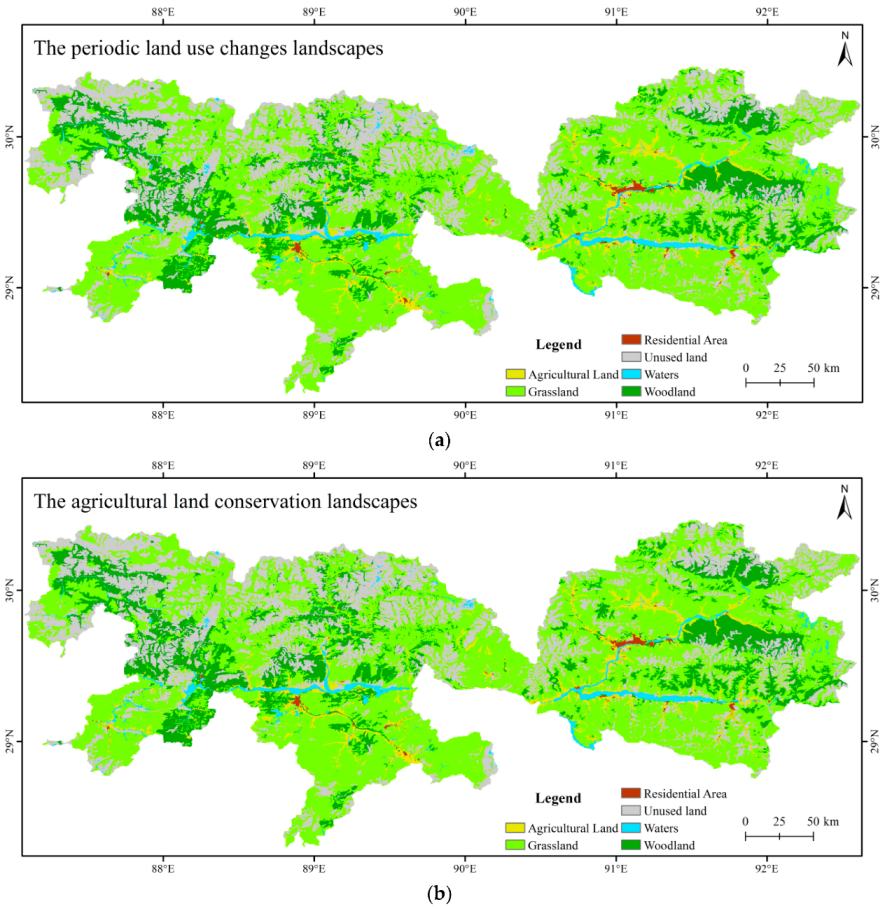
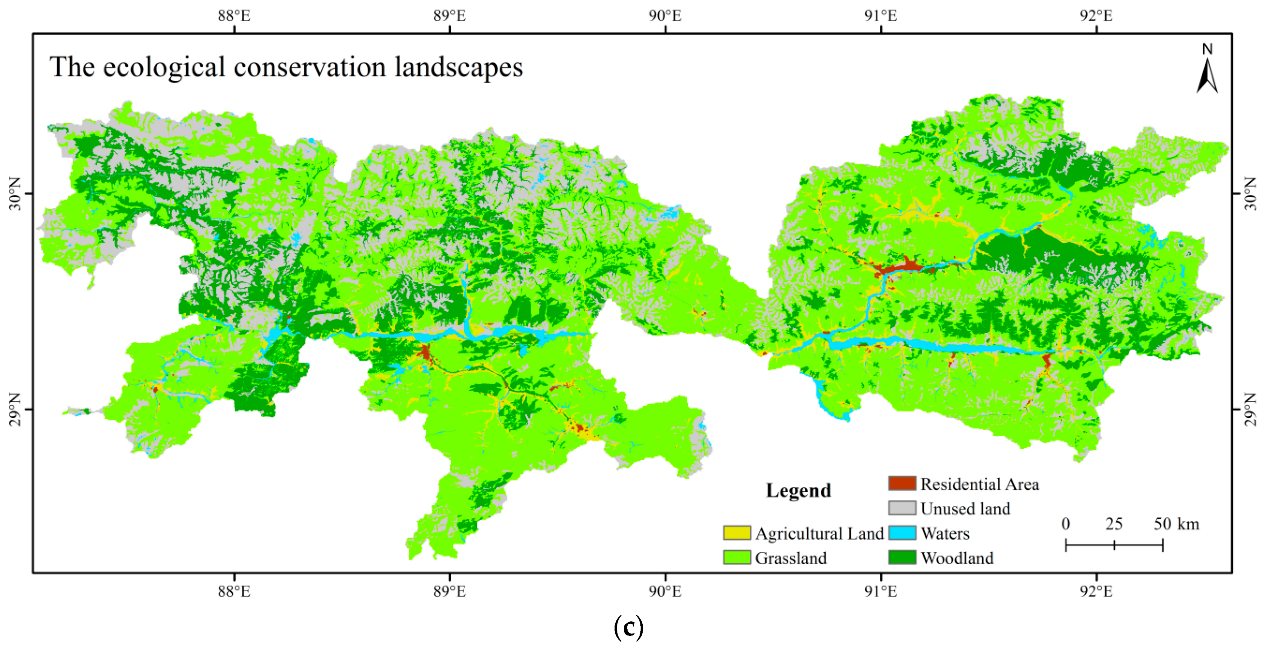
The three development landscapes basically reflect different regional development models. From the perspective of the spatial pattern of land use expansion, the three development landscapes show the most significant changes in agricultural land, forest land, water area, and grassland. The landscape pattern of the periodic land use changes presents the characteristics of disordered development, and the landscape tends to be fragmented and complicated. In the agricultural land conservation landscape, as a result of the management and control of agricultural land, the agricultural land landscape tends to develop in a regular and orderly manner, but attention should be paid to the conflict occurring between agricultural land and ecological conservation practices. In the ecological conservation landscape, the ecological space and residential area are conserved and controlled, meeting the requirements of ecological conservation (Figure 3).
(4)
With the rapid social and economic development of Tibet and the steady improvement of the level of urbanization, it is determined that the expansion of the residential area is irreversible in the future, but a disorderly expansion will threaten the food and ecological security in the region. While ensuring social and economic developments in the basin, it is necessary to consider the efficient use of residential areas in the basin in the future, and ecological land, such as forest land, grassland, and water area, and production land, such as agricultural land, should not be encroached.

Author Contributions

Conceptualization, W.H. and Z.C.; methodology, W.H. and Z.C.; software, W.H.; validation, Z.C.; formal analysis, W.H. and S.O.; investigation, W.H. and S.Y.; resources, W.H. and Z.C.; data curation, W.H. writing—original draft preparation, W.H.; writing—review and editing, Y.Q.; visualization, D.S.T. and X.F.; supervision, Z.C.; project administration, D.S.T., X.F. and S.O.; funding acquisition, Z.C., Z.W. and S.Y. All authors have read and agreed to the published version of the manuscript.

Funding

This research was funded by the Second Tibetan Plateau Scientific Expedition and Research Program (Project Numbers: 2019QZKK1006) and Tibet Agriculture and Animal Husbandry University-Nanjing Agricultural University Joint Fund Project (Project Numbers: KYYZ2022002) and Humanities and Social Science Planning Foundation of the Ministry of Education (Project Numbers: 20XZJAZH001) and Scientific Research Projects of Hubei Education Department (Project Numbers: B2018376).

Institutional Review Board Statement

Not applicable.

Informed Consent Statement

Not applicable.

Data Availability Statement

Data sharing is not applicable to this article.

Acknowledgments

A special acknowledgment should be expressed to Xun Liang from the High-Performance Spatial Computational Intelligence Lab of China University of Geosciences (HPSCIL@CUG) for his assistance and valuable suggestions. We would like to thank Chen Li from Yunnan Normal University, whose help in research methodology was one of the important factors in improving the quality of our paper. We also want to express our sincere thanks to the Editor-in-Chief of the journal and the three anonymous reviewers, whose pertinent comments were decisive in enhancing the quality of this paper.

Conflicts of Interest

The authors declare no conflict of interest.

References

  1. Ning, J.; Liu, J.; Kuang, W.; Xu, X.; Zhang, S.; Yan, C.; Li, R.; Wu, S.; Hu, Y.; Du, G.; et al. Spatiotemporal patterns and characteristics of land-use change in China during 2010–2015. J. Geogr. Sci. 2018, 28, 547–562. [Google Scholar] [CrossRef] [Green Version]
  2. Chen, W.X.; Li, J.F.; Zeng, J.; Ran, D.; Yang, B. Spatial heterogeneity and formation mechanism of eco-environmental effect of land use change in China. Geogr. Res. 2019, 38, 2173–2187. [Google Scholar]
  3. Arrow, K.; Bolin, B.; Costanza, R.; Dasgupta, P.; Folke, C.; Holling, C.S.; Jansson, B.-O.; Levin, S.; Mäler, K.-G.; Pimentel, D.; et al. Economic growth, carrying capacity, and the environment. Ecol. Econ. 1995, 15, 91–95. [Google Scholar] [CrossRef]
  4. Cai, C.; Shu, B.; Zhu, H.; Yuan, X.; Yong, X. Modeling Land Use Change by Considering Regional Heterogeneous Driving Mechanism. China Land Sci. 2020, 34, 38–47. [Google Scholar]
  5. Dai, E.; Ma, L. Review on land change modeling approaches. Prog. Geogr. 2018, 37, 152–162. [Google Scholar]
  6. Wang, L.; Qian, L. An Reviews of Model Methods on Land Use and Land cover Change. J. Henan Univ. Nat. Sci. 2005, 35, 52–57. [Google Scholar]
  7. Deng, X.C.; Chen, Y.B. Land use change and its driving mechanism in Dongjiang River basin from 1990 to 2018. Bull. Soil Water Conserv. 2020, 40, 236–242. [Google Scholar]
  8. Lu, X.; Shi, Y.; Chen, C.; Yu, M. Monitoring cropland transition and its impact on ecosystem services value in developed regions of China: A case study of Jiangsu Province. Land Use Policy 2017, 69, 25–40. [Google Scholar] [CrossRef]
  9. Lichtenberg, E.; Ding, C. Assessing farmland protection policy in China. Land Use Policy 2008, 25, 59–68. [Google Scholar] [CrossRef]
  10. Castro, P.; Pedroso, R.; Lautenbach, S.; Vicens, R. Farmland abandonment in Rio de Janeiro: Underlying and contributory causes of an announced development. Land Use Policy 2020, 95, 104633. [Google Scholar] [CrossRef]
  11. Zhu, J.; You, X.; Xia, Q.; Zhang, H. Battlefield Geographic Environment Data Organizational Process Modeling Based on OOPN. Geomat. Inf. Sci. Wuhan Univ. 2020, 45, 1027–1034. [Google Scholar]
  12. Zhang, X.R.; Li, A.N.; Nan, X.; Lei, G.; Wang, C. Multi-scenario simulation of land use change along China-Pakistan Economic Corridor through coupling FLUS model with SD model. J. Geo-Inf. Sci. 2020, 22, 2393–2409. [Google Scholar]
  13. Boysen, L.R.; Brovkin, V.; Arora, V.K.; Cadule, P.; de Noblet-Ducoudré, N.; Kato, E.; Pongratz, J.; Gayler, V. Global and regional effects of land-use change on climate in 21st century simulations with interactive carbon cycle. Earth Syst. Dyn. 2014, 5, 309–319. [Google Scholar] [CrossRef] [Green Version]
  14. Cai, Y.L. A study on land use/cover change: The need for a new integrated approach. Geogr. Res. 2001, 20, 645–652. [Google Scholar]
  15. Davies-Barnard, T.; Valdes, P.J.; Singarayer, J.S.; Pacifico, F.M.; Jones, C.D. Full effects of land use change in the representative concentration pathways. Environ. Res. Lett. 2014, 9, 114014. [Google Scholar] [CrossRef]
  16. Foley, J.A.; DeFries, R.; Asner, G.P.; Barford, C.; Bonan, G.; Carpenter, S.R.; Chapin, F.S.; Coe, M.T.; Daily, G.C.; Snyder, P.K.; et al. Global consequences of land use. Science 2005, 309, 570–574. [Google Scholar] [CrossRef] [PubMed] [Green Version]
  17. Shukla, P.R.; Skeg, J.; Buendia, E.C.; Masson-Delmotte, V.; Pörtner, H.-O.; Roberts, D.C.; Zhai, P.; Slade, R.; Connors, S.; van Diemen, S. (Eds.) Climate Change and Land: An IPCC Special Report on Climate Change, Desertification, Land Degradation, Sustainable Land Management, Food Security, and Greenhouse Gas Fluxes in Terrestrial Ecosystems; IPCC: Geneva, Switzerland, 2019. [Google Scholar]
  18. Meyer, W.B.; Meyer, W.B.; Turner, I.I.B.L. (Eds.) Changes in Land Use and Land Cover: A Global Perspective; Cambridge University Press: Cambridge, UK, 1994; Volume 4. [Google Scholar]
  19. Bayer, A.D.; Lindeskog, M.; Pugh, T.A.; Anthoni, P.M.; Fuchs, R.; Arneth, A. Uncertainties in the land-use flux resulting from land-use change reconstructions and gross land transitions. Earth Syst. Dyn. 2017, 8, 91–111. [Google Scholar] [CrossRef] [Green Version]
  20. Hua, L.; Squires, V.R. Managing China’s pastoral lands: Current problems and future prospects. Land Use Policy 2015, 43, 129–137. [Google Scholar] [CrossRef]
  21. Winkler, K.; Fuchs, R.; Rounsevell, M.; Herold, M. HILDA+ (HIstoric Land Dynamics Assessment+) global land use change between 1960 and 2019. PANGAEA 2020, 12, 2501. [Google Scholar] [CrossRef]
  22. Giri, C.P. (Ed.) Remote Sensing of Land Use and Land Cover: Principles and Applications; CRC Press: Boca Raton, FL, USA, 2012. [Google Scholar]
  23. Gutman, G.; Janetos, A.C.; Justice, C.O.; Moran, E.F.; Mustard, J.F.; Rindfuss, R.R.; Skole, D.; Turner, B.L.; Cochrane, M.A. (Eds.) Land Change Science: Observing, Monitoring and Understanding Trajectories of Change on the Earth’s Surface; Springer Science Business Media: Berlin/Heidelberg, Germany, 2004; Volume 6. [Google Scholar]
  24. Lambin, E.F.; Geist, H.J. (Eds.) Land-Use and Land-Cover Change: Local Processes and Global Impacts; Springer Science Business Media: Berlin/Heidelberg, Germany, 2008. [Google Scholar]
  25. Singh, R.B.; Fox, J.; Himiyama, Y. (Eds.) Land Use and Cover Change; Science Publishers: Enfield, NH, USA, 2001. [Google Scholar]
  26. Liu, X.; Liang, X.; Li, X.; Xu, X.; Ou, J.; Chen, Y.; Li, S.; Wang, S.; Pei, F. A future land use simulation model (FLUS) for simulating multiple land use scenarios by coupling human and natural effects. Landsc. Urban Plan. 2017, 168, 94–116. [Google Scholar] [CrossRef]
  27. Li, S.Y.; Liu, X.P.; Li, X.; Chen, Y.M. Simulation model of land use dynamics and application: Progress and prospects. J. Remote Sens. 2017, 21, 329–340. [Google Scholar]
  28. Liang, X.; Guan, Q.; Clarke, K.C.; Liu, S.; Wang, B.; Yao, Y. Understanding the drivers of sustainable land expansion using a patch-generating land use simulation (PLUS) model: A case study in Wuhan, China. Comput. Environ. Urban Syst. 2021, 85, 101569. [Google Scholar] [CrossRef]
  29. Li, C.; Wu, Y.; Gao, B.; Zheng, K.; Wu, Y.; Li, C. Multi-scenario simulation of ecosystem service value for optimization of land use in the Sichuan-Yunnan ecological barrier, China. Ecol. Indic. 2021, 132, 108328. [Google Scholar] [CrossRef]
  30. Xie, G.D.; Zhang, C.X.; Zhang, C.S.; Xiao, Y.; Lu, C.X. The value of ecosystem services in China. Resour. Sci. 2015, 37, 1740–1746. [Google Scholar]
  31. Tibet Autonomous Region Bureau of Statistics. Xizang Statistical Yearbook; China Statistics Press: Beijing, China, 2000–2018.
  32. Rural Social and Economic Survey Division, National Bureau of Statistics. China County Statistical Yearbook; China Statistics Press: Beijing, China, 2000–2018.
  33. Heping, T.; Pan, G.; Xianghao, Z. A Study of Regional Eco-Environment Vulnerability—A Case of “One-River-Two-Tributaries”, Tibet. J. Mt. Sci. 2006, 24, 761–768. [Google Scholar]
  34. Zhao, T.; Song, B.; Chen, Y.; Yan, H.; Xu, Z. Analysis of population distribution and its spatial relationship with terrain elements in the Yarlung Zangbo River, Nyangqu River and Lhasa River Region, Tibet. J. Geo-Inf. Sci 2017, 19, 225–237. [Google Scholar]
  35. Duo, B.; Jun, D. Climate variation feature and its effect on environment change in central Tibet from 1961 to 2000. J. Appl. Meteorol. Sci. 2006, 17, 169–175. [Google Scholar]
  36. Thondup, T.; Du, J.; Tsewang, P.S. Spatial-temporal Change of Negative Accumulated Temperature in the Main Agricultural Regions of the Yarlung Zangbo River and Its Two Tributaries of Tibet During 1981–2020. Chin. Agric. Sci. Bull. 2022, 38, 99–105. [Google Scholar]
  37. Wang, X.; Ma, B.W.; Li, D.; Chen, K.; Yao, H.S. Multi-scenario simulation and prediction of ecological space in Hubei province based on FLUS model. J. Nat. Resour. 2020, 35, 230–242. [Google Scholar]
  38. Li, M.; Liu, S.; Wang, F.; Liu, H.; Liu, Y.; Wang, Q. Cost-benefit analysis of ecological restoration based on land use scenario simulation and ecosystem service on the Qinghai-Tibet Plateau. Glob. Ecol. Conserv. 2022, 34, e02006. [Google Scholar] [CrossRef]
  39. Yang, J.; Xie, B.P.; Zhang, D.G. Spatio-temporal evolution of carbon stocks in the Yellow River Basin based on InVEST and CA-Markov models. Chin. J. Eco-Agric. 2021, 29, 1018–1029. [Google Scholar]
  40. Mingjie, S.H.I.; Hongqi, W.U.; Hongtao, J.I.A.; Lei, Z.H.U.; Tong, D.O.N.G.; Panxing, H.E.; Qiangjun, Y.A.N.G. Temporal and spatial evolution and prediction of carbon stocks in Yili Valley based on MCE-CA-Markov and InVEST models. J. Agric. Resour. Environ. 2021, 38, 1010–1019. [Google Scholar]
  41. Gao, L.; Tao, F.; Liu, R.; Wang, Z.; Leng, H.; Zhou, T. Multi-scenario simulation and ecological risk analysis of land use based on the PLUS model: A case study of Nanjing. Sustain. Cities Soc. 2022, 85, 104055. [Google Scholar] [CrossRef]
  42. Zhang, H.Q.; Ren, T. Study on spatial pattern evolution characteristics and driving forces based on PLUS model: Taking Beizhen City in Liaoning Province as an example. J. Shenyang Jianzhu Univ. Soc. Sci. 2022, 24, 230–238. [Google Scholar]
  43. Wang, J.N.; Zhang, Z. Land use change and simulation analysis in the northern margin of the Qaidam Basin based on Markov-PLUS model. J. Northwest For. Univ. 2022, 37, 139–148, 179. [Google Scholar]
  44. Liang, X.; Liu, X.; Li, D.; Zhao, H.; Chen, G. Urban growth simulation by incorporating planning policies into a CA-based future land-use simulation model. Int. J. Geogr. Inf. Sci. 2018, 32, 2294–2316. [Google Scholar] [CrossRef]
  45. Bao, S.; Yang, F. Spatio-Temporal Dynamic of the Land Use/Cover Change and Scenario Simulation in the Southeast Coastal Shelterbelt System Construction Project Region of China. Sustainability 2022, 14, 8952. [Google Scholar] [CrossRef]
  46. Luo, S.Q.; Hu, X.M.; Sun, Y.; Yan, C.; Zhang, X. Multi-scenario land use change and its impact on carbon storage based on coupled Plus-Invest model. Chin. J. Eco-Agric. 2022, 30, 1–15. [Google Scholar] [CrossRef]
  47. Jiang, X.F.; Duan, H.C.; Liao, J.; Song, X.; Xue, X. Land use in the Gan-Lin-Gao Region of middle reaches of Heihe River Basin based on a PLUS-SD coupling model. Arid Zone Res. 2022, 39, 1246–1258. [Google Scholar]
  48. Ma, R.; Fan, Y.M.; Wu, H.Q.; Zhu, L.; Ma, X.; Fan, X.; Zhang, H.Y. Simulation of land-use patterns in arid areas coupled with GMOP and PLUS models. J. Agric. Resour. Environ 2021, 2, 53–55. [Google Scholar] [CrossRef]
  49. Lin, T.; Yang, M.Z.; Wu, D.F.; Liu, F.; Yang, J.H.; Wang, Y.J. Spatial correlation and prediction of land use carbon storage in Guangdong Province based on InVEST-PLUS model. China Environ. Sci. 2022, 42, 4827–4839. [Google Scholar]
  50. Liu, Q.; Yang, D.; Cao, L.; Anderson, B. Assessment and Prediction of Carbon Storage Based on Land Use/Land Cover Dynamics in the Tropics: A Case Study of Hainan Island, China. Land 2022, 11, 244. [Google Scholar] [CrossRef]
  51. Adiguzel, F.; Cetin, M.; Kaya, E.; Simsek, M.; Gungor, S.; Bozdogan Sert, E. Defining suitable areas for bioclimatic comfort for landscape planning and landscape management in Hatay, Turkey. Theor. Appl. Climatol. 2020, 139, 1493–1503. [Google Scholar] [CrossRef]
  52. Tariq, A.; Riaz, I.; Ahmad, Z.; Yang, B.; Amin, M.; Kausar, R.; Andleeb, S.; Farooqi, M.A.; Rafiq, M. Land surface temperature relation with normalized satellite indices for the estimation of spatio-temporal trends in temperature among various land use land cover classes of an arid Potohar region using Landsat data. Environ. Earth Sci. 2020, 79, 1–15. [Google Scholar] [CrossRef]
  53. Kilbane, S.; Weller, R.; Hobbs, R. Beyond ecological modelling: Ground-truthing connectivity conservation networks through a design charrette in Western Australia. Landsc. Urban Plan. 2019, 191, 103122. [Google Scholar] [CrossRef]
  54. Oudes, D.; Stremke, S. Spatial transition analysis: Spatially explicit and evidence-based targets for sustainable energy transition at the local and regional scale. Landsc. Urban Plan. 2018, 169, 1–11. [Google Scholar] [CrossRef]
  55. Zhou, Y.; Liu, T.; Duan, L.; Wang, Y.; Li, X.; Li, M. Driving force analysis and landscape pattern evolution in the upstream valley of Xilin River Basin. Arid Zone Res. 2020, 37, 580–590. [Google Scholar]
  56. Sterling, S.M.; Ducharne, A.; Polcher, J. The impact of global land-cover change on the terrestrial water cycle. Nat. Clim. Chang. 2013, 3, 385–390. [Google Scholar] [CrossRef]
  57. Zhang, B.; Liu, W.B.; Zhang, J.H. Landscape ecological risk of the Sanjiang Plain based on land use change. Territ. Nat. Resour. Study 2021, 2, 53–55. [Google Scholar] [CrossRef]
  58. O’neill, R.V.; Riitters, K.H.; Wickham, J.D.; Jones, K.B. Landscape pattern metrics and regional assessment. Ecosyst. Health 1999, 5, 225–233. [Google Scholar] [CrossRef]
  59. Liang, J.L.; Chen, W.X.; Li, J.F.; Dong, M.J.; Zhou, T.; Pan, S.P. Spatiotemporal pattern of landscape fragmentation and causes in the Yellow River Basin. J. Ecol. 2022, 42, 1993–2009. [Google Scholar]
  60. Wan, J.; Li, Z.C.; Lei, K. Dynamic analysis of the landscape spatial pattern in the coastal zone of the Bohai Bay,1954-2000. Res. Environ. Sci. 2009, 22, 77–82. [Google Scholar]
  61. Munsi, M.; Areendran, G.; Ghosh, A.; Joshi, P.K. Landscape characterization of the forests of Himalayan foothills. J. Indian Soc. Remote Sens. 2010, 38, 441–452. [Google Scholar] [CrossRef]
  62. Sakieh, Y.; Amiri, B.J.; Danekar, A.; Feghhi, J.; Dezhkam, S. Scenario-based evaluation of urban development sustainability: An integrative modeling approach to compromise between urbanization suitability index and landscape pattern. Environ. Dev. Sustain. 2015, 17, 1343–1365. [Google Scholar] [CrossRef]
  63. Kirkbride, M.P. Ice-marginal geomorphology and Holocene expansion of debris-covered Tasman Glacier. N. Z. Iahsaish P 2000, 264, 211–217. [Google Scholar]
  64. Bosson, J.B.; Lambiel, C. Internal structure and current evolution of very small debris-covered glacier systems located in alpine permafrost environments. Front. Earth Sci. 2016, 4, 39. [Google Scholar] [CrossRef]
Figure 1. Map of the study area. Note: the base drawing is from the website of the Ministry of Natural Resources (http://www.mnr.gov.cn, accessed on 28 March 2022), the review drawing number is GS (2020) 4621, and the base drawing has not been modified.
Sustainability 15 01376 g001
Figure 2. Framework of land use dynamic analysis method based on PLUS model [28].
Sustainability 15 01376 g002
Figure 3. Changes in landscape indices of the Yarlung Zangbo River and its two tributaries of Tibet from 1990 to 2020. (a) Shannon diversity and evenness index. (b) Aggregation index. (c) Shape index. (d) Connectivity index. (e) Average patch area. (f) Patch density.
Sustainability 15 01376 g003aSustainability 15 01376 g003b
Figure 4. Contribution of land expansion factors in the Yarlung Zangbo River and its two tributaries of Tibet.
Sustainability 15 01376 g004aSustainability 15 01376 g004b
Figure 5. Map of the spatial distribution of land use simulations in each landscape, and factor contribution degree of the Yarlung Zangbo River and its two tributaries of Tibet in 2038. (a) Periodic land use change landscape; (b) Agricultural land conservation landscape; (c) Ecological conservation landscape.
Sustainability 15 01376 g005aSustainability 15 01376 g005b
Figure 6. Landscape index of multi-landscape land use in the Yarlung Zangbo River and its two tributaries of Tibet in 2038. (a) Shannon diversity and evenness indexes. (b) Aggregation index. (c) Shape index. (d) Connectivity index. (e) Average patch area. (f) Patch density.
Sustainability 15 01376 g006aSustainability 15 01376 g006b
Table 1. Data sources and technical information.
DataSourcesTechnical Information
Land use and land cover
(1990 to 2020)
Resource and Environment Science and Data Center of China (https://www.resdc.cn/, accessed on 28 March 2022).Raster, 30 m × 30 m
Digital elevation model (DEM)Geospatial Data Cloud (China)
(https://www.giscloud.cn/, accessed on 28 March 2022).
Raster, 30 m × 30 m
Night-time lightsNational Tibetan Plateau Data Center of China (https://www.tpdc.ac.cn, accessed on 28 March 2022)Raster, 1 km ×1 km
Aridity, precipitation, temperatureTibet Meteorological Bureau (http://xz.cma.gov.cn/, accessed on 28 March 2022)Vector
Gross domestic product (GDP)Resource and Environment Science and Data Center of China (https://www.resdc.cn/, accessed on 28 March 2022).Raster, 1 km ×1 km
Population densityWorld Pop Country Datasets
(https://www.worldpop.org/, accessed on 28 March 2022).
Raster, 1 km ×1 km
LivestockWorld Food and Agriculture Organization (FAO) (https://data.apps.fao.org/, accessed on 28 March 2022)Raster, 1 km ×1 km
Soil denudationNational Tibetan Plateau Data Center of China (https://www.tpdc.ac.cn, accessed on 28 March 2022)Raster, 1 km ×1 km
Main roads, town, and waterOpen Street Map (http://www.openstreetmap.org/, accessed on 28 March 2022)Vector
Ecological function areaTibet natural resources bureauVector
Table 2. The neighborhood factor parameters.
Type of Land UseWoodlandGrasslandAgricultural LandWatersResidential AreaUnused Land
Neighborhood factor parameters0.010.30.20.410.5
Table 3. Cost transfer matrix of each landscape.
Landscape SettingsPeriodic Land Use Change Landscape
WoodlandGrasslandAgricultural LandWatersResidential AreaUnused Land
Woodland111111
Grassland111111
Agricultural land111111
Waters111111
Residential area000010
Unused land111111
Landscape SettingsAgricultural Land Conservation Landscape
WoodlandGrasslandAgricultural LandWatersResidential AreaUnused Land
Woodland111011
Grassland111111
Agricultural land001000
Waters011111
Residential area000010
Unused land111111
Landscape SettingsEcological Conservation Landscape
WoodlandGrasslandAgricultural LandWatersResidential AreaUnused Land
Woodland100000
Grassland110100
Agricultural land111111
Waters000100
Residential area000010
Unused land111111
Table 4. Comparison between simulated and actual land use grids of the Yarlung Zangbo River and its two tributaries of Tibet in 2018.
Type of Land UseActual in 2018Forecast in 2018Accuracy Rating
Agricultural land2,478,8822,459,65299.224%
Woodland11,458,72411,414,95999.618%
Grassland35,106,46435,830,17397.980%
Waters1,939,3572,241,71186.512%
Residential area192,692195,78198.422%
Unused land14,743,64613,777,48993.447%
Table 5. Comparison of multi-landscape simulation of land use type change in 2038 and status in 2015.
Landscape SettingsWoodlandGrasslandAgricultural LandWatersResidential AreaUnused Land
Status area in 2018/hm21,031,285.163,159,581.76223,099.38174,542.1317,342.281,326,928.14
Periodic land use change landscape for 2038/hm2725,488.203,222,781.92223,391.88169,398.9022,967.911,568,699.28
Agricultural land conservation landscape for 2038/hm2749,944.983,216,079.62230,049.81162,986.4922,470.391,551,198.69
Ecological conservation landscape for 2038/hm21,076,375.163,232,238.67197,585.10190,270.5321,880.531,214,428.05
Rate of change in Periodic land use change landscape in 2038 (compared to 2018/%)−0.29650.02000.0013−0.02950.32440.1822
Rate of change in agricultural land conservation landscape in 2038 (compared to 2018/%)−0.27280.01790.0312−0.06620.29570.1690
Rate of change in ecological conservation landscape in 2038 (compared to 2018/%)0.04370.0230−0.11440.09010.2617−0.0848
Disclaimer/Publisher’s Note: The statements, opinions and data contained in all publications are solely those of the individual author(s) and contributor(s) and not of MDPI and/or the editor(s). MDPI and/or the editor(s) disclaim responsibility for any injury to people or property resulting from any ideas, methods, instructions or products referred to in the content.

