
An Assessment of the Social Costs of Road Traffic Crashes in Cameroon


 ,
,
Abstract
1. Introduction
2. Literature Review
3. Methodology
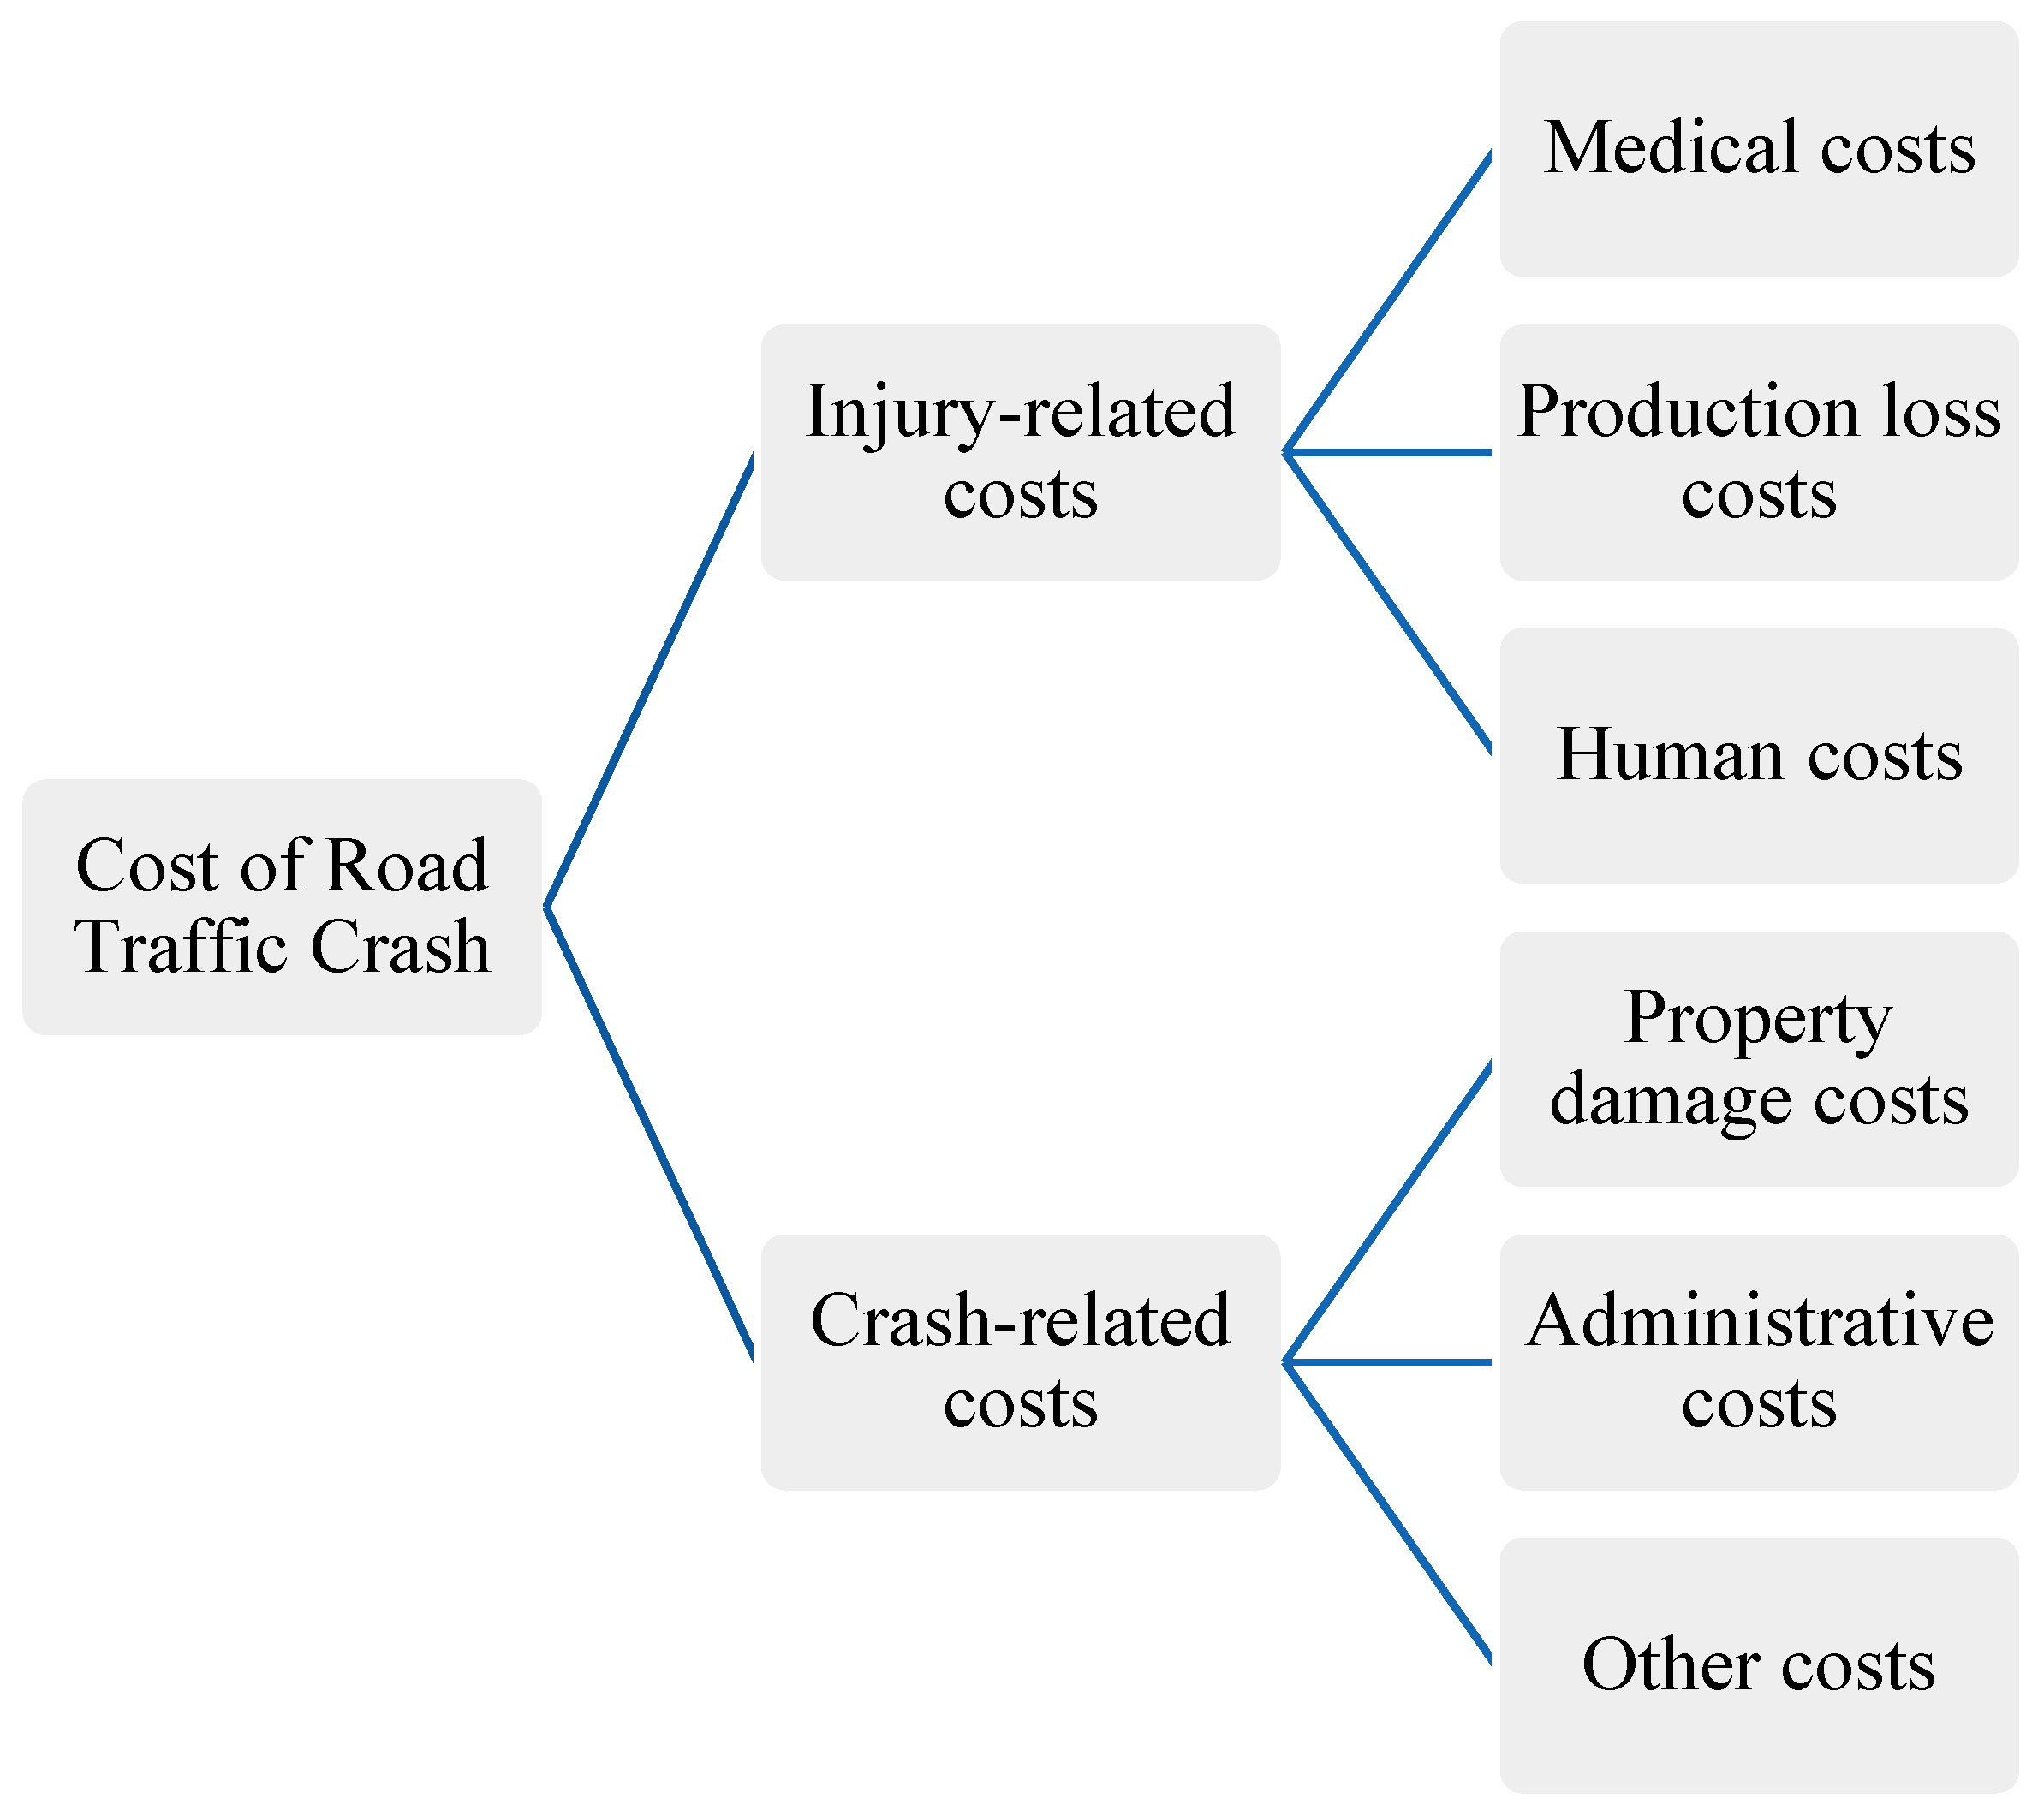
3.1. Cost Elements
3.2. Cost Element and Estimation Method Used
- Medical costs: these are ambulance ride costs; in-patient treatment and hospital stay costs, and out-patient medical costs. The formulas used in the model for estimating each of these sub costs are shown in Equations (2)–(4), and are used in calculating the total medical cost in Equation (1).
- 2.
- Production (gross) loss resulting from lost work hours due to death and injuries of victims, estimated according to Equation (5). This is assumed to incorporate a consumption loss, since the wages people are paid from working are applied for consumption purposes. It is common to adjust the production loss for costs due to pain, suffering, grieve and inconvenience, but due to data unavailability, these costs were not factored in the equation. This is likely to under-estimate the total costs.
- 3.
- Human Costs, which include the intangible costs of lost life years and reduced quality of life from pain and grief resulting from RTCs by victims or relatives, were estimated as a sum-total of the cost from fatalities, serious injuries and slight injuries (Equation (6)). To estimate the human cost of fatalities, a value transfer function for LMIC as presented by Milligan et al. [22], was used to estimate the value of a statistical life (VoSL) in Cameroon. Consumption loss resulting from fatalities is subtracted from the VoSL, since this component is included in the gross production loss function (see Equation (7)). Borrowing from Wijnen [28], human costs of slight and serious injuries were estimated as a percentage (13% and 1%) of VoSL, while assuming negligible (zero) consumption loss from injuries (see Equations (9) and (10))
- 4.
- Property damage cost: the damage to motor vehicles is estimating using Equation (11). The cost of other property and road damages is not included due to limited data.
- 5.
- Administrative costs: The costs comprise of police (Equation (12)), fire service (Equation (13)), insurance (Equation (14) and legal/judicial costs (see Equation (15). These costs add up to give the total administrative costs.
4. Data
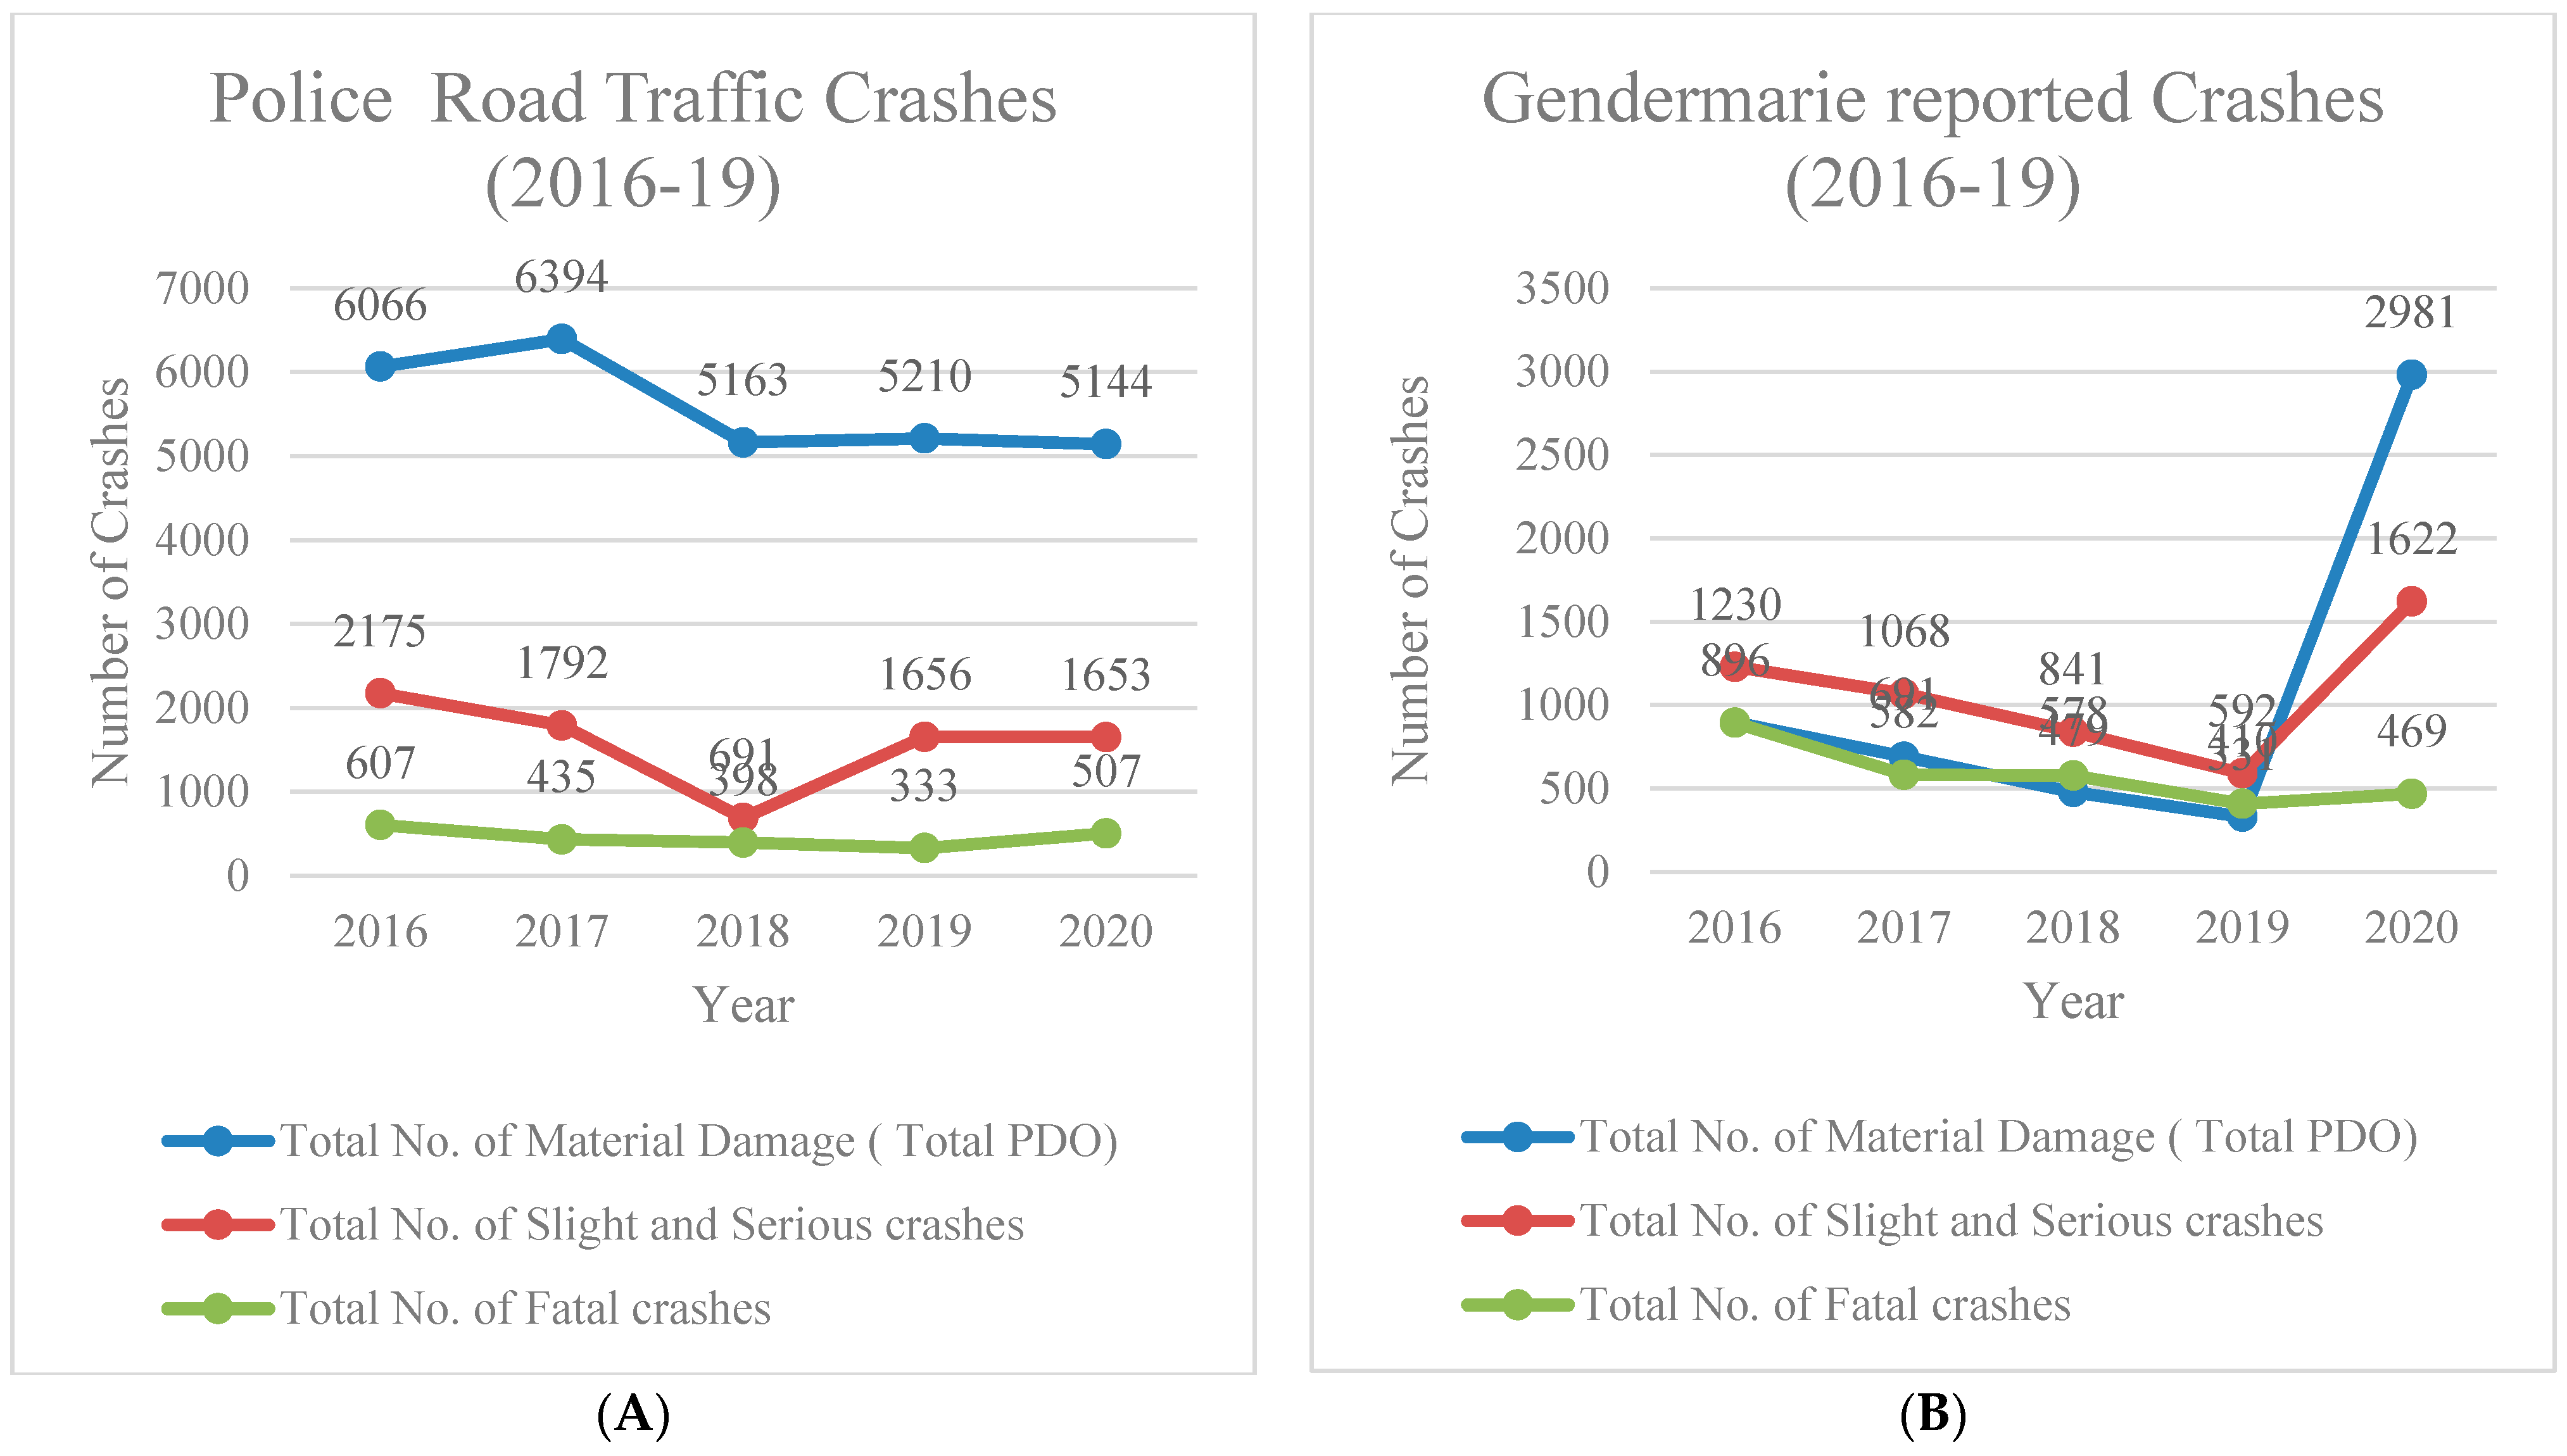
4.1. Road Crash Causalities Data
4.2. Adjusting RTCs Hospital Data for Under-Reporting

| Level of Severity | Number of Victims | Under-Reporting Rate | Estimated Number of Victims (Adjusted for Under-Reporting) |
|---|---|---|---|
| Fatalities | 1365 | 73.5% | 5151 |
| Serious injuries—Non-permanent injury | 28,135 | 47% | 53,085 |
| Serious injuries—permanently injury | 5968 | 47% | 11,260 |
| Slight Injuries | 92,203 | 47% | 173,968 |
4.3. Number of Crashes
4.4. Medical Costs
4.5. Production Loss
4.6. Human and Consumption Costs
4.7. Vehicle Damage Costs
4.8. Administrative (Police, Emergency Service, Legal and Insurance Costs)
5. Results and Discussion
5.1. RTCs Injury-Related Costs
5.1.1. Human Costs
5.1.2. Total Production Loss
5.1.3. Medical Costs
5.2. Crash-Related Costs
5.2.1. Vehicle Damage Costs
5.2.2. Administrative Costs (Insurance, Police, Fire Service and Judicial)
5.3. Overall Distribution of RTC Costs by Injury Severity, and Sub-Category of Cost Components
5.4. Cost Per Casualty
5.5. Discussion
6. Conclusions and Recommendations
- Adoption of systematic methods in estimation of RTCs for purposes of road safety policy, as this will generate a better perspective of the consequences of RTCs.
- Maintaining accurate data by instituting changes in handling of RTCs administrative data: priority should be given to operationalizing the recently established centralized RTCs database and outsourcing RTCs data processing in the police and Gendarmerie to hasten data processing. Accurate data is essential for proper assessment of socio-economic costs as well as tracking progress in Road Safety commitments such as that of SDG target 3.5.
- Primary surveys are recommended in repeat studies to overcome the lack of data that was resolved by using transfer values in the current study.
- Similar studies within Sub-Saharan African context are recommended to provide data for purposes of analysis in continental road safety policies.
Author Contributions
Funding
Informed Consent Statement
Data Availability Statement
Conflicts of Interest
Appendix A

| Designation | Nature and Description of Severity | Data Source |
|---|---|---|
| Number of reported road casualties | Fatalities, by gender age categories of fatalities | Obtained from the National Health Observatory Previous hospital survey [29] provided information on gender and age structure of RTC Injuries |
| Serious injuries, by gender age categories of serious injuries | Obtained from the National Health Observatory Previous hospital survey [29] provided information on gender and age structure of RTC Injuries | |
| Permanently disabled | Obtained from the National Health Observatory Previous hospital survey [29] provided information on gender and age structure of RTC Injuries Applied ratios from Mofandal & Kaniptong (2016) on the injuries to obtain and estimate of permanently disabled. | |
| Slight injuries, by gender and age categories | Obtained from the Ministry of Public Health’s National Health Observatory in Cameroon Previous hospital survey [29] provided information on gender and age structure of RTC injuries | |
| Number of reported crashes | Fatal crashes | Gendarmerie National, Police Reports Used the ratios obtained for injuries to allocate injuries between the two |
| Serious injury crashes | ||
| Slight injury crashes | ||
| Property damage only crashes | ||
| Number of casualties per crash | Fatal crashes: number of fatalities, serious injuries and slight injuries per fatal crash | Calculated from Gendarmerie and police reports |
| Serious injury crashes: number of serious injuries and slight injuries per serious injury crash | ||
| Slight injury crashes: number of slight injuries per slight injury crash | ||
| Percentage of underreporting of the number of casualties/crashes | Fatalities Serious injuries Slight injuries Fatal crashes Serious injury crashes Slight injury crashes Property damage only crashes | WHO estimation of fatalities in Cameroon Injuries to crash ratios from police data Household survey information |
| Medical—Transportation | Number of ambulance trips for road casualties | Proportion obtained from hospital survey on casualties by Household survey, |
| Costs of an ambulance trip | Adapted from Contingent Valuation Study by Lee et al. [38] DRC, PPP conversions used | |
| Medical—Hospitalization | Average number of days of hospital treatment for hospitalized injuries | Adapted from Hospital Survey in Ethiopia [17] Household survey, Casualty survey |
| Average cost of emergency treatment per patient | Adapted from Mofadal&Kaniptong (2016), converted to current prices and XAF | |
| Average costs of in-patient hospital treatment (with overnight stay) per patient per day | Adapted from Mofadal & Kaniptong (2016), converted to current prices and XAF | |
| Medical—Out-patient treatment | Number of slight injuries that have been treated on the hospital emergency department (without overnight stay) | Proportion of slight injuries in derived from McGreevy et al. (2014) |
| Average costs of hospital emergency treatment (without overnight stay) | Derived from Mofadal & Kaniptong [13], converted to 2018 prices and PPP exchange rates | |
| Medical—Inability to work | Average number of days a seriously injured casualty is unable to work after the crash | Adapted from Murad et al. (2011) and complemented with Casualty survey |
| Number of days a slightly injured casualty is unable to work after the crash | Adapted from Murad et al. (2011) and complemented with Casualty survey | |
| Production and consumption loss | Population by gender age (preferably each age: number of 0, 1, 2, 3–99 years) education level | National Institute of Statistics |
| Life expectancy by gender and age | National Institute of Statistics | |
| Age of entering the labour market by gender and education level | National Institute of Statistics | |
| Average retirement age by gender | National Institute of Statistics | |
| Gross Domestic Product per capita | National Institute of Statistics | |
| Yearly number of working hours per labourer, by gender | National Institute of Statistics | |
| Official discount rate used in economic assessments of governments investments (for example used in cost-benefit analyses) | Ministry of Finance | |
| Human costs | GDP per capita | National Institute of Statistics |
| Private consumption per capita, | National Institute of Statistics | |
| VOSL ratios | Milligan et al. [22] | |
| Vehicle damage | Average damage per vehicle in fatal crash | Adapted from Ethiopia [17] for vehicles and Pakistan for motorcycles [35]. Data updated using relevant price indices and PPP exchange rates |
| Average damage per vehicle in serious injury crash | ||
| Average damage per vehicle in slight injury crash | ||
| Average damage per vehicle in PDO crash | ||
| Insurance administration costs | Administrative costs of insurance companies related to vehicle insurances (personnel costs, overhead) | Association of Insurance data &Sudan [13] |
| Police costs | Proportion of crashes (by severity) the police attends | Police interview, complemented by household surveys |
| Average number of policemen coming to the place of a road crash, by crash severity | Police interviews | |
| Average time a police officer spends per crash, by crash severity | Police interviews | |
| Average wage of a police officer | Police interviews | |
| Fire emergency services | Proportion of crashes attended by fire services department | Police interviews; fire service interviews |
| Average number of personnel coming to the place of a road crash, by crash severity | ||
| Average time spent per crash, by crash severity | ||
| Average wage of fire officers | ||
| Legal | Time spending police on prosecution of offenders who caused a crash | Police interviews |
| Number of trials concerning road users who have caused a crash | Interviews judicial organization (e.g., law courts) | |
| Average costs per trial | Interviews judicial organization (e.g., law courts) | |
| Number of road users that go to prison due to causing a road crash | Interviews judicial organization (e.g., law courts, prisons) | |
| Average number of days in prison | Interviews judicial organization (e.g., law courts, prisons) | |
| Prison costs per prisoner per day | Interviews judicial organization (e.g., law courts, prisons) |
| Cameroon | Sudan | Ethiopia | Guinea | Congo | |
|---|---|---|---|---|---|
| Road safety and motorization indicators | |||||
| age limit on imported vehicles in years | 7 1 | 5 | none | 8 | 7 |
| motorization/1000 | 3235 | 3165 | 692 | 2095 | 2483 |
| estimated fatalities by WHO/100,000 | 30.1 | 25.7 | 26.7 | 28.2 | 27.4 |
| health coverage index | 44 | 43 | 39 | 35 | 38 |
| expenditure on health% GDP | 5% | 6% | 4% | 5% | 5% |
| Social Economic Properties | |||||
| Class (WB) * | LM | LM | L | L | L |
| UN-HDR ** | L | L | L | L | L |
| UN-Statistics *** | D | D | D | D | D |
References
- WHO. Global Status Report on Road Safety; World Health Organization: Geneva, Switzerland, 2018. [Google Scholar]
- World Bank. Guide for Road Safety Opportunities and Challenges: Low and Middle Income Country Profiles; The World Bank Group: Washington, DC, USA, 2020. [Google Scholar]
- Usami, D.S.; González-Hernández, B.; Persia, L.; Kunsoan, N.B.; Meta, E.; Saporito, M.R.; Schermers, G.; Carnis, L.; Yerpez, J.; Bouhamed, N.; et al. Defining suitable Safe System projects: The experience of the SaferAfrica project in five African countries. IATSS Res. 2021, 45, 594–601. [Google Scholar] [CrossRef]
- Wijnen, W.; Stipdonk, H. Social costs of road crashes: An international analysis. Accid. Anal. Prev. 2016, 94, 97–106. [Google Scholar] [CrossRef] [PubMed]
- Prakash, I.; Neves, O.; Cumbe, E.; Hamadani, F.; Razek, T.; Fata, P.; Beckett, A.; Khwaja, K.; Grushka, J.; Wong, E.G.; et al. The Financial Burden of Road Traffic Injuries in Mozambique: A Hospital-Related Cost-of-Illness Study of Maputo Central Hospital. World J. Surg. 2019, 43, 2959–2966. [Google Scholar] [CrossRef] [PubMed]
- Bougna, T.; Hundal, G.; Taniform, P. Quantitative Analysis of the Social Costs of Road Traffic Crashes Literature. Accid. Anal. Prev. 2021, 165, 106282. [Google Scholar] [CrossRef] [PubMed]
- Samuel, J.; Sankhulani, E.; Qureshi, J.; Baloyl, P.; Thupi, C.; Lee, C.; Miller, W.; Cairns, B.; Charles, A. Under-reporting of Road traffic Mortality in developing countries: Application of Capture-Recapture Statistical Model to refine Mortality rates. PLoS ONE 2012, 7, e31091. [Google Scholar] [CrossRef]
- SafetyNet. Road Safety Management. 2009. Available online: https://road-safety.transport.ec.europa.eu/system/files/2021-07/road_safety_management.pdf (accessed on 31 January 2021).
- World Bank Group. Tackling the Road Safety Crisis in Africa. Available online: https://www.worldbank.org/en/news/feature/2014/06/06/tackling-the-road-safety-crisis-in-africa (accessed on 31 January 2021).
- Wijnen, W.; Weijermars, W.; Schoeters, A.; van den Berghe, W.; Bauer, R.; Carnis, L.; Elvik, R.; Martensen, H. An analysis of official road crash cost estimates in European countries. Saf. Sci. 2019, 113, 318–327. [Google Scholar] [CrossRef]
- Alfaro, J.; Chapuis, M.; Fabre, E. Coût Socio-Économique des Accidents de la Route; Rapport final de l’action COST 313; Commission des Communautés Européennes, Direction générale XIII: Bruxelles, Belgium; Luxembourg, 1994. [Google Scholar]
- Bahamonde-Birke, F.J.; Kunert, U.; Link, H. The Value of a Statistical Life in a Road Safety Context—A Review of the Current Literature. Transp. Rev. 2015, 35, 488–511. [Google Scholar] [CrossRef]
- Mofadal, A.I.A.; Kanitpong, K. Analysis of Road Traffic Accident Costs in Sudan Using the Human Capital Method. Open J. Civ. Eng. 2016, 6, 203–216. [Google Scholar] [CrossRef]
- Abdallah, N.M.; Hakim, A.S.E.; Wahdan, A.H.; Refaeye, M.A.E. Analysis of Accidents Cost in Egypt Using the Willingness-To-Pay Method. Int. J. Traffic Transp. Eng. 2016, 5, 10–18. [Google Scholar]
- Labuschagne, F.; DeBeer, E.; Roux, E.; Venter, K. The cost of crashes in South Africa 2016. In Proceedings of the Southern Africa Transport Conference, Pretoria, South Africa, 10–13 July 2017. [Google Scholar]
- Parkinson, F.; Kent, S.; Aldous, C.; Oosthuizen, G.; Clarke, D. The hospital cost of road traffic accidents at a South African regional trauma centre: A micro-costing study. Injury 2014, 45, 342–345. [Google Scholar] [CrossRef]
- Murad, M. Costing Road Traffic Accidents in Ethiopia; Addis Ababa Institute of Technology: Addis Ababa, Ethiopia, 2011; Available online: http://etd.aau.edu.et/handle/123456789/1979 (accessed on 31 January 2021).
- BRS; TRL. Guideline for Estimating the Cost of Road Crashes in Developing Countries; Department for International Development Project 7780: London, UK, 2003.
- Niditanchou, R.; Palamara, P.; Jansz, J. Population based estimate of road traffic injuries incidence in Yaounde, Cameroon using the capture-recapture methodology. Adv. Transp. Stud. 2018, 45, 141–148. [Google Scholar]
- Juillard, C.; Ngamby, M.; Monono, M.; Mballa, G.; Dicker, R.; Stevens, K.; Hyder, A. Exploring data sources for road Traffic injury in Cameroon: Collection and Completeness of police records, newspaper reports and hospital trauma registry. Surgery 2017, 162, S24–S31. [Google Scholar] [CrossRef] [PubMed]
- González-Hernández, B.; Meta, E.; Persia, L.; Usami, D.S.; Cardoso, J. Development of a methodology to transfer road safety good practices in African countries. Adv. Transp. Stud. 2021, 55, 121–136. [Google Scholar]
- Milligan, C.; Kopp, A.; Dahdah, S.; Montufar, J. Value of a statistical life in road safety: A benefit-transfer function with risk-analysis guidance based on developing country data. Accid. Anal. Prev. 2014, 71, 236–247. [Google Scholar] [CrossRef] [PubMed]
- World Bank. Valuation of Accident Reduction; Transport Note No. TRN-16; World Bank: Washington, DC, USA, 2005. [Google Scholar]
- Trawén, A.; Maraste, P.; Persson, U. International comparison of costs of a fatal casualty of road accidents in 1990 and 1999. Accid. Anal. Prev. 2002, 34, 323–332. [Google Scholar] [CrossRef]
- Wijnen, W.; Weijermars, W.; Vanden, S.R. Crash cost estimates for European countries. Deliverable 3.2 of the H2020 project SafetyCube. 2017. Available online: https://www.vias.be/en/research/notre-publications/crash-cost-estimates-for-european-countries/ (accessed on 31 January 2021).
- Kasnatscheew, A.; Felix, H.; Schoenebeck, S.; Markus, L.; Hosta, P. Review of European Accident Cost Calculation Methods: With Regard to Vulnerable Road Users. Deliverable 5.1 of the H2020 Project InDev (In-Depth Understanding of Accident Causation for Vulnerable Road Users). 2016. Available online: https://swov.nl/nl/publicatie/review-european-accident-cost-calculation-methods-regard-vulnerable-road-users (accessed on 31 January 2021).
- Wijnen, W. Costs of Road Crashes in Kazakhstan 2012. Methodology and Cost Calculations; Asian Development Bank, 2014; Unpublished. [Google Scholar]
- Wijnen, W. Socio-economic costs of road crashes in middle-income countries. IATSS Res. 2021, 45, 293–302. [Google Scholar] [CrossRef]
- McGreevy, J.; Stevens, K.; Manono, M.; Mballa, G.; Ngamby, M.; Hyder, A.; Julliard, C. Road Traffic Injuries in Yaounde, Cameroon: A hospital based Surveillance Study. Int. J. Care Inj. 2014, 45, 1687–1692. [Google Scholar] [CrossRef]
- Heydari, S.; Hickford, A.; McIlroy, R.; Turner, J.; Bachani, A.M. Road Safety in Low-Income Countries: State of Knowledge and Future Directions. Sustainability 2019, 11, 6249. [Google Scholar] [CrossRef]
- Ministry of Transport. Transport Statistics Year Book; Ministry of Transport: Yaoundè, Cameroon, 2019.
- Bhalla, K.; Harrison, J.; Shahraz, S.; Abraham, J.P.; Bartels, D.; Yeh, P.H.; Naghavi, M.; Lozano, R.; Vos, T.; Phillips, D.; et al. Burden of road injuries in sub-Saharan Africa. In Data Sources, Methods, and Estimates of the National Incidence of Road Injuries; Department of Global Health and Population, Harvard School of Public Health: Boston, MA, USA, 2013. [Google Scholar]
- Kourouma, K.; Delamou, A.; Lamah, L.; Camara, B.; Kolie, D.; Sidibé, S.; Béavogui, A.H.; Owiti, P.; Manzi, M.; Ade, S.; et al. Frequency, characteristics and hospital outcomes of road traffic accidents and their victims in Guinea: A three-year retrospective study from 2015. BMC Public Health 2019, 19, 1022. [Google Scholar] [CrossRef]
- World Bank. World Development Indicators; The World Bank: Washington, DC, USA, 2020. [Google Scholar]
- Kazmi, J.; Zubair, S. Estimation of vehicle damage cost involved in road traffic accidents in Karachi, Pakistan: A geospatial perspective. Procedia Eng. 2014, 77, 70–78. [Google Scholar] [CrossRef]
- Fondzenyuy, S. Financial and Economic Impacts of Insurance Industry in the Prevention and Compensation of Road Casualties. Case Study Cameroon. Master’s Thesis, Ecole Nationale Supérieure des Travaux Publics of Yaoundè, Yaoundé, Cameroon, 2019. [Google Scholar]
- Association Des Societes D’assuarances du Cameroun. Rapport Sur Les Statistiques 2018 du Marche Camerounais; Association Des Societes D’assuarances du Cameroun: Yaoundé, Cameroon, 2018. [Google Scholar]
- Lee, T.; Han, J.; Sharma, A.; Choic, Y.; Kim, D.; Lee, S.A.M. A Sustainalbe Ambulance Operation Model in a low resource country (the Democratic Republic of Congo). Emerg. Med. Int. 2018, 2018, 8701957. [Google Scholar] [CrossRef] [PubMed]


| Police | Gendarmerie | Total | Ministry Health | |
|---|---|---|---|---|
| Fatalities | 583 | 782 | 1365 | 1286 |
| Injuries | 1759 | 2801 | 4560 | 126,306 |
| Number of Casualties | Number of Crashes | Ratio | |
|---|---|---|---|
| Fatal | 721 | 607 | 1.19 |
| Injury | 2886 | 2175 | 1.33 |
| Level of Crash Severity | Police | Gendarmerie | Total Crashes | Ratio of Casualties to Crashes | Adjusted Number of RTCs Casualties Used (See Table 2) | Number of Crashes (2018) after Adjusting for Underreporting |
|---|---|---|---|---|---|---|
| Fatal Crash | 607 | 896 | 1503 | 1.19 | 5151 | 4337 |
| Injury Crash (serious and slight) | 2175 | 1230 | 3405 | 1.33 | 238,313 | 179,602 |
| Property Damage Only (PDO) crashes | 6066 | 896 | 6962 | 2.1 * | 238,313 | 500,904 |
| Study | Country | Ratio of Number of Casualties/Number of Crashes | ||
|---|---|---|---|---|
| Fatal | Serious Injury | Slight Injury | ||
| Labuschagne et al., 2017 | South-Africa | 1.29–1.33 | 1.37–1.43 | 1.23–1.38 |
| Modafal & Kanitpong, 2016 | Sudan | 1.18 | 1.84 | 1.94 |
| Murad, 2011 [17] | Ethiopia | 1.26 | 1.38 | 1.38 |
| Our study | Cameroon | 1.19 | 1.33 | 1.33 |
| Medical Costs | Production Loss | Human Cost | Total Injury-Related Costs | |
|---|---|---|---|---|
| Fatality | 182 (1) | 32,095 (143) | 45,040(200) | - |
| Serious Injury | 100,391 (446) | 70,241 (312) | 73,142 (325) | |
| Slight Injury | 7414 (33) | 2811 (12) | 15,212 (68) | |
| Total | 107,987 (479) | 105,147 (467) | 133,394 (592) | 346,528 (1539) |
| Proportion | 31% | 30% | 38% | 100% |
| Sub-Category | Fatalities | Serious Injuries | Slight Injuries | Total Medical Costs | Proportion by Cost Component |
|---|---|---|---|---|---|
| Ambulance | 48 (0.21) | 604 (2.68) | - | 653 (3) | 1% |
| Emergency services | 20 (0.09) | 254 (1.13) | 688 (3.1) | 963 (4.3) | 1% |
| In-patient treatment | 113 (0.5) | 93,313 (414) | - | 93,426 (415) | 87% |
| Outpatient | - | 6220 (28) | 6726 (30) | 12,946 (57) | 12% |
| Total Medical Costs | 182 (0.81) | 100,391 (446) | 7414 (33) | 107,988 (480) | |
| Proportion by injury level | 0.15% | 93% | 6.8% |
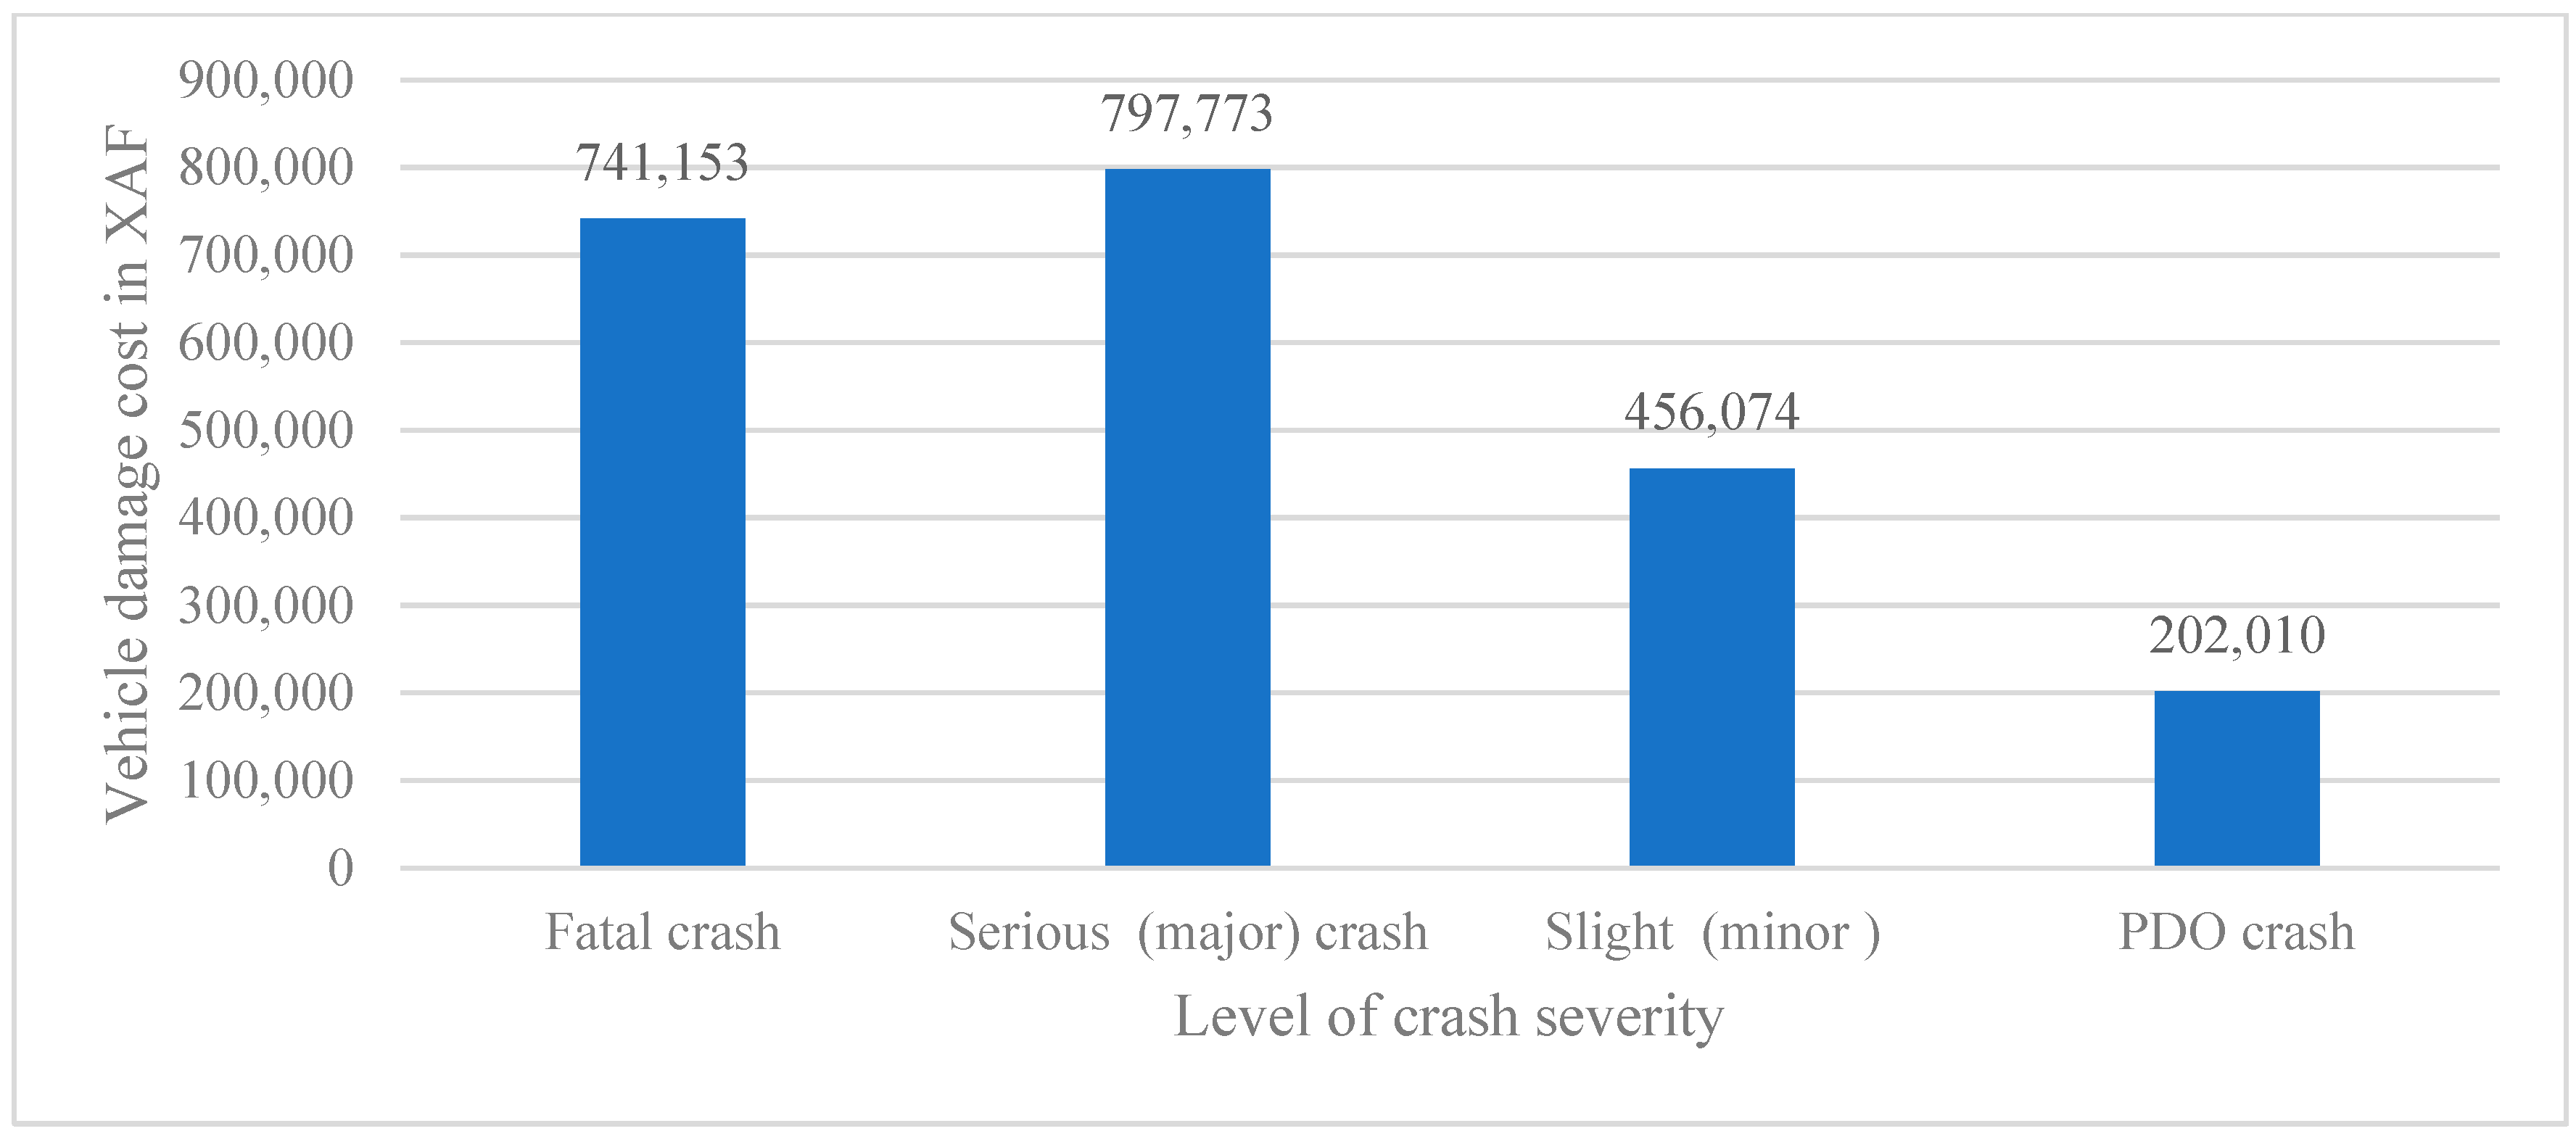
| Level of Crash Severity | Vehicle Damage Costs in Millions of XAF (USD Millions) | % |
|---|---|---|
| Fatal crash | 6428 (28) | 2% |
| Serious (major) crash) | 77,373 (344) | 19% |
| Slight | 119,591 (531) | 29% |
| PDO crash | 202,375 (899) | 50% |
| 405,767 (1802) | 100% |
| Fatal | Serious Injury | Slight Injury | PDO | |
|---|---|---|---|---|
| Traffic Policemen | ||||
| Number at site | 4 | 3 | 2 | 2 |
| Time spent at site (hours) | 0.3 | 0.3 | 0.25 | 0.25 |
| % of crashes attended | 100% | 75% | 10% | 1% |
| Firemen | ||||
| Number at site | 3 | 3 | 3 | 3 |
| Time spent at site | 0.3 | 0.3 | 0.25 | 0.25 |
| % of crashes attended | 50% | 38% | 1% | 0% |
| Level of Crash Severity/Sub-Category | Administrative Costs in Millions of XAF (USD Millions) | Total |
|---|---|---|
| Total Administrative Costs by Crash Severity | ||
| Fatal crash (1%) | 677 (3) | |
| Serious (major) crash (7%) | 4008 (18) | |
| Slight (8%) | 10,764 (48) | |
| PDO crash (73%) | 41,108 (183) | |
| 56,555 | ||
| Total Administrative Costs by Sub-Category | ||
| Police (1%) | 346 (1.5) | |
| Fire service (0%) | 9 (0.04) | |
| Insurance (97%) | 54,957 (244) | |
| Judicial (2%) | 1243 (5.5) | |
| 56,555 | ||
| Cost Category | Total Costs in Millions of XAF (USD Millions) | Proportion of Total Cost (Percentage) |
|---|---|---|
| Total Costs Social Cost of RTCs Classified by Sub-Categories | ||
| Medical costs | 107,987 (480) | 13% |
| Production loss costs | 105,147 (467) | 13% |
| Human costs | 133,394 (592) | 16% |
| Property Damage costs | 405,767 (1802) | 50% |
| Administrative costs | 56,556 (251) | 7% |
| Total costs | 808,851 (3600) | 100% |
| Total costs classified by injury severity | ||
| Fatalities | 84,422 (375) | 10% |
| Serious Injuries | 325,155 (1444) | 40% |
| Slight Injuries | 155,791 (692) | 19% |
| PDO | 243,483 (1081) | 30% |
| Total | 808,851 (3600) | 100% |
| (a) Category of Costs/Level of Injury | Fatality Crash Costs in XAF (%) | Serious Injury Crash Costs in XAF (%) | Slight Injury Crash Costs in XAF (%) |
|---|---|---|---|
| Medical costs | 35,319 (0%) | 1,560,191 (31%) | 42,618 (5%) |
| Production loss costs | 6,230,875 (38%) | 1,091,628 (22%) | 16,156 (2%) |
| Human costs | 8,743,983 (53%) | 2,088,726 (22%) | 160,671 (10%) |
| Property damage Costs | 1,247,933 (8%) | 1,202,465 (24%) | 687,430 (77%) |
| Administrative costs | 131,510 (1%) | 62,286 (1%) | 61,870 (7%) |
| Total cost per casualty | 16,389,620 | 5,053,288 | 895,515 |
| (b) Category of costs/level of Injury | Fatality crash costs in USD | Serious Injury crash costs in USD | Slight Injury crash costs in USD |
| Medical costs | 157 | 6928 | 189 |
| Production loss costs | 27,688 | 4847 | 72 |
| Human costs | 38,828 | 9275 | 713 |
| Property damage Costs | 5541 | 5340 | 3053 |
| Administrative costs | 584 | 277 | 275 |
| Total cost per casualty | 72,778 | 22,349 | 3977 |
Disclaimer/Publisher’s Note: The statements, opinions and data contained in all publications are solely those of the individual author(s) and contributor(s) and not of MDPI and/or the editor(s). MDPI and/or the editor(s) disclaim responsibility for any injury to people or property resulting from any ideas, methods, instructions or products referred to in the content. |
© 2023 by the authors. Licensee MDPI, Basel, Switzerland. This article is an open access article distributed under the terms and conditions of the Creative Commons Attribution (CC BY) license (https://creativecommons.org/licenses/by/4.0/).
Share and Cite
Taniform, P.; Persia, L.; Usami, D.S.; Kunsoan, N.B.; Karumba, M.M.; Wijnen, W. An Assessment of the Social Costs of Road Traffic Crashes in Cameroon. Sustainability 2023, 15, 1316. https://doi.org/10.3390/su15021316
Taniform P, Persia L, Usami DS, Kunsoan NB, Karumba MM, Wijnen W. An Assessment of the Social Costs of Road Traffic Crashes in Cameroon. Sustainability. 2023; 15(2):1316. https://doi.org/10.3390/su15021316
Chicago/Turabian StyleTaniform, Peter, Luca Persia, Davide Shingo Usami, Noella Bajia Kunsoan, Mary M. Karumba, and Wim Wijnen. 2023. "An Assessment of the Social Costs of Road Traffic Crashes in Cameroon" Sustainability 15, no. 2: 1316. https://doi.org/10.3390/su15021316
APA StyleTaniform, P., Persia, L., Usami, D. S., Kunsoan, N. B., Karumba, M. M., & Wijnen, W. (2023). An Assessment of the Social Costs of Road Traffic Crashes in Cameroon. Sustainability, 15(2), 1316. https://doi.org/10.3390/su15021316