Abstract
A large number of heavy metals are usually contained in mine-derived liquids, which could cause contamination of surrounding water sources. Due to the detrimental effects on the environment and health, conventional treatments have been employed to capture heavy metals in mining-polluted streams. This study shows the results of the operation of a built prototype for the retention of arsenic contained in waters contaminated by mining activities using Technosols (mixtures of local soil with nanoparticles). Our team previously run laboratory tests using fixed-bed columns to find out the best dose of the Technosol (97% soil + 3% nanoparticles). Based on these results, the sizing and building of a scale model were conducted, which in turn was used to evaluate the performance of the treatment in a concrete channel packed with reactive barriers. Variations in water volume, barrier separation and gate opening were tested to analyze the behavior of the proposed system and to obtain the most optimal hydraulic retention time that allowed the prototype to reach an arsenic retention level of a minimum of 70%. Moreover, to analyze the procedure under conditions of high arsenic contamination, samples of mine tailings were enriched with the toxic metalloid. It was found that the content of Fe in the local soil allowed adsorption of the contaminant, which was subsequently compared with the increase in the uptake of As due to the Fe/FeS multicomponent nanoparticles (NPs), dosed in the Technosol in a proportion of 97% soil + 3% NPs. The best treatment achieved 70.5% of As removal in ten cycles with a volume of 44 L. Tests were run at a maximum input flow rate of 43.8 L·min−1, an output flow rate of 13.2 L·min−1, a speed of 6.0 m·min−1 and a hydraulic retention time of 3.4 min per cycle. Results of arsenic retention using this prototype suggest that this simple and inexpensive technological setup could be scaled up to a functional field application to effectively capture the toxic metalloid.
1. Introduction
A worldwide problem is the contamination of the environment due to mining processes, and even more so when such activities are developed in sensitive areas and without any legal control [,,]. In this respect, a rise in artisanal and illegal mining has led to an increase in heavy metal pollution in the province of El Oro, Ecuador [,,] (Figure 1). These mining activities have caused serious damage in areas near rivers or effluents [,]. In response to the encountered mining pollution problems, this current study proposes the use of Technosol combined with nanoparticles in order to recover polluted soil and water [,,]. In previous studies, the uptake of heavy metals by Technosols prepared in Ecuador has been evaluated mainly at the laboratory level [,,,]. Moreover, iron-based nanoparticles prepared by green or conventional synthesis have been used to remove toxic metals from polluted water and soils under laboratory experimental conditions, such as the multicomponent nanoparticles biosynthesized with orange peel (Citrus sinensis) extract []. These tiny particles contain Fe0 in the core and are surrounded by a cover of FeS precipitates. This chemical composition gives the nanoparticles enhanced sorption properties to selectively capture heavy metals. Particularly, the active groups of the zero-valent iron and ferrous sulfide chemically retain arsenic through the formation of Fe-oxide-As3+ complexes, complexation with iron hydroxides, reduction to As0 or As3+ in the presence of Fe0 [] and surface complexation by FeS [] The capability of nanoparticles to immobilize heavy metals dissolved in water was over 80%, reaching even 99% for arsenic, allowing the design and elaboration of Technosol mixed with nanoparticles [,]. A silty clay extracted from a mining area was used as Technosol. A fast removal of metals was observed within 5 min with the best dose of 99.75% soil + 0.25% nanoparticles, and an immobilization higher than 90% was achieved. On the other hand, it was analyzed the retention of arsenic with the use of Technosol prepared with ferric soil and nanoparticles []. Using Vensim software, a model was developed capable of scaling and predicting the behavior of the adsorbent. These results allowed the understanding of the process of adsorption and saturation of the system, an aspect of great importance for a precise application in the field (Figure 1). Finally, it was possible to evaluate the heavy metal retention process in a laboratory-scale column prototype []. The best treatment was discovered to be a Technosol prepared with 3% nanoparticles + 97% soil, reaching a removal of 70% on average.
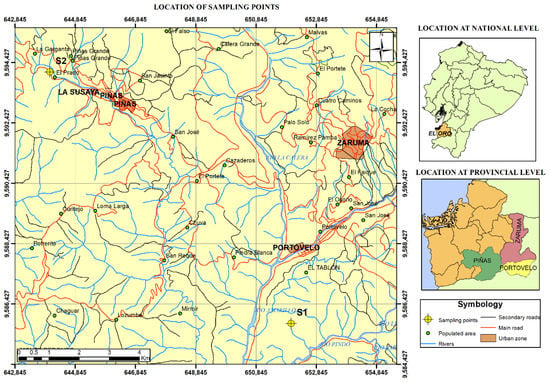
Figure 1.
Location of sampling points.
Therefore, the main objective of the current study has been to design, build and evaluate a prototype for arsenic removal from mining-polluted water using Technosol combined with multicomponent nanoparticles as sorbent material. The results are expected to provide the needed information to move from a small-scale prototype toward a functional field application.
2. Materials and Methods
2.1. Soil and Water Sampling
Sampling was performed within an area between towns of Zaruma, Portovelo and Piñas, El Oro province, Ecuador (Figure 1). Soil samples were taken from two locations (S1 and S2). Zip plastic bags were used to collect soil samples. Mine tailings were collected in sedimentation pools (A1) located in Santa Mónica Plant, Portovelo. Plastic bottles were used for the collection, stored in a freezer at 5 °C of temperature and transported to the laboratory for the corresponding chemical analysis.
2.2. Laboratory Tests
The selected soil samples were tested using the ASTM D2487-11 method (Unified Soil Classification System) in order to characterize the content of gravel, sand, silt or clay []. For the determination of the cation exchange capacity of soil, ammonium acetate, sodium chloride, formaldehyde, phenolphthalein and sodium hydroxide were used []. Exchangeable or macrometal cations were obtained with the ammonium acetate method []. While for carbonates, sulfuric acid, phenolphthalein and ethanol were used. Moisture was determined by method ASTM D-2216, granulometry by ASTM D422, liquid and plastic limits ASTM D-4318 [,,]. Electrical conductivity was measured using ISO 11265 Standard [] and [] protocols, the organic content and pH were measured by the AASHTO Standards [] and ISO 10390 Standard [], respectively. Concentrations of mg/L and µg/L were converted to mg/kg according to the following equation []:
Heavy metals dissolved in the mine tailings were chemically analyzed using a flame Perkin Elmer AA800 atomic absorption spectrometer coupled with FIAS 100. Standardized procedures were used for chemical analysis of metals and arsenic []. For As we added 1 mL of tailing, 1 mL of pure hydrochloric acid and 1 mL of the solution of 5% potassium iodide plus 5% ascorbic acid in each test tube, stirred and after 45 min, 7 mL of distilled water was added. Readings of As were performed in the AA-FIAS system. For equipment calibration, heavy metal AA standards of 1000 mg/L were utilized.
2.3. Synthesis of Multicomponent Nanoparticles (Fe/FeS)
With the need to produce nanomaterials on a larger scale while maintaining their nanometric size and chemical properties, two protocols were combined. Protocols developed by Stael & Cumbal and Yaacob & How were used [,]. The process is summarized in Figure 2.
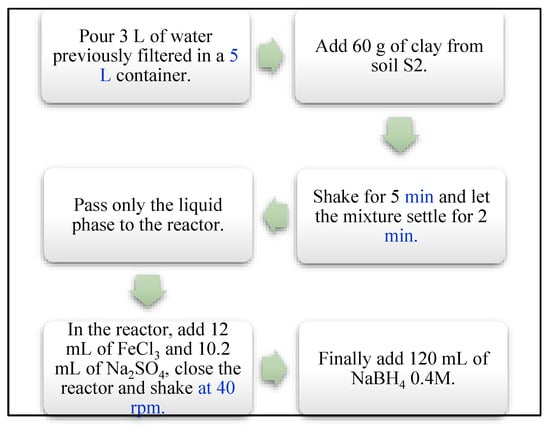
Figure 2.
Scheme of the nanoparticle synthesis of the current study.
2.4. Nanoparticle Characterization
Transmission electron microscope (TEM) images were digitally recorded for morphological studies (Tecnai G2 Spirit TWIN, FEI, Eindhoven, The Netherlands). The size and morphology of the nanostructures were characterized using a field emission gun scanning electron microscope (FEG-SEM, Mira3 Tescan). Samples were directly deposited on aluminum simple holders. The operation voltage ranged between 3 and 5 kV. In a classic procedure, low-magnification (Å~2000) micrographs were obtained to determine the size distribution. Analysis of the crystalline structure of the nanoparticles was performed by XRD diffractometer (PANalytical EMPYREAN) operating in a θ–2θ configuration in the Bragg-Brentano geometry and equipped with a copper X-ray tube (Kα radiation = 1.54056 Å) operating at 45 kV and 40 mA and energy dispersive spectroscopy (EDS) techniques as used to determine the chemical properties.
2.5. Set up of the Treatment System (Prototype)
The prototype was built up with concrete and its surface was treated with a paint-type waterproofing. The prototype has two storage tanks, one for polluted water and another for treated water, connected through a rectangular channel where removal of heavy metals takes place (Figure 3). The as-prepared sorbent material was placed in bags fabricated with a geotextile and secured with plastic ties to supports. Those elements were built with a frame of metallic square tube and an electro-welded mesh. To fix the supports in the desired positions, sections of welded angles were placed over the plates anchored to the walls and the floor of the reaction tank (Figure 4). The latter metallic structure was used also as rails. Moreover, sliding metal gates were used to control the flow of polluted water. Figure 5 illustrates the steel supports to hold the barriers containing Technosols.
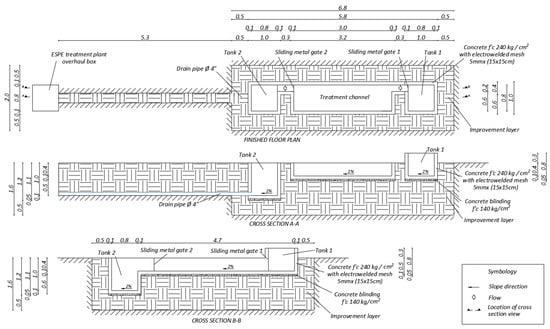
Figure 3.
Prototype construction scheme.
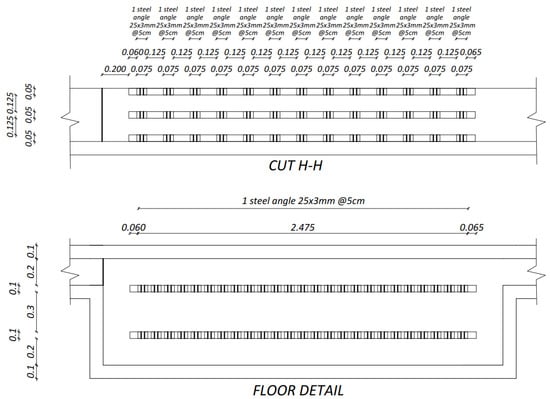
Figure 4.
Steel plates and angles detail.
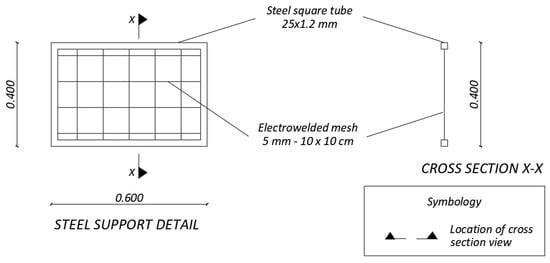
Figure 5.
Steel support detail.
Dimensions of the polluted water storage tank are 0.8 × 0.8 × 0.7 m3 with a maximum capacity of 416 L, leaving 5 cm off. The treated water storage tank is 0.8 × 0.8 × 1.0 m3. The channel where the reaction barriers are fixed is 3 m long, with 0.8 m of width and 0.4 m of depth having a slope of 2%. The central channel and storage tanks are connected by gutters of 0.5 m length and 0.2 m width. The prototype was built to accommodate a series of reactive barriers packed with Technosol and nanoparticles, placed alternately. This setup is located inside the Universidad de las Fuerzas Armadas ESPE campus, Sangolquí, central Ecuador, within the green area next to the wastewater treatment plant, to which the drainage of the prototype was connected.
2.6. Construction of the Treatment System Prototype
The development and construction of the prototype began with the cleaning and stakeout of the designated area for implementing the prototype inside the Universidad de las Fuerzas Armadas ESPE. This was followed by excavation with a backhoe and the application of an improvement layer. On this surface, the 5 cm concrete blinding was cast with f’c = 140 kg·cm2, then a 5 mm × (15 × 15 cm2) electro-welded mesh was formed and placed, to give way to the casting of the floor and walls of 10 cm thick concrete with a resistance f’c = 240 kg·cm2 (Figure 6A). The casting was carried out in two stages, starting with the final tank which is deeper, and then the channel and the initial tank. After the drying and curing period, the entire surface was waterproofed. Finally, labors related to metal parts were carried out, such as placing the plates, gates and covers. Figure 6B shows the prototype after finishing the concrete construction. Figure 6C shows one of the 60 × 40 cm2 metal panels that serves as a support for the Technosol barrier in a 40 × 30 cm2 bag made of geotextile as shown in Figure 6D.
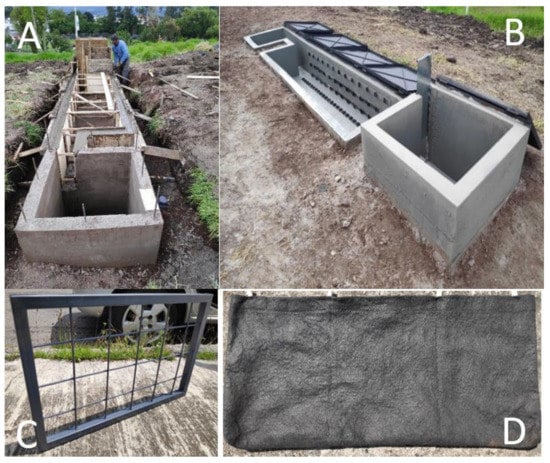
Figure 6.
Components of the prototype. (A) Concrete casting of the prototype; (B) prototype completed construction; (C) steel support; (D) geotextile bag.
2.7. Prototype Experimentation
Before conducting the removal of arsenic(V) with the prototype, hydraulic properties of the treatment section were estimated. For these experiments, barriers were fixed on the reaction channel separated by 30, 20 and 10 cm (Figure 7). Then, from 13.33 to 75 kg of only soil was put in geotextile bags and secured with plastic ties to the supports of the metal frame and to the electro-welded mesh. Next, the right storage tank was filled with potable water from the ESPE network up to 100 or 200 L. Hydraulic experimentation started when the right gate was opened and time was recorded. With the purpose of avoiding the waste of water, a pump was installed to recirculate it at the end of each cycle. For the tests of As(V) removal from mine tailings, bags were filled with 12.33 kg of soil and 0.4 kg of nanoparticles. Table 1 and Table 2 list the data of the described experimental work.
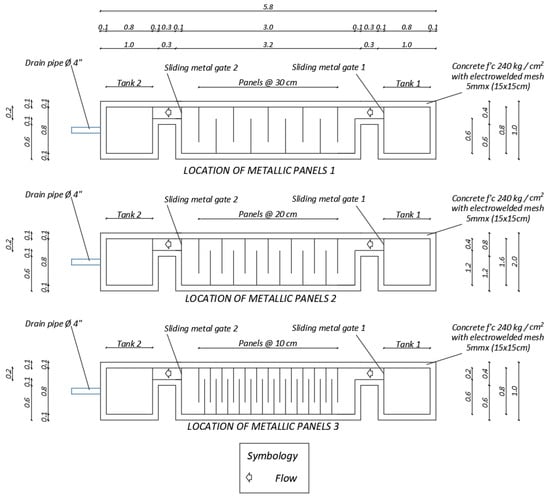
Figure 7.
Metal panel placement scheme.

Table 1.
Experimental data.

Table 2.
Barriers’ data for the tests.
In the first stage, six options were tested without restriction in Gate 2, varying the barrier separations between 10, 20 and 30 cm and using a volume of polluted water of 100 and 200 L, under the conditions described in Table 1 and Table 2. Considering the results of the hydraulic calculations, to examine the retention of As, experimental conditions of test P1 and P2 were chosen. For each option, five cycles were introduced with recirculation of the tailing samples. Due to the low retention percentages of As (V) achieved with the previous tests, some parameters were changed keeping the separation of barriers in 10 cm.
To restrict the output of the liquid and increase the residence time in the system, the opening of Gate 2 was changed to 0.5 cm in tests P7, P8, P9 and 0.2 cm in P10 (Figure 8). In options P7 and P9, the exit gate was closed for 1 h to find out the effect of the long-term contact between water and reactive barriers. Water samples were taken every 15 min. In cases P8 and P10 the gate was opened throughout the test. In P7 and P8 were treated 100 L and in P9 and P10, 44 L was used. This variation was performed considering the total amount of nanoparticles that were synthesized at the time of testing. Therefore, the volume of water was decreased depending on the amount of soil to be used to maintain a proportion equal to 97% soil + 3% NPs.
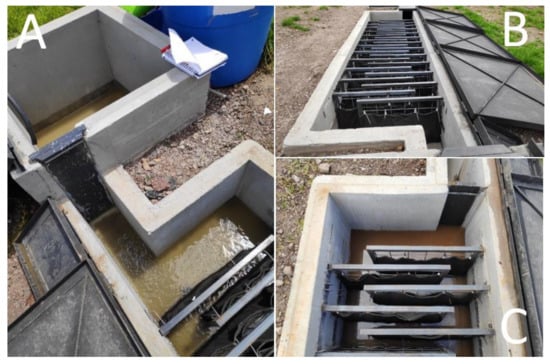
Figure 8.
Prototype arrangement. (A) Inflow channel for treatment of As-polluted tailings; (B) location of barriers separated by 10 cm; (C) output gate flow restriction.
In all four cases, increased hydraulic retention times were specified with the restriction of the final gate, so As retention tests were enhanced. Additionally, a variation of P9 and P10 was included in relation to the composition of the barriers for determining the contribution of nanoparticles compared with the use of only soil. In cases P7, P9.1 and P9.2 were performed five cycles, while ten cycles were completed in P8, P10.1 and P10.2.
2.8. Hydraulic Calculations
Hydraulic tests were conducted using a fixed volume of water (see Table 1) without continuous input. The flow rate was calculated assuming a flow under a flat gate using the following equation:
where Q is the flow rate passing through the gate (L.s−1), a is the opening of the gate (m), b is the width of the gate (m), ∈ is the contraction coefficient, Cv is the speed coefficient and Ho is the total load before the gate (m). The contraction coefficient ∈ depends on the degree of opening of the gate and the load H. For small openings, the contraction coefficient, ∈ = 0.615. The speed coefficient for flat gates in channels, Cv = 0.96 []. Similar conditions to those of a baffled channel flocculator with horizontal flow were assumed for the flow path through the barriers. The total length, useful channel width, maximum normal depth (measured at hydraulic tests) and maximum flow are taken to calculate the system speed and retention time using the following equations:
where Q is the maximum flow calculated with Equation (2), v is the flow rate between barriers (m·s−1), b is the useful width of the channels between barriers (m), h is the maximum normal depth measured at experimentation (m), L is the total length of travel between barriers (m), Tr is the hydraulic retention time (s).
3. Results and Discussion
3.1. Soil Characterization
Organic matter (OM) is formed of a wide variety of substances, and their specific nature is determined by plants and animal waste that break down in a site continuously [,]. The measured values were 1.68% for S1 and 2.64% for S2, demonstrating a low content of OM. Cation exchange capacity (CEC) reflects the total exchangeable cations of a soil; the higher the CEC, the greater the number of cations that the soil is able to retain [,]. It depends mainly on the quantity and type of clays and the organic matter content present in the soil, being CEC of 10.22 and 18.4 meq/100 g for S1 and S2, respectively [,,]. The values are consistent with the content of organic matter and are classified as low, being between 10 and 20 meq/100 g. The low levels of OM and CEC are related to their condition as inert soils, so they are not used for agricultural purposes [].
Hydrogen potential (pH) measures the degree of acidity of a soil, meaning the concentration of hydrogen ions (H+) in the soil, related by pH = −log(H+). It is an indicator of the availability of essential nutrients and the toxicity action of other elements. At an acidic pH (pH < 6) there is a decrease in N, P, K, Ca and Mg due to solubility restrictions and adsorption drop, while Al and Mn increase their concentrations in the exchange process that causes toxicity [,,]. The results were 5.61 for S1 and 5.52 for S2. Therefore, both soils are moderately acidic.
The type of soil texture is quite related to water properties. Sandy soils are very permeable, the clayey ones have greater water retention capacity and the silty types are more impermeable. Depending on the degree and type of structure, the hydraulic characteristics may vary [,,]. Soil S1 exhibited the following characteristics: < 50% passed through a No. 200 sieve size, a liquid limit of 37%, a plastic limit of 20% and a plastic index of 17%. Under the criteria of the Unified Soil Classification System (USCS), this soil is a clayed sand (CS) []. Soil S2 yielded > 50% of granules passing through a No. 200 sieve size, a liquid limit of 40%, a plastic limit of 30% and plastic index of 10%. Moreover, using the USCS classification, this soil is a lean clay (CL).
Both soils failed to meet the regulated limits given in the national regulations of Ecuador for soil quality criteria in regard to Cr, Ni, Zn and As []. Soil S1 exceeded 3.2 times the limit for Cd and 1.74 times for Pb and soil S2 surpassed 2.1 times for Cd. Moreover, the content of total Fe was 5890 y 9127 mg.kg−1 for S1 and S2 soils, respectively, thus reflecting a high content of iron oxides (see Table 3).

Table 3.
Trace element composition.
S1 was selected to be part of the barriers because it has characteristics similar to those used in previous studies, with fines close to 50%, levels of organic matter and CEC less than 5% and 20 meq/100 g soil, respectively. S2 was chosen to be part of the synthesis of nanoparticles because of its higher content of Fe and clay.
3.2. Tailings Characterization
A slightly acidic pH with a value of 6.49 was measured and meets the allowable limit fixed in TULSMA between 6 and 9 []. Conductivity is the property of aqueous solutions that drives the flow of electric current and depends on the presence of ions, their concentration and the temperature [,]. The measured value of 1336 ms.cm−1 is typical of sewage. The redox potential is the oxidizing or reducing capacity of the medium and it is measured in millivolts or volts. A high positive value indicates an environment that favors oxidation reactions. On the other hand, a low negative value implies a highly reducing environment []. The measured value of 117.38 mV is associated with a fresh sewage (see Table 4).

Table 4.
Some properties of mine tailings.
The majority of heavy metals in mine tailings (Cr, Pb, Ni, Zn, Fe and As) were below the allowed levels for discharge into a freshwater []. However, Cu and Pb exceeded 23.2 and 3.3 times the regulated limit, in that order. To evaluate the removal efficiency of As(V), we prepared tailings with an approximated concentration of 5 mg·L−1 (see Table 5).

Table 5.
Heavy metals concentrations of mine tailing.
3.3. Nanoparticle Characterization
The XRD spectrum of nanoparticles shows a peak at 44.7955° (2θ) that corresponds to elemental iron (α-Fe) and the peaks at 44.7955° and 35.6349° (2θ) associated with the presence of iron sulfide (Figure 9). SEM images showed that the as-prepared NPs are spherical with a size of 67.8 ± 12.4 nm, surrounded by a rough surface (Figure 10). EDS results revealed that the iron content on the nanoparticles is 41.05%. This is around tenfold compared to soil that is only 3.85% Fe (Table 6. These results confirm the fact that these tiny particles have elemental iron nanoparticles coated with iron sulfide.
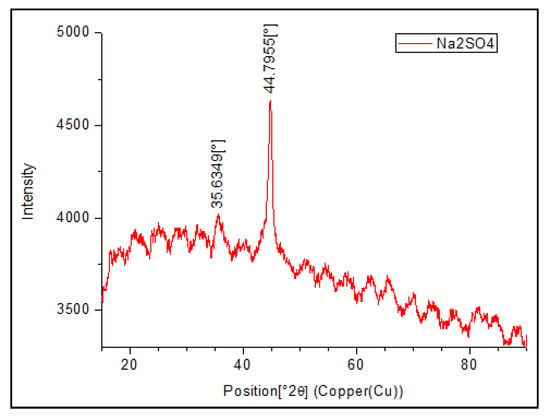
Figure 9.
X-ray diffraction pattern of multicomponent nanoparticles.
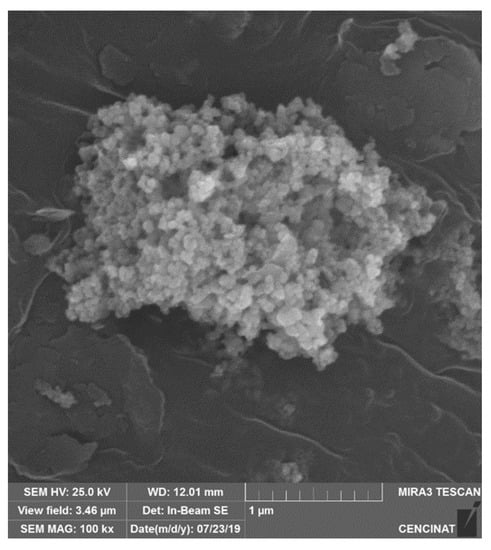
Figure 10.
A SEM image of multicomponent nanoparticles.

Table 6.
EDS analysis.
3.4. Prototype Experimentation
In the P1 test, reactive barriers were separated by 10 cm and the water volume was 100 L. With these experimental conditions, the highest retention time was achieved (39.1 s). In P2, changing the volume to 200 L, a decrease in time was observed (35.2 s). In tests P3 and P4 with barrier separations of 20 cm, holding times reached 31.4 s and 28.8 s, respectively. Tests P5 and P6 with barrier separations of 30 cm, retention times were 28.4 s and 27.5 s, in that order. It is remarkable to observe that there is a time decrease by increasing the separation of barriers and the volume of water to be treated. This is obviously related to the decrease in the travel length between barriers and the increase in flow rate.
As illustrated in Figure 11, for the P1 test, in the first cycle, a 15.1% of As retention was obtained, and the following cycles showed variations such as follows: 6.0%, −6.4%, 10% and 2.2%. At the end of the five treatments, a retention of 25.6% was reached. For the P2 test, the first cycle showed 12.3% retention, an 8.3% increase in the second cycle, a decrease of 6.2%, 0.2% and 4.9% in the third, fourth and fifth cycles, respectively. A total retention of 6.7% was reached. The release of As observed in several cycles may be because of the short times between cycles (~5 min). This may prevent contaminant bonding to soil and nanoparticles’ reaction sites. This effect is even greater in the P2 test because there is an increase in flow and speed. Thus, there is not enough time for the As(V) to react with the reaction sites of the sorbent material.
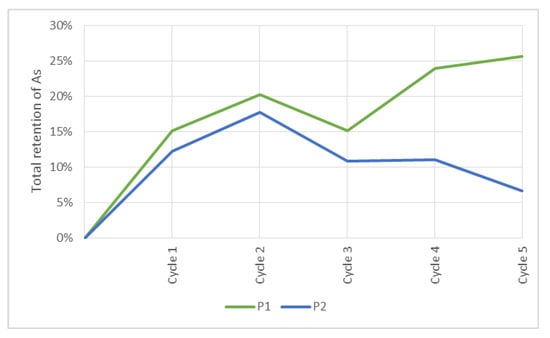
Figure 11.
Total retention of As in P1 and P2 cases.
In case P7 with a water volume of 100 L (Figure 12), the tailings remained stagnant for 1 h. Furthermore, the retention times for the inflow and outflow were calculated as 39.3 s and 115.1 s, respectively. In P9 with 44 L (Figure 12), the period of stagnation was maintained and the holding times were 68.3 s and 218.7 s. For P8 with a water volume of 100 L (Figure 13), the calculated retention time was 96.6 s. In P10, with the same separation of barriers and 44 L (Figure 13), the time was raised to 204.7 s.
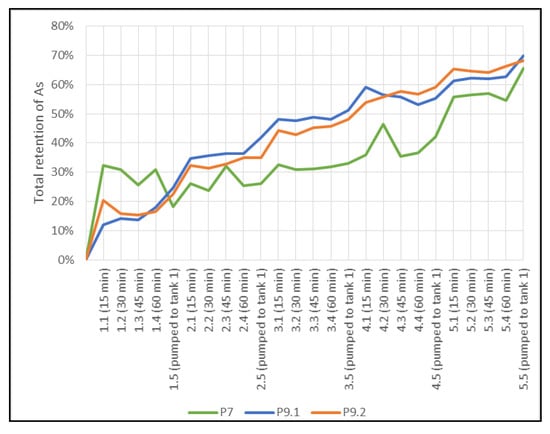
Figure 12.
Total retention of As in P7 and P9 cases.
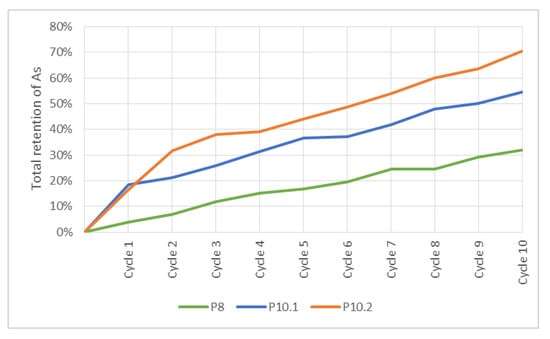
Figure 13.
Total retention of As in P8 and P10 cases.
In P7, 65.5% of As retention was achieved after five cycles (Figure 12). Note that the greatest adsorption occurs in the first 15 min of the treatment. In between cycles, there was 1 h in which the flow of liquid was stopped for equilibration of the sorbent material. It is noteworthy to realize that adsorption increased after all the liquid was released, showing that uptake reactions of As(V) are more effective when the liquid was moving compared to stagnation because, during stagnation, only a small volume of contaminated water remained in contact with the reactive material of the barriers. Cycles 1 and 4 showed the highest release of the contaminant, with 18.5% and 20.6%, respectively. The sorption characteristics of heavy metals on soils depend largely on the residence time of the adsorbate in contact with the adsorbent []. The results of As release showed that the treatment time was insufficient to stabilize the reaction.
Tests P9.1 and P9.2 reached an As(V) retention of 69.8% and 68.3%, respectively (Figure 12). For these tests, the volume of the mine tailings was decreased to 44 L. As a result, there was a decrease in flow and speed and an increase in retention time. These tests exhibited a similar uptake of As(V) compared to P7 (Figure 12) and there was a relatively low As release with a maximum of 6.4% for P9.1 and 5.7% for P9.2. It is remarkable to verify that the contribution of nanoparticles in test P9.2 for the removal of As(V) was insignificant (97% soil + 3% NPs) compared to the P9.1 test (100% soil), achieving only a 1.02 times higher retention percentage at the end of the five cycles.
The retention rates of As at the end of 10 cycles for tests P8, P10.1 and P10.2 were 31.9%, 54.5% and 70.5%, respectively (Figure 13). All these tests did not show As release in any cycle. P10.1 and P10.2 tests yielded higher As retention, which was linked to their hydraulic parameters. The retention times of P10.1 and P10.2 were 2.1 times longer than P8. Results and experimental conditions of P10.2 revealed this is the best treatment because it is the only one that exceeded 70% of As retention. Therefore, Technosol with multicomponent nanoparticles demonstrated a higher capacity for adsorption of the pollutant.
Arsenic is able to be strongly attracted to the sites of sorption on the surface of various solid materials [,]. Excellent sorption efficiency has been found using iron oxides and hydroxide-based materials [,]. Reactivity is limited by the characteristics of the medium, contaminant and sorbent material. One way to improve reactivity is to increase the specific surface area of the material, as this increases the area/volume ratio [,].
As proven, barriers packed with Technosols containing 97% soil + 3% MCNPs showed an enhanced adsorption of arsenic because their reactivity was improved due to the involvement of the nanoparticles. The sizes of these minuscule particles are in the range of 67.8 12.4 nm (Figure 10) and certainly influence their chemical properties and therefore the reactivity [,]. The combination of Fe0 and FeS in the nanoparticle provides a synergetic reactivity for the selective capture of As from mine tailings. The oxidized iron retains As forming stable inner-sphere complexes [,], while As surface complexation is the key mechanism for arsenic removal by FeS [,]. Moreover, iron-rich soil also uptakes As by the interaction with the hydrated iron oxides through Lewis acid-base and electrostatic forces [,].
From the perspective of Technosol management, once it gets saturated with arsenic. It should be withdrawn from the geotextile bags and collected to be disposed of in an aerobic landfill. The latter is a need to avoid reduction of iron oxides and the release of the arsenic into the environment. Despite the amount of the exhausted Technosol might be a little high, its cost is not so expensive. In addition, it shows good performance in the treatment of arsenic-contaminated aqueous wastes and most importantly, this sorbent material can be prepared locally.
In terms of costs, in the local market, a ton of Technosol would be approximately $4900; however, this amount of material can treat 23,110 L of mine tailings with an average concentration of 5 mg/L of arsenic, removing 70% of the metalloid. Compared to other sorbent materials such as carbon-based [], the cost is approximately two-fold, but the Technosol, due to the properties explained before, can operate in a broad range of pH, which secures the removal of arsenic from acidic and basic mine tailings.
4. Conclusions
The built prototype containing a concrete structure with two storage tanks and a rectangular channel furnished with barriers filled with Technosols and multicomponent nanoparticles, was used to treat As-polluted water. Results indicate that Test P10.2 reached 70.5% of As retention after 10 cycles of treatment. This test was run with a maximum inflow rate of 43.8 L·min−1, outflow rate of 13.2 L·min−1, speed of 6 m·min−1 and a hydraulic retention time of 3.4 min per cycle. The sorbent material containing 97% soil + 3% NPs was the best sorbent material for As removal. Nevertheless, the indigenous iron-rich soil yielded also a high As retention capacity by itself. Therefore, barriers could be filled with only soil, but the treatment should have an increase in the hydraulic retention time to reach an equivalent As retention. On the contrary, with less than five minutes between cycles yielded a release of the metalloid, because there was not enough time for adsorption reactions to take place and reach equilibration. As a sorbent material, the Technosol showed good performance in the treatment of arsenic-contaminated aqueous wastes, and most importantly, the material can be prepared locally. Thus, this simple and not expensive technological setup could be scaled up to a functional field application to effectively capture arsenic from aqueous tailings.
Author Contributions
Conceptualization, D.B.-G. and L.C.; Methodology, D.B.-G., E.L. and L.C.; Software, E.L.; Validation, T.T.; Formal analysis, D.B.-G., I.G. and E.L.; Investigation, D.B.-G., I.G. and E.L.; Data curation, I.G.; Writing—original draft, T.T.; Writing—review & editing, T.T.; Visualization, D.B.-G.; Supervision, D.B.-G. and L.C. All authors have read and agreed to the published version of the manuscript.
Funding
This research was funded by Universidad de las Fuerzas Armadas ESPE project number 2018-PIC-005 and the APC will be funded by Universidad de las Fuerzas Armadas ESPE.
Data Availability Statement
Not applicable.
Conflicts of Interest
The authors declare no conflict of interest.
References
- Walter, I.; Ugelow, J.L. Environmental policies in developing countries. Ambio 1979, 8, 102–109. [Google Scholar]
- Azapagic, A. Developing a framework for sustainable development indicators for the mining and minerals industry. J. Clean. Prod. 2004, 12, 639–662. [Google Scholar] [CrossRef]
- Newbold, J. Chile’s environmental momentum: ISO 14001 and the large-scale mining industry–Case studies from the state and private sector. J. Clean. Prod. 2006, 14, 248–261. [Google Scholar] [CrossRef]
- Mestanza-Ramón, C.; Paz-Mena, S.; López-Paredes, C.; Jimenez-Gutierrez, M.; Herrera-Morales, G.; D’Orio, G.; Straface, S. History, Current Situation and Challenges of Gold Mining in Ecuador’s Litoral Region. Land 2021, 10, 1220. [Google Scholar] [CrossRef]
- Marshall, B.G.; Veiga, M.M.; Da Silva, H.A.M.; Guimarães, J.R.D. Cyanide Contamination of the Puyango-Tumbes River Caused by Artisanal Gold Mining in Portovelo-Zaruma, Ecuador. Curr. Environ. Health Rep. 2020, 7, 303–310. [Google Scholar] [CrossRef]
- Gonçalves, A.O.; Marshall, B.G.; Kaplan, R.J.; Moreno-Chavez, J.; Veiga, M.M. Evidence of reduced mercury loss and increased use of cyanidation at gold processing centers in southern Ecuador. J. Clean. Prod. 2017, 165, 836–845. [Google Scholar] [CrossRef]
- Pesantes, A.A.; Carpio, E.P.; Vitvar, T.; López, M.M.M.; Menéndez-Aguado, J.M. A Multi-Index Analysis Approach to Heavy Metal Pollution Assessment in River Sediments in the Ponce Enríquez Area, Ecuador. Water 2019, 11, 590. [Google Scholar] [CrossRef]
- Veiga, M.M.; Angeloci, G.; Hitch, M.; Velasquez-Lopez, P.C. Processing centres in artisanal gold mining. J. Clean. Prod. 2014, 64, 535–544. [Google Scholar] [CrossRef]
- Leguédois, S.; Séré, G.; Auclerc, A.; Cortet, J.; Huot, H.; Ouvrard, S.; Watteau, F.; Schwartz, C.; Morel, J.L. Modelling pedogenesis of Technosols. Geoderma 2016, 262, 199–212. [Google Scholar] [CrossRef]
- Séré, G.; Schwartz, C.; Ouvrard, S.; Renat, J.-C.; Watteau, F.; Villemin, G.; Morel, J.L. Early pedogenic evolution of constructed Technosols. J. Soils Sediments 2010, 10, 1246–1254. [Google Scholar] [CrossRef]
- Wahsha, M.; Bini, C.; Argese, E.; Minello, F.; Fontana, S.; Wahsheh, H. Heavy metals accumulation in willows growing on Spolic Technosols from the abandoned Imperina Valley mine in Italy. J. Geochem. Explor. 2012, 123, 19–24. [Google Scholar] [CrossRef]
- Paz, J. Estudio de la inmovilización de metales pesados presentes en relave líquido de minería empleando tecnosoles, a nivel de laboratorio. Undergraduate Thesis, Universidad de las Fuerzas Armadas ESPE, Sangolquí, Ecuador, 2018. [Google Scholar]
- Bolaños-Guerrón, D.R.; Sánchez-Gómez, V.P.; Paz, J.; Izquierdo, A.R.; Stael, C.; Balseiro-Romero, M. Arsenic Retention on Technosols Prepared with Nanoparticles and Ferric Soil from Mine Drainage Water. J. Nanotechnol. 2018, 2018, 1–8. [Google Scholar] [CrossRef]
- Bolaños, D.; Sánchez, V.; Paz, J.; Balseiro, M.; Cumbal, L. Arsenic retention on technosols prepared with nanoparticles for treatment of mine drainage water. In Environmental Arsenic in a Changing World; CRC Press: Boca Raton, FL, USA, 2019; pp. 463–466. [Google Scholar] [CrossRef]
- Guerrón, D.B.; Capa, J.; Flores, L.C. Retention of heavy metals from mine tailings using Technosols prepared with native soils and nanoparticles. Heliyon 2021, 7, E07631. [Google Scholar] [CrossRef]
- López, E. Biosíntesis de nanopartículas multicomponente mediante el extracto de Citrus sinensis para inmovilización de metales pesados en aguas contaminadas. Undergraduate Thesis, Sangolquí, Ecuador, 2017. [Google Scholar]
- Ramos, M.A.V.; Yan, W.; Li, X.-Q.; Koel, B.E.; Zhang, W.-X. Simultaneous Oxidation and Reduction of Arsenic by Zero-Valent Iron Nanoparticles: Understanding the Significance of the Core−Shell Structure. J. Phys. Chem. C 2009, 113, 14591–14594. [Google Scholar] [CrossRef]
- Bostick, B.C.; Fendorf, S. Arsenite sorption on troilite (FeS) and pyrite (FeS2). Geochim. Cosmochim. Acta 2003, 67, 909–921. [Google Scholar] [CrossRef]
- Capa, C. Aplicación de Tecnosoles para la recuperación de suelos y aguas afectados por actividades de obras civiles, urbanas y minería. Undergraduate Thesis, Sangolquí, Ecuador, 2019. [Google Scholar]
- ASTM D2487-17e1; Standard Practice for Classification of Soils for Engineering Purposes. American Society for Testing and Materials: West Conshohocken, PA, USA, 2017.
- Rhoades, J. Cation exchange capacity. In Methods of Soil Analysis: Part 2 Chemical and Microbiological Properties; American Society of Agronomy: New York, NY, USA, 1983; pp. 149–157. [Google Scholar]
- Pham-Anh, T.; Sillanpää, M. Fractionation of Macro and Trace Metals Due to Off-Time Interrupted Electrodewatering. Dry. Technol. 2010, 28, 762–772. [Google Scholar] [CrossRef]
- ASTM D2216; Standard Test Methods for Laboratory Determination of Water (Moisture) Content of Soil and Rock by Mass. American Society for Testing and Materials: West Conshohocken, PA, USA, 2019.
- ASTM D422; Standard Test Method for Particle-Size Analysis of Soils. American Society for Testing and Materials: West Conshohocken, PA, USA, 2007.
- ASTM D4318; Standard Test Methods for Liquid Limit, Plastic Limit, and Plasticity Index of Soils. American Society for Testing and Materials: West Conshohocken, PA, USA, 2017.
- ISO 11265; Soil Quality—Determination of the Specific Electrical Conductivity. International Organization for Standardization: Geneva, Switzerland, 1994.
- Zagal, E.; Zadzwaka, R. Protocolo de Métodos de Análisis para Suelos y Lodos; Universidad de Concepción: Santiago, Chile, 2007. [Google Scholar]
- AASHTO T267; Standard Method of Test for Determination of Organic Content in Soils by Loss on Ignition. American Association of State Highway and Transportation Officials: Washington, DC, USA, 1984.
- ISO 10390; Soil Quality—Determination of pH. International Organization for Standardization: Geneva, Switzerland, 2005.
- Jankiewicz, B.; Ptaszynski, B.; Turek, A. Spectrophotometric determination of copper (II) in samples of soil from selected allotment gardens in Lodz. Pol. J. Environ. Stud. 1999, 8, 35–38. [Google Scholar]
- Rice, E.; Baird, R.; Eaton, A. (Eds.) Standard Methods for the Examination of Water and Wastewater; American Public Health Association: Washington, DC, USA, 2017. [Google Scholar]
- Stael, C.; Cumbal, L. Optimized synthesis of multicomponent nanoparticles for removing heavy metals from artificial mine tailings. Biol. Med. 2016, 8, 2016. [Google Scholar] [CrossRef]
- Yaacob, W.Z.W.; How, H.K. Synthesis and Characterization of Marine Clay-Supported Nano Zero Valent Iron. Am. J. Environ. Sci. 2015, 11, 115–124. [Google Scholar] [CrossRef]
- Sandoval, W. Principios de Hidráulica 2; EDIESPE: Quito, Ecuador, 2013. [Google Scholar]
- Wolters, V. Invertebrate control of soil organic matter stability. Biol. Fertil. Soils 2000, 31, 1–19. [Google Scholar] [CrossRef]
- Kögel-Knabner, I. The macromolecular organic composition of plant and microbial residues as inputs to soil organic matter. Soil Biol. Biochem. 2002, 34, 139–162. [Google Scholar] [CrossRef]
- Dohrmann, R. Cation exchange capacity methodology I: An efficient model for the detection of incorrect cation exchange capacity and exchangeable cation results. Appl. Clay Sci. 2006, 34, 31–37. [Google Scholar] [CrossRef]
- Solly, E.F.; Weber, V.; Zimmermann, S.; Walthert, L.; Hagedorn, F.; Schmidt, M.W.I. A Critical Evaluation of the Relationship Between the Effective Cation Exchange Capacity and Soil Organic Carbon Content in Swiss Forest Soils. Front. For. Glob. Chang. 2020, 3, 98. [Google Scholar] [CrossRef]
- Tisdall, J.M.; Oades, J.M. Organic matter and water-stable aggregates in soils. Eur. J. Soil Sci. 1982, 33, 141–163. [Google Scholar] [CrossRef]
- Hassink, J.; Whitmore, A.P. A Model of the Physical Protection of Organic Matter in Soils. Soil Sci. Soc. Am. J. 1997, 61, 131–139. [Google Scholar] [CrossRef]
- Sarkar, B.; Singh, M.; Mandal, S.; Churchman, G.J.; Bolan, N. Clay Minerals—Organic Matter Interactions in Relation to Carbon Stabilization in Soils. In The Future of Soil Carbon; Academic Press: Cambridge, MA, USA, 2018; pp. 71–86. [Google Scholar]
- Loveland, P.; Webb, J. Is there a critical level of organic matter in the agricultural soils of temperate regions: A review. Soil Tillage Res. 2003, 70, 1–18. [Google Scholar] [CrossRef]
- Peech, M. Hydrogen-ion activity. In Methods of Soil Analysis: Part 2 Chemical and Microbiological Properties; American Society of Agronomy: New York, NY, USA, 1965; Volume 9, pp. 914–926. [Google Scholar]
- McCauley, A.; Jones, C.; Jacobsen, J. Soil pH and organic matter. Nutr. Manag. Modul. 2009, 8, 1–12. [Google Scholar]
- McLean, E.O. Soil pH and lime requirement. Methods of Soil Analysis: Part 2. Chem. Microbiol. Prop. -Agron. Monogr. 1983, 9, 199–224. [Google Scholar]
- Klute, A. Laboratory measurement of hydraulic conductivity of saturated soil. In Methods of Soil Analysis: Part 1 Physical and Mineralogical Properties, Including Statistics of Measurement and Sampling; American Society of Agronomy: New York, NY, USA, 1965; Volume 9, pp. 210–221. [Google Scholar]
- Cosby, B.J.; Hornberger, G.M.; Clapp, R.B.; Ginn, T.R. A Statistical Exploration of the Relationships of Soil Moisture Characteristics to the Physical Properties of Soils. Water Resour. Res. 1984, 20, 682–690. [Google Scholar] [CrossRef]
- Kool, J.B.; Parker, J.C. Development and evaluation of closed-form expressions for hysteretic soil hydraulic properties. Water Resour. Res. 1987, 23, 105–114. [Google Scholar] [CrossRef]
- Warren, S.N.; Kallu, R.R.; Barnard, C.K. Correlation of the Rock Mass Rating (RMR) System with the Unified Soil Classification System (USCS): Introduction of the Weak Rock Mass Rating System (W-RMR). Rock Mech. Rock Eng. 2016, 49, 4507–4518. [Google Scholar] [CrossRef]
- Capparelli, M.V.; Moulatlet, G.M.; Abessa, D.M.D.S.; Lucas-Solis, O.; Rosero, B.; Galarza, E.; Tuba, D.; Carpintero, N.; Ochoa-Herrera, V.; Cipriani-Avila, I. An integrative approach to identify the impacts of multiple metal contamination sources on the Eastern Andean foothills of the Ecuadorian Amazonia. Sci. Total. Environ. 2019, 709, 136088. [Google Scholar] [CrossRef] [PubMed]
- Morgan, F.D.; Williams, E.R.; Madden, T.R. Streaming potential properties of westerly granite with applications. J. Geophys. Res. Earth Surf. 1989, 94, 12449–12461. [Google Scholar] [CrossRef]
- Varghese, K.S.; Pandey, M.C.; Radhakrishna, K.; Bawa, A.S. Technology, applications and modelling of ohmic heating: A review. J. Food Sci. Technol. 2012, 51, 2304–2317. [Google Scholar] [CrossRef]
- Krumbein, W.C.; Garrels, R.M. Origin and Classification of Chemical Sediments in Terms of pH and Oxidation-Reduction Potentials. J. Geol. 1952, 60, 1–33. [Google Scholar] [CrossRef]
- Wu, H.; Wen, Q.; Hu, L.; Gong, M. Effect of Adsorbate Concentration to Adsorbent Dosage Ratio on the Sorption of Heavy Metals on Soils. J. Environ. Eng. 2018, 144, 04017094. [Google Scholar] [CrossRef]
- Bowell, R. Sorption of arsenic by iron oxides and oxyhydroxides in soils. Appl. Geochem. 1994, 9, 279–286. [Google Scholar] [CrossRef]
- Chutia, P.; Kato, S.; Kojima, T.; Satokawa, S. Arsenic adsorption from aqueous solution on synthetic zeolites. J. Hazard. Mater. 2009, 162, 440–447. [Google Scholar] [CrossRef]
- Yu, X.-Y.; Liu, Z.-G.; Huang, X.-J. Nanostructured metal oxides/hydroxides-based electrochemical sensor for monitoring environmental micropollutants. Trends Environ. Anal. Chem. 2014, 3–4, 28–35. [Google Scholar] [CrossRef]
- Uddin, M.J.; Jeong, Y.K. Efficiently performing periodic elements with modern adsorption technologies for arsenic removal. Environ. Sci. Pollut. Res. 2020, 27, 39888–39912. [Google Scholar] [CrossRef]
- Roy, J. Economic benefits of arsenic removal from ground water—A case study from West Bengal, India. Sci. Total Environ. 2008, 397, 1–12. [Google Scholar] [CrossRef]
- Kumar, R.; Patel, M.; Singh, P.; Bundschuh, J.; Pittman, C.U., Jr.; Trakal, L.; Mohan, D. Emerging technologies for arsenic removal from drinking water in rural and peri-urban areas: Methods, experience from, and options for Latin America. Sci. Total Environ. 2019, 694, 133427. [Google Scholar] [CrossRef] [PubMed]
- Wang, Y.; Herron, N. Nanometer-sized semiconductor clusters: Materials synthesis, quantum size effects, and photophysical properties. J. Phys. Chem. 1991, 95, 525–532. [Google Scholar] [CrossRef]
- Grassian, V.H. When Size Really Matters: Size-Dependent Properties and Surface Chemistry of Metal and Metal Oxide Nanoparticles in Gas and Liquid Phase Environments. J. Phys. Chem. C 2008, 112, 18303–18313. [Google Scholar] [CrossRef]
- Cumbal, L.; SenGupta, A.K. Arsenic Removal Using Polymer-Supported Hydrated Iron(III) Oxide Nanoparticles: Role of Donnan Membrane Effect. Environ. Sci. Technol. 2005, 39, 6508–6515. [Google Scholar] [CrossRef]
- Cumbal, L.H.; SenGupta, A.K. Preparation and Characterization of Magnetically Active Dual-Zone Sorbent. Ind. Eng. Chem. Res. 2005, 44, 600–605. [Google Scholar] [CrossRef]
- Murgueitio, E.; Cumbal Flores, L.H.; Toulkeridis, T. Removal of arsenic and heavy metals from contaminated water with emerging sorbents. In Proceedings of CIT 2022, Smart Innovation, Systems and Technologies (SIST) Series; Springer: Berlin/Heidelberg, Germany, 2022. [Google Scholar]
- Di Natale, F.; Erto, A.; Lancia, A.; Musmarra, D. A descriptive model for metallic ions adsorption from aqueous solutions onto activated carbons. J. Hazard. Mater. 2009, 169, 360–369. [Google Scholar] [CrossRef] [PubMed]
Disclaimer/Publisher’s Note: The statements, opinions and data contained in all publications are solely those of the individual author(s) and contributor(s) and not of MDPI and/or the editor(s). MDPI and/or the editor(s) disclaim responsibility for any injury to people or property resulting from any ideas, methods, instructions or products referred to in the content. |
© 2023 by the authors. Licensee MDPI, Basel, Switzerland. This article is an open access article distributed under the terms and conditions of the Creative Commons Attribution (CC BY) license (https://creativecommons.org/licenses/by/4.0/).