

Indoor Environmental Quality Assessment Model (IEQ) for Houses


Abstract
:1. Introduction
2. Interior Environmental Quality IEQ
Models of Assessment of Interior Environment Quality IEQ
3. Methods
3.1. Identification of Evaluation Criteria
3.2. Housing Assessment
- Type of housing: for example, criteria were excluded that evaluated conditions of lifts;
- Features of the local housing: for example, criteria were excluded that assess the HVAC since 85% of homes in the study area use natural ventilation in their enclosures [39].
- U12-013: Data-logger 2 analogic + T°/HR internal;
- U12-012: Lux Data-logger + T°/HR internal;
- U12-006: Data-logger 4 analog ports;
- CABLE-2.5-STEREO: Cable for interface to ZW;
- BHW-PRO-CD: HOBOWare communication software.
- Monitoring of outdoor temperatures (°C), indoor temperatures (°C), surface temperatures (°C), and indoor and outdoor relative humidity (% RH), measured during two periods (summer and winter);
- Simulation of illumination (lux) (DF) through the Autodesk software Ecotect Analysis, version 2011;
- The estimation of noise levels through the constructive systems of housing’s envelopes against the sound’ impact was performed considering local regulation for acoustic isolation.
3.3. Definition of Regional Priorities
4. Results and Discussion
4.1. Identification of Evaluation Criteria
- The evaluation criteria are compatible with the characteristics of the dwellings;
- The evaluation criteria contributed to overcoming problems in housing;
- The method for evaluating was feasible to apply;
- The requirements levels were in line with local conditions;
- The type of evaluation performed was based on performance;
- The evaluation criteria helped improve the comfort of dwellings.
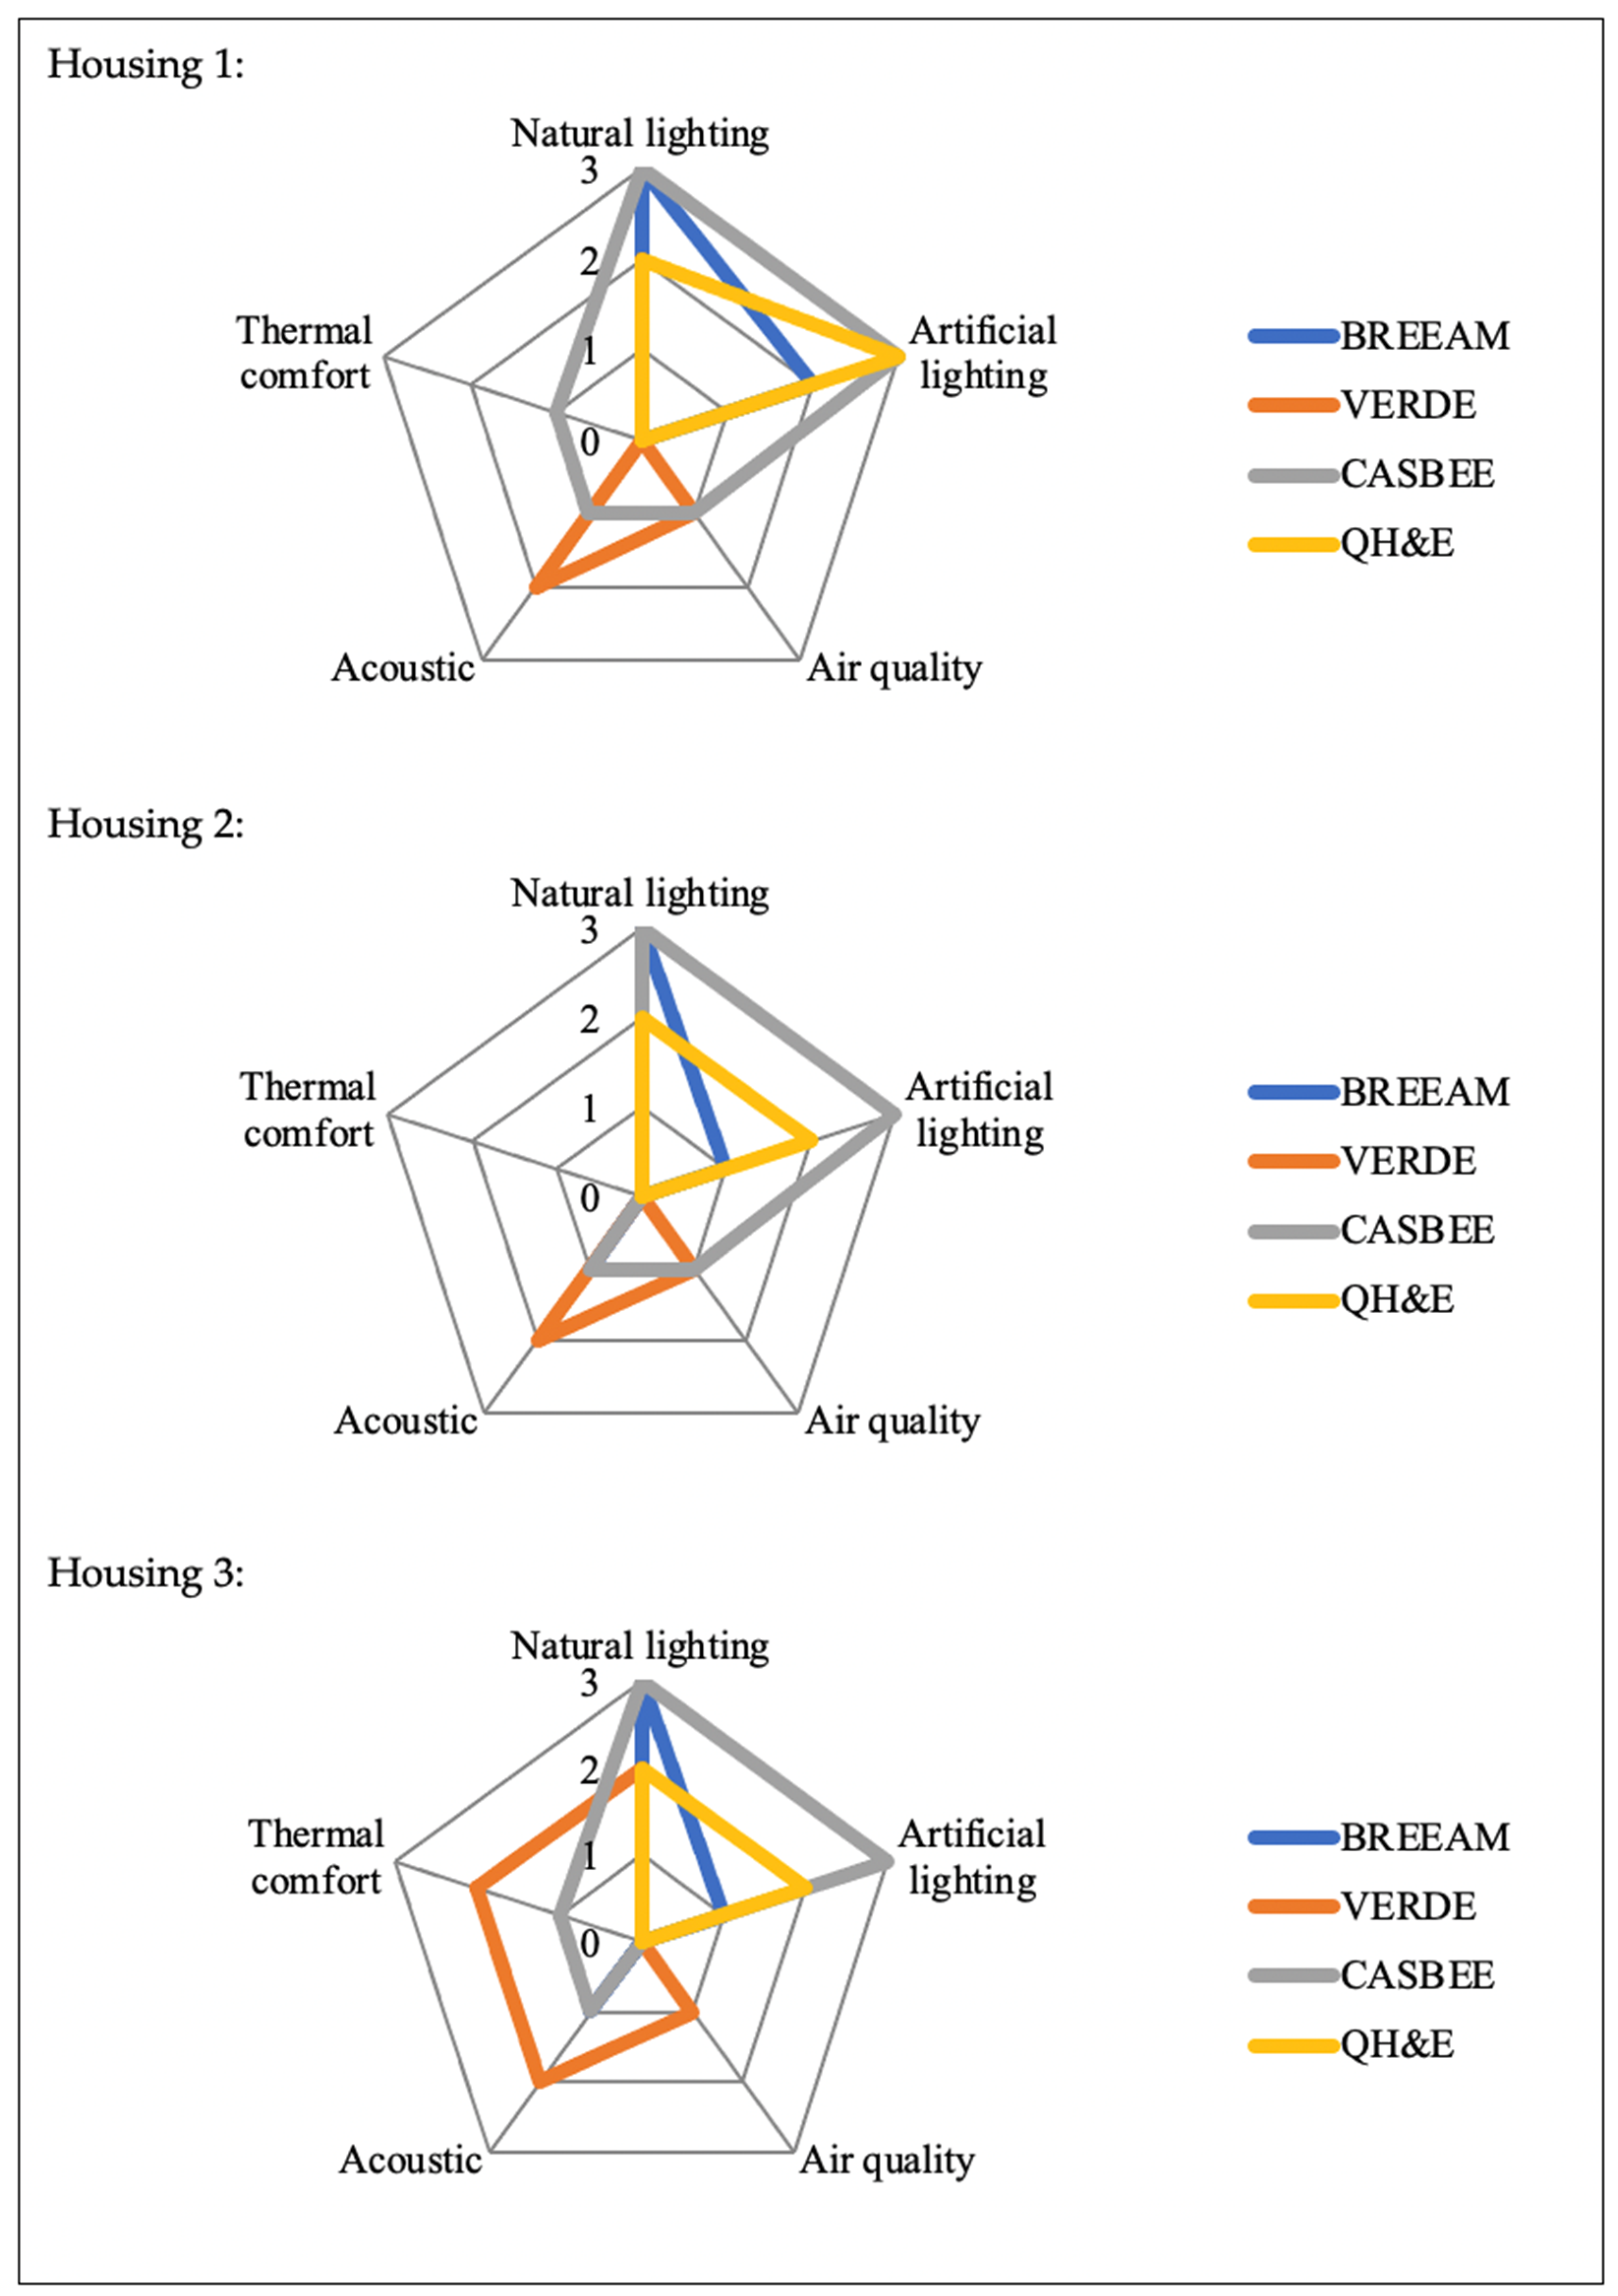
4.2. Housing Assessment Results
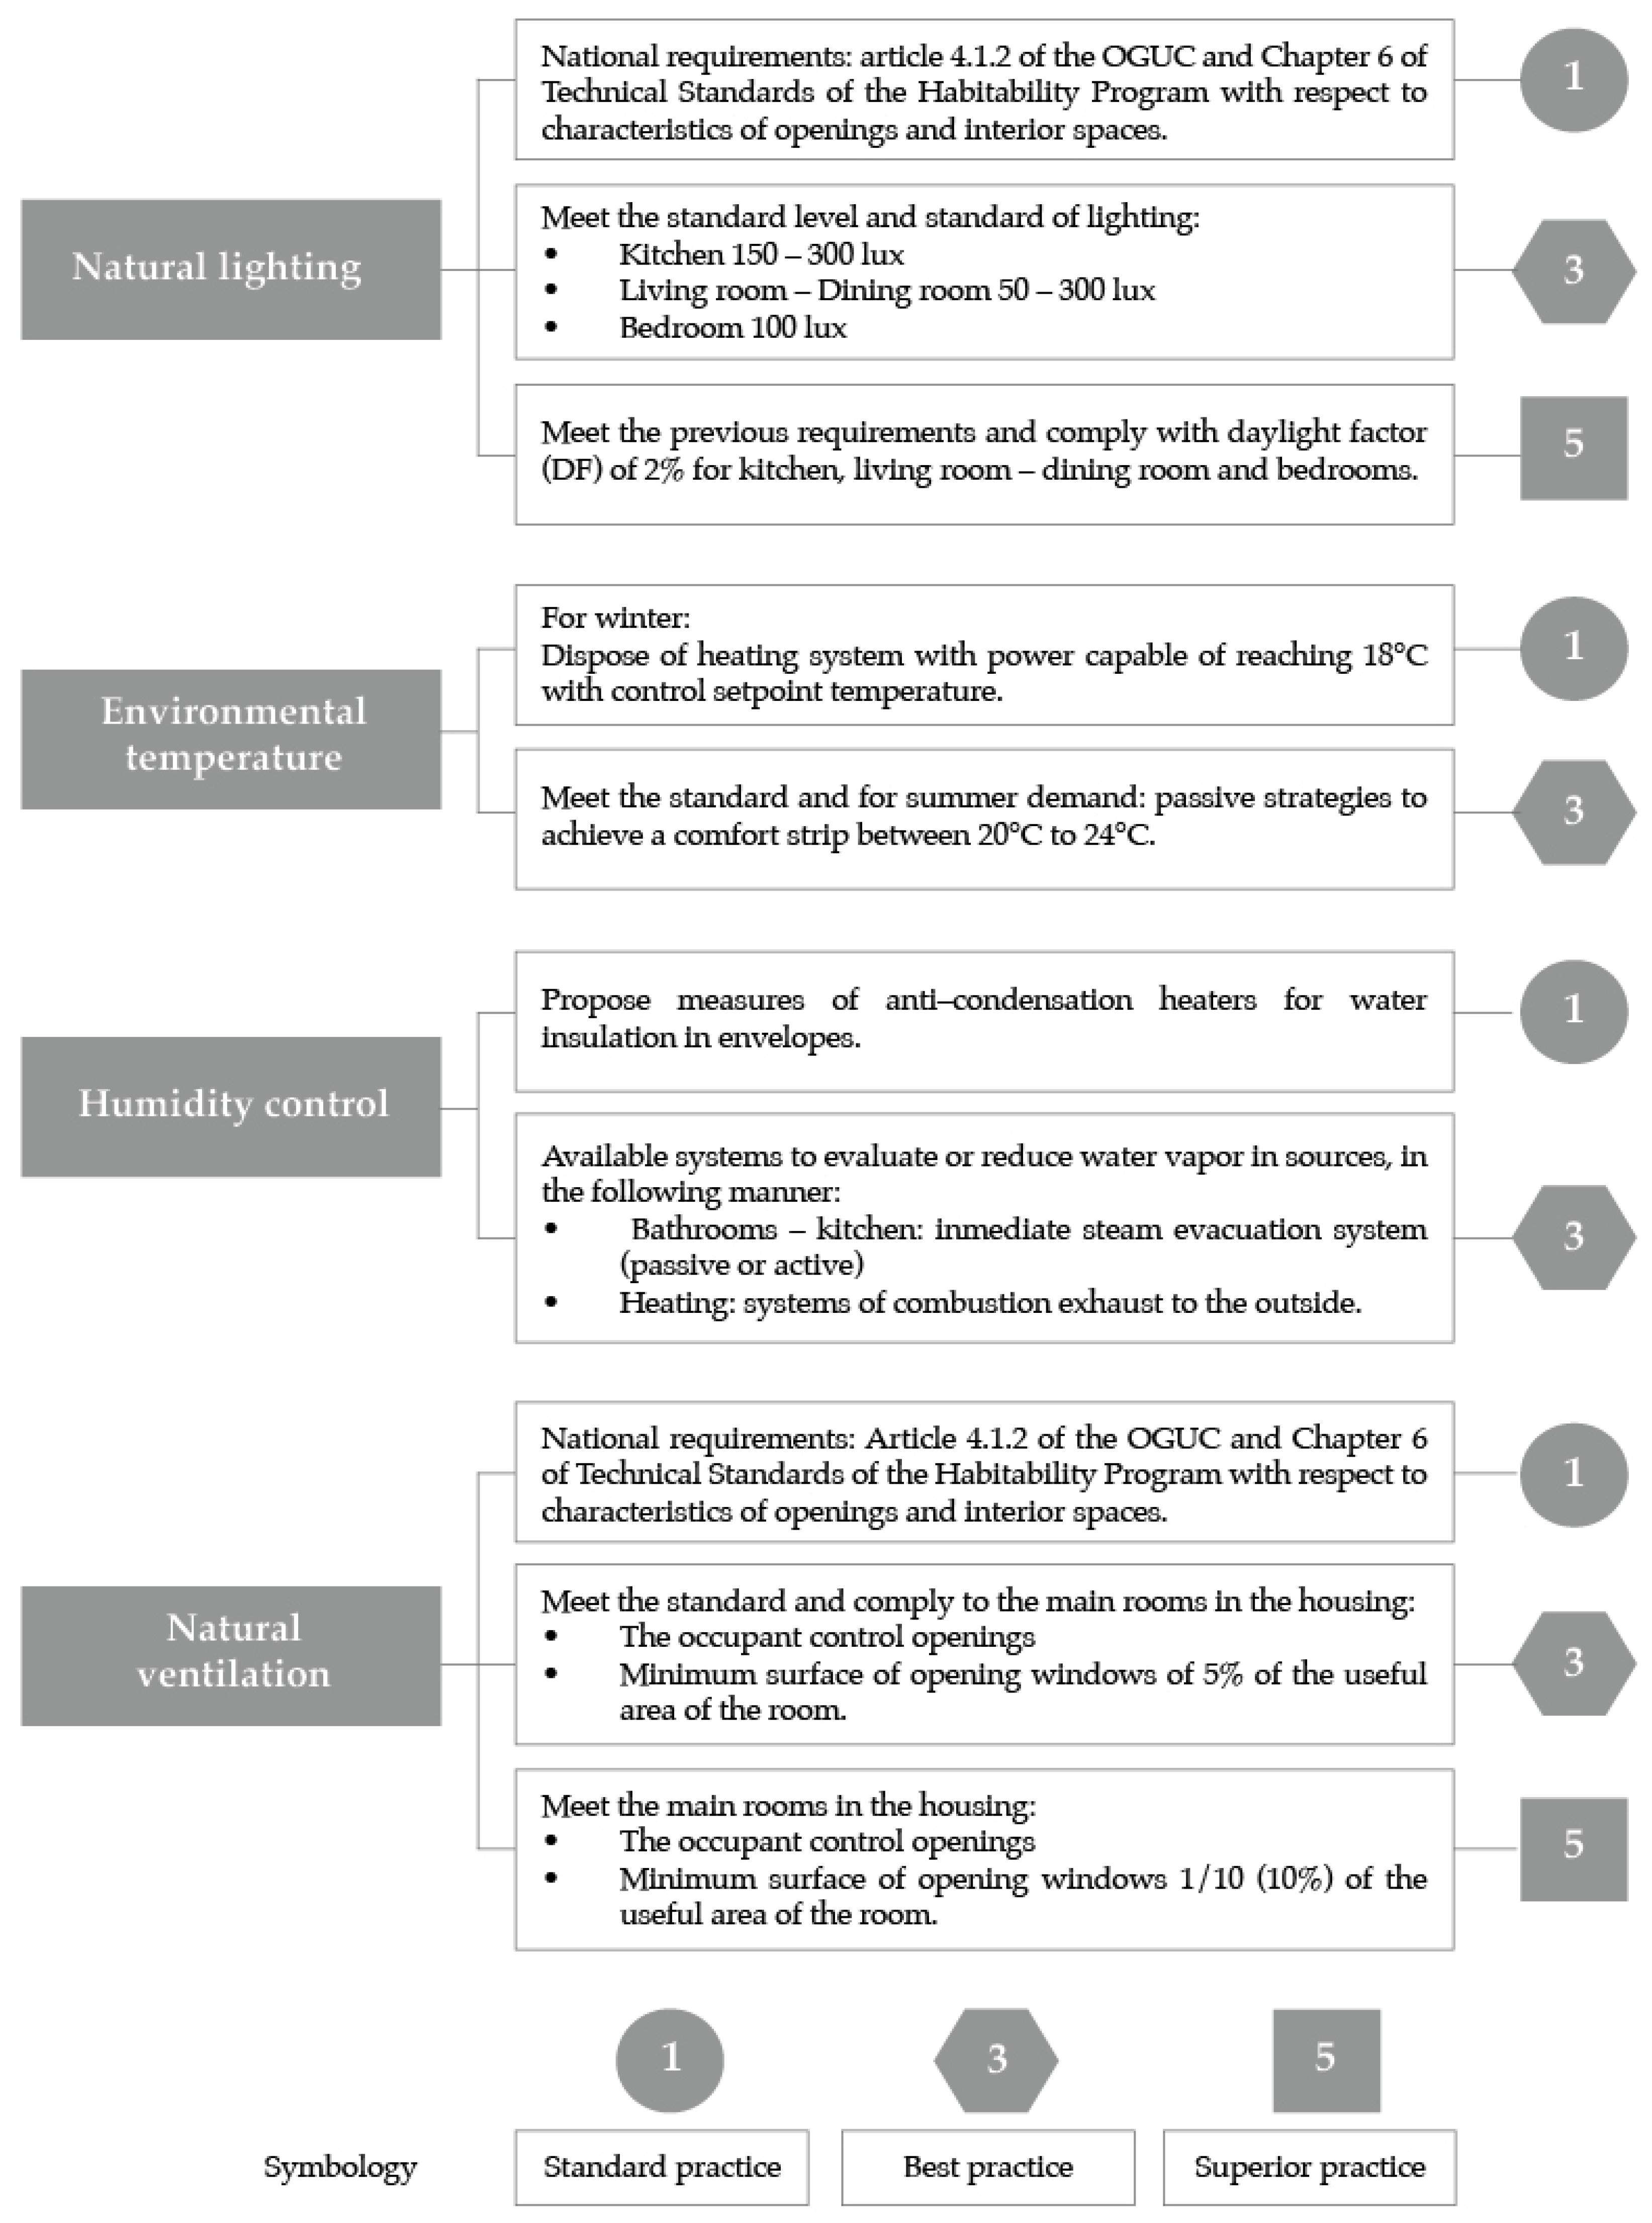
4.2.1. Natural Lighting
4.2.2. Artificial Lighting
4.2.3. Environmental Temperature
4.2.4. Humidity Control
4.2.5. Air Quality
4.2.6. Acoustics
- Standard practices: 1 point;
- Best practices: 3 points;
- Superior practices: 5 points.
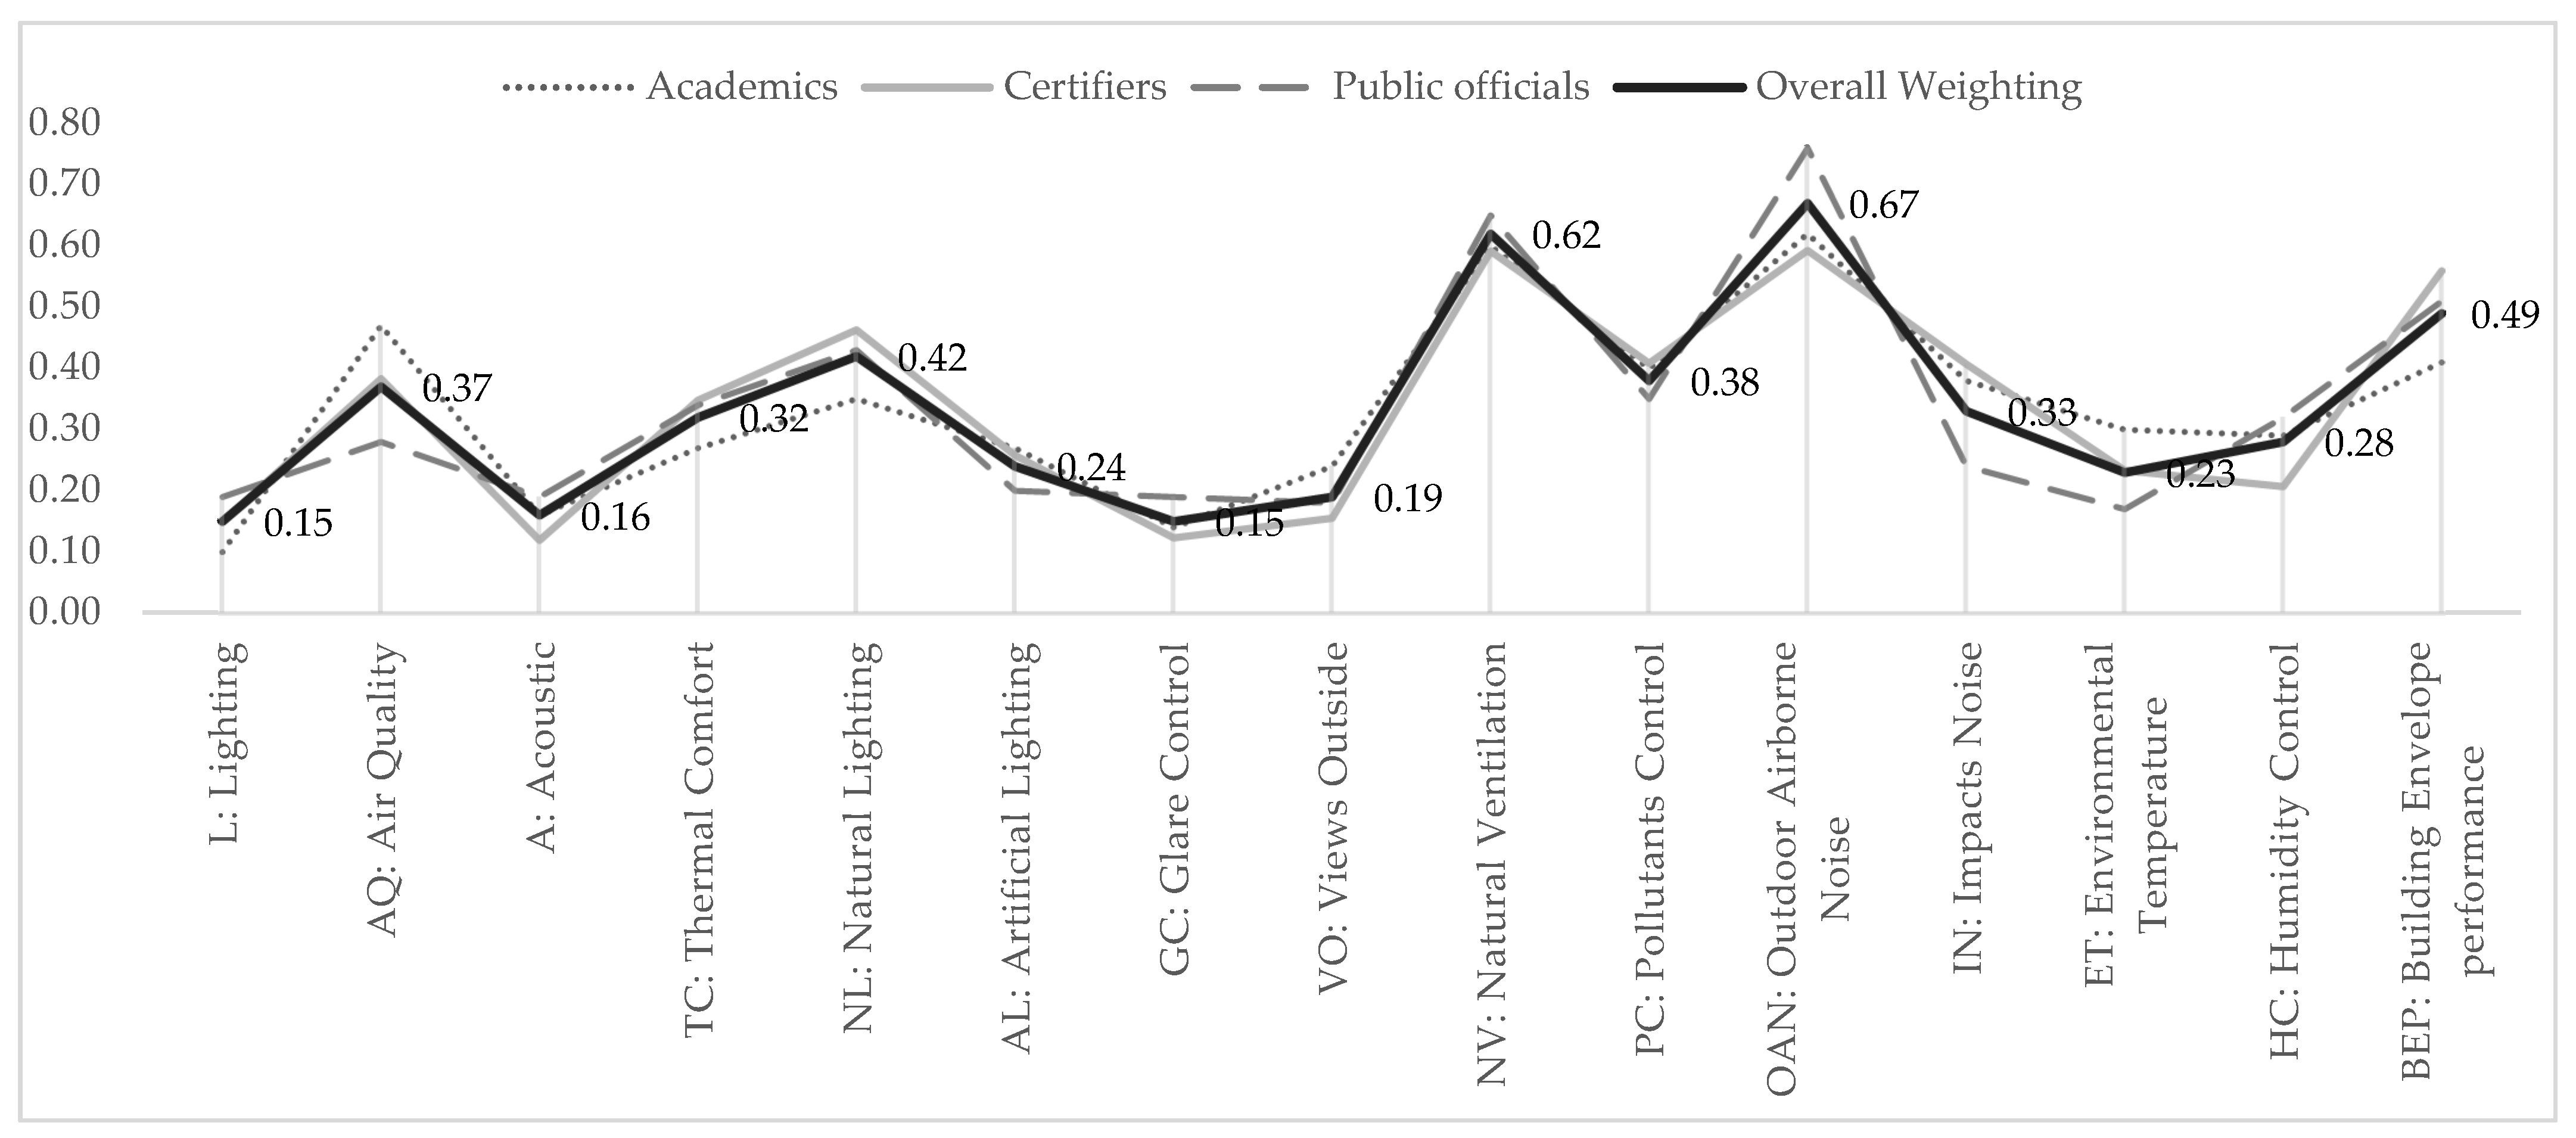
4.3. Definition of Regional Priorities
4.4. Proposed Assessment Model
- Standard practice: 100 points;
- Best practices: 240 points;
- Superior practices: 330 points.
5. Conclusions
- Identify evaluation criteria within an international framework;
- Select and contextualize evaluation criteria through field assessments;
- Define regional priorities with the participation of experts.
Author Contributions
Funding
Institutional Review Board Statement
Informed Consent Statement
Data Availability Statement
Acknowledgments
Conflicts of Interest
References
- Geissdoerfer, M.; Savaget, P.; Bocken, N.M.P.; Hultink, E.J. The Circular Economy–A new sustainability paradigm? J. Clean. Prod. 2017, 143, 757–768. [Google Scholar] [CrossRef] [Green Version]
- Kibert, C.J. Establishing Principles and a Model for Sustainable Construction. In Proceedings of the First International Conference on Sustainable Construction, Tampa, FL, USA, 6–9 November 1994. [Google Scholar]
- Hossaini, N.; Hewage, K.; Sadiq, R. Spatial life cycle sustainability assessment: A conceptual framework for net-zero buildings. Clean Technol. Environ. Policy 2015, 17, 2243–2253. [Google Scholar] [CrossRef]
- Assefa, S.; Lee, H.-Y.; Shiue, F.-J. A building sustainability assessment system (BSAS) for least developed countries: A case of Ethiopia. Sustain. Cities Soc. 2022, 87, 104238. [Google Scholar] [CrossRef]
- WGBC. Home-World Green Building Council. Available online: https://worldgbc.org/ (accessed on 12 October 2022).
- Thatcher, A.; Milner, K. Is a green building really better for building occupants? A longitudinal evaluation. Build. Environ. 2016, 108, 194–206. [Google Scholar] [CrossRef]
- Wong, J.K.W.; Zhou, J. Enhancing environmental sustainability over building life cycles through green BIM: A review. Autom. Constr. 2015, 57, 156–165. [Google Scholar] [CrossRef]
- Alyami, S.H.; Rezgui, Y. Sustainable building assessment tool development approach. Sustain. Cities Soc. 2012, 5, 52–62. [Google Scholar] [CrossRef]
- Lee, W.L. A comprehensive review of metrics of building environmental assessment schemes. Energy Build. 2013, 62, 403–413. [Google Scholar] [CrossRef]
- Doan, D.T.; Ghaffarianhoseini, A.; Naismith, N.; Zhang, T.; Ghaffarianhoseini, A.; Tookey, J. A critical comparison of green building rating systems. Build. Environ. 2017, 123, 243–260. [Google Scholar] [CrossRef]
- Mendell, M.J.; Fisk, W.J.; Kreiss, K.; Levin, H.; Alexander, D.; Cain, W.S.; Girman, J.R.; Hines, C.J.; Jensen, P.A.; Milton, D.K.; et al. Improving the health of workers in indoor environments: Priority research needs for a National Occupational Research Agenda. Am. J. Public Health 2002, 92, 1430–1440. [Google Scholar] [CrossRef]
- Weschler, C.J. Changes in indoor pollutants since the 1950s. Atmos. Environ. 2009, 43, 153–169. [Google Scholar] [CrossRef]
- ASHRAE. Interactions Affecting the Achievement of Acceptable Indoor Environments; ASHRAE Guideline; ASHRAE: New York, NY, USA, 2016. [Google Scholar]
- Agarwal, N.; Meena, C.S.; Raj, B.P.; Saini, L.; Kumar, A.; Gopalakrishnan, N.; Kumar, A.; Balam, N.B.; Alam, T.; Kapoor, N.R.; et al. Indoor air quality improvement in COVID-19 pandemic: Review. Sustain. Cities Soc. 2021, 70, 102942. [Google Scholar] [CrossRef] [PubMed]
- Patial, S.; Nazim, M.; Khan, A.A.P.; Raizada, P.; Singh, P.; Hussain, C.M.; Asiri, A.M. Sustainable solutions for indoor pollution abatement during COVID phase: A critical study on current technologies & challenges. J. Hazard. Mater. Adv. 2022, 7, 100097. [Google Scholar] [CrossRef]
- Gibson, J.M.; Brammer, A.S.; Davidson, C.A.; Folley, T.; Launay, F.J.P.; Thomsen, J.T.W. Burden of Disease from Indoor Air Pollution. In Environmental Burden of Disease Assessment; MacDonald Gibson, J., Brammer, A., Davidson, C., Folley, T., Launay, F., Thomsen, J., Eds.; Springer: Dordrecht, The Netherlands, 2013; pp. 109–132. [Google Scholar] [CrossRef]
- Diaz Lozano Patino, E.; Siegel, J.A. Indoor environmental quality in social housing: A literature review. Build. Environ. 2018, 131, 231–241. [Google Scholar] [CrossRef]
- INE. Instituto Nacional de Estadística. Available online: https://www.ine.gob.cl/ (accessed on 11 January 2013).
- MINVU. Estudio de Patologías en la Edificación de Viviendas Básicas 1996–1997. In II Tecnología de la Construcción; Ministerio de Vivienda y Urbanismo: Santiago de Chile, Chile, 2004. [Google Scholar]
- Al-Rawi, M.; Ikutegbe, C.A.; Auckaili, A.; Farid, M.M. Sustainable technologies to improve indoor air quality in a residential house–A case study in Waikato, New Zealand. Energy Build. 2021, 250, 111283. [Google Scholar] [CrossRef]
- d’Ambrosio Alfano, F.R.; Olesen, B.W.; Palella, B.I.; Riccio, G. Thermal comfort: Design and assessment for energy saving. Energy Build. 2014, 81, 326–336. [Google Scholar] [CrossRef]
- Ismaeel, W.S.E.; Mohamed, A.G. Indoor air quality for sustainable building renovation: A decision-support assessment system using structural equation modelling. Build. Environ. 2022, 214, 108933. [Google Scholar] [CrossRef]
- Lai, J.H.K.; Yik, F.W.H. Perception of importance and performance of the indoor environmental quality of high-rise residential buildings. Build. Environ. 2009, 44, 352–360. [Google Scholar] [CrossRef]
- Wong, L.T.; Mui, K.W.; Tsang, T.W. An open acceptance model for indoor environmental quality (IEQ). Build. Environ. 2018, 142, 371–378. [Google Scholar] [CrossRef]
- Steinemann, A.; Wargocki, P.; Rismanchi, B. Ten questions concerning green buildings and indoor air quality. Build. Environ. 2017, 112, 351–358. [Google Scholar] [CrossRef]
- Rohde, L.; Steen Larsen, T.; Jensen, R.L.; Larsen, O.K.; Jønsson, K.T.; Loukou, E. Determining indoor environmental criteria weights through expert panels and surveys. Build. Res. Inf. 2020, 48, 415–428. [Google Scholar] [CrossRef]
- Ncube, M.; Riffat, S. Developing an indoor environment quality tool for assessment of mechanically ventilated office buildings in the UK–A preliminary study. Build. Environ. 2012, 53, 26–33. [Google Scholar] [CrossRef] [Green Version]
- Mujan, I.; Licina, D.; Kljajić, M.; Čulić, A.; Anđelković, A.S. Development of indoor environmental quality index using a low-cost monitoring platform. J. Clean. Prod. 2021, 312, 127846. [Google Scholar] [CrossRef]
- Wei, W.; Wargocki, P.; Zirngibl, J.; Bendžalová, J.; Mandin, C. Review of parameters used to assess the quality of the indoor environment in Green Building certification schemes for offices and hotels. Energy Build. 2020, 209, 109683. [Google Scholar] [CrossRef]
- Al-Jebouri, M.F.A.; Saleh, M.S.; Raman, S.N.; Rahmat, R.A.A.B.O.K.; Shaaban, A.K. Toward a national sustainable building assessment system in Oman: Assessment categories and their performance indicators. Sustain. Cities Soc. 2017, 31, 122–135. [Google Scholar] [CrossRef]
- Ali, H.H.; Al Nsairat, S.F. Developing a green building assessment tool for developing countries–Case of Jordan. Build. Environ. 2009, 44, 1053–1064. [Google Scholar] [CrossRef]
- Castro, M.d.F.; Mateus, R.; Bragança, L. Development of a healthcare building sustainability assessment method–Proposed structure and system of weights for the Portuguese context. J. Clean. Prod. 2017, 148, 555–570. [Google Scholar] [CrossRef] [Green Version]
- Sharifi, A.; Dawodu, A.; Cheshmehzangi, A. Neighborhood sustainability assessment tools: A review of success factors. J. Clean. Prod. 2021, 293, 125912. [Google Scholar] [CrossRef]
- BRE. BREEAM Multi-Residential 2008; BRE Global Limited: Watford, UK, 2012. [Google Scholar]
- USGBC. LEED for Homes: Rating System; U.S. Creen Building Council: Washington, DC, USA, 2008. [Google Scholar]
- GBCe. VERDE NE Residencial y Oficinas: Guía para los Evaluadores Acreditados; GBC España: Madrid, Spain, 2012. [Google Scholar]
- JSBC. CASBEE for New Construcction. Technical Manual, 1st ed.; JSBC: Tokyo, Japan, 2011. [Google Scholar]
- CERQUAL. Qualitel, Habitat & Environnement: Certifications Habitat Neuf; CERQUAL: Paris, France, 2012. [Google Scholar]
- Campos, J. Determinación de Línea Base “Anual” Para la Evaluación de la Inversión en Eficiencia Energética en el Sector Residencial: Invierno 2007–Verano 2008; Instituto de la Construcción: Mayo, Ireland, 2008. [Google Scholar]
- Laverge, J.; Van Den Bossche, N.; Heijmans, N.; Janssens, A. Energy saving potential and repercussions on indoor air quality of demand controlled residential ventilation strategies. Build. Environ. 2011, 46, 1497–1503. [Google Scholar] [CrossRef] [Green Version]
- Dili, A.S.; Naseer, M.A.; Varghese, T.Z. Passive environment control system of Kerala vernacular residential architecture for a comfortable indoor environment: A qualitative and quantitative analyses. Energy Build. 2010, 42, 917–927. [Google Scholar] [CrossRef]
- Taleb, H.M.; Sharples, S. Developing sustainable residential buildings in Saudi Arabia: A case study. Appl. Energy 2011, 88, 383–391. [Google Scholar] [CrossRef]
- Kazanci, O.A.O.B. Beyond nearly-zero energy buildings: Experimental investigation of the thermal indoor environment and energy performance of a single-family house designed for plus-energy tragets. Sci. Technol. Built Environ. 2016, 22, 1024–1038. [Google Scholar] [CrossRef] [Green Version]
- Brunsgaard, C.; Heiselberg, P.; Knudstrup, M.-A.; Larsen, T.S. Evaluation of the Indoor Environment of Comfort Houses: Qualitative and Quantitative Approaches. Indoor Built Environ. 2012, 1, 1–20. [Google Scholar] [CrossRef]
- Mateus, R.; Bragança, L. Sustainability assessment and rating of buildings: Developing the methodology SBToolPT–H. Build. Environ. 2011, 46, 1962–1971. [Google Scholar] [CrossRef]
- Saaty, T. The Analytic Hierarchy Process; McGraw-Hill: New York, NY, USA, 1980. [Google Scholar]
- Yu, W.; Li, B.; Yang, X.; Wang, Q. A development of a rating method and weighting system for green store buildings in China. Renew. Energy 2015, 73, 123–129. [Google Scholar] [CrossRef]
- Bustamante, W.; Rozas, Y. Guía de Diseño Para la Eficiencia Energética en la Vivienda Social; Minvu, C.N.E., Ed.; MINVU: Santiago de Chile, Chile, 2009. [Google Scholar]
- MINVU. Ordenanza General de Urbanismo y Construcción; MINVU: Santiago de Chile, Chile, 1992. [Google Scholar]
- Quesada, F. Métodos de evaluación sostenible de la vivienda: Análisis comparativo de cinco métodos internacionales. Rev. Hábitat Sustentable 2014, 4, 56–67. [Google Scholar]
- BRE. Código de Construcción Sustentable para Viviendas, Chile; BRE: Santiago de Chile, Chile, 2013. [Google Scholar]


| BREEAM Multi-Residential | LEED-H | VERDE NB (Residential and Commercial) | CASBEE (New Construction) | Qualitel |
|---|---|---|---|---|
| Natural lighting | Combustion ventilation | Toxicity in interior finishing | Sound environment | Outdoor acoustics |
| Views outside | Moisture control | Implementation of a process of purging | Thermal comfort | Interior acoustics |
| Glare control | Ventilation | The efficiency of natural ventilation | Lamps and lighting | Visual comfort |
| High-frequency lighting | Local extraction | Thermal comfort with natural ventilation | Air quality | Spaces and common premises |
| Internal and external lighting levels | Distribution of heating and cooling | Natural lighting | Service capacity | Indoor air quality |
| Natural ventilation potential | Air filtration | Protection against outside noise enclosures | Durability and reliability | The temperature in summer |
| Indoor air quality | Control of contaminants | Protection against the noise of facilities | Flexibility and adaptation | Accessibility and livability |
| Volatile organic compounds (VOCs) | Radon protection | Protection against noise from other rooms | Optional performance | |
| Thermal comfort | Garage pollutant protection | The efficiency of the spaces | ||
| Thermal zoning | Maintenance management plan | |||
| Microbial contamination prevention | Universal accessibility | |||
| Accessibility | Right to sunlight | |||
| Home office | Access to private open spaces | |||
| Acoustic isolation | Protection of views inside housing |
| BREEAM | VERDE | CASBEE | QH&E |
|---|---|---|---|
| Method of Evaluation | |||
| Check for the living room and master bedroom:
|
|
|
| Indicators | |||
|
|
|
|
| Requirement Level | |||
| 1: Kitchen ≥ 2.4% 2: Living rooms, dining rooms, and studies ≥ 2.4% 3: At least 80% of work surface of the kitchen, living room, dining room and study room to receive direct sunlight | 1: Meet in the living room 2: Meet in the bedroom ≥50° P ≤ 4.5 m ≥20% ≥0.5 ≥0.7 | 1: (factor) < 0.5% 2: 0.5% ≤ (factor) < 1.0% 3: 1.0% ≤ (factor) < 1.5% 4: 1.5% ≤ (factor) < 2.0% 5: 2.0% ≤ (factor) | 1: Minimum openings:
|
| Housing 1 | Housing 2 | Housing 3 | |
|---|---|---|---|
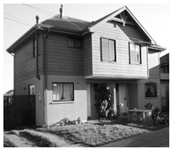 | 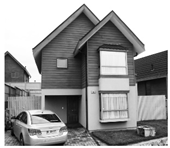 | 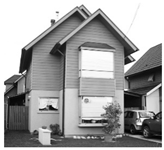 | |
| Location | Portal de San Pedro/Pasaje Lago Tintilco 293 | San Pedro de la Paz/Camino Club Militar 110 | Concepción/Tierras Coloradas 222 |
| Area | 65.15 m2 | 88 m2 | 109.38 m2 |
| Winter monitoring | 26 September–3 October 2013 | 11–18 July 2012 | 9–16 September 2013 |
| Summer monitoring | 21–28 January 2013 | 3–23 September 2012 | 14–21 January 2013 |
| Materiality | Concrete/Wood | Concrete/Wood/SIP Panel | Concrete/Wood |
| Evaluation Criteria | Selection Trials | |||||
|---|---|---|---|---|---|---|
| 1 | 2 | 3 | 4 | 5 | 6 | |
| 1. Lighting | ||||||
| BREEAM | ||||||
| Natural lighting | ■ | ■ | ■ | ■ | ■ | ■ |
| Lighting levels | ■ | ■ | ■ | ■ | ■ | |
| Glare control | ■ | ■ | ■ | ■ | ||
| Views outside | ■ | ■ | ■ | ■ | ||
| VERDE | ||||||
| Daylighting in primary occupation spaces | ■ | ■ | ■ | |||
| CASBEE | ||||||
| Natural light | ■ | ■ | ■ | ■ | ■ | ■ |
| Lighting levels | ■ | ■ | ■ | ■ | ■ | |
| Daylight control | ■ | ■ | ■ | ■ | ||
| QH&E | ||||||
| Natural lighting and visual relationship with the external environment | ■ | ■ | ■ | ■ | ■ | ■ |
| Artificial lighting | ■ | ■ | ■ | ■ | ||
| 2. Indoor air quality | ||||||
| BREEAM | ||||||
| Indoor air quality | ■ | ■ | ■ | ■ | ||
| VERDE | ||||||
| In spaces with natural ventilation efficiency | ■ | ■ | ■ | ■ | ■ | |
| Toxicity in the interior finishing materials | ■ | ■ | ■ | ■ | ||
| CASBEE | ||||||
| Natural ventilation performance | ■ | ■ | ■ | ■ | ■ | |
| 3. Acoustic | ||||||
| BREEAM | ||||||
| Acoustic isolation | ■ | ■ | ■ | ■ | ■ | ■ |
| VERDE | ||||||
| Protection of enclosures protected against noise | ■ | ■ | ■ | ■ | ■ | ■ |
| CASBEE | ||||||
| Background noise levels | ■ | ■ | ■ | ■ | ■ | ■ |
| 4. Thermal comfort | ||||||
| LEED | ||||||
| Distribution of heating and cooling in spaces | ■ | |||||
| Humidity control | ■ | ■ | ■ | ■ | ||
| BREEAM | ||||||
| Thermal comfort | ■ | ■ | ■ | ■ | ■ | ■ |
| VERDE | ||||||
| Thermal comfort in spaces with natural ventilation | ■ | ■ | ■ | ■ | ■ | |
| CASBEE | ||||||
| Environmental temperature | ■ | ■ | ■ | ■ | ■ | ■ |
| Humidity control | ■ | ■ | ■ | ■ | ■ | ■ |
| Perimeter performance | ■ | ■ | ■ | ■ | ■ | ■ |
| Scale DF | Living Room—Dining Room | Kitchen | Second Bedroom | Master Bedroom |
|---|---|---|---|---|
Housing 1 |  |  | 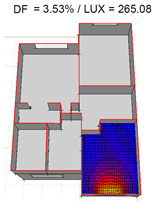 | 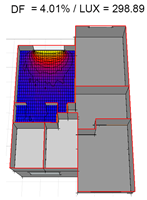 |
Housing 2 |  | 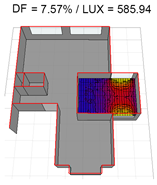 | 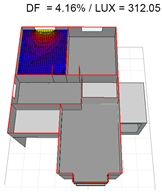 | 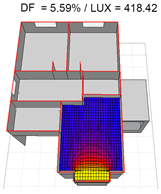 |
Housing 3 |  |  | 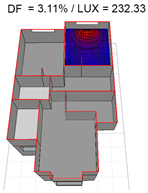 |  |
| Winter | Summer | International Systems | National Regulations | |||||
|---|---|---|---|---|---|---|---|---|
| Winter Range 18–24 °C (% hours) | Summer Range 23–28 °C (% hours) | Winter Range 18–20 °C (% hours) | ||||||
| Average (°C) | Outside | Inside | Outside | Inside | Outside | Inside | ||
| Housing 1: | ||||||||
| Living room (°C) | 20.5 | 20.3 | 0.0 | 100.0 | 95.9 | 4.1 | 75.0 | 25.0 |
| Master bedroom (°C) | 20.1 | 21.1 | 0.0 | 100.0 | 88.3 | 11.7 | 48.0 | 52.0 |
| Second bedroom (°C) | 20.4 | 21.0 | 0.0 | 100.0 | 92.4 | 7.6 | 62.0 | 38.0 |
| Kitchen (°C) | 19.0 | 20.9 | 30.0 | 70.0 | 91.9 | 8.1 | 67.0 | 33.0 |
| Outside temperature (°C) | 11.3 | 18.3 | ||||||
| Housing 2: | ||||||||
| Living room (°C) | 16.4 | 17.6 | 100.0 | 0.0 | 99.6 | 0.4 | 100.0 | 0.0 |
| Master bedroom (°C) | 16.7 | 20.7 | 71.9 | 28.1 | 95.2 | 4.8 | 75.4 | 24.6 |
| Second bedroom (°C) | 15.9 | 18.5 | 92.8 | 7.2 | 99.6 | 0.4 | 92.8 | 7.2 |
| Kitchen (°C) | 16.6 | 19.2 | 79.6 | 20.4 | 99.7 | 0.3 | 79.6 | 20.4 |
| Outside temperature (°C) | 10.9 | 13.2 | ||||||
| Housing 3: | ||||||||
| Living room (°C) | 18.8 | 21.2 | 36.9 | 63.1 | 71.6 | 28.4 | 53.0 | 47.0 |
| Master bedroom (°C) | 18.4 | 21.9 | 43.5 | 56.5 | 73.2 | 26.8 | 70.2 | 29.8 |
| Second bedroom (°C) | 20.0 | 21.6 | 9.5 | 90.5 | 70.7 | 29.3 | 58.9 | 41.1 |
| Kitchen (°C) | 18.6 | 21.5 | 46.4 | 53.6 | 100.0 | 0.0 | 59.5 | 40.5 |
| Outside temperature (°C) | 10.0 | 19.2 | ||||||
| Exterior (%) | Living Room (%) | Master Bedroom (%) | Kitchen (%) | |
|---|---|---|---|---|
| Winter | ||||
| Housing 1 | 65.63 | 45.35 | 49.92 | 48.12 |
| Housing 2 | 87.13 | 81.10 | 72.06 | 71.00 |
| Housing 3 | 77.19 | 59.96 | 66.21 | 58.56 |
| Summer | ||||
| Housing 1 | 70.59 | 65.56 | 59.15 | 62.28 |
| Housing 2 | 71.01 | 62.44 | 57.36 | 58.77 |
| Housing 3 | 64.64 | 59.03 | 59.64 | 59.49 |
| Category | Weighting | Evaluation Criteria | Weighting |
|---|---|---|---|
| L: Lighting | 15% | NL: Natural Lighting | 0.42 |
| AL: Artificial Lighting | 0.24 | ||
| GC: Glare Control | 0.15 | ||
| VO: Views Outside | 0.19 | ||
| AQ: Air Quality | 37% | NV: Natural Ventilation | 0.62 |
| PC: Pollutants Control | 0.38 | ||
| A: Acoustic | 16% | OAN: Outdoor Airborne Noise | 0.67 |
| IN: Impact Noise | 0.33 | ||
| TC: Thermal Comfort | 32% | ET: Environmental Temperature | 0.23 |
| HC: Humidity Control | 0.28 | ||
| BEP: Building Envelope Performance | 0.49 |
| Housing 1 | Housing 2 | Housing 3 | |||
|---|---|---|---|---|---|
| Air Quality | NV | Points | 3 | 3 | 3 |
| Weighting | 0.62 | ||||
| PC | Points | 1 | 1 | 1 | |
| Weighting | 0.38 | ||||
| Weight Category | 37 | ||||
| The Category Qualification | 82.88 | 82.88 | 82.88 | ||
| Thermal Comfort | ET | Points | 3 | 0 | 3 |
| Weighting | 0.23 | ||||
| HC | Points | 3 | 3 | 3 | |
| Weighting | 0.28 | ||||
| BEP | Points | 0 | 0 | 0 | |
| Weighting | 0.49 | ||||
| Weight Category | 32 | ||||
| The Category Qualification | 48.96 | 26.88 | 48.96 | ||
| Acoustic | OAN | Points | 1 | 1 | 1 |
| Weighting | 0.67 | ||||
| IN | Points | 3 | 3 | 3 | |
| Weighting | 0.33 | ||||
| Weight Category | 16 | ||||
| The Category Qualification | 26.56 | 26.56 | 26.56 | ||
| Lighting | NL | Points | 5 | 5 | 5 |
| Weighting | 0.42 | ||||
| AL | Points | 1 | 1 | 1 | |
| Weighting | 0.24 | ||||
| GC | Points | 1 | 1 | 1 | |
| Weighting | 0.15 | ||||
| VO | Points | 1 | 1 | 1 | |
| Weighting | 0.19 | ||||
| Weight Category | 15 | ||||
| The Category Qualification | 40.20 | 40.2 | 40.2 | ||
| QUALIFICATION IEQ | 198.60 | 176.52 | 198.60 | ||
Disclaimer/Publisher’s Note: The statements, opinions and data contained in all publications are solely those of the individual author(s) and contributor(s) and not of MDPI and/or the editor(s). MDPI and/or the editor(s) disclaim responsibility for any injury to people or property resulting from any ideas, methods, instructions or products referred to in the content. |
© 2023 by the authors. Licensee MDPI, Basel, Switzerland. This article is an open access article distributed under the terms and conditions of the Creative Commons Attribution (CC BY) license (https://creativecommons.org/licenses/by/4.0/).
Share and Cite
Quesada-Molina, F.; Astudillo-Cordero, S. Indoor Environmental Quality Assessment Model (IEQ) for Houses. Sustainability 2023, 15, 1276. https://doi.org/10.3390/su15021276
Quesada-Molina F, Astudillo-Cordero S. Indoor Environmental Quality Assessment Model (IEQ) for Houses. Sustainability. 2023; 15(2):1276. https://doi.org/10.3390/su15021276
Chicago/Turabian StyleQuesada-Molina, Felipe, and Sebastián Astudillo-Cordero. 2023. "Indoor Environmental Quality Assessment Model (IEQ) for Houses" Sustainability 15, no. 2: 1276. https://doi.org/10.3390/su15021276
APA StyleQuesada-Molina, F., & Astudillo-Cordero, S. (2023). Indoor Environmental Quality Assessment Model (IEQ) for Houses. Sustainability, 15(2), 1276. https://doi.org/10.3390/su15021276