Abstract
The evolution of water and land resource carrying capacity significantly impacts optimal water and land resource allocation and regional sustainable development in arid regions. This study proposes a model that combines cellular automaton (CA) and Markov; this model aids in predicting spatial changes in water and land resource availability. In this study, taking the Jingdian Irrigation District in China’s northwest arid region as an example, we used long-series monitoring data and a Landsat dataset to create a raster-weighted fusion of 18 indicators and quantitatively analyzed the carrying status of water and land resources from 1994 to 2018. The CA–Markov model was used to simulate the carrying status of water and land resources in 2018 and to perform accuracy correction. The validated CA–Markov model was used to predict water and land resource carrying status in 2026 and 2034. The results show (1) from 1994 to 2018, the area of “good carrying” zone increased by 10.42%, the area of “safe carrying” zone increased by 7%, and spatially rose in an arc from the town to the surrounding regions. The area of “critical carrying” zone remains almost unchanged. The area of “slight carrying” zone decreased by 5.18% and the area of “severe carrying” zone decreased by 11.99%. (2) Comparing the actual and predicted carrying state of water and land resources in 2018, it was found that the simulation accuracy of “good carrying”, “safe carrying”, “critical carrying”, “slight carrying”, and “severe carrying” reached 98.71%, 92.07%, 95.34%, 94.05%, and 93.73%, respectively. This indicates that the simulation results have high reliability and applicability. (3) The future medium and long-term carrying status of water and land resources are healthy, but this trend is gradually slowing. The “slight carrying” and “severe carrying” zones show the gradual spatial transition from land desertification to soil salinization.
1. Introduction
Water and land resources are natural resource combinations, and their coupling analysis can objectively reflect a region’s carrying status. In the context of global climate change and the demand for high-intensity human activities, the establishment of an artificial oasis through pumping stations for water-lifting and irrigation has become a practical method of developing land resources in northwest China’s arid desert region. Water-lifting irrigation projects inject water into the arid desert area. This exchange process between external water resources and land resources is accompanied by water and heat transfer, eco-hydrological process evolution, and land use evolution. Artificial oases have a long-term and complex influence on the regional water and land resource background, making their evolution process and carrying capacity a complex system [1,2,3]. As a result, it is crucial to conduct simulation and prediction research on the evolution of water and land resource carrying capacity of artificial oases in arid areas. This research has a significant guiding value and scientific significance for optimal water and land resource allocation in irrigation areas.
The core problem of water and land resource research is the spatial and temporal evolution process and prediction of water and land resource carrying capacity under multiple drivers. The exploration of the evolution process and future evolution trend of water and land resource carrying capacity under a regional scale is the hot spot and complex point of current research in the water and land environment [4,5]. Michiel predicted the supply–demand relationship between water resources carrying capacity and agricultural crop production from agricultural water resources development [6]. Yang et al. used system dynamics analysis to predict Tieling City’s water resources carrying capacity under various water supply scenarios [7]. Falkemark et al. investigated the relationship between water resources and socioeconomic issues, and the response mechanism between sustainable socioeconomic development and water resources carrying capacity [8]. Joardar analyzed the impact of changing water resources carrying capacity in urban development from the standpoints of water availability, water resources supply, and demand balance mechanism [9]. Yao et al. elaborated on the concept and connotation of water resources carrying capacity based on a systematic overview of water resources carrying capacity at the regional scale [10]. Jiang et al. used the projection tracing evaluation model of the particle swarm optimization algorithm to assess the carrying capacity of the Three Rivers Plain’s water resources [11]. The preceding studies yielded rich results, but the water and land resource carrying capacity research units are primarily concentrated in administrative regions, such as counties, cities, and provinces. There are fewer studies on water and land resource carrying capacity using raster as the unit, which has a more apparent data spatial visualization effect. The focus of the existing studies is still mainly on the single investigation of water or land resources carrying capacity, and the emphasis is on the optimal allocation of water resources. The coupling mechanism of the water and land coexistence system has not been sufficiently explored. Further research is required into the quantitative spatial and temporal evolution analysis of water and land resource carrying capacity under multiple driving factors and future scenario prediction. CA–Markov combines the framework changeability of CA to simulate complex systems with the long-term prediction advantages of Markov, which can improve translational prediction accuracy significantly. Using CA–Markov models, relevant researchers have achieved good results in land use change research [12,13,14,15,16].
Given this, this paper takes the Jingdian Irrigation District as the research object. The system dynamics theory and the “pressure-status-response” (PSR) model are introduced to analyze the driving factors of the water and land resource carrying system. We utilized the combined assignment method to determine the weights of each driving factor and the ArcGIS fusion multi-temporal data were analyzed to determine the evolution of water and land resource carrying capacity from 1994 to 2018. Combining the transfer probability matrix of water and land resource carrying capacity and suitability atlas, the CA–Markov model simulates the spatial pattern of water and land resource carrying status in 2018. With 2018 as the starting point, the study region’s water and land resource carrying status is predicted for 2026 (medium term) and 2034 (long term) to provide theoretical support for the optimal allocation of water and land resource of artificial oasis in arid regions.
2. Materials and Methods
2.1. Study Area
The Jingdian Irrigation District (37°26′ N~38°41′ N, 103°20′ E~104°04′ E) is an artificial ecological oasis established by water-lifting and irrigation projects in the arid region of northwest China, which is situated in central Gansu Province (Figure 1). The irrigation region has a total size of 586 km2. The elevation of the study area is 1540 to 1710m. The predominant land types include arable land, grassland, Gobi, and salty land. The climatic characteristics include drastic temperature fluctuations, lengthy periods of sunshine, high levels of evaporation, and infrequent precipitation. The average annual precipitation is 185.7 mm, and the evapotranspiration is 2433.8 mm. The unique natural environment and the long-term unreasonable irrigation pattern have broken the water–salt equilibrium of the original hydrogeological unit. They led to the continuous rise in groundwater levels and groundwater mineralization in the irrigation area. Additionally, the influence of the local climate conditions of high evaporation and low rainfall causes the accumulated salt in the soil to gradually move to the soil surface through capillary action. Soil salinization and other environmental issues with water and land resource in the irrigation area are beginning to gain attention.
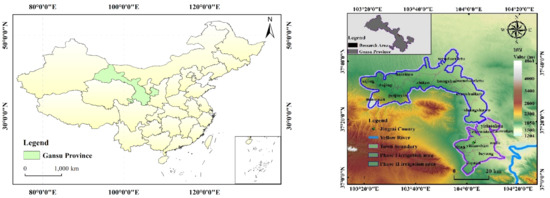
Figure 1.
Study area.
2.2. Data Sources
In this study, four key categories of data were used: topography and climatic data, water and land environment data, natural and human disturbance data, and Landsat data. The data used in this study for 1994, 2002, 2010, and 2018 were extracted from various sources (Table 1). We used the Origin 9.1 software normal QQ test to test the normality of the source data in Table 1, followed by spatial interpolation in ArcGIS. Landsat data were obtained from the Geospatial Data Cloud website (http://www.gscloud.cn/ accessed on 17 October 2021), and LANDSAT_5 data from 1994, 2002, and 2010 and LANDSAT_8 data from 2018 were selected (Table 2). Considering the influence of different seasonal features on the extraction and inversion, the imaging time for the data was chosen to be July, when the features are stable and conducive to data analysis. We pre-processed the remote sensing source data with remote sensing images, mainly including radiometric calibration and atmospheric correction, to reveal feature characteristics in the study area.

Table 1.
Details of the data sources.

Table 2.
Landsat data.
2.3. Methods
2.3.1. Analysis of Water and Land Resource Carrying System Based on PSR Model
Based on system dynamics analysis [17,18], the evolution process of water and land resource carrying system in arid regions is a fuzzy system with multiple indicators, multiple factors, and multiple levels of drivers [19]. The PSR model is introduced to reveal the “pressure-status-response” relationship between human activities and the natural environment, highlighting the causal linkage between damage, degradation, and restoration of environmental resources [20,21]. The driving system of the water and land resource carrying system is listed in Figure 2.
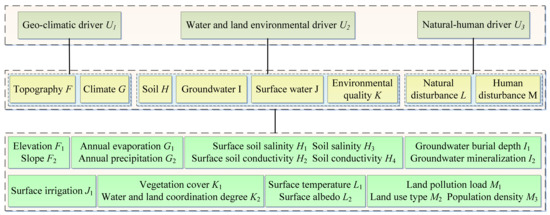
Figure 2.
Multi-level fuzzy driving system of water and land resource carrying system.
2.3.2. Combined Assignment Method
The weight of each driving factor significantly impacts the simulation results of regional water and land resource carrying status. Traditional assignment methods are classified into two types: subjective and objective. The subjective assignment method is relatively good at determining the importance degree of indicators, but its subjectivity is too strong. The objective assignment method effectively avoids the influence of subjectivity and artificial experience, but the weights obtained frequently deviate from the actual importance. As a result, in order to effectively integrate the subjective experience and the objective information in the evaluation results, this study adopted the combined assignment method [22]. The weight is calculated as follows:
where n is the number of indicators and i is the queueing level.
2.3.3. Water and Land Resource Carrying Capacity Calculation
Based on the “positive cumulative principle”, ArcGIS was used to perform a raster overlay analysis of the driving elements of the water and land resource. The higher the accumulation value, the worse the carrying status of water and land resource. The water and land resource carrying capacity status index SWSR was developed from studies to characterize the carrying degree of water and land resource carrying capacity [23,24,25,26]. This study used SWSR calculated by raster superposition to classify the water and land resource carrying status. As “good carrying V5“, “safe carrying V4”, “critical carrying V3”, “slight carrying V2”, and “severe carrying V1.” The SWSR is calculated as follows:
where SWSR denotes the carrying status index for water and land resource; Yi denotes the value of each driving element; Xi denotes the weight value of each driving element; and n is the number of driving elements.
2.3.4. Spatial Transfer Matrix of Water and Land Resource Carrying Capacity
Based on the land use transfer matrix, the spatial transfer matrix of water and land resource carrying capacity is constructed to monitor the distribution characteristics of water and land resource carrying capacity and the flow direction of different carrying levels, to reveal the spatial differentiation process and transformation relationship of regional water and land resource carrying capacity over time [27,28,29]. The transfer matrix calculation formula is as follows:
where A is the total area of the region; n is the carrying capacity level for water and land resource; i is the initial land characteristics; and j is the final land characteristics.
2.3.5. Cellular Automaton
The cellular automaton is a dynamical analysis model with a grid structure. It combines time, space, and status discreteness into one, with spatial interactions and time causality localized. Using the cellular as the system’s basic unit, the cellular status and its neighboring cellular at the previous moment t is used as the simulation antecedent and input elements. The status of the cellular at the moment t + 1 is simulated based on the cellular local transformation rules to realize the development process and future scenarios of ecology, biology, and soft computational sciences in complex scenarios [30,31,32]. Based on this principle, this study introduces the simulation study of the spatio-temporal evolution process of a complex system of water and land resource carrying status of an artificial oasis in an arid region. The simulation principle is as follows:
where t and t + 1 are the moments before and after the cellular is in; S is the set of cellular status; f is the cellular transformation rule; and N is the cellular neighborhood.
2.3.6. Markov Model
The Markov model is a statistical model based on the Markov process theory initially used in speech recognition and lexical annotation. It has since been used in geo-statistics and ecological statistical analysis due to its accurate representation of complex problems [33,34,35]. The evolution of water and land resources resembles a Markov evolutionary process. The carrying status of water and land resource corresponds to the “possible status” in the Markov process. The status transfer probability can be defined as the area or proportion of transitions in the carrying status of water and land resource. The expression process is as follows:
where Pij is the status transfer probability matrix.
2.3.7. CA-Markov
Due to the large area of the Jingdian Irrigation District, the vector map of water and land resource carrying status is converted into a raster data format with an image element value of 100 × 100. Based on the Markov module of IDRISI software, the period was set as 8a and the scale error as 0.15. The transfer probability matrix of water and land resource carrying status from 1994 to 2002, 2002 to 2010, and 2010 to 2018 was calculated.
Considering the unique water and land resource conditions, geographic characteristics, human activities, and land use characteristics in the study area, different carrying status areas, Gobi, and building sites were set as limiting elements, and slope, elevation, and distance from roads were set as limiting conditions. The evolution criteria and rules were determined comprehensively using the suitability atlas generated by MCE and the COLLETION EDIT module. These criteria and rules were used to determine the future status of the cellular. The status of the target cellular was finally considered to be influenced by its surrounding cellular in an effective range of 5 × 5 cellular, so a 5 × 5 filter was chosen.
The water and land resource carrying status in 2010 was set as the simulation base period and the number of CA cycles as 8. We combined the suitability atlas and the status transfer probability matrix from 2010 to 2018 to simulate the water and land resource carrying status in 2018. Finally, using the 2018 water and land resource carrying status as the starting year, the number of CA cycles was set as 8 and 16. We used the suitability atlas and status transfer probability matrix of water and land resource carrying status from 2010 to 2018 to achieve spatial pattern prediction of water and land resource carrying status in 2026 and 2034. The specific process is shown in Figure 3.
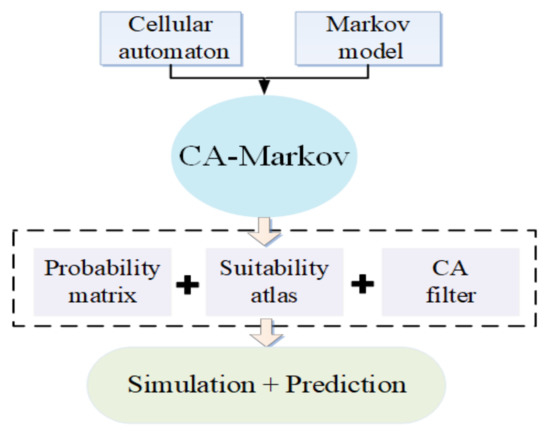
Figure 3.
CA–Markov calculation process.
3. Results
3.1. Driving Factor Weights
The overall ranking of each driving element was determined by the comprehensive driving effect, the relative importance, and the actual evolutionary process and driving mechanism of water and land resource. We then obtained the comprehensive weight of each driving factor by Equation (1). It can be seen that the water and land coordination degree and the groundwater burial depth are the main factors driving the carrying capacity of water and land resource.
3.2. Analysis of Water and Land Resource Carrying Capacity Evolution
Through the driving factor weights obtained from Table 3, we used ArcGIS to superimpose raster weighting on the obtained multi-temporal phase data and obtained the spatial distribution pattern of water and land resource carrying status of different research nodes. The spatial areas of water and land resource carrying status in different periods were counted, and the specific results are shown in Figure 4 and Table 4.

Table 3.
Driving factor weights.
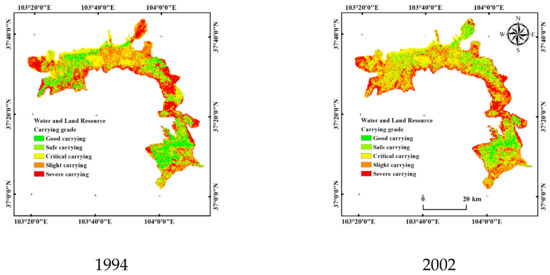
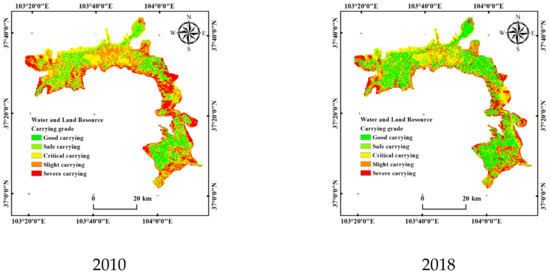
Figure 4.
Spatial distribution of water and land resource carrying status for four periods.

Table 4.
Spatial changes in water and land resource carrying capacity from 1994 to 2018.
According to the spatial area transfer characteristics of water and land resource carrying capacity from 1994 to 2018, the size of the “good carrying” zone increased by 10.42%, the size of the “safe carrying” zone increased by 7%, the size of the “critical carrying” zone remained nearly the same, the size of the “slight carrying” zone decreased by 5.18%, and the size of the “severe carrying” zone decreased by 11.99%. This demonstrates that the overall carrying status of water and land resource from 1994 to 2018 characterizes the evolution trend in which the size of “severe carrying” and “slight carrying” zones decreases, while the size of “safe carrying” and “good carrying” zones gradually increases. Although the size of the “critical carrying” zone remains almost unchanged in general, the spatial distribution has changed, and some of the original “critical carrying” zones have evolved into “safe carrying” and “good carrying” zones. With the continuous improvement of irrigation and water distribution facilities in the irrigation area, the amount of surface irrigation shows a more stable trend of incremental increase, leading to the full utilization of land resources and making the coordination of water and land in a continuous improvement process. The overall land use pattern shows a continuous increase in cultivated land and a significant decrease in sandy land, uncultivated land, and grassland areas. The coordination of water and land tends to be suitable, vegetation cover increases, and light and heat conditions improve so that the irrigation area continuously improves water and land resource carrying status. At the same time, under the influence of unreasonable irrigation patterns, the groundwater recharge rate is greater than the discharge rate, breaking the equilibrium of recharge and discharge in the natural state. This has led to a rise in groundwater levels and increased groundwater mineralization, resulting in increasing soil salinity and reducing the rate of benign evolution of the water and land resource carrying capacity.
However, a combination of factors, such as continuous exploitation of water and land resource, intensification of human activities, and the unscientific nature of agricultural production, has accelerated the surface ecological degradation process. Soil salinization poses significant challenges to the water and land resource carrying status in the eastern closed hydro-geological unit, such as Luyang Township, Caowotan Township, and Wufo Township. Water irrigation has effectively improved the water and land environment in Zhitan Township, Xijing Township, southern Manshuitan Township, and northern Shangshawo Township. Due to the region’s environmental background, the carrying capacity of water and land resource in large areas of Gobi, sandy land, and unused land remains poor. Under the influence of human activities, the expansion of land for construction and transportation, and the intensification of land pollution load, new challenges have been posed to the water and land resource carrying status and spatially present status of decreasing from urban areas to surrounding townships in an arc-shot pattern.
3.3. Simulation of Water and Land Resource Carrying Capacity Evolution
3.3.1. Water and Land Resource Carrying Status Transfer Probability Matrix
We set the time limit analysis unit as years. The Markov model was used to analyze the water and land resource carrying status transfer probability. The water and land resource carrying status transfer probability of three evolutionary stages were calculated using Formulas (5) and (6), and are presented in Table 5, Table 6 and Table 7, respectively.

Table 5.
Transfer probability matrix of water and land resource carrying status from 1994 to 2002.

Table 6.
Transfer probability matrix of water and land resources carrying status from 2002 to 2010.

Table 7.
Transfer probability matrix of water and land resource carrying status from 2010 to 2018.
3.3.2. Suitability Atlas of Water and Land Resource Carrying Capacity
The Jingdian Irrigation District comprises 16 townships with topography dominated by hills, plains, mountain basins, and terraces. The overall terrain shows an arc-shot increasing trend from southeast to northwest. Water irrigation has greatly improved regional water and land coordination since the district’s inception in 1994, further optimizing the allocation of water and land resource. The area of sandy and unused land reduced, and the area of arable land and construction land increased in the region. Analyzing the spatial distribution of land use and the spatial and temporal evolution process, the evolution process of Gobi and construction lands is relatively slow. The probability of transforming these two types of land units into other kinds of land is low. Gobi and construction land are the main constraints on the natural conditions of water and land resource. Topographic factors such as slope, elevation, and distance from the roads are the key factors affecting the development of water and land resource. As a result, the Gobi and construction lands are designated as restrictive elements, while slope, elevation, and distance from the roads are designated as influential elements. We created the atlas of each suitability atlas based on the MCE of Boolean operation and binarize the restrictive and influential elements [36,37,38]. The characteristics of suitable transformation are one, and the characteristics of unsuitable transformation are zero. As shown in Figure 5, we analyzed the functional mode of operation between each driving element and water and land resource carrying. Moreover, we determined the corresponding parameters through the statistical situation of the probability distribution and obtaining the suitability atlas of carrying status after processing suitable diagrams (using the “good carrying” area as an example).
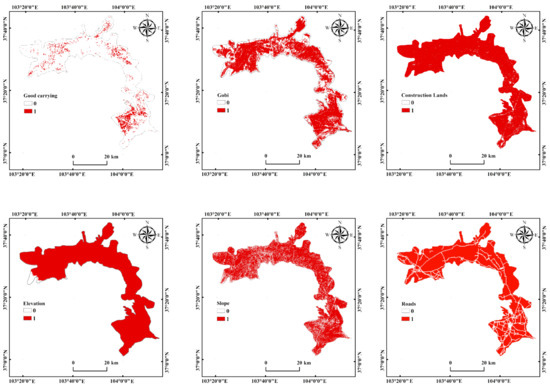
Figure 5.
Suitability atlas of “Good carrying” zone.
3.3.3. Simulation of Water and Land Resource Carrying Capacity Evolution in 2018
We used the spatial distribution of water and land resource carrying area in 2010 as the base period image and input the suitability atlas of different carrying status land characteristics based on the CA–Markov module in IDRISI. We combined the water and land resource carrying capacity transfer area matrix and probability matrix, and set the simulation cycle base for eight years to realize the simulation of the spatial pattern of water and land resource carrying status in 2018 (Figure 6).
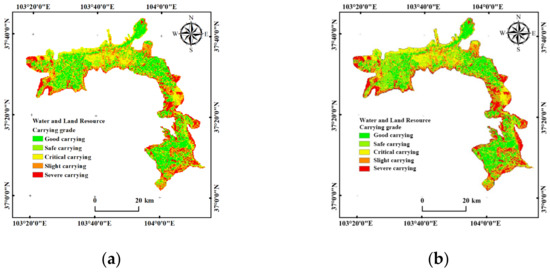
Figure 6.
Comparison between actual and simulated water and land resource carrying status in 2018. (a) Actual status of water and land resource carrying in 2018; (b) Simulated status of water and land resource carrying in 2018.
As shown in Figure 6, the actual carrying status of water and land resource obtained by raster overlay has a small spatial variability from that obtained by simulation. The accuracy statistics of the actual interpretation and simulation results in 2018 are shown in Table 8.

Table 8.
Simulation of the evolution of water and land resource carrying status in 2018.
As shown in Table 8, the spatial proportion occupied by each carrying characteristic in the simulated water and land resource carrying results for 2018 is more consistent with the actual status. Among the five types of carrying status simulated, the size of the “slight carrying” zone accounts for the most significant proportion. The size of the “severe carrying” zone accounts for a minor proportion. The simulated situation of the water and land resource carrying status is generally consistent with the evolution of water and land resource from 2010 to 2018. The simulation accuracy of five types of characteristics, namely “good carrying”, “safe carrying”, “critical carrying”, “slight carrying”, and “severe carrying”, zones reached 98.71%, 92.07%, 95.34%, 94.05%, and 93.73% respectively. The average value of simulation accuracy was 94.78%, indicating that the overall simulation result was good. The “good carrying” zone has the highest simulation accuracy, which is the optimal water and land resource allocation from 2010 to 2018. The coordination of water and land resource has been rising, and water and land resource can be further developed and utilized, making their prediction results consistent with the actual situation. The prediction accuracy of “critical carrying”, “slight carrying”, and “severe carrying” zone features is the second highest. The plundering development of water and land resource by human activities and the soil salinization process generated by the water–heat–salt results in the area’s actual carrying status in the closed hydrogeological unit. The “safe carrying” zone has the lowest simulation accuracy. The error area is primarily concentrated in the Phase II irrigation area, mainly due to the simulation process’s constraints of the suitability atlas and the continuous improvement of the water distribution structure, which is a non-controllable factor of the simulation process.
3.3.4. Water and Land Resource Carrying Capacity Evolution Prediction
This study takes the carrying status of water and land resource in 2018 as the starting point and sets 2018 as the base year based on the CA–Markov, which provides the suitability atlas of water and land resource carrying status and the transfer probability matrix of carrying status characteristics. The simulation cycle was set to 8 and 16 years, respectively. The simulation and prediction of water and land resource carrying status in 2026 and 2034 are realized (Figure 7). The characteristics of each carrying status in 2026 and 2034 were analyzed statistically, and the statistical results are shown in Table 9.
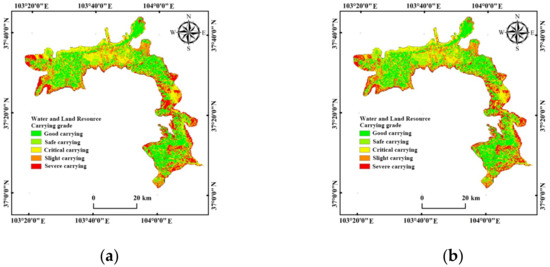
Figure 7.
Predicted water and land resource carrying status in 2026 and 2034. (a) Predicted water and land resource carrying status in 2026; (b) Predicted water and land resource carrying status in 2034.

Table 9.
Simulation results of water and land resource carrying status evolution in 2026 and 2034.
Figure 7 shows that, between 2026 and 2034, the size of the “good carrying” and “safe carrying” zones increase significantly and are primarily concentrated in areas with a low degree of land desertification and water and land resource development. The proportion of the “slight carrying” and “severe carrying” zones show an overall decreasing trend. Jingtai County is the most representative zone reflecting the soil salinization process of the closed hydrogeological unit in the eastern irrigation area. As seen from Table 9, the characteristics of land types with the carrying status of the “critical carrying” zone have alternated in the evolution process from 2018 to 2034, mainly due to this evolution process from 2018 to 2026. The “slight carrying” and “severe carrying” zones still have a larger space to transfer to the “critical carrying” zone. However, with the continuous optimal water and land resource allocation in the irrigation area, the spatial transfer process of the “slight carrying” and “severe carrying” zones is slowed by suitability condition constraints. This evolution rate is lower than the evolution rate of the “critical carrying” zone to the “good carrying” and “safe carrying” zones.
The prediction results show that the irrigation area’s water and land resource carrying status is in a healthy evolution from 2018 to 2034, consistent with the evolution of the irrigation area’s water and land resource carrying status since it was built and operated. However, a reverse evolution has occurred in land resources degradation in the local area. The emergence of this evolution process is the primary containment factor for the irrigation district’s future operation process. To avoid further deterioration of this trend, on the one hand, water and land resource should be further optimized to fully realize ecological functions such, as water and land conservation and environmental improvement. On the other hand, carrying out a series of water and land environment treatments is necessary. It is necessary to fully exploit the soil salinization control technology of “biological alkaline treatment + chemical alkaline treatment + engineering alkaline treatment.” Introducing public welfare development modes, such as constructing wetland parks in enclosed areas where groundwater is exposed, improves regional air humidity and regulates the regional climate.
4. Discussion
This paper examines the carrying status of water and land resource in the Jingdian Irrigation District from 1994 to 2018 and establishes a transfer probability matrix of water and land resource carrying status, with IDRISI and ArcGIS serving as the technical platform. The water and land resource carrying status of the study area in 2018 was simulated and predicted using the CA–Markov module. The results show that the carrying capacity of water and land resource in the irrigation area is evolving well, which is consistent with the research results of Zhu et al. [39] and Liu et al. [40]. It indicates that the results are reliable. The simulation accuracy was corrected in comparison to the actual carrying characteristics in 2018. By adjusting the prediction constraints and key parameters, the carrying status of water and land resource in 2026 and 2034 was predicted with the final determined parameters and suitability atlas. The CA–Markov model was used to simulate the carrying status in the medium-term and long-term, which effectively combines the spatial variation ability of the CA model and the time dimension analysis advantage of the Markov model. This study demonstrates the spatial and temporal synchronization simulation of water and land resource carrying status. Considering the influence of environmental factors, the simulation results are closer to the actual situation. Yue et al. [41] used CA–Markov to predict the spatial and temporal patterns of the ecological carrying capacity in the Shiyang River Basin in northwest China. Zhang et al. [42] used the MCE–CA–Markov model to simulate the landscape dynamics of the Baiyangdian watershed. All of them have achieved research results with reference value, further illustrating the reliability of the prediction results of the CA–Markov model used in this study.
Although the CA–Markov model partially overcomes the disadvantages of singleness and linear simulation of traditional water and land resource carrying capacity, this model is constrained by the spatial characteristics of the data, and the systematic consideration is still insufficient for constructing the prediction suitability atlas. To begin, the spatial integration of factors in geography, society, economy, and resource environment should be investigated further. Second, due to the large area of the irrigation area, the simulation was performed with a raster unit size of 100 × 100. The spatial effect of the carrying capacity of water and land resource was not considered, resulting in a certain gap between the simulation effect and the actual results. In the future, we should consider using DMSP-OLS nighttime light data to spatialize each driving factor and incorporate it into the transformation rules to make a transfer suitability atlas, and then repeatedly optimize the matching mode of cellular and raster to improve the prediction results.
5. Conclusions
- (1)
- From 1994 to 2018, the overall characterization of the carrying capacity of water and land resource shows a decrease of 5.18% and 11.99% in the size of the “severe carrying” and “slight carrying” zones, respectively. There was an increase of 7% and 10.42% in the size of the “safe carrying” and “good carrying” zones, respectively, with little volatility in the size of the “critical carrying” zone, but the regional distribution has changed. The overall carrying capacity of water and land resource shows a continuous healthy trend evolution, with an arc-shaped increase from the town to the surrounding area.
- (2)
- Based on the MCE method of Boolean operations, we combined the CA–Markov module in IDRISI and ArcGIS to simulate the water and land resource carrying status of the study area in 2018. Following analysis, the simulation results are consistent with the actual status overall, with an overall mean value of simulation accuracy of 94.78%, indicating that the simulation results are more reliable and can be used for regional water and land resource carrying status prediction.
- (3)
- From the predicted results, the carrying status of water and land resource in the Jingdian Irrigation District from 2018 to 2034 is still in a healthy evolution process, consistent with the evolution trend from the irrigation area’s operation. However, this benign evolutionary trend is gradually slowing, and the “slight carrying” and “severe carrying” zones show a spatial transition from land desertification to soil salinization and urbanization.
- (4)
- In this study, simulation and prediction by CA–Markov model were conducted to explore the evolution of water and land resource carrying capacity in the Jingdian irrigation area in northwest China. The research results provide useful reference values for promoting the optimal spatial and temporal allocation of water and land resource and sustainable development in the region, and provide a practical basis for seeking a balance mechanism between ecosystem conservation and production needs in arid regions.
Author Contributions
Methodology, C.X. and Z.L.; software, X.H. and Z.L.; validation, C.X. and X.H.; investigation, C.X. and X.H.; writing—original draft preparation, X.H.; data processing, X.H and X.W.; visualization, X.W. and J.T.; supervision, J.T. and Z.Z. All authors have read and agreed to the published version of the manuscript.
Funding
This research was funded by the Central Plains Science and Technology Innovation Leading Talent Support Program (No. 204200510048); the Basic Public Welfare Research Program of Zhejiang Province (No. LZJWD22E090001); the Major Science and Technology Program of Zhejiang Province (No. 2021C03019); and the Henan Provincial Science and Technology Research Project (No. 212102310273).
Institutional Review Board Statement
Not applicable.
Informed Consent Statement
Not applicable.
Data Availability Statement
Not applicable.
Conflicts of Interest
The authors declare no conflict of interest.
References
- Felix, O.D.H.; Bernd, D.; Gero, S.; Yacouba, Y.; Thomas, H.; Michael, R.; Kristian, N. Modeling the effect of land use and climate change on water resources and soil erosion in a tropical West African catch-ment (Dano, Burkina Faso) using SHETRAN. Sci. Total Environ. 2019, 653, 431–445. [Google Scholar]
- Angelovicová, L.; Fazekašová, D. Contamination of the Soil and Water Environment by Heavy Metals in the Former Mining Area of RudÅany (Slovakia). Soil Water Res. 2014, 9, 18–24. [Google Scholar] [CrossRef]
- Xu, C.; Liu, Z.; Zhu, X.; Tian, J.; Gu, F.; Wang, Y. Water and soil environmental vulnerability of artificial oases in arid areas and its temporal and spatial differentiation and evolution. Water Supply 2021, 21, 2646–2664. [Google Scholar] [CrossRef]
- Vogeler, I.; Cichota., R.; Beautrais., J. Linking Land Use Capability classes and APSIM to estimate pasture growth for regional land use planning. Soil Res. 2016, 54, 94. [Google Scholar] [CrossRef]
- Lamsal, P.; Kumar, L.; Atreya, K.; Pant, K.P. Vulnerability and impacts of climate change on forest and freshwater wetland ecosystems in Nepal: A review. AMBIO 2017, 46, 915–930. [Google Scholar] [CrossRef] [PubMed]
- Michiel, R. Different Approaches to Assessment of Design and Management of Sustainable Urban Water System. Environ. Impact Assess. Rev. 2000, 20, 333–345. [Google Scholar]
- Yang, J.F.; Lei, K.; Soonthiam, K.; Meng, W. Assessment of Water Resources Carrying Capacity for Sustainable Development Based on a System Dynamics Model: A Case Study of Tiding City, China. Water Resour. Manag. 2015, 29, 885–899. [Google Scholar] [CrossRef]
- Falkenmark, M.; Widstrand, C. Population and water resources: A delicate balance. Popul. Bull. 1992, 47, 1–36. [Google Scholar]
- Joardar, S.D. Carrying Capacities and Stanards as Bases towards Urban Infrastructure Planning In India: A Case of Urban Water Supply and Sanitation. Habitat Int. 1998, 22, 327–337. [Google Scholar] [CrossRef]
- Yao, Z.J.; Wang, J.H.; Jiang, D.; Cheng, C.Y. Advances in study on regional water resources carrying capacity and research on its theory. Adv. Water Sci. 2002, 13, 111–115. [Google Scholar]
- Jiang, Q.X.; Fu, Q.; Wang, Z.L. Evaluation and regional differences of water resources carrying capacity in Sanjiang plain. Trans. CSAE 2011, 27, 184–190. [Google Scholar]
- Wang, Z.L.; Ya, S.Y.; Pu, H.X.; Mofakkarul, I.; Ou, L. Simulation of spatiotemporal variation of land use in mountainous-urban fringes based on improved CA-Markov model. Trans. Chin. Soc. Agric. Eng. 2020, 36, 239–248. [Google Scholar]
- Loukika, K.N.; Keesara, V.R.; Buri, E.S.; Sridhar, V. Predicting the Effects of Land Use Land Cover and Climate Change on Munneru River Basin Using CA-Markov and Soil and Water Assessment Tool. Sustainability 2022, 14, 5000. [Google Scholar] [CrossRef]
- Nehzak, H.K.; Aghaei, M.; Mostafazadeh, R.; Rabiei-Dastjerdi, H. Chapter 6—Evaluation of land use change predictions using CA-Markov model and management scenarios. In Computers in Earth and Environmental Sciences; Elsevier: Amsterdam, The Netherlands, 2022; pp. 105–115. [Google Scholar]
- Kang, J.F.; Li, S.; Fang, L. Land Use Change Prediction Method Based on CA⁃Markov Model Under Cloud Computing En-vironment. Geomat. Inf. Sci. Wuhan Univ. 2020, 45, 1021–1026+1034. [Google Scholar]
- Zhang, X.J.; Zhou, Q.G.; Wang, Z.L.; Wang, F.H. Simulation and prediction of land use change in Three Gorges Reservoir Area based on MCE-CA-Markov. Trans. Chin. Soc. Agric. Eng. (Trans. CSAE) 2017, 33, 268–277. [Google Scholar]
- Vallero, D.A. Environmental system dynamics. In Environmental Systems Science; Elsevier: Amsterdam, The Netherlands, 2021. [Google Scholar] [CrossRef]
- Suárez-Moreno, R.; Kushnir, Y.; Seager, R. Observational analysis of decadal and long-term hydroclimate drivers in the Mediterranean region: Role of the ocean–atmosphere system and anthropogenic forcing. Clim. Dyn. 2021, 58, 2079–2107. [Google Scholar] [CrossRef]
- Setegn, S.G.; Srinivasan, R.; Dargahi, B.; Melesse, A.M. Spatial delineation of soil erosion vulnerability in the Lake Tana Basin, Ethiopia. Hydrol. Process. 2009, 23, 3738–3750. [Google Scholar] [CrossRef]
- Xie, X.; Li, X.; He, W. A Land Space Development Zoning Method Based on Resource–Environmental Carrying Capacity: A Case Study of Henan, China. Int. J. Environ. Res. Public Health 2020, 17, 900. [Google Scholar] [CrossRef]
- Zhou, W.; Elshkaki, A.; Zhong, S.; Shen, L. Study on Relative Carrying Capacity of Land Resources and Its Zoning in 31 Provinces of China. Sustainability 2021, 13, 1459. [Google Scholar] [CrossRef]
- Seidi, I.; Tisdell, C. Carrying capacity reconsidered:from Malthus population theory to cultural carrying capacity. Ecol. Econ. 1999, 31, 395–408. [Google Scholar]
- Ren, S.D.; Fu, Q.; Wang, K. Regional agricultural water and soil resources carrying capacity based on macro-micro scale in Sanjiang Plain. Trans. Chin. Soc. Agric. Eng. (Trans. CSAE) 2011, 27, 8–14. [Google Scholar]
- Zhen, J.L.; Li, X.P. Evaluation model of regional water resources carrying capacity based on coordination. Water Resour. Prot. 2021, 37, 30–35. [Google Scholar]
- Sudipa, N.; Mahendra, M.S.; Adnyana, W.S.; Pujaastawa, I.B. Land and Water Carrying Capacity in Tourism Area of Nusa Penida, Bali. Int. J. Sci. Res. Manag. 2020, 8, 145–161. [Google Scholar] [CrossRef]
- Kunu, P.J.; Talakua, S.; Pesulima, Y.; Uyara, L.; Laimeheriwa, S.; Osok, R.M. Carrying capacity and environmental capacity of water resources analysis in Maluku Province of Indonesia. IOP Conf. Ser. Earth Environ. Sci. 2021, 883, 012062. [Google Scholar] [CrossRef]
- Waiyasusri, K.; Chotpantarat, S. Spatial Evolution of Coastal Tourist City Using the Dyna-CLUE Model in Koh Chang of Thailand during 1990–2050. ISPRS Int. J. Geo-Inf. 2022, 11, 49. [Google Scholar] [CrossRef]
- Boonyanam, N.; Bejranonda, S. Ecosystem Service Value of the Mixed Land Use Pattern in Asia: Thailand’s Experience. Appl. Environ. Res. 2020, 43, 56–72. [Google Scholar] [CrossRef]
- Zhang, Y. Xiaokaihe Irrigation Area of Water and Soil Resources Carrying Capacity Analysis and Optimization; Shan Dong University: Jinan, China, 2015. [Google Scholar]
- Sutapa, S.; Biplab, K.; Mousumi, S. Cellular automata based multi-bit stuck-at fault diagnosis for resistive memory. Front. Inf. Technol. Electron. Eng. 2022, 23, 1110–1127. [Google Scholar]
- da Cunha, E.R.; Santos, C.A.G.; da Silva, R.M.; Panachuki, E.; de Oliveira, P.T.S.; de Souza Oliveira, N.; dos Santos Falcão, K. Assessment of current and future land use/cover changes in soil erosion in the Rio da Prata basin (Brazil). Sci. Total Environ. 2021, 818, 151811. [Google Scholar] [CrossRef] [PubMed]
- Matlhodi, B.; Kenabatho, P.; Parida, B.; Maphanyane, J. Analysis of the Future Land Use Land Cover Changes in the Gaborone Dam Catchment Using CA-Markov Model: Implications on Water Resources. Remote Sens. 2021, 13, 2427. [Google Scholar] [CrossRef]
- Tariq, A.; Shu, H. CA-Markov Chain Analysis of Seasonal Land Surface Temperature and Land Use Land Cover Change Using Optical Multi-Temporal Satellite Data of Faisalabad, Pakistan. Remote Sens. 2020, 12, 3402. [Google Scholar] [CrossRef]
- Ruben, G.B.; Zhang, K.; Dong, Z.; Xia, J. Analysis and Projection of Land-Use/Land-Cover Dynamics through Scenario-Based Simulations Using the CA-Markov Model: A Case Study in Guanting Reservoir Basin, China. Sustainability 2020, 12, 3747. [Google Scholar] [CrossRef]
- Khwarahm, N.R.; Najmaddin, P.M.; Ararat, K.; Qader, S. Past and future prediction of land cover land use change based on earth observation data by the CA–Markov model: A case study from Duhok governorate, Iraq. Arab. J. Geosci. 2021, 14, 1–14. [Google Scholar] [CrossRef]
- Radwan, F.; Alazba, A.A.; Alotaibi, M.; Mossad, A. Site suitability analysis for desalination plants based on the complementarity of GIS, RST, MCE, and spatial AHP in arid and semiarid regions. Arab. J. Geo-Sci. 2022, 15, 1763. [Google Scholar] [CrossRef]
- Alsafadi, K.; Bi, S.; Bashir, B.; Hagras, A.; Alatrach, B.; Harsanyi, E.; Alsalman, A.; Mohammed, S. Land suitability evaluation for citrus cultivation (Citrus ssp.) in the southwestern Egyptian delta: A GIS technique-based geospatial MCE-AHP framework. Arab. J. Geosci. 2022, 15, 307. [Google Scholar] [CrossRef]
- Abel, B.; Worku, N.; Behailu, L.; Fisha, S. Suitable Potential Land Evaluation for Surface Water Irrigation Using Remote Sensing and GIS–MCE in the Case of Rib–Gumara Watershed, Ethiopia. J. Indian Soc. Remote Sens. 2021, 49, 2273–2290. [Google Scholar]
- Zhu, X.L. Spatial-Temporal Evolution of Water and Soil Vulnerability in Jingdian Irrigation District. North China University of Water Resources and Electric Power: Zhengzhou, China, 2020. [Google Scholar]
- Liu, Z.J.; Xu, C.D.; Zhu, X.L.; Zhou, D.M.; Tian, J.J. Comprehensive assessment and evolution analysis of soil salinization in artificial oasis in arid desert area. China Environ. Sci. 2022, 42, 367–379. [Google Scholar]
- Yue, D.X.; Yang, C.; Jiang, B.H.; Guo, J.J.; Xu, X.F. Spatio-temporal pattern prediction of the biocapacity in the Shiyang River Basin on the basis of the CA-Markov model. Acta Ecol. Sin. 2019, 39, 1993–2003. [Google Scholar]
- Zhang, C.X.; Xu, J.J.; Wen, J.; Yang, X.B.; Wang, J.H.; Zhao, B. Dynamic simulation of landscape change in the Baiyangdian basin based on the CA-Markov model and MCE constraints. J. Agric. Resour. Environ. 2021, 38, 655–664. [Google Scholar]
Disclaimer/Publisher’s Note: The statements, opinions and data contained in all publications are solely those of the individual author(s) and contributor(s) and not of MDPI and/or the editor(s). MDPI and/or the editor(s) disclaim responsibility for any injury to people or property resulting from any ideas, methods, instructions or products referred to in the content. |
© 2023 by the authors. Licensee MDPI, Basel, Switzerland. This article is an open access article distributed under the terms and conditions of the Creative Commons Attribution (CC BY) license (https://creativecommons.org/licenses/by/4.0/).