Article

Satisfaction with and Continuous Usage Intention towards Mobile Health Services: Translating Users’ Feedback into Measurement

School of Design and Architecture, Zhejiang University of Technology, Hangzhou 310014, China
*
Author to whom correspondence should be addressed.
Sustainability 2023, 15(2), 1101; https://doi.org/10.3390/su15021101
Submission received: 9 December 2022 / Revised: 26 December 2022 / Accepted: 29 December 2022 / Published: 6 January 2023
(This article belongs to the Special Issue Design for Behavioural Change, Health, Wellbeing, and Sustainability)

Abstract

:
With advances in information and communication technology and the rapid development of the mobile Internet, mobile health (m-health) management applications (apps) play a key role in modern health assistance programs. However, m-health management apps still face major dilemmas in ensuring user satisfaction and continuous use. Based on resolving the contradiction between the multiple complex and ambiguous demands of users and the limited development resources of companies, this study explores ways to improve user satisfaction and the willingness to sustain m-health management app usage to build efficient and clear m-health management app demand insights and development strategies. This study integrates the advantages of the Kano model and the decision-making trial and evaluation laboratory (DEMATEL) method. From the systematic level, an attribute acquisition-classification-key attribute extraction and influence relationship quantification-hierarchy analytic hierarchy model was built. The research results provide implications for further improvement efforts to consider not only technological capabilities but also effective insights into the attributes that are highly expected by users, thus improving the accuracy of app function positioning and, in turn, enhancing user satisfaction and continuous usage intention. Additionally, the results provide decision-makers in enterprises and relevant research and development (R&D) departments with clear and efficient app requirement relationships and development strategies.

1. Introduction

Currently, mobile Internet is developing rapidly, with an increasing number of traditional industries, such as transport, retail, and healthcare, switching their services from offline to online. Additionally, this trend is set to continue into the coming years [1]. Mobile devices, especially smartphones, play an irreplaceable role in people’s lives due to their portability and usability, and they have important uses in the field of healthcare. Mobile health (m-health) services, for example, have become an important part of everyday life in the digital age, providing users with many conveniences and benefits. M-health can not only change people’s health behavior but also improve their quality of life (QOL) [2].
The large and increasing mobile user base and the increasing awareness and behavior of people in pursuit of health have created new opportunities for the development of multifunctional m-health applications (apps), making m-health an enormous market generating tens of billions of dollars from subscriptions and high profits [3]. There are currently over 165,000 m-health apps in the major app stores, mainly health management apps (e.g., fitness, lifestyle changes, diet, and nutrition) and disease management apps (e.g., mental health, diabetes, and cardiovascular disease). Other categories include self-diagnosis, medication reminders, patient e-portals, rehabilitation management apps, etc. [1,4]. Among them, health management apps rank among the top 10 most popular apps in both Google Play and the Apple App Store, two major global app stores [5]. This research takes m-health management apps as the main target object.
Typically used to support the majority of users’ daily activities, mobile device technology can support personal activities anywhere and anytime due to the extensive integration of mobile devices into users’ lifestyles. At the same time, mobile devices integrate a large number of sensors and are highly usable for collecting physical activities, body images, and other healthcare-related data, helping healthcare professionals track patient treatment and allowing signals relevant for medical or assisted living purposes to be captured in different environments. M-health apps, for example, can track jogging distances via a smartphone’s global positioning system (GPS) and have built-in cameras to record daily diets, thereby monitoring, guiding, and encouraging consumers to eat healthily and to exercise. Additionally, such apps have had a positive impact on promoting healthy lifestyles [1].
With the improvement in material living standards and the increase in consumption awareness, users’ demands for m-health management apps are becoming increasingly diverse and personalized, making it difficult for companies to gain accurate insights into user needs. At the same time, in the face of fierce market competition, most Internet companies are developing apps through an approach of “small steps, fast iterations” [6]. With limited resources for app development and a tight time frame for app launch, decision-makers need to prioritize app requirements to update apps and launch them on the market as quickly as possible. While there are many examples of successful m-health management apps, most of these apps are not expected to succeed or fail, and people rarely continue to use such apps after the initial acceptance [7,8]. For example, 26% of all m-health management apps are uninstalled or no longer used after being used once, and 74% of m-health management app users do not continue to use an app after 10 uses [9]. The data indicate that most downloaded m-health management apps have relatively low usage and retention rates and that “throwing it away” is becoming a trend in user behavior. Thus, one of the greatest challenges for m-health management app companies is to develop a sticky user base. Previous studies have conducted users’ satisfaction has significant effects on the continued intention of using m-health, which promotes the success of m-health apps [10,11]. However, few studies have explored the cause–effect relationships factors on the intention and behavior of keeping using m-health apps. Research on user satisfaction and stickiness is an effective way to gain a deeper understanding of m-health management app user behavior [12]. The greater the number of users who stick with an app is, the greater the chance that these users will become potential customers of interest. Additionally, the longer the duration that users stay is, the greater the chance that they will purchase services or goods or participate in platform activities. Previous studies have proposed key factors affecting users’ adoption intentions in using m-health, such as performance expectancy, social influence, and facilitating conditions [13]. However, studies rarely explore the mediation role of user satisfaction among antecedents and continued intention of using m-health apps. User satisfaction and stickiness are closely linked to a company’s retention and competitiveness in the app market, and they play a crucial role in the sustainability of emerging business models and information technology (IT) products and services [3,14]. This suggests a need to delve more deeply into m-health app users’ continued behaviors. Therefore, how to accurately and effectively acquire user needs, establish a good relationship with users through the mobile Internet, and improve user satisfaction and continuous usage intention has become an important issue for the sustainable development of m-health management apps.
Changing market conditions, mass digitization, and the constant emergence of new m-health management apps are placing new demands on m-health management apps, not only in terms of competitiveness, modernity, and user friendliness, but also in terms of new social and environmental considerations. In the case of m-health management, sustainable development models have specific features such as economic, social, and environmental dimensions. The use of sustainable development in m-health management and the proper balance of individuals dimensions may affect, for example, the efficiency and effectiveness of a business (economic dimension), easier access to products (social dimension), and reduced environmental impact through less waste (environmental dimension). An increasing number of users are becoming concerned about the sustainability of m-health management apps and are paying more attention to the new trend of living in an environmentally friendly way [15]. The concept of sustainability has become very popular worldwide and in the field of mobile apps, and many companies are trying to use this concept as a major development path. Sustainability is seen as an effective way to stay competitive and attract more users in the virtual market [16]. Therefore, it is necessary to rethink sustainability in m-health management apps and to explore multidimensional sustainable development based on the stages of production, distribution, and use [15].
The main purpose of this paper, which uses the Kano model and the decision-making trial and evaluation laboratory (DEMATEL) method, is to identify the relationships between quality attributes and user satisfaction. This study adopts a general inductive approach to transform users’ vague and complex m-health management app requirements into specific functionalities or attributes. It uses the Kano model to identify the non-linear relationships between the attributes and user satisfaction and explores what m-health management apps attributes matter most to users; it combines the DEMATEL method and expert evaluations to identify the cause–effect relationships and degrees of influence among the attributes. In addition, this study examines whether user satisfaction contributes to the continuous use of m-health management apps. The Kano questionnaire also includes features related to sustainability and is used to analyze whether users are concerned about these features, thus further validating users’ environmental awareness.
The rest of this article is organized as follows: Section 2 presents the current practical and theoretical background of m-health management apps and methods for exploring user satisfaction. Section 3 presents the research questions and methodology. Section 4 and Section 5 present the research findings and discussion, respectively. Finally, Section 6 and Section 7 draw conclusions and limitations.

2. Literature Review

2.1. M-Health Management Apps and User Satisfaction

What is mobile health or m-health? This critical question has been discussed and researched for nearly two decades. At present, m-health is growing rapidly and has become a hot topic in health IT, and there are many different definitions of m-health. According to the National Institutes of Health, “m-health is the use of mobile Internet technology to provide health improvement, health care and other health management services” [17]. The m-Health Summit organized by the Foundation for the National Institutes of Health defines m-health as “the delivery of health care services via mobile communication devices” [18]. Free et al. stated that “the use of mobile computing and communication technologies in health care and public health is a rapidly expanding area of e-health” [19]. The World Health Organization defines m-health more broadly as “the use of mobile wireless technologies to promote public health” [20] and “the use of mobile and wireless technologies to support the achievement of health goals” [21]. Most definitions are based on the interpretation and understanding that m-health is based on smartphone technology and computer features that enable healthcare and health improvement services through a wide range of tools and solutions based on smartphone health apps and their linked ecosystem. M-health management apps are a major category of m-health apps.
In recent years, the services and operations offered by m-health management apps have changed, along with the user experience of these apps. Users are becoming more demanding and are being guided by the increasing number of different features available for e-health when choosing an m-health management app. M-health companies are faced with the challenge of not only how to acquire new users but also, most importantly, how to build loyalty among existing customers. User’s continuous use is key to the development of m-health management apps [5]. For app providers, satisfaction significantly influences user behavior; thus, creating and maintaining a stable user base are crucial [3]. It has been found that satisfaction helps motivate users to use an app repeatedly and frequently, i.e., as an embedded routine. Additionally, satisfaction allows users to spend more time exploring and digging deeper into the various features of an app, promoting consumption and a higher frequency of purchasing products or services offered by the app [22]. Cho applied the expectation–confirmation model (ECM) and investment model (IM) verified that satisfaction has a positive effect on users’ relationship commitment to fitness and health apps [23]. Palas et al. applied the unified theory of acceptance and use of technology 2 (UTAUT2) model to find the Social Influence (SI), Hedonic Motivation (HM), Price Value (PV), Habit (HA), Service Quality (SQ), and Quality of Life (QL) are significant in determining the elderly’s intention to adopt and use m-health services [24], while the study did not further check for correlations among the factors. Shahriar et al. sought to model the impact of service quality on critical service outcomes in a transformative IT service research, directly applicable to B2C m-health service, which found that satisfaction is a major driver of positive quality of life (QOL) perception and continuance intentions [25]. Alper et al. found that the favorable service quality perceptions improve satisfaction, and five dimensions of availability, perceived risk, easy to use, compatibility of mobile devices, and entertainment services have a positive effect on customer satisfaction of mobile service quality, among which ease of use and availability seem to be the most important dimensions [26]. Issac validated the significant factors influencing users’ adoption of m-health services through perceived usefulness, perceived ease of use, perceived risk, mobile self-efficacy, and word-of-mouth (WOM) communications [27]. Based on the above factors, this paper further explores more factors affecting users’ satisfaction with m-health management apps. Although these studies found that satisfaction can influence various aspects of user behavior, continuous use, in-app purchases, and word of mouth, research exploring the impact of their correlations is lacking [28]. This study examines the factors and associations that influence user satisfaction with m-health management apps and which aspects of satisfaction may influence the continuous use of m-health management apps. In this regard, the development of new or enhanced app attributes requires efforts to listen to what users say, interpret what they express, and make inferences about what they think to observe how they use an app or service and to “uncover” what they know.

2.2. Kano Model-Based Approach to User Need Exploration

Different terms such as “needs”, “wants”, “features”, “requirements”, “benefits”, and “attributes” are sometimes used interchangeably across the marketing, engineering, and industrial design literatures. Research indicates that a useful representation of a product is a vector of attributes that also include customer needs, requirements, product specifications, and technical performance metrics [29].
Existing studies typically use classical models or build their own evaluation systems to gain insights into user needs, and they use them as the basis for further research on product requirement development and iteration strategies. For example, Yu et al. proposed an iterative analysis method for product requirements based on the Kano model and used it to assist decision-makers in development decisions [30]. Yaseen et al. used an iterative model to prioritize requirements and develop products in stages to improve efficiency [31]. Hu et al. conducted an in-depth study of user dynamic requirements based on the fuzzy Kano model and proposed an iterative innovation approach for enterprise products on this basis [32]. Lo refined Kano model for exploring the product attributes that improved the customers’ satisfaction to facilitate the sustainable development of the product [33]. Realizing the inadequacy of a single model for complex functional requirement analysis, other studies have integrated existing methods based on the characteristics of the studied products and constructed new research models. For example, Li et al. combined multiple analysis methods, such as the Kano model, fuzzy cluster analysis, the quality–functional unfolding method, and hierarchical analysis, to collaboratively solve the decision problem in new product development and design [34]. Rodado et al. integrated the Kano model, hierarchical analysis, decision laboratory analysis, and the quality–functional unfolding method to transform user requirements into product characteristics, and they optimized the design scheme, taking into account the interdependence between different requirements [35]. These research methods have obtained rich results in terms of demand insight, importance analysis and product development iteration, but there are still shortcomings in research on the attributes of and satisfaction with m-health management apps. First, the existing methods are not systematic enough to analyze the attributes of m-health management apps, the interactions between different attributes are not deeply considered, and the advantages and disadvantages of different design strategies cannot be distinguished. Second, the complex design evaluation process in product attribute prioritization cannot be visualized, and the importance of some design elements is difficult to quantify. Third, although some studies have used a combination of methods to mitigate the limitations of a single method, the actual implementation steps are cumbersome and have difficulty meeting the rapid iteration requirements of m-health management apps.
Therefore, it is important to explore efficient and clear models of user requirement insights and m-health management app development strategies with visual implementation paths. Given the strengths of the Kano model in analyzing the non-linear relationships between product attributes and user satisfaction and the advantages of the DEMATEL method in identifying the influence relationships between complex attribute categories, this study constructs an m-health management app requirement hierarchical model based on prioritizing the attributes that affect user satisfaction and through the influence relationships of key attributes to help decision-makers accurately identify core attributes and make rational development decisions.

2.3. Kano Model and DEMATEL Method
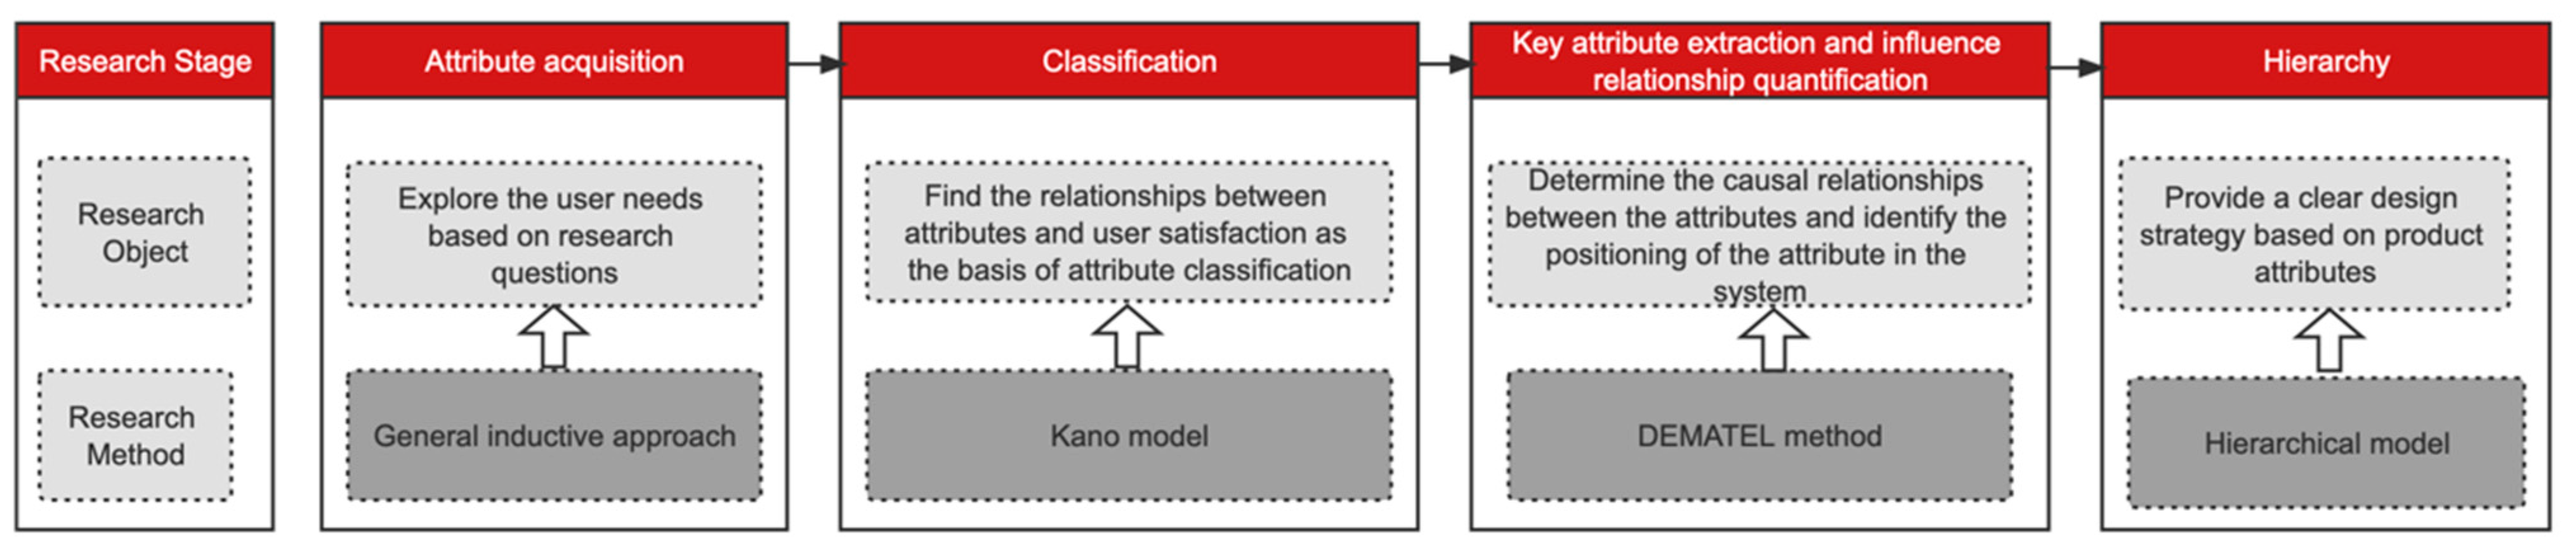
Multiple criteria decision-making (MCDM) is an important part of modern decision science, which is a scientific evaluation method to select the optimal scheme according to certain judgment criteria under the condition of multiple attributes. It solves the problem that it is difficult to evaluate accurately because of the fuzziness of users’ thinking and the uncertainty of objective things in reality [36]. For multi-attribute decisions, weight coefficients are used to reflect the importance degree. Currently, there are a variety of methods for determining weight coefficients, which can be roughly divided into two categories. One is weighting based on empirical subjective judgment, such as AHP, KANO model, and expert survey method. The other is to establish a mathematical model to determine the weight of each factor, such as principal component analysis, DEMATEL analysis, ISM analysis, and so on. The subjective weighting method has strong randomness, unstable accuracy, and reliability. The objective weighting method uses a mathematical model to calculate the weight. In some cases, the result is often difficult to explain. Therefore, in order to make the sorting result of multi-attribute decision-making more scientific, different decision principles can be combined to make the result synthesize subjective information and objective information. In terms of subjective criteria, the methods of demand evaluation include related research on user demand clustering and KANO model of presenting user satisfaction. In terms of objective criteria, the set method of demand evaluation has DEMATE, which is often used to show the advantages and disadvantages of demand and its influence relationship. This paper aims to explore a user demand-oriented combination multi-attribute decision model based on the entry point of demand evaluation so as to guide the product demand development and iterative method research.
Using a structured questionnaire to classify the attributes of a given product or service, Noriaki Kano formally introduced the Kano model in 1984. In recent years, as a typical qualitative analysis model [37], the Kano model has been mainly applied to analyze different user needs in the pre-product design stage. The DEMATEL method, also known as decision laboratory analysis, was introduced in 1971 by American scholars A. Gabus and E. Fontela at the Battelle Conference in Geneva, and it is mainly used to screen the main elements of complex systems and to simplify the process of system structure analysis. In essence, this method views complex systems as directed graphs with weights and solves complex and difficult problems in the real world through graph theory, matrix tools, and related mathematical theories. The influential network relationship map (INRM) is the main tool of the DEMATEL method for problem analysis. An INRM identifies the causal relationships between attributes and the position of each attribute in the system and helps decision-makers understand and study intricate problem clusters and uncover feasible solutions. Currently, the DEMATEL method is widely used in e-commerce data quality analysis, complex network information identification, and system critical influence factor identification [38].
Both the Kano model and the DEMATEL approach have distinct advantages and disadvantages when separately applied to user requirement insights, as shown in Table 1. However, by integrating the two, they can complement each other’s strengths and weaknesses, thus helping decision-makers find the focus of product attribute development and iteration and formulate more accurate design strategies despite a lack of time and resources.

3. Methodology

To pinpoint the attributes that affect user satisfaction with m-health management apps, improve the efficiency of app attribute prioritization and conversion, and help decision-makers better design and iterate, this study uses the advantages of the Kano model and DEMATEL method to establish an attribute acquisition-classification-key attribute extraction and influence relationship quantification-hierarchy product attribute hierarchical model, as shown in Figure 1.
First, the attributes were obtained by mining the needs of specific groups of people, including the overall usage of an m-health management app, the concerns at different stages, the factors influencing the willingness to use, etc. A general inductive approach was used to code the attributes. Second, the Kano model was used to classify the attributes, determine the non-linear relationships between the attributes and user satisfaction, and classify the attributes. Finally, by combining the Kano model and DEMATEL method to build a hierarchical model of m-health management app attributes, clear and complete insights into user requirements can help decision-makers formulate development strategies in a more efficient and targeted manner. The above model construction idea is shown in Figure 2.

3.1. Participants

A total of 510 participants took part in the survey and were divided into three groups.
In the stage of user need acquisition based on the general inductive approach, 36 users were interviewed offline, including 24 expert users and 12 general users. In the phase of Kano model application to determine the attributes, 452 users were surveyed in an online questionnaire. In the phase of DEMATEL method application to identify the influence relationships among the attributes, 22 experts were invited offline to complete the questionnaire. The experts in this study were researchers in health management, health application developers, designers and planners. This study adopted a non-random sampling or purposive sampling approach. The questionnaire survey was administered online and offline with m-health management app users. The population was defined as the users who had experience of using mobile telemedicine services in the past 12 months. Those who agreed to be interviewed were explained the academic purpose of the study with adequate assurance of anonymity and freedom of not answering particular questions or withdrawing from the interview at any stage. The participants’ demographic characteristics are listed in Table 2. The analysis of the characteristics of the respondents participating in the research (Table 2) showed that more women (55.9% of responses) completed the survey. Important information about potential users was obtained by analyzing the ages of the respondents. Older people constituted a small percentage of the respondents (15.5% aged 45–54 and 4.9% aged over 55). These people are less likely to use an m-health management app. The respondents were mostly young people, up to 45 years old. These apps are popular among those who want to live healthy lives, especially young people.

3.2. Instruments

3.2.1. Acquisition of Attributes Based on the General Inductive Approach

Using the general inductive approach to code needs, this study carried out in-depth mining of the needs of m-health management app users. The specific process is shown in Figure 3. First, the interview outline was formulated through literature research and competitor analysis. Second, semi-structured in-depth interviews were conducted with the target group, combining data on user background and consumption habits to determine users’ needs and influencing factors for using an m-health management app. A total of 36 people were interviewed, including 24 expert users and 12 general users. Again, preliminary user satisfaction and relevant suggestions were obtained. Based on the interview data, the original attributes were derived, and a five-point Likert scale was used to create the attribute importance questionnaire, which was sent back to the users to form a preliminary consideration of the original attributes. Finally, the research results were combined to integrate and classify the attributes of the whole process of the users.

3.2.2. Application of the Kano Model to Determine the Core Attributes and Their Relationships with User Satisfaction

The Kano model was used to categorize attributes and their level of priority based on the following implementation steps:
(1) Questionnaire preparation: Specific attributes were summarized on the basis of the general inductive approach, including both m-health management app service demand and usability, to gain a comprehensive understanding of user feedback on m-health management apps and the relationship between attributes and satisfaction. The questionnaire was designed to include (a) the basic personal information of the user, including his or her gender, age, occupation, current health status and issues of concern; and (b) 26 attributes. For each functional attribute item, positive and negative questions were set, and a combination of a five-point Likert scale and a Kano questionnaire was used to design the questionnaire content, as shown in Table 3. First, the pre-study questionnaires were distributed and collected, and then the official questionnaires were revised and improved. A total of 498 questionnaires were collected.
(2) Data processing: The collected questionnaires were sorted and screened, and invalid questionnaires were excluded. To obtain more intuitive relationships between the attributes and user satisfaction, the satisfaction and dissatisfaction coefficients of each attribute were calculated based on the better–worse index formula proposed by Berger [39], and undifferentiated needs and reverse needs were excluded from the calculation. The specific formulae are listed as follows.
When an m-health management app provides this attribute, the better factor is calculated as follows:
Better (Bei) = (A + O)/(A + O + M + I)
When an m-health management app does not provide this attribute, the worse factor is calculated as follows:
Worse (Woi) = (O + M)/(A + O + M + I) ∗ (−1)
A, O, M, and I represent the number of attractive, one-dimensional, must-have, and indifferent attributes, respectively. Better is the satisfaction coefficient after an increase, which means that by providing the attributes, user satisfaction will increase. The closer Bei is to 1, the higher the growth rate of user satisfaction. Worse is the dissatisfaction coefficient after elimination, which means that by not providing the attributes, user satisfaction will decrease. The closer Woi is to −1, the higher the effect of decreasing satisfaction. This formula is used to measure the degree of impact on user satisfaction when an attribute is provided versus not provided. Based on the Bei and Woi values, an attribute quartile diagram is drawn, and the attributes are categorized to guide decision-makers in prioritizing requirements.

3.2.3. Application of the DEMATEL Model to Clarify the Influence Relationships among the Attributes

Given that the Kano model only provides an understanding of the attributes and user satisfaction, the objective influence relationships between the attributes were further explored using expert evaluations in conjunction with the DEMATEL method.
The specific calculation steps were as follows.
(1) Quantify the interrelationships between the attributes to obtain direct impact matrix X.
Twenty-two experts were invited to complete the DEMATEL questionnaire. The experts, who were anonymous and did not communicate with each other, made a two-by-two comparison of the attributes. Attribute di and demand dj were compared twice in terms of the direct influence of attribute di on attribute dj and the direct influence of attribute dj on attribute di. For the whole system, there were n attributes, and n(n − 1) comparisons were made. The attributes themselves were not compared, i.e., the values on the diagonal of the matrix are usually represented by 0. Each expert judged the degree of interaction between the attributes based on his or her expertise and experience in the field and scored them (where 0 means no impact, 1 means a slight impact, 2 means a fair impact, 3 means a large impact, and 4 means a very large impact). The average direct impact matrix X was obtained by calculating the arithmetic mean of the experts’ scores.
X = [ 0 x n 1 x 1 n 0 ]
(2) Conducting normalization directly affects matrix N.
k = m a x { m a x j = 1 n x i j ,   i = 1 n x i j   }              
    N = 1 k X
(3) Solve for the integrated influence matrix T.
T = lim k + ( N 1 + N 2 + + N k )
(4) Set thresholds and output information on the coordinates of the INRM.
The INRM is constructed on the basis of information from the integrated influence matrix T. The degree of influence D, the degree of being influenced R, the horizontal vector centrality (D+R), and the vertical vector causality (D−R) are four measures of the degree of influence of the elements in the system and are calculated based on the integrated influence matrix T. The information on each coordinate is shown in Table 4. When there are many attributes and complex interactions, considering all the interactions between the factors would result in an INRM that is too complex to reveal valuable decision information. Typically, a threshold is used in this type of study to filter out the weaker influence relationships. The threshold value is generally taken as the mean value of matrix T and may be adjusted from the mean value as appropriate to the situation. Once the threshold is determined, all values in matrix T that are less than the threshold are set to 0, i.e., only those greater than the threshold are displayed in the influence causality diagram, thus producing a clearer causality diagram.
(5) Divide the INRM into four quadrants
By calculating the average of the horizontal vector centrality (D+R) and vertical vector causality (D−R), the INRM is divided into four quadrants from I to IV, as shown in Figure 4.
Each quadrant in the four-quadrant influence causality diagram represents a different meaning and characteristic, and the position of a specific attribute in the diagram can be used to determine the attribute category to which it belongs. The attributes in quadrant I are considered to be core needs with high influence and relevance. The attributes in quadrant II are considered to be driving needs with low influence but high relevance. The attributes in quadrant III are called independent needs and have low influence and relevance. The attributes in quadrant IV are called influence needs and have high influence but low relevance; these attributes are influenced by other attributes and cannot be improved upon directly.

3.2.4. Attribute Hierarchical Model for M-Health Management Apps

Based on the work above, an m-health management app attribute hierarchical model was constructed. The model includes a target layer, a Kano criterion layer, a DEMATEL criterion layer, and a requirement hierarchy table. The target layer is an iterative strategy for m-health management app attributes. The Kano criterion layer provides an initial prioritization of m-health management app attributes, which will be ranked by priority in the order of “M > O > A > I”. The DEMATEL criterion layer further prioritizes m-health management app attributes based on the weights calculated by expert opinions. These attributes and their interactions are identified by the INRM as key attributes, and they are further classified based on the quadrant I > quadrant II > quadrant III > quadrant IV ranking of the DEMATEL. The attributes within the same DEMATEL quadrant are ranked in descending order of centrality. After the qualitative and quantitative consideration of all the attributes, a hierarchy of attributes is formed, as shown in Figure 5.

4. Results

4.1. Attributes for M-Health Management Apps

In the actual interview process, the interview with the 35th user (an expert user) was found to be saturated with stage information. Thus, the results of this interview ensured that a complete set of original attributes could be obtained. The interview transcripts were collated to produce 20 original attributes, and then, an importance questionnaire was formed based on the original attributes. The arithmetic average of the users’ questionnaire scores was taken as the importance of the original attributes Hi, completing the initial ranking of the original attributes, as detailed in Table 5. To obtain a fuller picture of users’ needs and opinions, two open-ended questions were added to the original attribute importance questionnaire, i.e., each user was asked to add an attribute that was not mentioned or to delete an unimportant original attribute and give a reason for doing so.
Based on the importance score and user feedback, the lowest scoring attribute, “expert consultation”, was eliminated, mainly due to its low achievability and credibility in m-health management apps. In addition, based on user suggestions, the original attributes were adjusted, and after addition and deletion, 26 attributes were finally identified and divided into four categories: A. health data acquisition, B. health management scheme customization, C. health management supervision, and D. m-health management app usability. The details are shown in Table 6.

4.2. Core Attributes and Their Relationships with User Satisfaction

A total of 498 questionnaires were collected during the survey. The selection criteria included setting reverse questions, non-repetitive options, and a moderate response time. On this basis, 46 non-target users with “low health management needs” were excluded, and 452 valid questionnaires were obtained. Among them, 198 respondents with “high health management needs” accounted for 44%, and 254 respondents with “health management needs” accounted for 56%. The reliability of the questionnaire was tested using the Cronbach’s Alpha, and the value was 0.810 (higher than 0.8), indicating good reliability. The validity of the questionnaire was analyzed using the Kaiser–Meyer–Olkin (KMO) and Bartlett tests. The KMO coefficient was 0.748 (higher than 0.6) and significant at p < 0.0005. The reliability and validity of the questionnaire data were good.
The satisfaction coefficient Bei and dissatisfaction coefficient Woi for each attribute were calculated using the better–worse index formula in the Kano model. The information is shown in Table 7. Among the 26 functional attributes, 2 are must-have attributes (M), 7 are one-dimensional attributes (O), 8 are attractive attributes (A), and 11 are indifferent attributes (I).
Based on the satisfaction factor Bei and dissatisfaction factor Woi for the attributes, a four-quadrant attribute map and an indication of the attribute type were created. This map helped to provide a more precise indication of must-have and other types of attributes, as shown in Figure 6. In reality, many attributes were a mix of features. Only two attributes, D25 and A1, were located in the lower right corner of the map, and they were purely must-have features. These attributes must absolutely be among the attributes of an m-health management app; otherwise, users will not want to use its services. Regarding attributes A3, D23, D22, D26, D24, and B10, which were located in the upper right corner of the map, they were one-dimensional attributes. Combining the relationship between the Kano model demand classification and the influence of satisfaction [28], it can be said that when an m-health management app provides desired demand items, it may enhance user satisfaction. Most of the points were on the left side of the map, indicating that they were attractive or indifferent attributes. When an m-health management app provides attractive attributes, it may enhance user satisfaction. Indifferent attributes have a low impact on user satisfaction.

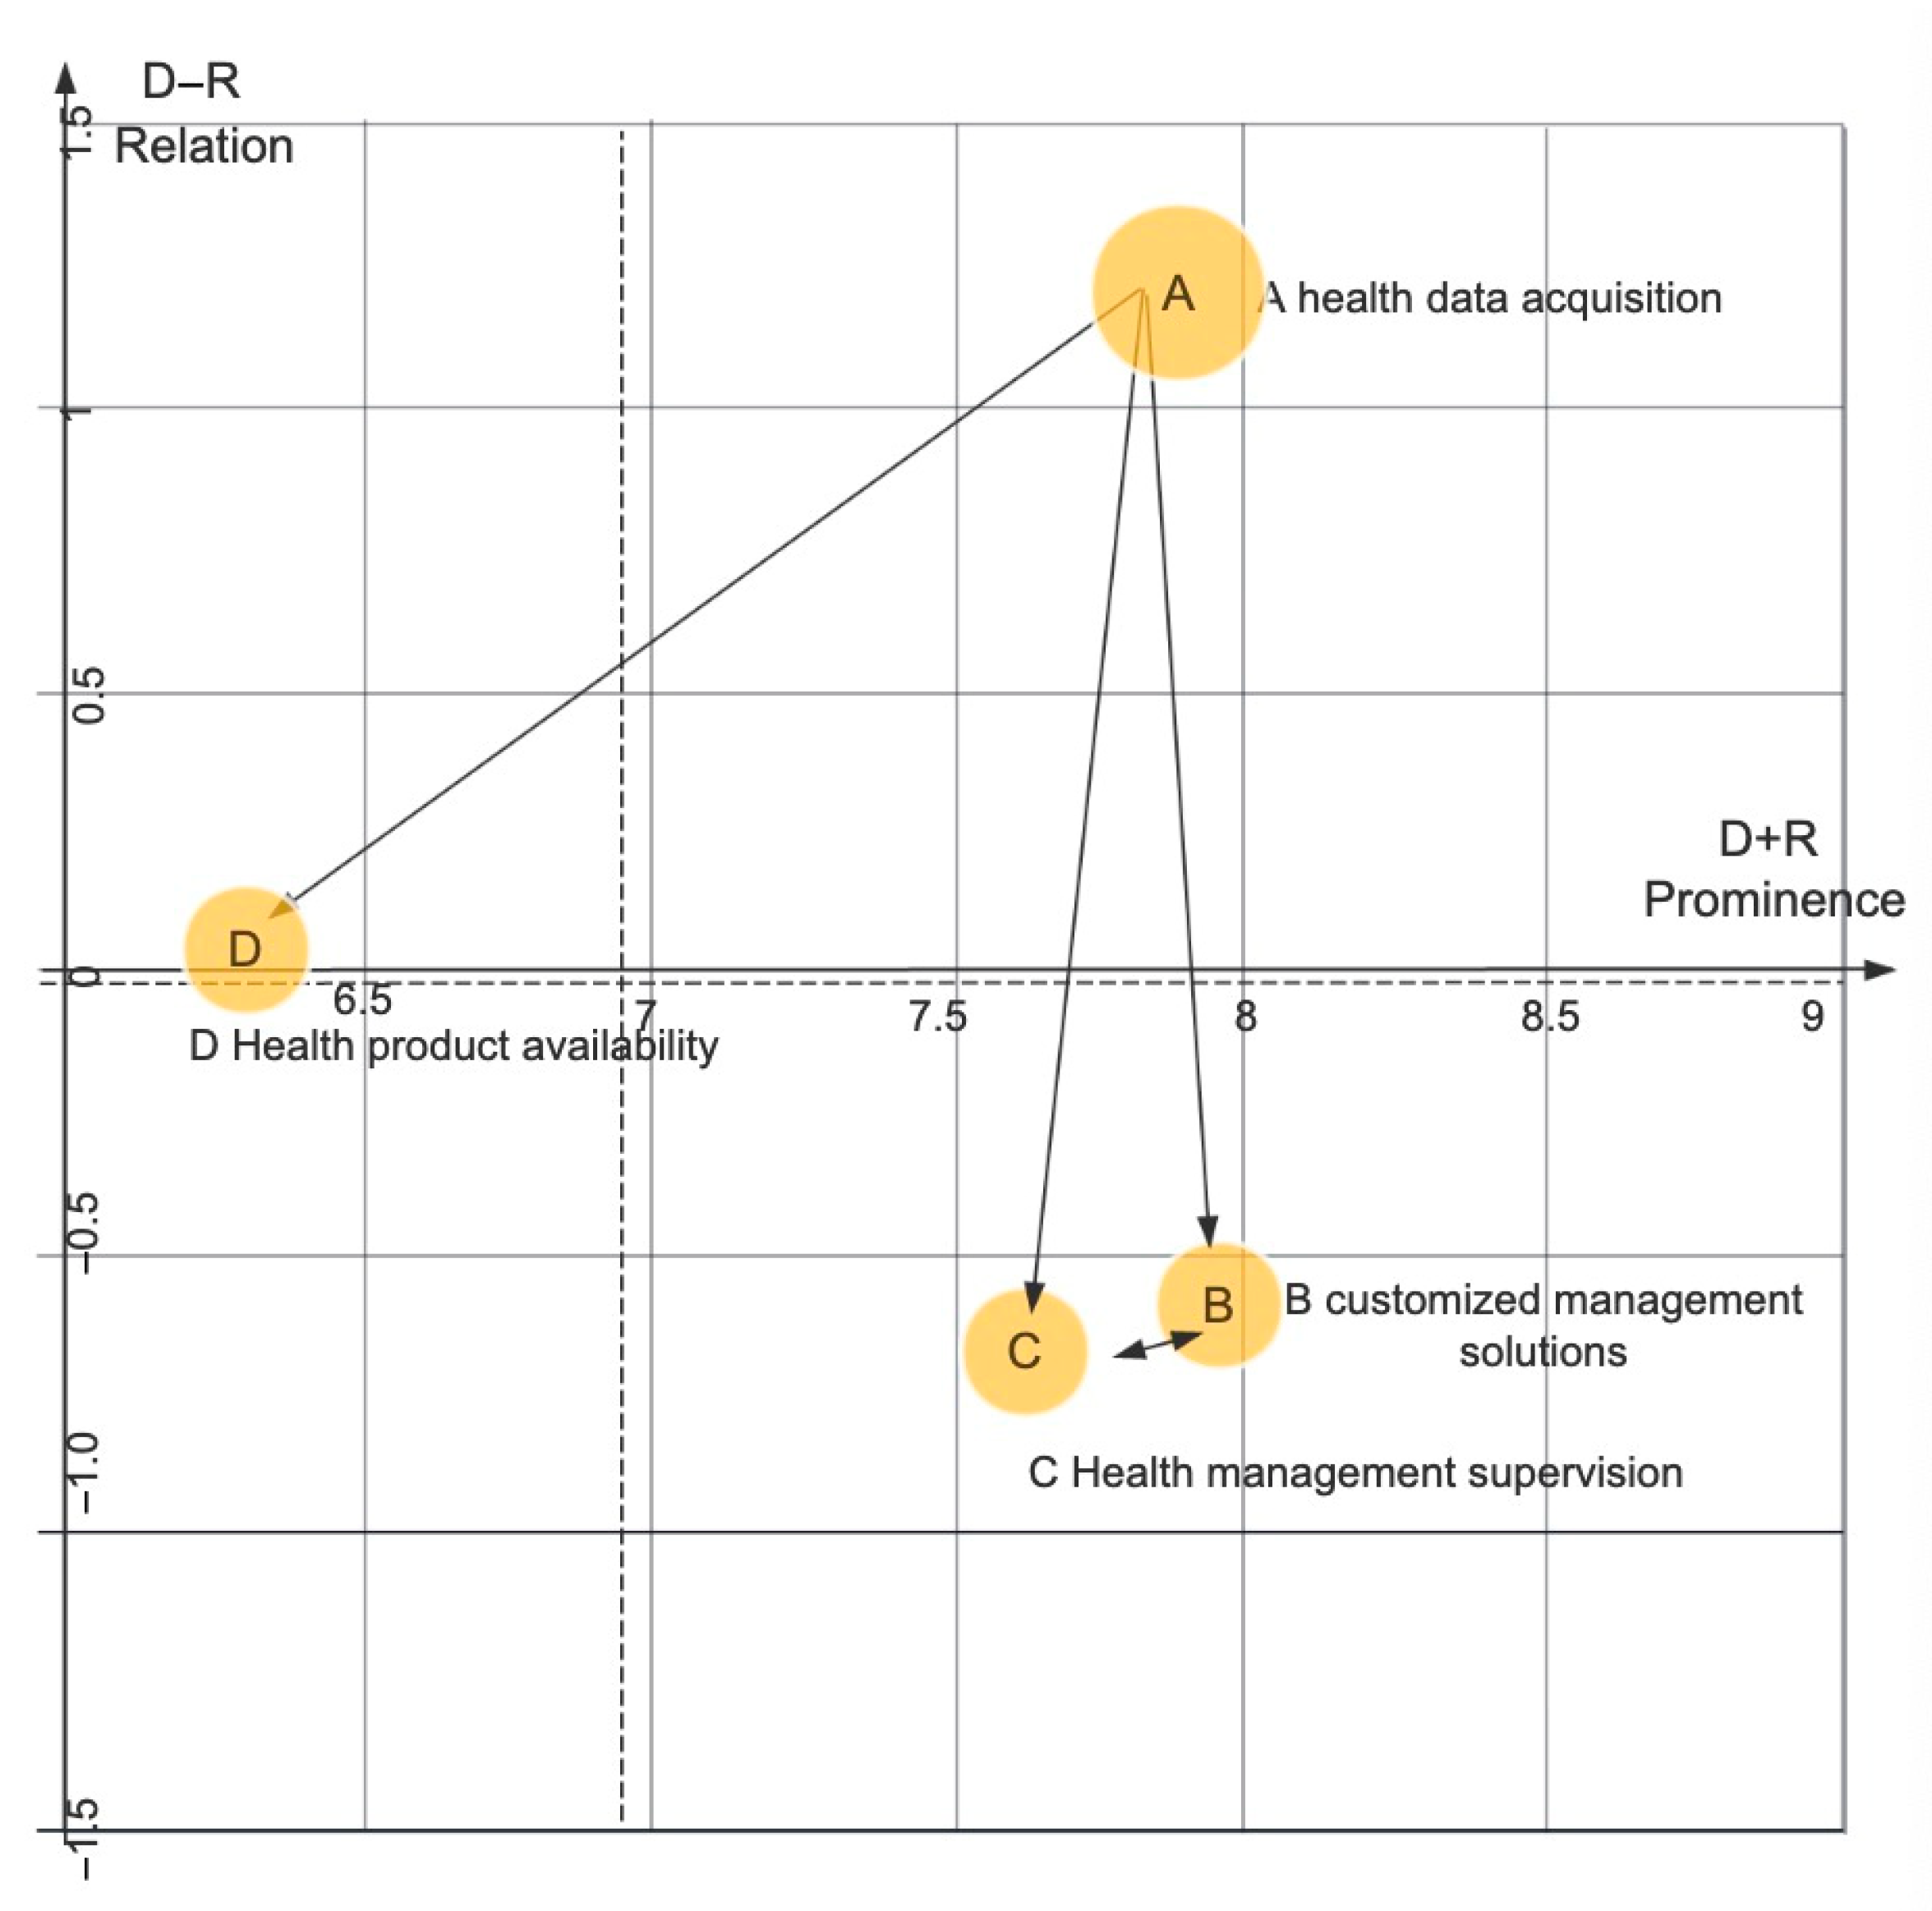
4.3. Extraction of Core Attributes and Quantification of Influence Relationships

Based on the results of the Kano model analysis, DEMATEL was used to explore the influence relationship between different attributes to further explore m-health management app satisfaction in a systematic way. To scientifically assess the influence relationships between the attributes, 22 experts with knowledge of and a background in health management and experience in m-health management apps were separately invited to complete the DEMATEL questionnaire. The experts first scored the influence relationships between two of the four categories of attributes (A, B, C, and D) and completed a 4 × 4 matrix questionnaire to help them become more familiar with the rules of completing the questionnaire. This step was followed by scoring a 26 × 26 matrix table made of 26 attributes to obtain a score for the two-by-two attribute influence relationships.
The INRM coordinates were calculated using the integrated influence matrix T, as shown in Table 8. The INRMs for the four categories of attributes were plotted, as shown in Figure 7. Based on the data results, the four categories of attributes were judged to be ranked as follows: A. health data acquisition > D. health product availability > B. customized management solutions > C. health management supervision. A. health data acquisition is a core attribute, highly influential and highly relevant in the overall health management process. Therefore, it should be given the highest priority for management interventions at this stage of health data acquisition. D. health product availability, which is a causal attribute, is of lower importance, and the order of iteration can be determined by the cost of iterating on this need. B. customized management solutions and C. health management supervision are in the fourth quadrant and are result attributes, which are influenced by other attributes and cannot be improved directly; rather, they need to be improved by improving the source attributes that affect them.
The INRM coordinate information for the 26 attributes is shown in Table 9. To keep the complexity of the attribute interdependencies manageable, the threshold was set to 0.16 through expert discussion. That is, only the top 30% of causal relationships were retained, and the causal relationships between attributes were displayed and plotted with directed arrows (as in Figure 8), visualizing the influence and influenced relationships between the 26 attributes and the associated attributes. This visualization can be used by decision-makers to gain more visual insight into the key requirements.

4.4. M-Health Management App Attribute Hierarchical Model

Based on the m-health management app attribute ranking hierarchical model, an attribute ranking table was drawn, and the 26 attributes were reordered as shown in Figure 9, allowing for more intuitive data comparison and attribute ranking information.
The comparison between the ranking based on the combined method and the ranking based on the Kano model alone in Figure 9 shows the strength of the results of this study. For example, although attributes such as B10, B11, and C18 are ranked highly when the Kano model is applied alone, the influence relationship between the attributes is ignored. Based on the INRM analysis, the three attributes mentioned above are classified as influence attributes. Thus, their functionality should be implemented or enhanced by first improving their source attributes, and therefore, the importance or development order in the actual development of m-health management apps should be adjusted downwards. In addition, the indifferent attributes classified by the Kano model cannot be ignored in some cases. For example, although B8 is an indifferent attribute, it is classified as a core need with a high degree of centrality and causality and may evolve into an attractive attribute in the future. Therefore, this attribute can be considered a key element to attract potential users.
Specifically, there are two main ways to use Figure 8 and Figure 9. The first is to conduct an m-health management app attribute prioritization insight analysis in accordance with Figure 9; the second is to output iterative strategies for attributes that are in urgent need of improvement to improve user satisfaction and the efficiency of app development and iteration. Due to length restrictions, this paper provides exemplary analysis of only some of the attributes in the m-health management app attribute prioritization of must-have attributes, one-dimensional attributes, and attractive attributes.
Functional attributes positioned in the must-have and core need categories are essential and important to users and have a high impact. The realization or optimization of these attributes will not only improve user satisfaction but also improve the performance of other related functions and thus increase app competitiveness. Thus, companies should give priority to them. For example, A1 is an essential and core attribute, the presence or absence of which has a significant impact on user satisfaction. At the same time, the causality diagram shows that there are many attributes associated with it. Attributes with a greater than average centrality (e.g., B11, B8, and B10) are all influenced by A1; thus, this demand should receive great attention. The user interviews show that the core concern of m-health management app users lies in matching recommendations and personalized management based on personal characteristics. Function A1 has been developed to meet the needs of users for better personalization and accurate matching.
Attributes that are positioned in the must-have and independent need categories have a low influence, are independent, and are not the focus of user attention. They only need to provide an appropriate level of functionality but must avoid providing a level that is too low and leads to user dissatisfaction. For example, the majority of users care about D25, indicating that users have high requirements for the operability of health management apps and are more concerned with simple and straightforward operation. In addition, apps that are easy to learn and use can reduce the burden on users’ memory, make the app feel friendly, be more attractive to the user, and increase the usability of the app.
Attributes that are positioned in the categories of one-dimensional and influence needs, it directly affects user satisfaction with the app, are the key issues that need to be addressed. However, as influence attributes are influenced by other related attributes to a greater extent, direct improvements to them may be ineffective or inefficient. For example, the implementation of B10 needs to be based on the implementation of A1, A6, and A4 to be effective. In this case, the app must consider how to develop and refine the source attributes for such attributes.
App development and iteration should consider the costs and benefits of dealing with demand as a whole, as the attributes are positioned in the category of attractive and driving needs, which are highly attractive but affect only a small number of other attributes. For example, regarding C16, although studies have shown that users are averse to distracting ads, actual research results show that users are highly appreciative of the ability to discuss socially without advertising; additionally, if this need is met, user satisfaction will increase exponentially. However, the removal of advertising as part of a platform’s revenue will reduce revenue. Thus, the focus of addressing this need is on how to enhance the format and effectiveness of advertising while taking into account the wishes of users, ensuring that quality advertising matches the main function of the app, and better managing the online community environment.

5. Discussion

The Kano model captures users’ attention to each attribute, and the DEMATEL approach identifies dependencies and constraints based on the specific characteristics of the attributes and is used to analyze the dynamic and complex relationships among the associated attributes to analyze user satisfaction and continuous development strategies from a holistic perspective. For example, B11 (periodic assessment), which is positioned as an attractive and influencing attribute, is an important element in attracting users to use m-health management apps and is a key issue that needs urgent attention and resolution. However, B11 is an outcome attribute in the INRM influence causality diagram and is subject to other attributes, meaning that it cannot be improved directly and must be improved indirectly by refining other related attributes. As shown in Figure 8, there are many source attributes affecting B11, and to conduct an efficient analysis in limited resources, it is necessary to rank the attributes based on users’ concerns. That is, they can be considered in order of must-have, one-dimensional, attractive, and indifferent attributes, depending on the actual situation. However, the order of attribute importance cannot be directly equated with the actual development strategy of an app. Rather, it only provides a prioritization suggestion and insights into the idea of app attributes and satisfaction enhancement. In actual cases, it is still necessary to conduct app development on the basis of ranking and optimizing the relevant influencing factors one by one. For example, although A3 is relatively important, it does not contribute as effectively to B11 as A7, A5, and A2, which are pre-data acquisition-related attributes. Thus, the actual development strategy for m-health management apps may be adjusted appropriately based on the above order.

6. Conclusions

For m-health management app attributes and user satisfaction enhancement, it is necessary to consider the matching of organizational resource allocation capabilities with user demand enhancement and how to quickly find core attributes. The study combines the Kano model with the DEMATEL method to construct a comprehensive analytical model that provides a more comprehensive understanding of users’ perceived and behavioral needs for m-health management apps, explaining the impact and correlations of the complex needs of m-health management app users. It can help decision-makers comprehensively observe the interplay between requirements, more accurately identify the levels of priority of attributes, better understand users’ continuous use intentions towards m-health management apps, and improve the efficiency of app attribute iteration, thereby enhancing user satisfaction and app sustainability.
The results of this study have both theoretical and practical implications. From a theoretical perspective, this research helps to identify the influencing factors of m-health management apps, and it constructs a Kano model of user satisfaction based on the calculated appeal and derived importance. Combined with DEMATEL analysis, this research also identifies the strongest drivers or predictors of users’ use of m-health management apps and the cascading influence relationships of the factors. Increased user satisfaction ensures long-term business success through customer loyalty. More importantly, measuring and delivering what users truly want will enable companies to gain insights into which value elements are more important than others and how they interact with each other. When optimally combined, they translate into successful business performance.

7. Limitations and Future Research Directions

This study still has some limitations. Due to the complexity of the influencing factors of m-health management apps, although the research team collected data with as wide a coverage as possible, it was influenced by realistic conditions and did not take into account influencing factors such as users’ cultural habits, educational background, economic conditions, and geographical differences, and the specific derived satisfaction improvement solutions and app iteration strategy focus may be biased. In future research, more influencing factors (city distinctions, economic and cultural levels, etc.) can be incorporated into the model research.

Author Contributions

Conceptualization, J.W. and Y.F.; methodology, Y.F.; formal analysis, X.Y. and W.W.; investigation, Y.F.; data curation, Y.W.; writing—original draft preparation, J.W. and Y.F.; writing—review and editing, Y.F. and Y.W.; visualization, Y.F.; funding acquisition, Y.F. All authors have read and agreed to the published version of the manuscript.

Funding

This research was supported in part by the Pre-research Foundation of Zhejiang University of Technology under Grant SKY-ZX-20220255.

Institutional Review Board Statement

The study was conducted in accordance with the Declaration of Helsinki, and approved by the Ethics Committee of Institute of Industrial Design of Zhejiang University of Technology (protocol code 0803/2021 and date of approval 3 August 2021).

Informed Consent Statement

Informed consent was obtained from all subjects involved in the study.

Data Availability Statement

The data presented in this study are available on request from the corresponding author.

Acknowledgments

All participants gave their informed consent for inclusion before they participated in the study. We are grateful to all the participants in the study.

Conflicts of Interest

The authors declare no conflict of interest.

Correction Statement

This article has been republished with a minor correction to the Funding statement. This change does not affect the scientific content of the article.

References

  1. Pires, I.M.; Marques, G.; Garcia, N.M.; Flórez-Revuelta, F.; Oniani, S. A Research on the Classification and Applicability of the Mobile Health Applications. J. Pers. Med. 2020, 10, 11. [Google Scholar] [CrossRef] [PubMed]
  2. Kongjit, C.; Nimmolrat, A.; Khamaksorn, A. Mobile health application for Thai women: Investigation and model. BMC Med. Inform. Decis. Mak. 2022, 22, 202. [Google Scholar] [CrossRef] [PubMed]
  3. Yin, M.; Tayyab, S.; Xu, X.Y.; Jia, S.W.; Wu, C.L. The Investigation of Mobile Health Stickiness: The Role of Social Support in a Sustainable Health Approach. Sustainability 2021, 13, 1693. [Google Scholar] [CrossRef]
  4. Hajesmaeel-Gohari, S.; Khordastan, F.; Fatehi, F.; Samzadeh, H.; Bahaadinbeigy, K. The most used questionnaires for evaluating satisfaction, usability, acceptance, and quality outcomes of mobile health. BMC Med. Inform. Decis. Mak. 2022, 22, 22. [Google Scholar] [CrossRef] [PubMed]
  5. Chiu, W.; Cho, H. The role of technology readiness in individuals’ intention to use health and fitness applications: A comparison between users and non-users. Asia Pac. J. Mark. Logist. 2020, 33, 807–825. [Google Scholar] [CrossRef]
  6. Miao, H.; Wang, Y.; Huang, L.; Wu, F.; Li, X. Research on User Functional Requirements Mining Based on Structured Topic Model. J. Intelli. 2020, 39, 134–141. [Google Scholar]
  7. Nisha, N.; Iqbal, M.; Rifat, A. The Changing Paradigm of Health and Mobile Phones: An Innovation in the Health Care System. J. Glob. Inf. Manag. 2019, 27, 19–46. [Google Scholar] [CrossRef]
  8. Wu, P.Z.; Zhang, R.; Zhu, X.; Liu, M. Factors Influencing Continued Usage Behavior on Mobile Health Applications. Healthcare 2022, 10, 208. [Google Scholar] [CrossRef]
  9. Yang, X.; Ma, L.; Zhao, X.; Kankanhalli, A. Factors influencing user’s adherence to physical activity applications: A scoping literature review and future directions. Int. J. Med. Inform. 2020, 134, 104–139. [Google Scholar] [CrossRef]
  10. Luo, Y.; Wang, G.; Li, Y.; Ye, Q. Examining Protection Motivation and Network Externality Perspective Regarding the Continued Intention to Use M-Health Apps. Multidiscip. Digit. Publ. Inst. 2021, 18, 5684. [Google Scholar] [CrossRef]
  11. Yan, M.; Filieri, R.; Raguseo, E.; Gorton, M. Mobile apps for healthy living: Factors influencing continuance intention for health apps. Technol. Forecast. Soc. Chang. 2021, 166, 120644. [Google Scholar] [CrossRef]
  12. Lee, C.; Lee, K.; Lee, D. Mobile Healthcare Applications and Gamification for Sustained Health Maintenance. Sustainability 2017, 9, 772. [Google Scholar] [CrossRef]
  13. Mzaa, B.; Mrh, C.; Wang, H.D.; Zb, E. Factors influencing the adoption of mHealth services in a developing country: A patient-centric study. Int. J. Inf. Manag. 2020, 50, 128–143. [Google Scholar]
  14. Hsu, J.; Liu, D.; Yu, Y.M.; Zhao, H.T.; Chen, Z.R.; Li, J.; Chen, W. The Top Chinese Mobile Health Apps: A Systematic Investigation. J. Med. Internet Res. 2016, 18, e222. [Google Scholar] [CrossRef]
  15. Degavre, F.; Kieffer, S.; Bol, D.; Dekimpe, R.; Desterbecq, C.; Pirson, T.; Sandu, G.; Tubeuf, S. Searching for Sustainability in Health Systems: Toward a Multidisciplinary Evaluation of Mobile Health Innovations. Sustainability 2022, 14, 5286. [Google Scholar] [CrossRef]
  16. Grabara, J. Sustainable Development—Never Fulfilled Dream. Access Success 2019, 20, 565–570. [Google Scholar]
  17. Iyengar, S. Chapter 12—Mobile health (mHealth). In Fundamentals of Telemedicine and Telehealth; Gogia, S., Ed.; Academic Press: Cambridge, MA, USA, 2020; pp. 277–294. [Google Scholar]
  18. Istepanian, R.S.H. Mobile Health (m-Health) in Retrospect: The Known Unknowns. Int. J. Environ. Res. Public Health 2022, 19, 3747. [Google Scholar] [CrossRef]
  19. Edwards, P.; Patel, V.; Haines, A. The effectiveness of mobile-health technologies to improve health care service delivery processes: A systematic review and meta-analysis. PLoS Med. 2013, 10, e1001363. [Google Scholar] [CrossRef]
  20. WHO. Use of Appropriate Digital Technologies for Public Health, Provisional Agenda Item 12.4 (A71/20). In Proceedings of the In Seventy-First World Health Assembly, Geneva, Switzerland, 26 May 2018. [Google Scholar]
  21. WHO. WHO Guideline: Recommendations on Digital Interventions for Health System Strengthening; WHO: Geneva, Switzerland, 2019; pp. 1–124. [Google Scholar]
  22. Hsu, C.-L.L.; Chuan, J. Effect of perceived value and social influences on mobile app stickiness and in-app purchase intention. Technol. Forecast. Soc. Chang. 2016, 108, 42–53. [Google Scholar] [CrossRef]
  23. Chiu, W. Consumers’ continuance intention to use fitness and health app: An integration of the expectation–confirmation model and investment model. Inf. Technol. People 2020, 34, 978–998. [Google Scholar] [CrossRef]
  24. Palas, J.U.; Sorwar, G.; Hoque, M.R.; Sivabalan, A. Factors influencing the elderly’s adoption of mHealth: An empirical study using extended UTAUT2 model. BMC Med. Inf. Decis. Mak. 2022, 22, 191. [Google Scholar] [CrossRef] [PubMed]
  25. Akter, S.; D’Ambra, J.; Ray, P.; Hani, U. Modelling the impact of mHealth service quality on satisfaction, continuance and quality of life. Behav. Inf. Technol. 2012, 32, 1225–1241. [Google Scholar] [CrossRef]
  26. Alperzer, M.T.A.; Argan, M. The effect of mobile service quality dimensions on customer satisfaction. Soc. Behav. Sci. 2013, 99, 428–438. [Google Scholar]
  27. Mensah, I.K. Understanding the Drivers of Ghanaian Citizens’ Adoption Intentions of Mobile Health Services. Front. Public Health 2022, 10, 906106. [Google Scholar] [CrossRef] [PubMed]
  28. Lien, C.-H.; Cao, Y.; Zhou, X. Service quality, satisfaction, stickiness, and usage intentions: An exploratory evaluation in the context of WeChat services. Comput. Hum. Behav. 2017, 68, 403–410. [Google Scholar] [CrossRef]
  29. Ahmad, N. Quality Attribute and Customer Satisfaction: Using Kano’s Model to Prioritize What Matters Most to Customers. J. Mark. Consum. Behav. Emerg. Mark. 2016, 1, 15–28. [Google Scholar] [CrossRef]
  30. Yu, H.; Si, C.; Wang, H. Research on Product Iteration and Service Innovation Based on Fuzzy KANO Model. Sci. Technol. Manag. Res. 2018, 38, 24–31. [Google Scholar]
  31. Yaseen, M.; Ibrahim, N.; Mustapha, A. Requirements prioritization and using iteration model for successful implementation of requirements. Int. J. Adv. Comput. Sci. Appl. 2019, 10, 121–127. [Google Scholar] [CrossRef]
  32. Hu, S.; Liu, J.; Wang, Y.; Guo, W.; Wang, N. Research on product iterative innovation design method based on user dynamic demand. Mod. Manuf. Eng. 2020, 000, 41–48. [Google Scholar]
  33. Lo, C.-H. Application of Refined Kano’s Model to Shoe Production and Consumer Satisfaction Assessment. Sustainability 2021, 13, 2484. [Google Scholar] [CrossRef]
  34. Li, M.; Zhang, J. Integrating Kano Model, AHP, and QFD Methods for New Product Development Based on Text Mining. Math. Probl. Eng. 2021, 2021, 2349716. [Google Scholar]
  35. Neira-Rodado, D.; Ortíz-Barrios, M.; De la Hoz-Escorcia, S. Smart product design process through the implementation of a fuzzy Kano-AHP-DEMATEL-QFD approach. Appl. Sci. 2020, 10, 1792. [Google Scholar] [CrossRef]
  36. Liu, Y.; Yang, Y.; Liu, Y.; Tzeng, G.H. Improving Sustainable Mobile Health Care Promotion: A Novel Hybrid MCDM Method. Sustainability 2019, 11, 752. [Google Scholar] [CrossRef]
  37. Mikulić, J.; Prebežac, D. A critical review of techniques for classifying quality attributes in the Kano model. Manag. Serv. Qual. Int. J. 2011, 21, 46–66. [Google Scholar] [CrossRef]
  38. Dey, U.; Kumar, A.; Ray, A.; Pradhan, B.B. Supplier Selection: Integrated Theory using DEMATEL and Quality Function Deployment Methodology. Procedia. Eng. 2012, 38, 3560–3565. [Google Scholar] [CrossRef]
  39. Berger, C.; Blauth, R.; Boger, D. Kano’s methods for understanding customer-defined quality. Cent. Qual. Manag. J. 1993, 2, 3–36. [Google Scholar]
Figure 1. Schematic diagram of the construction of the m-health management app attribute hierarchical model.
Sustainability 15 01101 g001
Figure 2. Implementation steps of the m-health management app attribute hierarchy.
Sustainability 15 01101 g002
Figure 3. General inductive approach for the attribute coding process.
Sustainability 15 01101 g003
Figure 4. Four-quadrant INRM.
Sustainability 15 01101 g004
Figure 5. Hierarchical model of m-health management app attributes.
Sustainability 15 01101 g005
Figure 6. Four quadrants based on the better–worse coefficient analysis of attributes based on the Kano questionnaire.
Sustainability 15 01101 g006
Figure 7. INRM of the four types of attributes.
Sustainability 15 01101 g007
Figure 8. INRM of the 26 attributes.
Sustainability 15 01101 g008
Figure 9. Ranking of the attributes for m-health management apps.
Sustainability 15 01101 g009
Table 1. Advantages and disadvantages of the Kano model and DEMATEL method.
Research MethodAdvantagesDisadvantages
Kano ModelRational allocation of resources through prioritized classification to increase user satisfaction or minimize dissatisfaction, when solving the market positioning problem of product attributes, satisfaction evaluation is used as a typical qualitative analysis model in the early stage of auxiliary research.Product development efficiency suffers when certain design features or inter-influence relationships between requirements cannot be identified when implemented alone.
DEMATEL MethodEnables effective analysis of the interactions between different factors (direct and indirect), it helps to understand the complex causal relationship in decision problems.
Visualizes the interrelationship of influencing factors, which are used to determine the hierarchy of functional requirements, identify key evaluation criteria, and measure the weight of the evaluation criteria.
Prioritization of requirements based only on interdependencies, with other criteria (e.g., user satisfaction) not included as a basis for decision-making.
The relative weights of experts are not considered when aggregating their individual judgements into the group assessment.
Table 2. Demographic characteristics (N = 510).
Demographic CharacteristicsNumber of RespondentsFrequencyPercentage (%)
GenderMale22544.1
Female28555.9
Age18–24 Years12825.1
25–34 Years17333.9
35–44 Years10520.6
45–54 Years7915.5
55 and above254.9
EducationHigh school and below458.8
Pre-University/Certificate/Diploma9117.8
Undergraduate (Bachelor’s Degree)23946.9
Postgraduate (Doctorate/Master’s Degree)13526.5
Table 3. Kano questionnaire.
DemandQuestionDislikeTolerableDoes Not MatterBehooveLike
Functional AttributeMeets requirements12345
Does not meet requirements12345
Table 4. Detailed definition of INRM coordinate information.
Coordinate InformationDefinition
Degree of influence DIs the sum of the values of the rows of matrix T and represents the combined influence of the corresponding element of each row on all other elements
Degree of being influenced RIs the sum of the values of the columns of matrix T, indicating the combined influence of the corresponding element in each column by all the other elements
Horizontal vector centrality (D+R)Indicates the position of the element in the system of impact factor indicators and the magnitude of the role that it plays, i.e., the degree of importance between each element in the overall system; the influence of the factor on the system as a whole and the influence of other system elements on that factor
Vertical vector causality (D−R)Indicates the degree of influence of the element on the system; a positive value of (D−R) indicates a causal factor, indicating that the factor has a strong influence on other factors; a negative value of (D−R) indicates an outcome factor, indicating that the factor is strongly influenced by other factors
Table 5. Original attribute collection.
NumberAttributesHi
1Physical sign data collection4.56
2Psychological evaluation4.00
3Health risk assessment4.00
4Health tracking3.89
5Health record creation4.67
6Health management plan4.11
7Comparative feedback on health management effectiveness4.22
8Continuous usage4.44
9Matching recommendations (articles, videos, live experts, etc.)3.22
10Reminder settings2.89
11Eco-friendly lifestyle ideas3.44
12Expert consultation2.56
13Community discussions3.22
14Social sharing of health management experiences4.67
15Goal completion incentives4.00
16Simple and intuitive interface4.56
17Ease of use 4.56
18Privacy and security4.33
19Reasonable functional layout4.44
20Icons or menus are easy to understand4.33
Table 6. Attribute collection and classification.
CategoryNumberAttributes
A.
Health data acquisition
A1Physical sign data collection
A2Psychological evaluation
A3Privacy and security
A4Health risk assessment
A5Health record creation
A6Health tracking
A7Health data association
B.
Health management scheme customization
B8Helps the user’s diet
B9Exercise scheme
B10Health management plan
B11Periodic assessment
B12Eco-friendly lifestyle
B13Matching recommendations (articles, videos, live experts, etc.)
C.
Health management supervision
C14Reminder settings
C15Health monitoring and management
C16Community discussions
C17Online consultation
C18Social sharing of health management experiences
C19Comparative feedback on health management effectiveness
C20Goal completion incentives
C21Emergency rescue instruction
D.
M-health management app usability
D22Simple and intuitive interface
D23Reasonable functional layout
D24Continuance usage
D25Ease of use
D26Icons or menus are easy to understand
Table 7. Kano model questionnaire for m-health management apps.
Attribute NumberNumber of Answers in the CategoryBeiWoiAssessment of the Attribute
A 1O 2M 3I 4R 5Q 6
A164424811641239.26%−33.33%M
A274343213241039.71%−24.26%I
A32615280240463.12%−82.27%O
A41384618782465.71%−22.86%A
A511024121308248.55%−13.04%I
A6144406924065.25%−16.31%A
A76832341428236.23%−23.91%I
B89834201286047.14%−19.29%I
B912234161104055.32%−17.73%I
B101128620680069.23%−37.06%O
B111466414620073.43%−27.27%A
B1211444201080055.24%−22.38%I
B139030201404242.86%−17.86%I
C149022201466240.29%−15.11%I
C1512242101100057.75%−18.31%A
C16108521210010458.82%−23.53%A
C178624121564439.57%−12.95%I
C181226018820464.54%−27.66%A
C191224041124458.27%−15.83%A
C2096261812816245.52%−16.42%I
C211083061364249.29%−12.86%I
D229411426520072.73%−48.95%O
D238212242400071.33%−57.34%O
D24948632740062.94%−41.26%O
D257276201180051.75%−33.57%M
D261069426600069.93%−41.96%O
1—attractive; 2—one-dimensional; 3—must-have; 4—user was indifferent to the attribute; 5—user did not like the attribute; 6—there was a contradiction: users both wanted the attribute to occur and not to occur.
Table 8. INRM coordinate information of the four types of attributes.
CategoryDRD+RD−R
A. health data acquisition4.5153.317.8251.206
B. customized management solutions3.6894.2727.961−0.583
C. health management supervision3.4884.1667.654−0.678
D. health product availability3.1793.1246.3040.055
Table 9. INRM coordinate information of the 26 attributes.
AttributeDRD+RD−R
(A1). Physical sign data collection4.39 3.57 7.97 0.82
(A2). Psychological evaluation4.03 3.02 7.05 1.02
(A3). Privacy and security4.67 3.59 8.26 1.08
(A4). Health risk assessment3.85 3.28 7.13 0.58
(A5). Health record creation4.11 3.59 7.70 0.52
(A6). Health tracking3.93 3.45 7.38 0.48
(A7). Health data association4.29 3.90 8.19 0.40
(B8). Helps the user’s diet4.63 4.26 8.89 0.38
(B9). Exercise scheme 4.01 4.20 8.21 −0.18
(B10). Health management plan4.12 4.32 8.44 −0.20
(B11). Periodic assessment4.38 4.71 9.09 −0.33
(B12). Eco-friendly lifestyle3.80 4.16 7.95 −0.36
(B13). Matching recommendations (articles, videos, live experts, etc.)3.21 4.08 7.28 −0.87
(C14). Reminder settings3.09 3.24 6.33 −0.16
(C15). Health monitoring and management3.00 3.16 6.16 −0.16
(C16). Community discussions2.78 2.63 5.41 0.14
(C17). Online consultation2.37 2.86 5.23 −0.49
(C18). Social sharing of health management experiences3.98 4.38 8.36 −0.40
(C19). Comparative feedback on health management effectiveness3.57 3.94 7.51 −0.38
(C20). Goal completion incentives2.06 3.24 5.29 −1.18
(C21). Emergency rescue instruction1.95 2.91 4.86 −0.96
(D22). Simple and intuitive interface3.51 3.44 6.95 0.08
(D23). Reasonable functional layout3.45 3.09 6.54 0.36
(D24). Continuous usage2.89 2.97 5.86 −0.07
(D25). Ease of use 2.71 2.81 5.51 −0.10
(D26). Icons or menus are easy to understand2.48 2.48 4.96 −0.01
Disclaimer/Publisher’s Note: The statements, opinions and data contained in all publications are solely those of the individual author(s) and contributor(s) and not of MDPI and/or the editor(s). MDPI and/or the editor(s) disclaim responsibility for any injury to people or property resulting from any ideas, methods, instructions or products referred to in the content.

