Article

Potential of Regulating Ecosystem Services in Relation to Natural Capital in Model Regions of Slovakia

1
National Agricultural and Food Centre/Soil Science and Conservation Research Institute Bratislava, Regional Station, 974 04 Banská Bystica, Slovakia
2
Faculty of Ecomonics, Matej Bel University in Banská Bystrica, Tajovského 10, 975 90 Banská Bystrica, Slovakia
*
Author to whom correspondence should be addressed.
Sustainability 2023, 15(2), 1076; https://doi.org/10.3390/su15021076
Submission received: 25 October 2022 / Revised: 29 December 2022 / Accepted: 4 January 2023 / Published: 6 January 2023

Abstract

:
The growing demands of satisfying human well-being call for a sustainable way of managing the landscape, which requires the introduction of tools for evaluating and assessing ecosystem services. The aim of the study is to evaluate regional differentiations in the values of regulating ecosystem services in relation to natural potential in four small pilot regions of the Slovak Republic with the application of the modified matrix approach. The results in the pilot regions of the Slovak Republic indicated that the spatial distribution of individual ecosystems in the country, in combination with a higher altitude and a larger area of forests and protected areas, can represent significant factors influencing the potential of the territory to provide benefits resulting from regulating ecosystem services. Mountain areas generally have a higher capacity to provide regulating ecosystem services, mainly due to their rich forest vegetation. Regulating ecosystem services, to the greatest extent, reflects the multifunctionality of the territory.

1. Introduction

The decline of natural resources and the deteriorating quality of the environment cause constant pressure on ecosystems. The growing demands of satisfying human well-being call for a sustainable way of managing the landscape, which requires the introduction of tools for evaluating and assessing ecosystem services. Combining economic and ecological approaches in the form of the concept of ecosystem services represents such an alternative. The main idea of the concept of ecosystem services is to realize the value of natural capital (ecosystems that provide services are referred to as natural capital [1]), its contribution to society, as well as to understand the connection between natural capital and human well-being [2]. It enables a deeper understanding of the interconnection between the properties, processes, and functions of ecosystems and ecosystem services, as well as the interdependence of natural capital relating to the provision of human social and cultural needs and economic well-being. CICES provides a hierarchical system that is based on the MEA and TEEB classifications and is adapted primarily for the needs of environmental accounting [3,4]. Benefits from nature to people in the form of ecosystem services can be divided into three categories: provisioning, regulating, and cultural services [5].
Regulating ecosystem services is defined as ecological processes that are essential for life support systems [6]. These processes use mechanisms to decrease impacts of natural and human-made activities which can negatively influence human and ecosystem health [2], such as the regulation of the local and global climate, air quality water/flood protection, water erosion, nutrient, risk substance, pollination, and biodiversity protection [7,8], habitat maintenance, conservation of water and soil, carbon sequestration, and water purification [9,10]. This has a significant effect on the capacity to provide ecosystem services [11], as well as on the capacity of natural capital to provide cultural ecosystem services [12]. The global economic value of regulating ecosystem services was estimated at $29.085 trillion [13].
The growing awareness of the benefits that ecosystems provide to society reflects the constant increase in scientific studies focused on evaluating and assessing ecosystem services [3,14,15]. Incorporating ecosystem services into environmental decision-making is also desirable from a long-term point of view in order to ensure a minimum level of value of ecological reserves, the so-called ecological safety for life [7]. The quantification and assessment of ecosystem services are also one of the driving forces of the sustainable development of human activities in the context of natural capital [16]. The most important targets of the EU biodiversity strategy for 2030 (as well as the updated National Biodiversity Strategy for 2020) are aimed at assessing and mapping the value of different ecosystem services. Several studies have attempted to analyze and evaluate ecosystem services using methods such as spatial modeling, participatory surveys, and statistical analysis [17,18,19].
There are currently several suitable methods for assessing ecosystem services, which can be divided into two basic groups according to the basic principle of evaluation [3], namely (1) non-monetary methods—biophysical (for example, ecological footprint [20], land cover flow [21], material flow analysis [22], life cycle analysis [23], energy methods [24]), and socio-cultural (for example, preference assessment, time use methods, photo-elicitation survey, narrative methods, participatory and scenario mapping, deliberative methods; Ref. [25]); (2) monetary methods—economic methods (for example, direct, indirect, contingent and group market assessment; Ref. [26]). Biophysical methods that use spatial data also include the matrix method for assessing the potential of natural capital [3,27,28]. Its advantage is an open matrix system regarding the detail and level of assessment of ecosystem services [28]. The assessment of ecosystem services using variously modified matrices was used in several studies [29,30,31,32,33,34,35]. A matrix approach was also used for the national assessment of Slovakia’s ecosystem services [36], which modified the assessment matrix based on the state of the ecosystem; within this study, only ecosystems in a favorable state, capable of providing a full capacity of ecosystem services, achieved full matrix potential and thus full monetary value. According to Černecký [36], the need to place the economic assessment in the wider context of ecosystem services assessment resonates with its main role as a support tool for moving towards a sustainable society. The matrix approach proved to be one of the appropriate approaches for linking non-monetary and monetary evaluation of ecosystem services (evaluation ecosystem matrix—Refs. [27,28]). The main method matrix approach was used within national studies in Slovakia, Lithuania, Russian Federation [3,37]. The economic expression of ecosystem services in the form of a value transfer method was used at the national level, for example, in the Czech Republic, Italy, the United Kingdom, Finland, and Spain [3,38,39,40,41,42]. In Slovakia, in addition to the assessment of ecosystem services at the national level [3,36], several local studies have been published, mainly related to protected areas and national parks [43,44,45]. In terms of the use of regulating ecosystem services, all types of ecosystems and landscapes have a certain value. As we see, there are no comprehensive studies of regulating ecosystem services within Slovakia that reflect the value of natural capital at the regional level, and yet it could be the basis for sustainable management.
As it is possible to express the value of ecosystem services using different methods, monetary expression is an important tool for raising awareness of the importance of ecosystems in the formulation of public policies, strategies for the protection of ecosystems and improving the health of biodiversity in the medium and long term [46]. The synthesis of biophysical values of ecosystem services capacity and its connection with economic valuation is undoubtedly one of the main challenges for further research. Knowing the potential of ecosystem services supports their sustainable use [47,48]. However, the monetary approach is not necessarily preferred over the non-monetary assessment of ecosystem services [49,50,51,52].
Rapid population growth and urbanization lead to the degradation of regulating ecosystem services through increasing demand for natural resources, which raises the need for the assessment of regulating ecosystem services [53]. There are few results in the literature [54,55,56,57] on the non-monetary evaluation of regulation ecosystem services at the regional level with its subsequent connection to the monetary value, which is part of the natural capital of the given region and is a fundamental basis for the sustainable management of ecosystems in the given geo-climatic conditions. This type of research is absent within Slovakia. Studies in this area are often focused only on a certain ecosystem, most often on protected areas and national parks [58,59]. The matrix system was applied by Černecky et al. [3] at the national level to a lesser degree of differentiation of ecosystems (for example, one common category was made up of forest ecosystems, arable land, orchards and vineyards were also evaluated as one ecosystem), which does not allow for a detailed comparison of regions, the influence of their location and the influence of land use.
The aim of the study is (1) to map and evaluate the potential of regulating ecosystem services in 4 small pilot regions of the Slovak Republic (district level) with the application of the modified matrix approach (expert estimation of NAFC (National Agricultural and Food Center) and NFC (National Forest Center) for specifying forest ecosystems based on their management and use) inspired by [3,28,60] with the addition of an assessment of the forest ecosystem based on their management, and (2) to evaluate regional differences in the values of regulating ecosystem services in relation to area representation of individual ecosystems and altitude. In literature, there is also a research gap regarding the sustainable functioning of society and policy-making [2,61] in questions of interactions between regulating ecosystem services, its potential, and usage in regions in the context of maintaining a balance between the use of regulating ecosystem services and the preservation of ecosystem health in the context of small regions. Articulating the value of ecosystem services can thus help society make better decisions in cases where existing trade-offs must be considered [62], evaluate the pressure on ecosystems, and choose an appropriate solution in order to preserve the potential of ecosystem services.
The article is organized as follows: methodology and study locations are described in Section 2; interpretations of results and discussion are within Section 3; Section 4 consists of concluding remarks.

2. Materials and Methods

2.1. The Theoretical and Methodological Baselines of the Matrix Approach
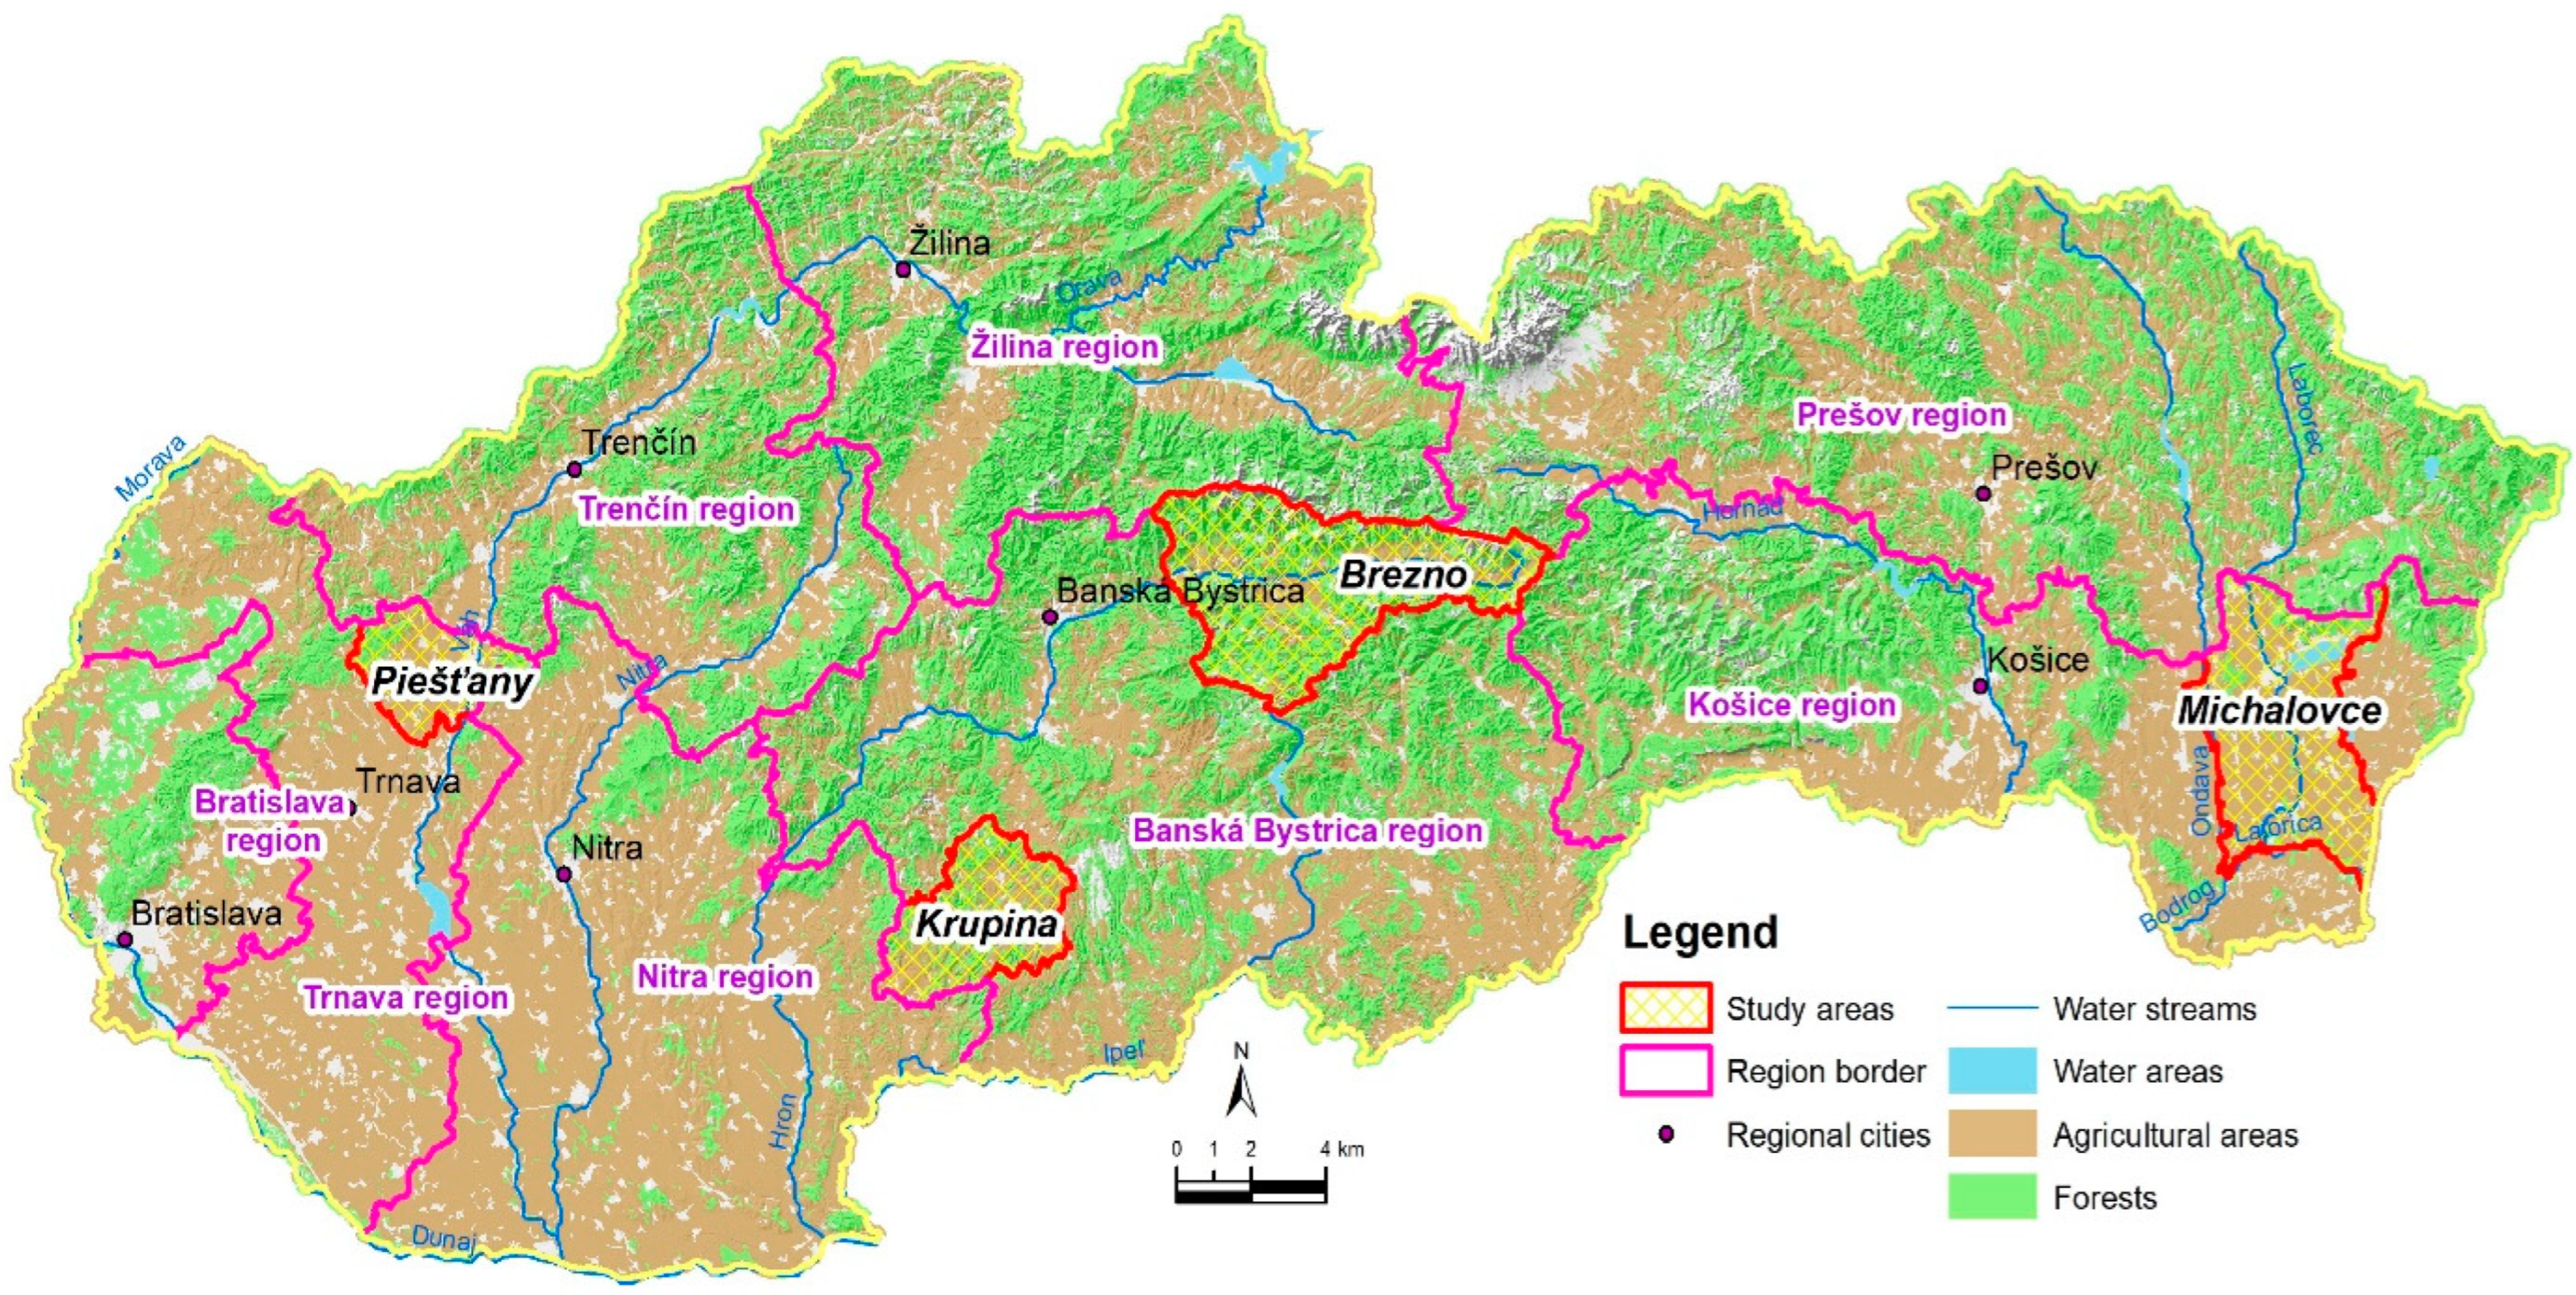
The participatory expert scoring matrix approach provides quick and easy-to-use assessments of ecosystem services [63,64,65]. The Ecosystem Service Potential Matrix is a lookup table that associates land cover types with an ecosystem and its potential to provide ecosystem services. Ecosystem types according to LULC typology tend to be derived from the CLC (Corine Land Cover) 2018 dataset (https://land.copernicus.eu/pan-european/corine-land-cover/clc2018, accessed on 29 September 2022). This scoring system was first introduced by Burkhard et al. [27] in 2009. It was applied in many case studies, for example [31,33,51,66,67,68], in different countries [66] and at different scales—from regional [34], national [69], and continental levels [67]. According to Burkhard et al., a matrix was also used to evaluate Slovakia’s ecosystem services at the national level [36]. Our study was different because, at the regional level, we started from more accurate data, evaluated all relevant ecosystems in the region, and supplemented the matrix with a more accurate assessment of forest ecosystems. The variety of applications confirms that the matrix approach has the potential to integrate all kinds of data related to ecosystem services based on different scientific disciplines or methods of quantifying these services of different quality and quantity, put them into illustrative matrix tables with the possibility of a subsequent spatial display [70]. The matrix approach to the ecosystem service assessment offers a good compromise to solve the “urgency and uncertainty dilemma” [71], primarily through rapid application related to different levels of methodological complexity. Roche and Campagne [72] reported a high level of correlation between ecosystem service values provided by a panel of experts and eight spatial quantitative biophysical indicators. It has been shown that the more complex ecosystem service assessment approaches do not necessarily yield more robust results than those that use expert participation [71].

2.2. Study Area

The pilot regions represent diverse natural-geographical conditions (diverse climatic conditions, altitude, and pedological conditions, taking into account the diversity of natural capital and socio-economic potential of the regions), including four basic natural-geographical areas within Slovakia—west, east, south, and north-central parts of the country (Figure 1).
The basic characteristics of model regions are in Table 1. For this study, we used a classification of agro-climatic regions provided by the Information Service of the National Agricultural and Food Centre—Soil Science and Conservation Research Institute [73]. In this classification, 11 agro-climatic regions were identified according to long-term average temperatures in January, average growing-season temperatures, daily average temperatures sums (T > 10 °C), the length of period with daily temperatures td > 5 °C and the climatic moisture indicator according to Budyko calculated by Tomlain [74]. For our purpose, the original vector layer with 11 categories was merged into four categories (climatic regions: very warm, warm, moderately warm, and moderately cool climatic regions [75].

Geospatial Datasets Used for Specifying the Area Distribution of Individual Ecosystems

All used input layers were in vector form. We concentrate data in a unified geodatabase, mainly in polygonal representation. The layer of land cover LPIS (Land Parcel Identification System), the layer of the ecosystem category Corine Land Cover (CLC, 2018 dataset https://land.copernicus.eu/pan-european/corine-land-cover/clc2018, accessed on 29 September 2022), geodatabase NFC (National Forest Center) and ZBGIS geodatabase were the cartographic basis for the assessment of regulating ecosystem services.
The Slovak Environment Agency coordinates the mapping of landscape cover at the national level as a part of the COPERNICUS activity. It also includes CORINE Land Cover, focused on mapping the state and changes within the European landscape from satellite images using remote sensing materials, all coordinated by the European Environment Agency. Slovak data are available via server for free use in the form of various formats such as SHP, GML, KML, and others. We selected areas with wetlands and incorporated data in SHP format from CLC (https://land.copernicus.eu/pan-european/corine-land-cover, accessed on 29 September 2022).
An important source of agricultural land data and protected areas data is the LPIS database. LPIS is administrated by the Agricultural Paying Agency of Slovakia (APA). LPIS layer is open access, and it can be downloaded at the web address: https://data.gov.sk/dataset/4c408849-80e9-41a2-8c93-08a65b7ce4fb (accessed on 5 October 2022). We used the SHP format of data. We selected four types of land use from the LPIS database (arable land, grassland, vineyards, fruit trees, and berries). The agro-forestry areas with fast-growing woody plants and naturally protected areas were also part of the LPIS database.
For regional assessment of the forest ecosystem, we created our own more precise categorization of forests. It was done according to the characteristics of the basic mission and the fulfillment of forest functions rather than using CLC forest category breakdown. We used data from Slovak National Forest Center (NFC). This data has been purchased and are not open access. We have divided forests into the economic forest, protective forest (protection of natural habitats), and special purpose forest with public benefit functions (National Forestry Center, Decree No. 453/2006 Coll. Decree of the Ministry of Agriculture of the Slovak Republic on economic regulation of forests and protection). These forest categories significantly limit and affect the principles and objectives of forest management and, thus, the potential of the forest ecosystem to provide regulating ecosystem services.
The basic database for the geographic information system (ZBGIS) is part of the information system of geodesy, cartography, and cadastre, which is created and provided by the Office of Geodesy, Cartography and the Cadastre of the Slovak Republic (www.skgeodesy.sk). We used from ZBGIS geodatabase layer with water bodies in SHP format and a digital model of the Slovak relief at a resolution of 20 m for purposeful categorization of the slope of the relief (for evaluating the ecosystems according to their location in a certain altitude area).
We used geographic information systems methods and tools (GIS, ArcGIS for Desktop Advanced version 10.3 from Esri, Redlands, CA, USA) to obtain the resulting layer for model regions at the district level.
Figure 2 describes the area of individual ecosystems in hectares within the model regions. The pilot regions have different area representations of individual ecosystems depending on their geographical location. Within the central part of Slovakia, the Brezno region has the largest area of forests, protected areas, and permanent grasslands. The Eastern region, Michalovce, has the largest amount of arable land and water bodies, including wetlands of national importance. The Southern region, Krupina, is characterized by the largest area of vineyards and fast-growing trees. The Western region, Piešťany, has the largest area of fruit orchards. The territorial share of individual ecosystem types reflects the influence of climatic factors, the current use of agricultural land (arable land, grassland), as well as their historical development (formation of national parks, Ref. [76]).

2.3. Regulating Ecosystem Services Assessment

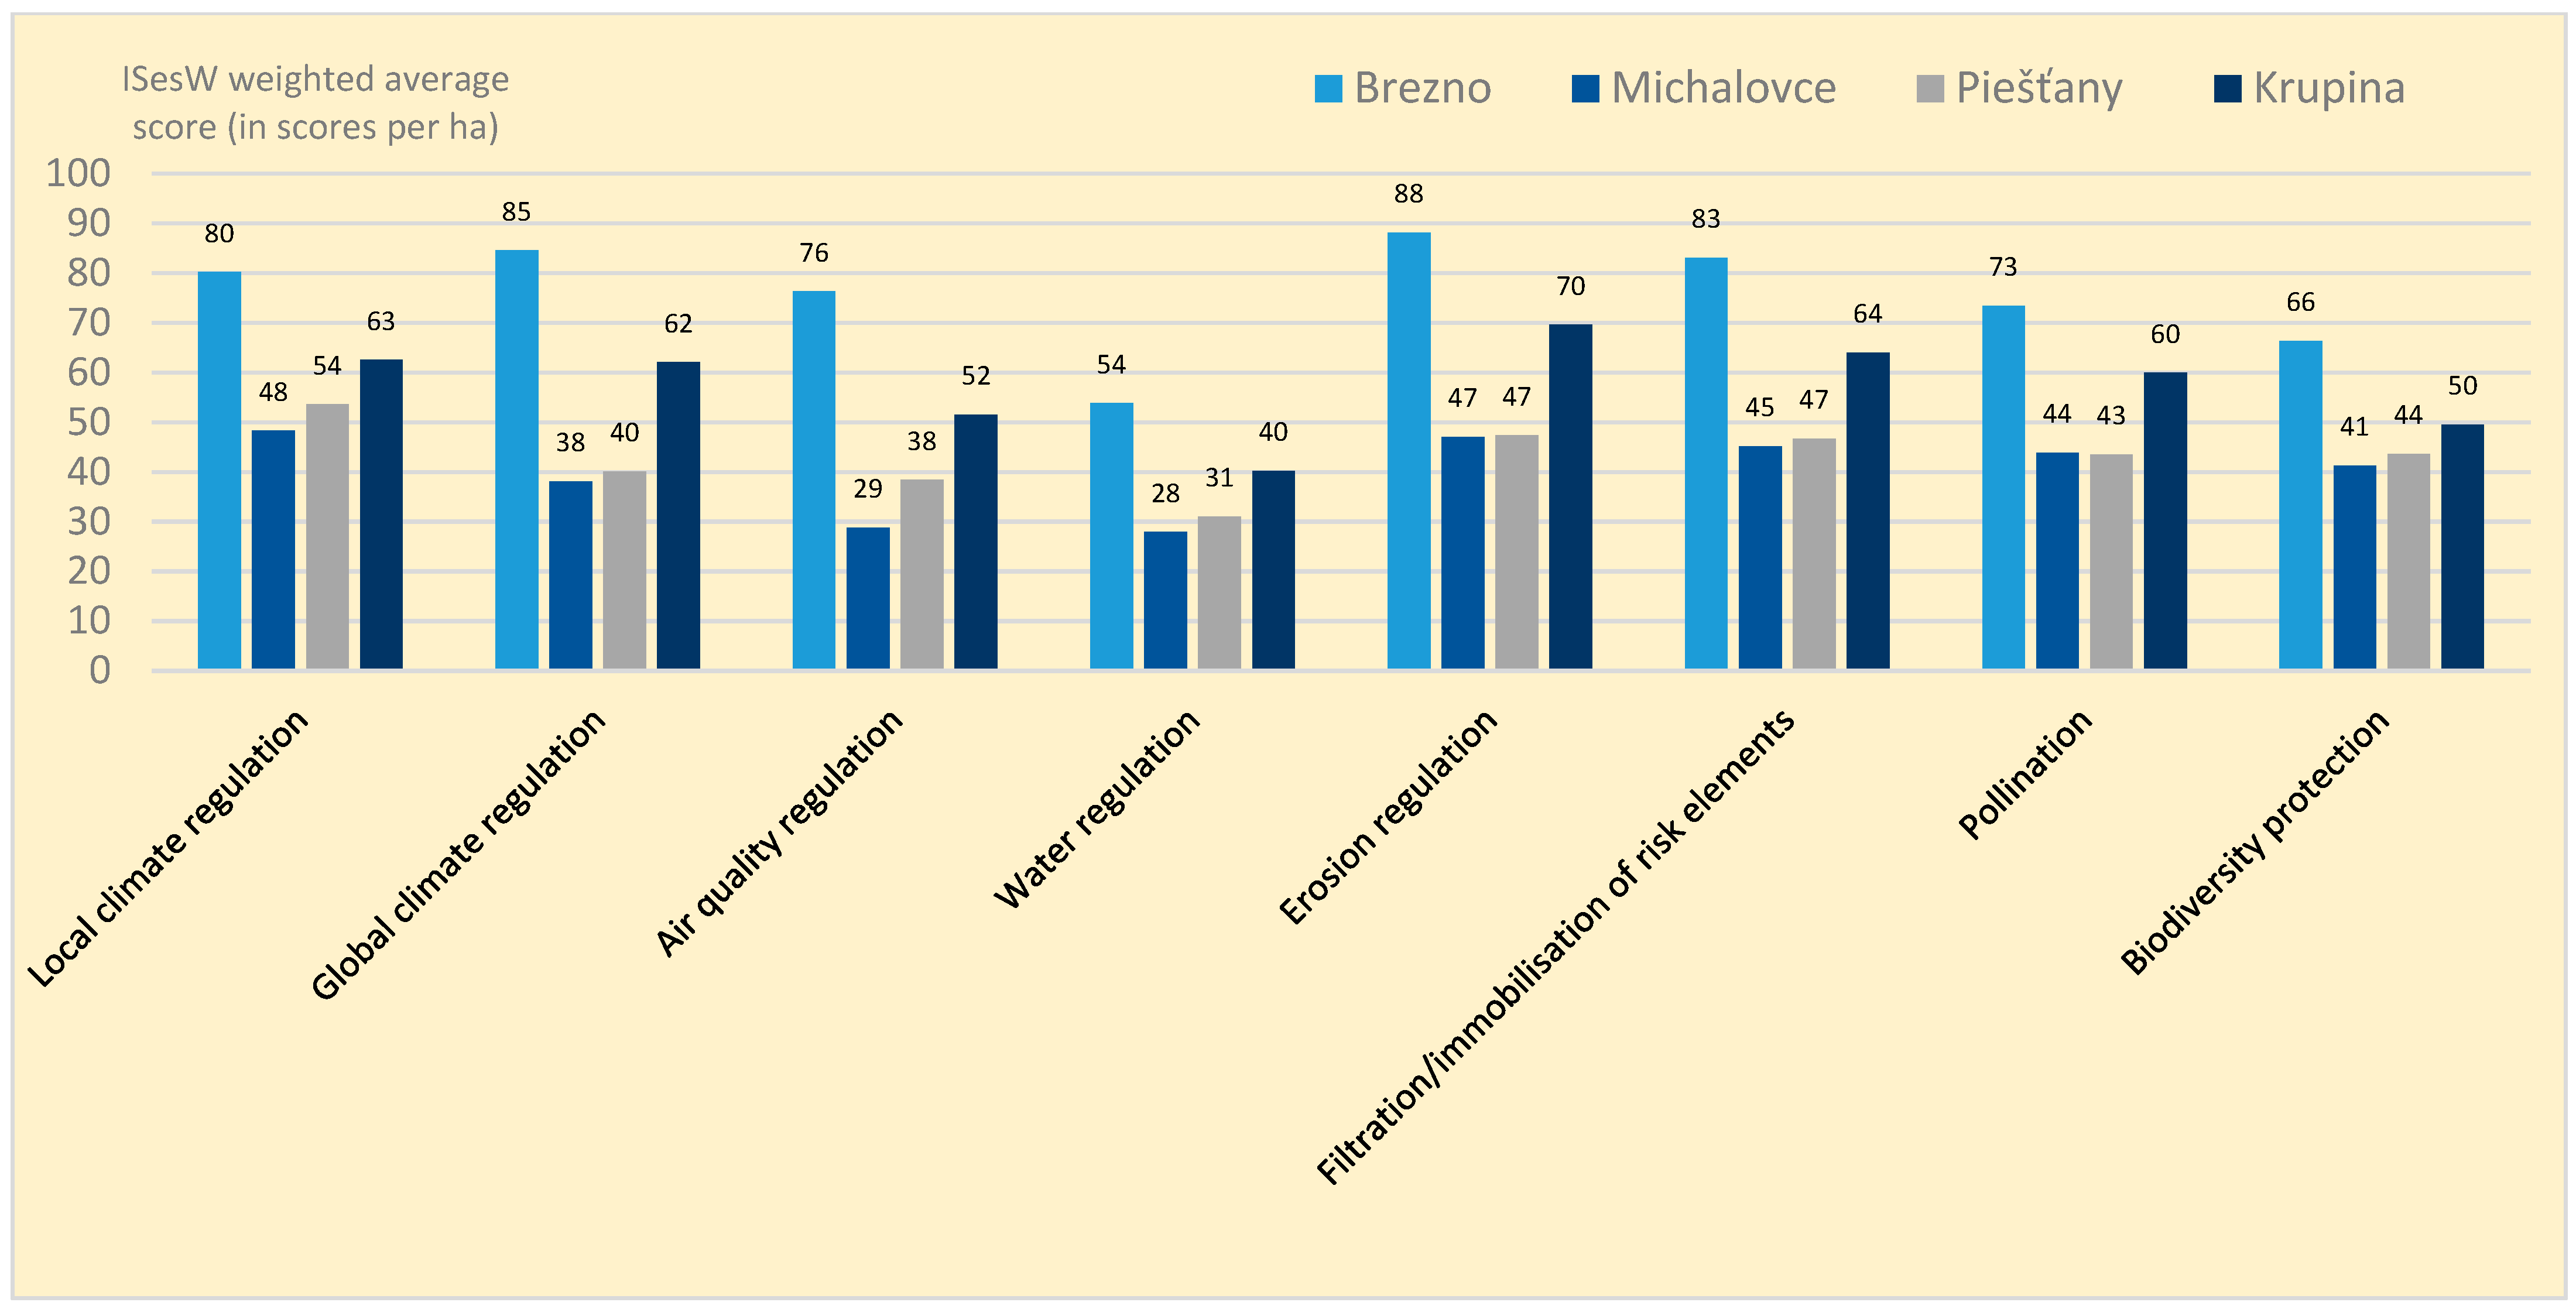
2.3.1. Non-Monetary Assessment of Regulating Ecosystem Services

A modified matrix of the potential of regulating ecosystem services (Table 2) using a matrix of [3,28,60] was used to evaluate the potential of regulating ecosystem services in small model regions located in different climatic areas of Slovakia. This modified matrix approach was used in the subsequent regulating ecosystem services economic valuation. Burkhard et al.’s [28] approach is based on a matrix table where the capacity of each ecosystem type to provide ecosystem services is quantified. Within our study, we assessed the potential of regulating ecosystem services without evaluating actual use or flow. In the model regions, we assessed local and global climate regulation, air quality regulation, water regulation/flood protection, water erosion regulation, nutrient regulation, risk substance regulation, pollination, and biodiversity protection within the natural potential of regulating ecosystem services. As a result of the modified matrix approach, the potentials of regulating ecosystem services are scored on a scale from 0 (no relevant potential) to 5 (very high relevant potential). In case of the absence of ecosystem values proposed by Müller et al. [60] ranging from 0 to 100, we supplemented them with Burkhard et al.’s [28] matrix; these values were transferred into a 0–100 scoring system by simple multiplications.
Schematic evaluation of regulating ecosystem services in model regions is illustrated in Figure 3. When analyzing the area representation of individual ecosystems and creating a layer of ecosystems in the pilot regions, we used data from CLC, LPIS, ZBGIS, and the NFC geodatabase. Based on the consensus of experts from NAFC and NFC, we selected regulating ecosystem services relevant to the pilot regions. The application of the matrix system (Table 2, Figure 3) and the widespread representation of ecosystems formed the basis for the calculation of the non-monetary value of the potential of individual regulatory services as well as the total value in the pilot regions (the computation of the non-monetary value (scores) of regulating ecosystem services based on the potential matrix table is in Table 3). Linking the data from the matrix table with the ecosystem layer made it possible to display the potential values on the maps of the pilot regions. The connection of scores capacity with the use of the value transfer method formed the basis for the analysis of the monetary value of the potential of regulatory ecosystem services (the computation of the monetary value (scores) of regulating ecosystem services based on the potential matrix table is in Table 4).
Table 2 represents the resulting modified matrix for the evaluation of regulating ecosystem services. It can generally be used for assessing the regulation of ecosystem services for different regions or countries. For extended assessment of the forest ecosystem, the values of the potential of the created forest categories were added to the matrix using the methodology described in [70]. These recommended steps were followed in the formation of the matrix: (1) identification of the relevant ecosystem services and ecosystems to be assessed, (2) selection of an expert panel (in this study team of experts from NPPC and NFC), (3) expert scorings collection, and (4) addition of data for forest ecosystems to the final matrix values. Table 2 shows that index scores of regulating ecosystem services differ according to ecosystem type in pilot regions. The most important categories were forests, protected landscapes, wetlands, and agro-forestry areas (Figure 4). Other ecosystems have an average or lower score within examined categories of regulating ecosystem services.
The computation of the total rating value based on the potential matrix of individual regulating ecosystem services for the model regions was as follows (Table 3).

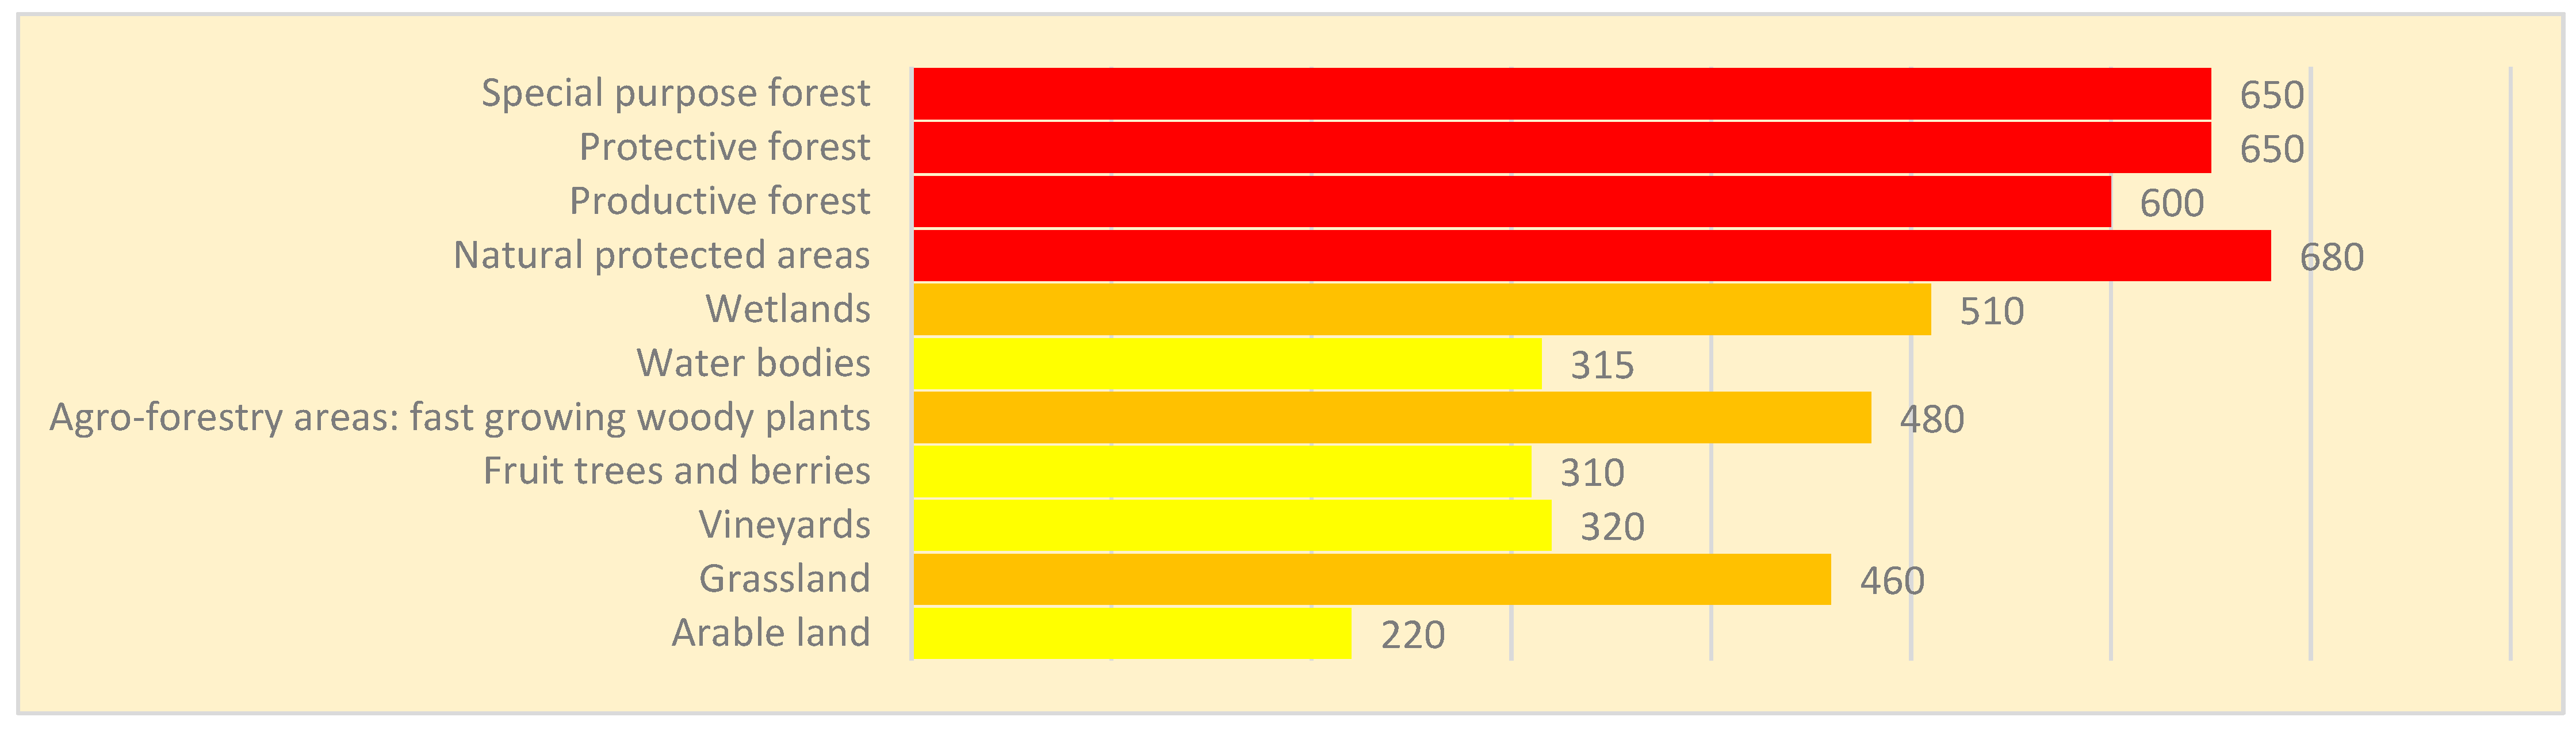
2.3.2. Monetary Assessment of Regulating Ecosystem Services

Reliable monetary valuation of resources and needs enables efficient allocation of resources for the needs of sustainable management of society [77]. To determine the monetary value of the potential of individual regulating ecosystem services for the year 2021, we used the Value transfer method [70]. Frélichová et al. [78] stated the original value of 36.586 EUR per hectare; this value was adjusted for inflation of 3.2% in the Slovak Republic in 2021 (Frélichová et al.’s [40] index scores ranging from 1 to 5 were recalculated to new index scores ranging from 1 to 100). The value of score 1 was assigned an amount of EUR 40.70 per hectare. Following this procedure, the values of regulating ecosystem services of individual ecosystems were subsequently calculated using the matrix of indices (Figure 2, Table 2). The assessment of the potential of a specific regulating ecosystem service (CR) for the model region was as follows (Table 4).

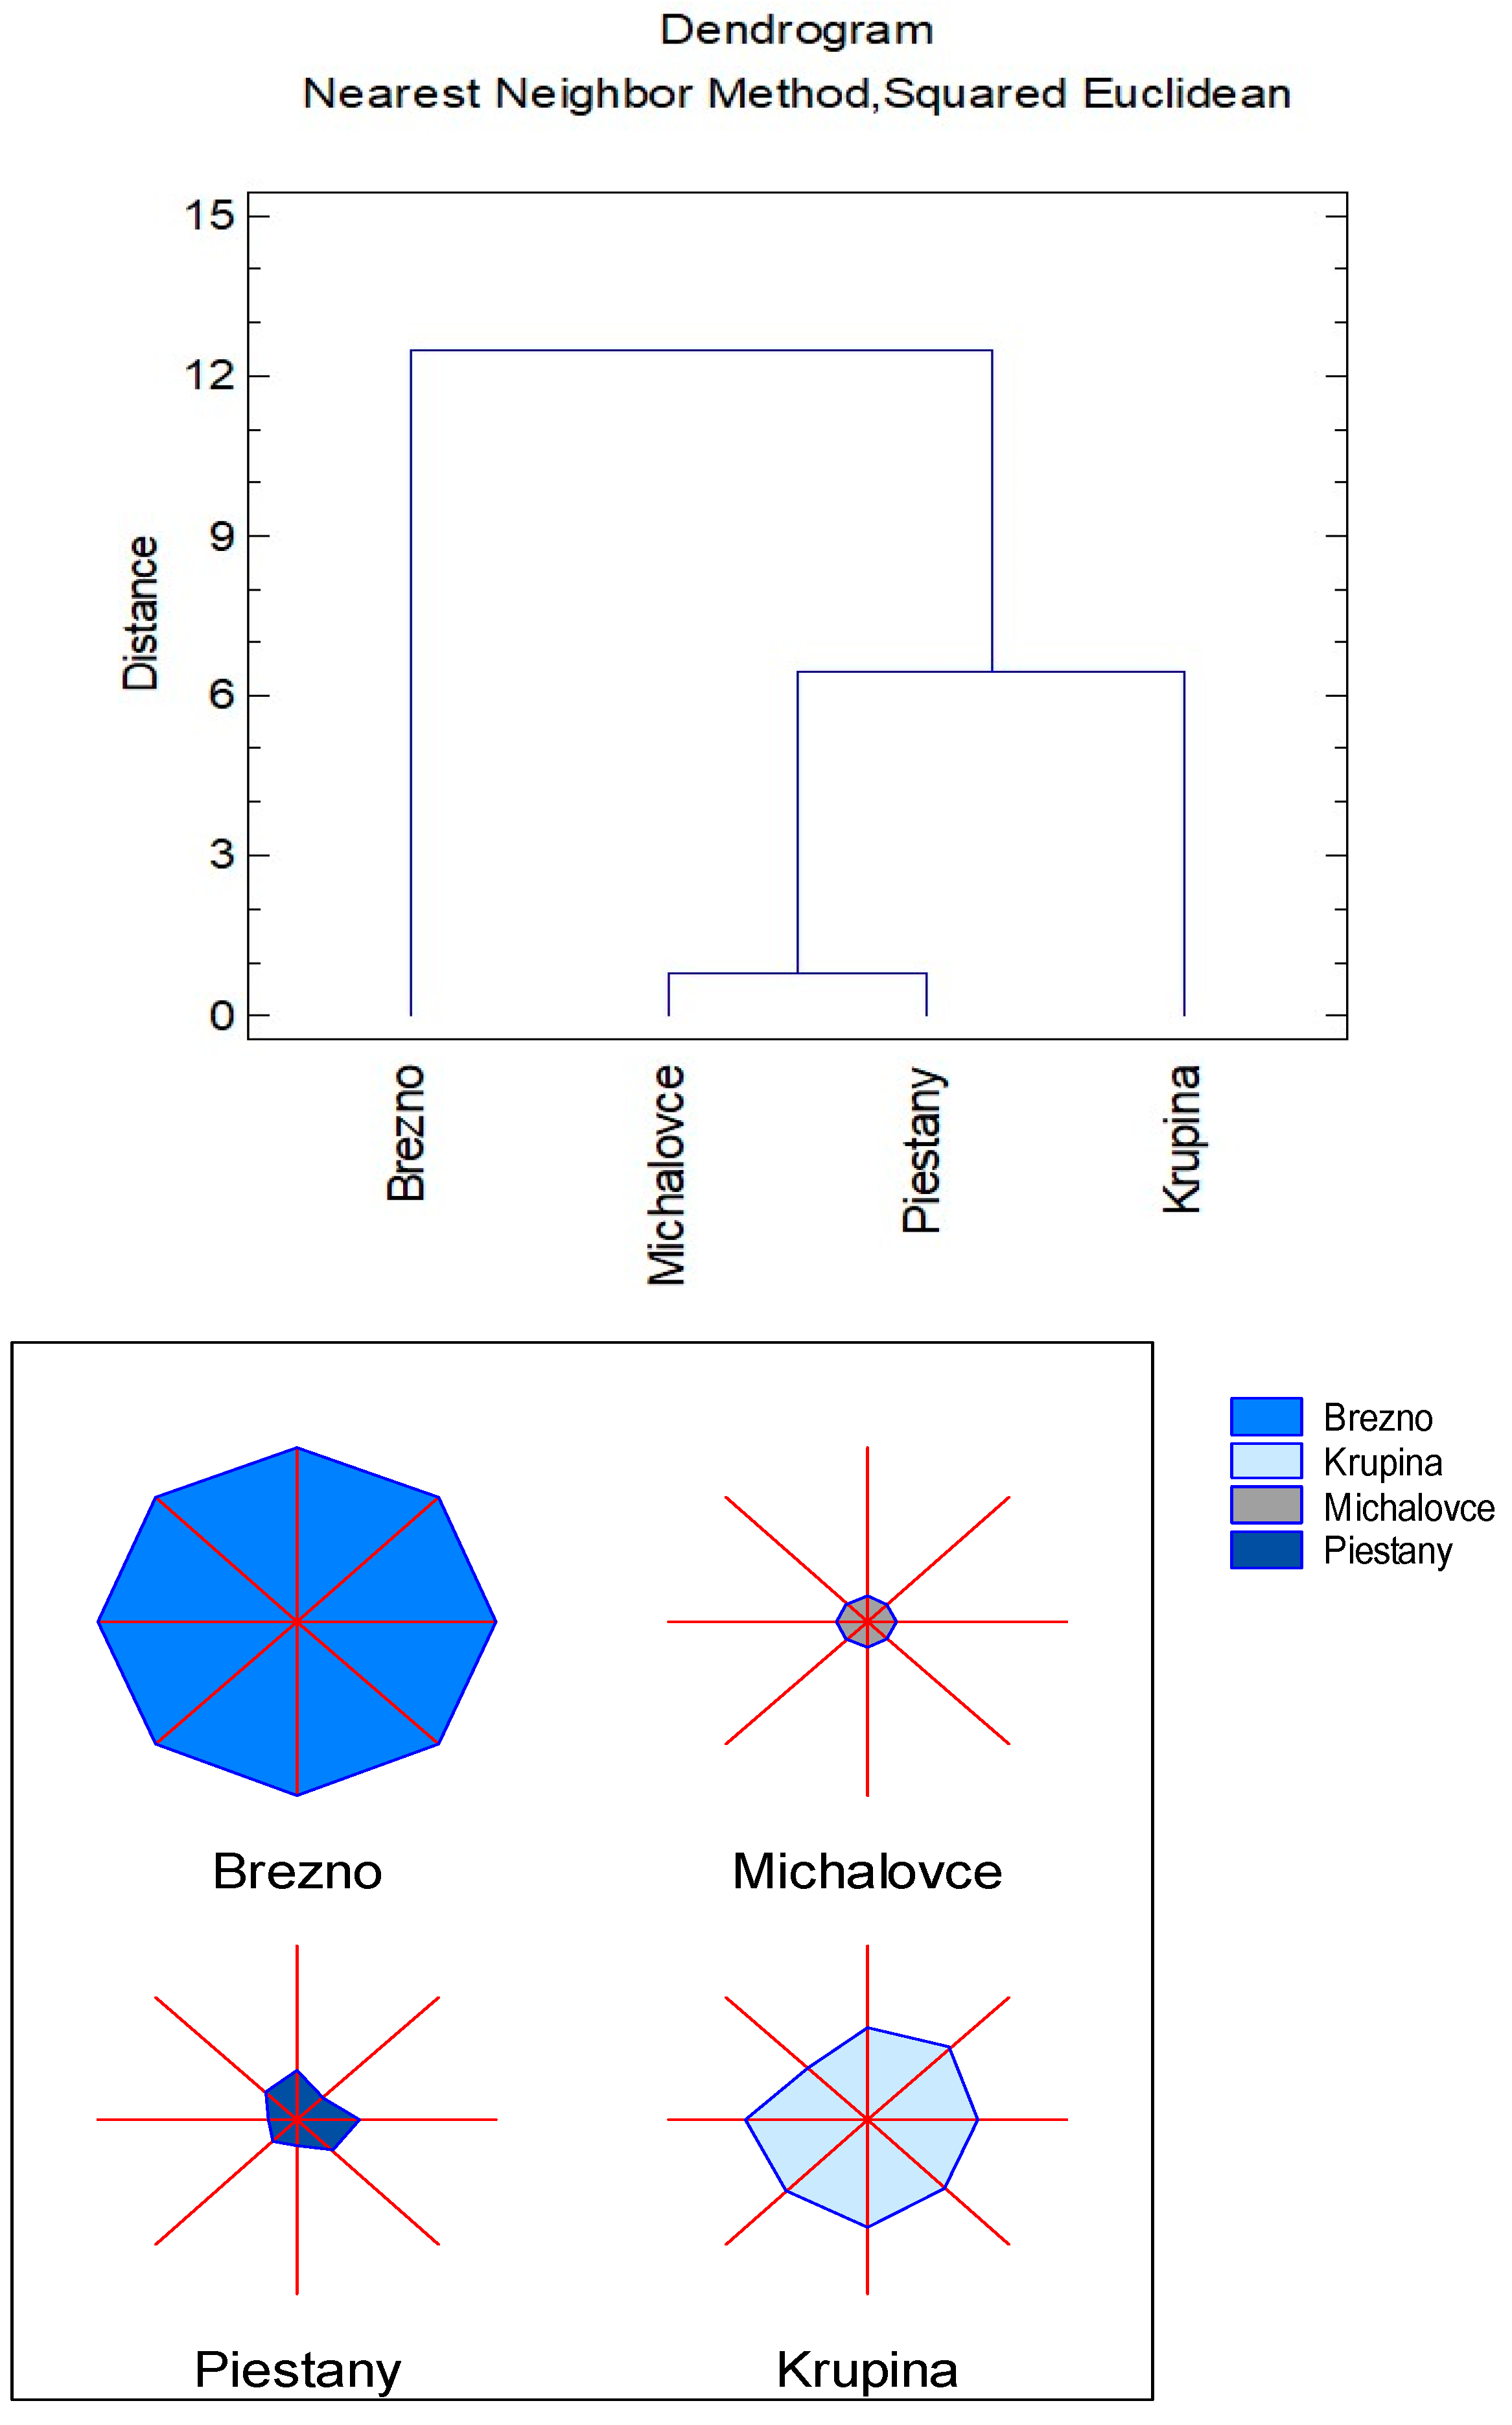
2.4. Statistical Model Regions Comparison

Databases and measured data, as well as evaluation of results, were statistically processed by program Statgraphics Centurion XVI. To compare pilot model regions, we used multivariate methods (cluster analysis) and multivariate visualization (sunray plots).

3. Results and Discussion

Figure 5 shows the average non-monetary point value of the index per hectare for individual categories of regulating ecosystem services (local and global climate regulation, air quality regulation, water regulation/flood protection, water erosion regulation, nutrient regulation, risk substance regulation, pollination, and biodiversity protection) in study locations.
The highest average point values of indices per hectare in all categories (Figure 5), as well as the highest total point values (Figure 6), were in the district of Brezno, in which there are extensive forest stands and protected areas, which in themselves have the highest index values in relation to the researched categories of regulating ecosystem services. Frélichová and Fanta [78] state the following order of ecosystem potential in providing regulating ecosystem services: forests > meadows > permanent grasslands > water bodies > arable land. The regulation of water and erosion had the highest average index values per ha in the district of Brezno, followed by the regulation of the global climate and the regulation of hazardous substances.
Climate regulation has its global as well as local level. Above all, natural forest ecosystems and wetland ecosystems maintain suitable atmospheric conditions for life on Earth and regulate the climate on a global scale [79,80]. Santos-Martin et al. [25] showed high preferences of residents for this particular service—more than 50% of respondents in their research. However, this process is not one-sided; changes in global and local climate have a negative effect on the species composition of forests because of climate change. Certain areas may become unsuitable for certain types of trees as a result of direct impacts [81], such as drought, or indirect effects, such as damage by pests or diseases caused by drought [82]. As reported by Ellison et al. [83], deforestation leads to negative impacts such as soil compaction and erosion, loss of transpiration capacity, reduced infiltration, and increased runoff that can cause flooding. According to [3], the index of the potential for the provision of climate regulation services would be in the case of an optimal ecosystem state of 3.25 (on a scale of 0–5, which is 65 points on a scale of 0–100). Černecký et al. [9] reported the average value of the index of local climate regulation for the Slovak Republic as 2.97 (within a range of values from 0 to 5), which, when converted to the proposed evaluation in the range of values from 0 to 100, represents a value of 59.40. This value was higher only in the Brezno and Krupina regions.
Similar estimations are for the air quality control regulating ecosystem service, in which the average value for Slovakia, according to [3], is 2.22; when converted to a modified rating in the range of values from 0 to 100, it represents a value of 44.40. Air quality regulation has a direct impact on the health of the human population. This value was higher in the Brezno and Krupina regions.
To ensure flood regulation, forest ecosystems and wetlands with a water-retaining function are especially important. Coniferous forests hold 10% more water than deciduous or mixed forests [84]. The average value of the water regulation/flood regulation index for Slovakia is given by Černecký et al. [3] a value of 2.11 (with a range of values from 1 to 5); when converted to a suggested rating in the range of values from 1 to 100, represents a value of 44.20. This value is higher only in the Brezno region, which has the largest areas of forest stands and protected areas, which in themselves also have the largest index values in relation to regulating ecosystem services.
The risk of erosion threatens agriculture, natural resources, and the environment. Landslides can threaten inhabited areas and cause significant damage to people’s health and property. Only two of the monitored districts, Brezno and Krupina, had a higher average index of potential for water erosion control than the average value for Slovakia (3.01 according to [3]; recalculated to value 60.20 on a scale of 0–100). The main landscape type that provides this ecosystem service is the forested areas of foothills, uplands, and mountain areas [85]. Forests and permanent grasslands in the country (draws, linear stands of woody plants) are key elements for the transformation of precipitation and the runoff regime. Natural forest stands have a higher potential for erosion control than commercial forests [86]. Steinhoff-Knopp et al. [87] pointed out the seriousness of erosion due to its negative impact on the potential of other regulating ecosystem services (water regime regulation, nutrient regulation) as well as production ecosystem services.
Forest and grass-herb ecosystems have a high index of the regulating service, pollination. However, the state of ecosystems and the way of management have a great influence on the provision of this service. Thom and Seidl [88] mentioned that the negative management practices as one of the main factors that reduce the potential of providing this service. Natural and semi-natural habitats located in the vicinity of agroecosystems or other anthropogenically affected areas are also important from the point of view of the potential for providing regulation of ecosystem services, support of biodiversity, and natural protection against diseases and pests [88].
Müller et al. [60] reported lower average values of individual regulating ecosystem services for all assessed ecosystems for the northern region of Germany than Černecký [3], namely: the average value for the group of regulating ecosystem services at the level of 29.70 points. The highest rated was biodiversity with 43 points; water regulation/flood protection with 42 points; and global climate regulation, with 43 points. In the model regions, we obtained higher average values of regulating ecosystem services (Brezno 67.90 points, Michalovce 35.60 points, Piešťany 38.90 points, and Krupina 51.10 points).
The total point value of the potential of regulating ecosystem services of individual ecosystems makes it possible to link the matrix assessment with geospatial units and display the area distribution of non-monetary point values of regulating ecosystem services in the model regions (Figure 7).
We used the matrix system to evaluate the potential of ecosystem services in the model regions as a basis for their monetary expression. The value of index 1 was assigned the sum of 40.70 euros, based on which the monetary prices of the potential of individual regulating services for ecosystems were subsequently calculated according to the index matrix (Table 2, Table 3 and Table 4). The value of the potential of individual regulating ecosystem services in euros in the model regions, as well as the total value of regulating ecosystem services of natural capital, are shown in Figure 8 and Figure 9.
The dendrogram compares the similarity of regions between the value of regulatory services in model regions (Figure 10). Individual axes represent individual ecosystem services and their average value per ha in a given region. The comparison of the model regions showed the most significant regional differences between the pairs of regions, namely Brezno and Krupina, on the one hand (regions with rural character at an altitude mostly above 300 m above sea level) and on the other hand, Michalovce and, Piešťany (regions in the area with a warm climate at an altitude mostly up to 300 m above sea level). The similarity of the regions Brezno–Krupina, and Michalovce–Piešťany was also declared by the evident correlation between the total values of regulating ecosystem services in model regions (Table 5).
The results in the model regions of the Slovak Republic indicated that altitude could represent one of the important factors influencing the potential of the territory to provide benefits resulting from regulatory ecosystem services (Table 6, Figure 11). The area distribution of ecosystems, land use as well as their sustainable management depends on the altitude, where there are less fertile arable lands which are often grassed or wooded, and on the contrary, larger areas of forests and protected areas. We have chosen the value of altitude up to 300 m because, at this altitude, there is a maximum of arable land in Slovakia.
The resulting values of the connection of the area distribution of the non-monetary point index value of the individual regulating ecosystem services with the cartographic layer of altitude are shown in Table 6. The differences in values at an altitude (up to 300 m and above 300 m above the sea level) were the highest for the global climate regulation ecosystem service and decreased in the following order: global climate regulation > air quality regulation > erosion regulation > local climate regulation > filtration/immobilization of inorganic pollutants > pollination water regulation > biodiversity protection. The sum of all values of the regulating ecosystem services (point value per ha) in the monitored regions ranged from 278.40 (Piešťany) to 403.80 (Krupina) at an altitude of up to 300 m above sea level; at an altitude above 300 m above sea level point values ranged from 472.50 (Krupina) to 631.50 (Michalovce). The effect of altitude on the value of regulating services of individual ecosystems is evident regardless of the geographical location of the monitored model region.
Figure 12 and Figure 13 show the average point values of the potential of regulatory services up to 300 m above sea level and above 300 m in similar regions (according to Figure 10). Regions with rural character at an altitude mostly above 300 m above sea level (Brezno and Krupina) have higher values of the potential of regulating ecosystem services in both monitored altitude levels compared to regions in the area with a warm climate at an altitude mostly up to 300 m above sea level. The biggest differences are in the value of the potential for climate regulation (in both areas) and regulation of erosion and pollination (in the area up to 300 m above sea level).
The most significant changes in the value of natural capital in the region, namely the value of the potential of regulating ecosystem services of individual ecosystems within the region, can be caused by: (1) inappropriate management of individual ecosystems, which can lead to their degradation (management and human interventions can significantly change the functioning of ecosystems, and thus providing benefits of ecosystem services, maximizing management towards the offer of one service, such as increasing the production of arable soils, which can lead to their degradation and reduction of the potential of regulatory services [89,90,91]; (2) changes in land use (for example, when arable land is covered with grass, the value of the potential of regulatory services will increase, because the grassland ecosystem has a higher total potential value than the arable land ecosystem, Figure 4; on the contrary, the plowing of grass stands leads to a reduction in the value of regulatory services, similar to deforestation). The aim of evaluating ecosystem services should be primarily focused on achieving environmental sustainability, social justice, and the long-term economic viability of the region [92].
Previous studies which assessed and valued regulating ecosystem services in Slovakia [3,45] used less accurate input data, especially when linking the assessment and valuation of ecosystem services. At the regional level, we obtained more complex and spatially accurate background layers for the assessment and subsequent valuation of regulating ecosystem services using a modified matrix extended by a more detailed assessment of forest ecosystems as well as an assessment of the ecosystem of fast-growing trees. Černecký et al. [3] reported the highest value of regulating ecosystem services for the mountainous areas of the Carpathians and the lowest for the lowest-lying lowlands with agricultural land. The evaluation of the territory with altitudes up to 300 m and above 300 m provided information about the average value of ecosystem services to which all local ecosystems contribute.
Považan et al. [45] presented a case study of Vel’ká Fatra National Park in Slovakia, valuing selected ecosystem services of the park and comparing the valuation results with two other national parks in the broader region: Slovenský raj (Slovakia) and Tatra (Poland). However, these evaluations concern certain ecosystems in the regions and do not form comprehensive data on the value of natural capital, which become part of environmental accounts both at the regional and national level.
Generally, mountain areas have a higher capacity to provide regulating ecosystem services, which is mainly due to their rich forest vegetation (the age of the stand and deforestation have the greatest impact on the quality and quantity of ecosystem services provision; Ref. [3]). Regulating ecosystem services, to the greatest extent, reflects the multifunctionality of the territory. Multifunctional territories have a positive impact on the protection of biodiversity and the overall maintenance of ecosystem services, on soil quality, as well as on biomass production [93], thereby increasing the ecological resilience of the territory [94]. Multifunctional land-use systems will increase the overall benefits societies can obtain from the ecosystem [95] and allow for minimizing land-use conflicts arising from competing interests [19]. Therefore, mountain areas and their surroundings should always be managed in a sustainable way.
Using higher spatial resolution data helps us reduce the uncertainty in the data, so the refinement of the LPIS dataset is more reliable in this respect than the refinement of the CLC dataset. Classifying forests according to their essential use and fulfillment of their functions (as limiting factors of their ecosystem services potential) allowed us to assign natural capital valuations on a regional scale. Results indicate that an expert-based approach combined with geospatial local ecosystem distribution data can be an efficient method for locally assessing regulating ecosystem landscape potential and could be tested in other countries. The results can provide feedback to guide the zonal design and sustainable management of large-scale ecological restoration.
We did not address the current state of ecosystem degradation, which would change their current value but not their potential. With the remediation of ecosystems, their full value can be achieved again.

4. Conclusions

Our study helps fulfill the most important targets of the EU biodiversity strategy for 2030 (as well as the updated National Biodiversity Strategy for 2020) aimed at assessing and mapping the value of different ecosystem services. The novelty of this study is in the modified and supplemented matrix approach of assessment of ecosystem services with a combination of approaches of authors [3,28,60]. This enabled a more detailed assessment of regulating ecosystem services in pilot model regions of Slovakia considering the altitude and new forest classification. In the investigated regions of the Slovak Republic, forest ecosystems, protected areas, fast-growing trees on arable land, and wetlands of national importance had the highest value of the potential of natural capital for the provision of regulating ecosystem services. Permanent grasslands, orchards, and vineyards had an average capacity to provide ecosystem services, and the cropland ecosystem had a low capacity. However, the arable land ecosystem has its irreplaceable place in supply services, and in the production of crops, especially in regions located at lower altitudes with a significant presence of high-quality arable land. The results in the model regions of the Slovak Republic indicated that the spatial distribution of individual ecosystems in the country, in combination with a higher altitude and a larger area of forests and protected areas, can represent significant factors influencing the potential of the territory to provide benefits resulting from regulating ecosystem services.
In the study, we examined the potential of regulating ecosystem services of the natural capital of the entire region, which is essential if landowners and policy-makers want to make changes in land use (for example, changing arable land to permanent grassland or its afforestation; or, conversely, deforestation and plowing). Stakeholders will thus get an idea of how the price of natural capital will change since they know the value of individual ecosystems, and therefore ecosystem potential is the basis for sustainable land management.
The sustainability of the potential of the arable land ecosystem to provide all ecosystem services, the optimization of the management of arable land in order to support the synergy between the functioning of the ecosystems and the social dynamics of the given area, as well as for the introduction of new agricultural systems that will restore and preserve the potential of natural capital will be challenging for future sustainable land management. In this study, we focused on evaluating the potential of the maximum possible capacity of ecosystem services, which can be provided by the ecosystem in an optimal state and corresponds to the maximum value of natural capital in the monitored regions. We did not assess the degradation processes that can reduce the value of ecosystem services and, thus, the total value of natural capital. This may represent a future area of research within Slovakia aimed at optimizing land use and the impact of land management on ecosystem services.
The application of matrix methods involves many uncertainties, e.g., expert estimation, modeling methods including input data, ecosystem and landscape dynamics, subjectivity factors and political environment, limited regional knowledge, technical problems, scale mismatch, etc. [60]. The focus on specific regional circumstances makes it difficult to generalize the results. Despite these limitations, the application of the matrix approach as a tool for sustainable land management is beneficial and can be further developed, especially to facilitate the practical application of the ecosystem services concept [96]. Our results provide an outcome for regulating ecosystem service assessments that consider regional-specific context and data availability.
Future research could focus on land use changes within the potential of regulating ecosystem services (such as grassing low-production arable lands, afforestation of unused grasslands, and changes in the management of forest stands) and how these land use changes will be reflected in the value of the regional natural capital over time in terms of sustainable management and policy-making.

Author Contributions

Conceptualization, J.M. and S.K.; methodology, J.M. and B.P.; validation, J.M.; investigation, J.M. and B.P.; resources, J.M., S.K. and F.F.; data curation, J.M. and B.P.; writing—original draft preparation, J.M., S.K., F.F. and B.P.; writing—review and editing J.M. and S.K.; visualization, B.P. and J.M.; supervision, J.M. All authors have read and agreed to the published version of the manuscript.

Funding

Slovak Research and Development Agency via contract APVV-18-0035 “Valuing ecosystem services of natural capital as a tool for assessing the socio-economic potential of the area,” and the operational program Integrated Infrastructure within the project: Sustainable smart farming systems taking into account the future challenges 313011W112, co-financed by the European Regional Development Fund.

Institutional Review Board Statement

Not applicable.

Informed Consent Statement

Not applicable.

Data Availability Statement

LPIS raw data was generated from NPPC geo-dataset (link https://portal.vupop.sk/portal/apps/webappviewer/index.html?id=818d652513e5488d98577bb59ea339b7, accessed on 22 September 2022). Layer CLC 2012 was accessed via https://land.copernicus.eu/pan-european/corine-land-cover/clc-2012?tab=download (accessed on 29 September 2022). Raw data about forest management was purchased from National Forest Centre (year 2016). Confirmation of the annual inflation rate in the Slovak Republic via https://slovak.statistics.sk/wps/portal/ext/services/infoservis/confirmation/!ut/p/z0/04_Sj9CPykssy0xPLMnMz0vMAfIjo8ziw3wCLJycDB0NDMwszA0c_V0dLcwDPQy83U31C7IdFQHp6c-x/ (accessed on 3 October 2022). We confirm that the data, models, and methodology used in the research are proprietary, and the derived data supporting the findings of this study are available from the first author on request.

Acknowledgments

This publication was supported by the Slovak Research and Development Agency via contract APVV-18-0035, “Valuing ecosystem services of natural capital as a tool for assessing the socio-economic potential of the area,” and the Operational program Integrated Infrastructure within the project: Sustainable smart farming systems taking into account the future challenges 313011W112, co-financed by the European Regional Development Fund. We are grateful to David Cole for the English language editing.

Conflicts of Interest

The authors declare no conflict of interest.

References

  1. Constanza, R.; Daly, H.E. Natural Capital and Sustainable Development. Conserv. Biol. 1992, 6, 37–46. [Google Scholar] [CrossRef]
  2. Mengist, W.; Soromessa, T.; Feyisa, G.L. A global view of regulatory ecosystem services: Existed knowledge, trends, and research gaps—ecological processes. Ecol. Process. 2020, 9, 1–14. [Google Scholar] [CrossRef]
  3. Černecký, J.; Gajdoš, P.; Ďuricová, V.; Špulerová, J.; Černecká, L.; Švajda, J.; Andráš, P.; Ulrych, L.; Rybanič, R.; Považan, R. The Value of Ecosystems and Their Services in Slovakia; ŠOP SR: Banská Bystrica, Slovakia, 2020; p. 166. ISBN 978-80-8184-078-4. (In Slovak) [Google Scholar]
  4. Maes, J.; Teller, A.; Erhard, M.; Conde, S.; Vallecillo Rodriguez, S.; Barredo Cano, J.I.; Paracchini, M.; Abdul Malak, D.; Trombetti, M.; Vigiak, O.; et al. Mapping and Assessment of Ecosystems and Their Services: An EU Wide Ecosystem Assessment in Support of the EU Biodiversity Strategy: Supplement (Indicator Fact Sheets); European Commission, Joint Research Centre, Publications Office: Bruxelles, Belgium, 2020; Available online: https://data.europa.eu/doi/10.2760/519233 (accessed on 5 December 2022).
  5. Haines-Young, R.; Potschin-Young, M. Revision of the Common International Classification for Ecosystem Services (CICES v5.1): A Policy Brief. One Ecosyst. 2018, 3, e27108. [Google Scholar] [CrossRef]
  6. Sinha, K.; Baten, M.A. Regulating Ecosystem Services: Enhancements through Sustainable Management. In Encyclopedia of the UN Sustainable Development Goals; Filho, W.L., Ed.; Springer: Berlin/Heidelberg, Germany, 2020; pp. 817–829. [Google Scholar] [CrossRef]
  7. Millennium Ecosystem Assessment. Ecosystems and Human Well-Being: Our Human Planet; Summary for Decision Makers; The Millennium Ecosystem Assessment Series; Island Press: Washington, DC, USA, 2005; Volume 5. [Google Scholar]
  8. Smith, P.; Ashmore, M.R.; Black, H.I.; Burgess, P.J.; Evans, C.D.; Quine, T.A.; Thomson, A.M.; Hicks, K.; Orr, H.G. Review: The Role of Ecosystems and Their Management in Regulating Climate, and Soil, Water and Air Quality. J. Appl. Ecol. 2012, 50, 812–829. [Google Scholar] [CrossRef]
  9. Elliot, T.; Torres-Matallana, J.A.; Goldstein, B.; Babí Almenar, J.; Gómez-Baggethun, E.; Proença, V.; Rugani, B. An Expanded Framing of Ecosystem Services Is Needed for a Sustainable Urban Future. Renew. Sustain. Energy Rev. 2022, 162, 112418. [Google Scholar] [CrossRef]
  10. Seidl, R.; Albrich, K.; Erb, K.; Formayer, H.; Leidinger, D.; Leitinger, G.; Tappeiner, U.; Tasser, E.; Rammer, W. What Drives the Future Supply of Regulating Ecosystem Services in a Mountain Forest Landscape? For. Ecol. Manag. 2019, 445, 37–47. [Google Scholar] [CrossRef] [PubMed]
  11. Boyd, J.; Banzhaf, S. What Are Ecosystem Services? the Need for Standardized Environmental Accounting Units. Ecol. Econ. 2007, 63, 616–626. [Google Scholar] [CrossRef] [Green Version]
  12. Amorim, J.H.; Engardt, M.; Johansson, C.; Ribeiro, I.; Sannebro, M. Regulating and Cultural Ecosystem Services of Urban Green Infrastructure in the Nordic Countries: A Systematic Review. Int. J. Environ. Res. Public Health 2021, 18, 1219. [Google Scholar] [CrossRef] [PubMed]
  13. Balasubramanian, M. Economic Value of Regulating Ecosystem Services: A Comprehensive at the Global Level Review. Environ. Monit. Assess. 2019, 191, 616. [Google Scholar] [CrossRef] [PubMed]
  14. Gómez-Baggethun, E.; Barton, D.N.; Berry, P.; Dunford, R.; Harrison, P.A. Concepts and methods in ecosystem services valuation. In Routledge Handbook of Ecosystem Services, 1st ed.; Potschin, M., Haines-Young, R., Fish, R., Turner, R.K., Eds.; Routledge: London, UK; Taylor & Francis Group: London, UK, 2016; pp. 99–111. [Google Scholar]
  15. Dunford, R.; Harrison, P.; Smith, A.; Dick, J.; Barton, D.N.; Martin-Lopez, B.; Kelemen, E.; Jacobs, S.; Saarikoski, H.; Turkelboom, F.; et al. Integrating Methods for Ecosystem Service Assessment: Experiences from Real World Situations. Ecosyst. Serv. 2018, 29, 499–514. [Google Scholar] [CrossRef] [Green Version]
  16. Wojtach, A. Ecosystem services in the circular economy. Environ. Policy Manag. 2016, 4, 100–108. [Google Scholar]
  17. Lautenbach, S.; Volk, M.; Gruber, B.; Dormann, C.F. Quantifying Ecosystem Service Trade-Offs. In Proceedings of the 5th International Congress on Environmental Modelling and Software, Ottawa, ON, Canada, 1 July 2010. [Google Scholar]
  18. Inostroza, L.; König, H.J.; Pickard, B.; Zhen, L. Putting Ecosystem Services into Practice: Trade-off Assessment Tools, Indicators and Decision Support Systems. Ecosyst. Serv. 2017, 26, 303–305. [Google Scholar] [CrossRef]
  19. Brandt, J.; Vejre, H. Multifunctional landscapes: Motives, concepts and perceptions. In Multifunctional Landscapes: Theory, Values and History; Brandt, J., Vejre, H., Eds.; WIT Press: Southampton, MA, USA, 2004; pp. 3–33. Volume 1. [Google Scholar]
  20. Wackernagel, M.; Monfreda, C.; Moran, D.; Wermer, P.; Goldfinger, S.; Deumling, D.; Murray, M. National Footprint and Biocapacity Accounts 2005: The Underlying Calculation Method; Global Footprint Network: Oakland, CA, USA, 2005; pp. 4–28. [Google Scholar]
  21. Welde, K.; Gebremariam, B. Effect of Land Use Land Cover Dynamics on Hydrological Response of Watershed: Case Study of Tekeze Dam Watershed, Northern Ethiopia. Int. Soil Water Conserv. Res. 2017, 5, 1–16. [Google Scholar] [CrossRef]
  22. Kanianska, R.; Jaďuďová, J.; Makovníková, J.; Kizeková, M.; Tomaškin, J. Ecosystem Services (Ekosystémové služby); Belianum: Banská Bystrica, Slovakia, 2016. (In Slovak) [Google Scholar]
  23. Finnveden, G.; Hauschild, M.Z.; Ekvall, T.; Guinée, J.; Heijungs, R.; Hellweg, S.; Koehler, A.; Pennington, D.; Suh, S. Recent Developments in Life Cycle Assessment. J. Environ. Manag. 2009, 91, 1–21. [Google Scholar] [CrossRef]
  24. Bakshi, B.R. A Thermodynamic Framework for Ecologically Conscious Process Systems Engineering. Comput. Chem. Eng. 2002, 26, 269–282. [Google Scholar] [CrossRef]
  25. Santos-Martin, F.; Viinikka, A.; Mononen, L.; Brander, L.; Vihervaara, P.; Liekens, I.; Potschin-Young, M. Creating an Operational Database for Ecosystems Services Mapping and Assessment Methods. One Ecosyst. 2018, 3, e26719. [Google Scholar] [CrossRef]
  26. De Groot, R.S.; Wilson, M.A.; Boumans, R.M.J. A Typology for the Classification, Description and Valuation of Ecosystem Functions, Goods and Services. Ecol. Econ. 2002, 41, 393–408. [Google Scholar] [CrossRef] [Green Version]
  27. Burkhard, B.; Kroll, F.; Müller, F.; Windhorst, W. Landscapes’ Capacities to Provide Ecosystem Services - a Concept for Land-Cover Based Assessments. Landsc. Online 2009, 15, 1–22. [Google Scholar] [CrossRef]
  28. Burkhard, B.; Kandziora, M.; Hou, Y.; Müller, F. Ecosystem Service Potentials, Flows and Demands-Concepts for Spatial Localisation, Indication and Quantification. Landsc. Online 2014, 34, 1–32. [Google Scholar] [CrossRef]
  29. Kandziora, M.; Burkhard, B.; Müller, F. Interactions of Ecosystem Properties, Ecosystem Integrity and Ecosystem Service Indicators—A Theoretical Matrix Exercise. Ecol. Indic. 2013, 28, 54–78. [Google Scholar] [CrossRef]
  30. Kaiser, G.; Burkhard, B.; Römer, H.; Sangkaew, S.; Graterol, R.; Haitook, T.; Sterr, H.; Sakuna-Schwartz, D. Mapping Tsunami Impacts on Land Cover and Related Ecosystem Service Supply in Phang Nga, Thailand. Nat. Hazards Earth Syst. Sci. 2013, 13, 3095–3111. [Google Scholar] [CrossRef] [Green Version]
  31. Vihervaara, P.; Kumpula, T.; Tanskanen, A.; Burkhard, B. Ecosystem Services–a Tool for Sustainable Management of Human–Environment Systems. Case Study Finnish Forest Lapland. Ecol. Complex. 2010, 7, 410–420. [Google Scholar] [CrossRef] [Green Version]
  32. Vihervaara, P.; Kumpula, T.; Ruokolainen, A.; Tanskanen, A.; Burkhard, B. The Use of Detailed Biotope Data for Linking Biodiversity with Ecosystem Services in Finland. Int. J. Biodivers. Sci. Ecosyst. Serv. Manag. 2012, 8, 169–185. [Google Scholar] [CrossRef]
  33. Kroll, F.; Müller, F.; Haase, D.; Fohrer, N. Rural–Urban Gradient Analysis of Ecosystem Services Supply and Demand Dynamics. Land Use Policy 2012, 29, 521–535. [Google Scholar] [CrossRef]
  34. Nedkov, S.; Burkhard, B. Flood Regulating Ecosystem Services—Mapping Supply and Demand, in the Etropole Municipality, Bulgaria. Ecol. Indic. 2012, 21, 67–79. [Google Scholar] [CrossRef]
  35. Schröter, M.; Bonn, A.; Klotz, S.; Seppelt, R.; Baessler, C. Atlas of Ecosystem Services Drivers, Risks, and Societal Responses; Schröter, M., Bonn, A., Klotz, S., Seppelt, R., Baessler, C., Eds.; Springer International Publishing: Berlin/Heidelberg, Germany, 2019; ISBN 978-3-319-96228-3. [Google Scholar]
  36. Černecký, J.; Gajdoš, P.; Špulerová, J.; Halada, Ľ.; Mederly, P.; Ulrych, L.; Ďuricová, V.; Švajda, J.; Černecká, Ľ.; Andráš, P.; et al. Ecosystems in Slovakia. J. Maps 2019, 16, 28–35. [Google Scholar] [CrossRef] [Green Version]
  37. Bukvareva, E.; Zamolodchikov, D.; Kraev, G.; Grunewald, K.; Narykov, A. Supplied, Demanded and Consumed Ecosystem Services: Prospects for National Assessment in Russia. Ecol. Indic. 2017, 78, 351–360. [Google Scholar] [CrossRef]
  38. Gascoigne, W.R.; Hoag, D.; Koontz, L.; Tangen, B.A.; Shaffer, T.L.; Gleason, R.A. Valuing Ecosystem and Economic Services across Land-Use Scenarios in the Prairie Pothole Region of the Dakotas, USA. Ecol. Econ. 2011, 70, 1715–1725. [Google Scholar] [CrossRef]
  39. Bateman, I.J.; Harwood, A.R.; Mace, G.M.; Watson, R.T.; Abson, D.J.; Andrews, B.; Binner, A.; Crowe, A.; Day, B.H.; Dugdale, S.; et al. Bringing Ecosystem Services into Economic Decision-Making: Land Use in the United Kingdom. Science 2013, 341, 45–50. [Google Scholar] [CrossRef]
  40. Frélichová, J.; Vačkář, D.; Pártl, A.; Loučková, B.; Harmáčková, Z.V.; Lorencová, E. Integrated Assessment of Ecosystem Services in the Czech Republic. Ecosyst. Serv. 2014, 8, 110–117. [Google Scholar] [CrossRef]
  41. Quintas-Soriano, C.; Martín-López, B.; Santos-Martín, F.; Loureiro, M.; Montes, C.; Benayas, J.; García-Llorente, M. Ecosystem Services Values in Spain: A Meta-Analysis. Environ. Sci. Policy 2016, 55, 186–195. [Google Scholar] [CrossRef]
  42. Vačkář, D.; Grammatikopoulou, I.; Daněk, J.; Lorencová, E. Methodological Aspects of Ecosystem Service Valuation at the National Level. One Ecosyst. 2018, 3, e25508. [Google Scholar] [CrossRef]
  43. Švajda, J. Mountain Research in Protected Areas in the Carpathians—A Brief Overview. Eco. Mont. J. Prot. Mt. Areas Res. 2018, 10, 77–78. [Google Scholar] [CrossRef] [Green Version]
  44. Fleischer, P.; Pichler, V.; Fleischer Jr, P.; Holko, L.; Máliš, F.; Gömöryová, E.; Cudlín, P.; Holeksa, J.; Michalová, Z.; Homolová, Z.; et al. Forest Ecosystem Services Affected by Natural Disturbances, Climate and Land-Use Changes in the Tatra Mountains. Clim. Res. 2017, 73, 57–71. [Google Scholar] [CrossRef] [Green Version]
  45. Považan, R.; Getzner, M.; Švajda, J. Value of Ecosystem Services in Mountain National Parks. Case Study of Veľká Fatra National Park (Slovakia). Pol. J. Environ. Stud. 2014, 23, 1699–1710. [Google Scholar]
  46. Costanza, R.; de Groot, R.; Braat, L.; Kubiszewski, I.; Fioramonti, L.; Sutton, P.; Farber, S.; Grasso, M. Twenty Years of Ecosystem Services: How Far Have We Come and How Far Do We Still Need to Go? Ecosyst. Serv. 2017, 28, 1–16. [Google Scholar] [CrossRef]
  47. Bateman, I.J.; Mace, G.M. The Natural Capital Framework for Sustainably Efficient and Equitable Decision Making. Nat. Sustain. 2020, 3, 776–783. [Google Scholar] [CrossRef]
  48. Dasgupta, P. The Economics of Biodiversity; The Dasgupta Review; HM Treasury: London, UK, 2021; ISBN 978-1-911680-29-1. [Google Scholar]
  49. Kenter, J.O. Deliberative and Non-Monetary Valuation. In Routledge Handbook of Ecosystem Services, 1st ed.; Potschin, M., Haines-Young, R., Fish, R., Turner, R.K., Eds.; Routledge, Taylor & Francis Group: London, UK, 2016; pp. 271–288. [Google Scholar]
  50. Yang, Q.; Liu, G.; Casazza, M.; Campbell, E.T.; Giannetti, B.F.; Brown, M.T. Development of a New Framework for Non-Monetary Accounting on Ecosystem Services Valuation. Ecosyst. Serv. 2018, 34, 37–54. [Google Scholar] [CrossRef]
  51. Elliot, T.; Bertrand, A.; Babí Almenar, J.; Petucco, C.; Proença, V.; Rugani, B. Spatial Optimisation of Urban Ecosystem Services through Integrated Participatory and Multi-Objective Integer Linear Programming. Ecol. Model. 2019, 409, 108774. [Google Scholar] [CrossRef]
  52. Acharya, R.P.; Maraseni, T.; Cockfield, G. Global Trend of Forest Ecosystem Services Valuation—An Analysis of Publications. Ecosyst. Serv. 2019, 39, 100979. [Google Scholar] [CrossRef]
  53. Lee, D.; Oh, K.; Suh, J. Diagnosis and Prioritization of Vulnerable Areas of Urban Ecosystem Regulation Services. Land 2022, 11, 1804. [Google Scholar] [CrossRef]
  54. La Notte, A.; Turvani, M.; Giaccari, S. Economic valuation of ecosystem services at local level for policy makers and planners. The case of the island of St. Erasmo in the Lagoon of Venice. Environ. Econ. 2011, 2, 87–103. [Google Scholar]
  55. Christie, M.; Fazey, I.; Cooper, R.; Hyde, T.; Kenter, J.O. An Evaluation of Monetary and Non-Monetary Techniques for Assessing the Importance of Biodiversity and Ecosystem Services to People in Countries with Developing Economies. Ecol. Econ. 2012, 83, 67–78. [Google Scholar] [CrossRef]
  56. Guerry, A.D.; Polasky, S.; Lubchenco, J.; Chaplin-Kramer, R.; Daily, G.C.; Griffin, R.; Ruckelshaus, M.; Bateman, I.J.; Duraiappah, A.; Elmqvist, T.; et al. Natural Capital and Ecosystem Services Informing Decisions: From Promise to Practice. Proc. Natl. Acad. Sci. USA 2015, 112, 7348–7355. [Google Scholar] [CrossRef] [PubMed] [Green Version]
  57. Borsuk, M.E.; Mavrommati, G.; Samal, N.R.; Zuidema, S.; Wollheim, W.; Rogers, S.H.; Thorn, A.M.; Lutz, D.; Mineau, M.; Grimm, C.; et al. Deliberative Multiattribute Valuation of Ecosystem Services across a Range of Regional Land-Use, Socioeconomic, and Climate Scenarios for the Upper Merrimack River Watershed, New Hampshire, USA. Ecol. Soc. 2019, 24, 11. [Google Scholar] [CrossRef] [Green Version]
  58. Považan, R.; Getzner, M.; Švajda, J. On the valuation of ecosystem services in Muránska Planina National Park (Slovakia). Eco. Mont. J. Prot. Mt. Areas Res. Manag. 2015, 7, 61–69. [Google Scholar] [CrossRef]
  59. Marta-Pedroso, C.; Laporta, L.; Gama, I.; Domingos, T. Economic Valuation and Mapping of Ecosystem Services in the Context of Protected Area Management (Natural Park of Serra De São Mamede, Portugal). One Ecosyst. 2018, 3, e26722. [Google Scholar] [CrossRef] [Green Version]
  60. Müller, F.; Bicking, S.; Ahrendt, K.; Kinh Bac, D.; Blindow, I.; Fürst, C.; Haase, P.; Kruse, M.; Kruse, T.; Ma, L.; et al. Assessing Ecosystem Service Potentials to Evaluate Terrestrial, Coastal and Marine Ecosystem Types in Northern Germany—An Expert-Based Matrix Approach. Ecol. Indic. 2020, 112, 106116. [Google Scholar] [CrossRef]
  61. Sutherland, I.J.; Villamagna, A.M.; Dallaire, C.O.; Bennett, E.M.; Chin, A.T.M.; Yeung, A.C.Y.; Lamothe, K.A.; Tomscha, S.A.; Cormier, R. Undervalued and under Pressure: A Plea for Greater Attention toward Regulating Ecosystem Services. Ecol. Indic. 2018, 94, 23–32. [Google Scholar] [CrossRef]
  62. Braat, L.C.; de Groot, R. The Ecosystem Services Agenda:Bridging the Worlds of Natural Science and Economics, Conservation and Development, and Public and Private Policy. Ecosyst. Serv. 2012, 1, 4–15. [Google Scholar] [CrossRef] [Green Version]
  63. Burkhard, B.; Fath, B.D.; Müller, F. Adapting the Adaptive Cycle: Hypotheses on the Development of Ecosystem Properties and Services. Ecol. Model. 2011, 222, 2878–2890. [Google Scholar] [CrossRef]
  64. Burkhard, B.; Kroll, F.; Nedkov, S.; Müller, F. Mapping Ecosystem Service Supply, Demand and Budgets. Ecol. Indic. 2012, 21, 17–29. [Google Scholar] [CrossRef]
  65. Jacobs, S.; Burkhard, B.; Van Daele, T.; Staes, J.; Schneiders, A. ‘The Matrix Reloaded’: A Review of Expert Knowledge Use for Mapping Ecosystem Services. Ecol. Model. 2015, 295, 21–30. [Google Scholar] [CrossRef]
  66. Hermann, A.J.; Gibson, G.A.; Bond, N.A.; Curchitser, E.N.; Hedstrom, K.; Cheng, W.; Wang, M.; Stabeno, P.J.; Eisner, L.; Cieciel, K.D. A Multivariate Analysis of Observed and Modeled Biophysical Variability on the Bering Sea Shelf: Multidecadal Hindcasts (1970–2009) and Forecasts (2010–2040). Deep. Sea Res. Part II Top. Stud. Oceanogr. 2013, 94, 121–139. [Google Scholar] [CrossRef]
  67. Stoll, S.; Frenzel, M.; Burkhard, B.; Adamescu, M.; Augustaitis, A.; Baeßler, C.; Bonet, F.J.; Carranza, M.L.; Cazacu, C.; Cosor, G.L.; et al. Assessment of Ecosystem Integrity and Service Gradients across Europe Using the LTER Europe Network. Ecol. Model. 2015, 295, 75–87. [Google Scholar] [CrossRef]
  68. Jiang, C.; Yang, Z.; Wen, M.; Huang, L.; Liu, H.; Wang, J.; Chen, W.; Zhuang, C. Identifying the Spatial Disparities and Determinants of Ecosystem Service Balance and Their Implications on Land Use Optimization. Sci. Total Environ. 2021, 793, 148472. [Google Scholar] [CrossRef]
  69. Depellegrin, D.; Pereira, P.; Misiunė, I.; Egarter-Vigl, L. Mapping Ecosystem Services Potential in Lithuania. Int. J. Sustain. Dev. Amp. World Ecol. 2016, 23, 441–455. [Google Scholar] [CrossRef]
  70. Burkhard, B.; Maes, J. Mapping Ecosystem Services; Pensoft Publishers: Sofia, Bulgaria, 2017. [Google Scholar] [CrossRef]
  71. Jacobs, S.; Burkhard, B. Applying expert knowledge for ecosystem services quantification. In Mapping Ecosystem Services; Burkhard, B., Maes, J., Eds.; Pensoft Publishers: Sofia, Bulgaria, 2017. [Google Scholar] [CrossRef]
  72. Roche, P.K.; Campagne, C.S. Are Expert-Based Ecosystem Services Scores Related to Biophysical Quantitative Estimates? Ecol. Indic. 2019, 106, 105421. [Google Scholar] [CrossRef]
  73. NAFC-SSCRI. Distribution of Agricultural Land in Agro-Climatic Regions of Slovakia. 2015. Available online: http://www.podnemapy.sk/portal/reg_pod_infoservis/klima/klima.aspx (accessed on 30 April 2017).
  74. Džatko, M. Hodnotenie Produkčného Potenciálu Poľnohospodárskych Pôd a Pôdno-Ekologických Regiónov Slovenska; VÚPOP: Bratislava, Slovakia, 2002; p. 87. [Google Scholar]
  75. Makovníková, J.; Pálka, B.; Širáň, M.; Houšková, B.; Kanianska, R.; Kizeková, M. Ecosystem Services in Differently Used Agroecosystems along a Climatic Gradient in Slovakia. Open J. Ecol. 2018, 08, 623–645. [Google Scholar] [CrossRef] [Green Version]
  76. Makovníková, J.; Kološta, S.; Flaška, F.; Pálka, B. Regional Differentiations of the Potential of Cultural Ecosystem Services in Relation to Natural Capital—A Case Study in Selected Regions of the Slovak Republic. Land 2022, 11, 270. [Google Scholar] [CrossRef]
  77. Heckwolf, M.J.; Peterson, A.; Jänes, H.; Horne, P.; Künne, J.; Liversage, K.; Sajeva, M.; Reusch, T.B.H.; Kotta, J. From Ecosystems to Socio-Economic Benefits: A Systematic Review of Coastal Ecosystem Services in the Baltic Sea. Sci. Total Environ. 2021, 755, 142565. [Google Scholar] [CrossRef]
  78. Frélichová, J.; Fanta, J. Ecosystem Service Availability in View of Long-Term Land-Use Changes: A Regional Case Study in the Czech Republic. Ecosyst. Health Sustain. 2015, 1, 1–15. [Google Scholar] [CrossRef] [Green Version]
  79. Maes, J.; Fabrega, N.; Zulian, G.; Barbosa, A.; Vizcaino, P.; Ivits, E.; Polce, C.; Vandecasteele, I.; Rivero, I.; Guerra, C.; et al. Mapping and Assessment of Ecosystems and their Services: Trends in ecosystems and ecosystem services in the European Union between 2000 and 2010; Publications Office of the European Union: Luxembourg, 2015; 131p. [Google Scholar] [CrossRef]
  80. Nedkov, S.; Zhiyanski, M.; Borisova, B.; Bratanova-Doncheva, S. Mapping and Assessment of Ecosystem Condition and Ecosystem Services across Different Scales and Domains in Europe. One Ecosyst. 2018, 3, e29288. [Google Scholar] [CrossRef]
  81. Urli, M.; Delzon, S.; Eyermann, A.; Couallier, V.; García-Valdés, R.; Zavala, M.A.; Porté, A.J. Inferring Shifts in Tree Species Distribution Using Asymmetric Distribution Curves: A Case Study in the Iberian Mountains. J. Veg. Sci. 2013, 25, 147–159. [Google Scholar] [CrossRef]
  82. Delzon, S.; Urli, M.; Samalens, J.-C.; Lamy, J.-B.; Lischke, H.; Sin, F.; Zimmermann, N.E.; Porté, A.J. Field Evidence of Colonisation by Holm Oak, at the Northern Margin of Its Distribution Range, during the Anthropocene Period. PLoS ONE 2013, 8, e80443. [Google Scholar] [CrossRef] [Green Version]
  83. Ellison, D.; Morris, C.E.; Locatelli, B.; Sheil, D.; Cohen, J.; Murdiyarso, D.; Gutierrez, V.; van Noordwijk, M.; Creed, I.F.; Pokorny, J.; et al. Trees, Forests and Water: Cool Insights for a Hot World. Glob. Environ. Chang. 2017, 43, 51–61. [Google Scholar] [CrossRef]
  84. European Environment Agency (EU Body or Agency). Climate Change, Impacts and Vulnerability in Europe 2016: An Indicator-Based Report. Available online: https://op.europa.eu/en/publication-detail/-/publication/794dcba3-e922-11e6-ad7c-01aa75ed71a1/language-en (accessed on 20 September 2022).
  85. Mederly, P.; Černecký, J.; Špulerová, J.; Izakovičová, Z.; Ďuricová, V.; Považan, R.; Švajda, J.; Močko, M.; Jančovič, M.; Gusejnov, S.; et al. National Ecosystem Services Assessment in Slovakia—Meeting Old Liabilities and Introducing New Methods. One Ecosyst. 2020, 5, 53677. [Google Scholar] [CrossRef]
  86. Škodová, M.; Sabo, P.; Švajda, J.; Vološčuk, I. Ecosystem Services in the National Park Malá Fatra. Geogr. Inf. 2016, 20, 311–325. [Google Scholar] [CrossRef]
  87. Steinhoff-Knopp, B.; Kuhn, T.K.; Burkhard, B. The Impact of Soil Erosion on Soil-Related Ecosystem Services: Development and Testing a Scenario-Based Assessment Approach. Environ. Monit. Assess. 2021, 193, 1–18. [Google Scholar] [CrossRef] [PubMed]
  88. Thom, D.; Seidl, R. Natural Disturbance Impacts on Ecosystem Services and Biodiversity in Temperate and Boreal Forests. Biol. Rev. 2015, 91, 760–781. [Google Scholar] [CrossRef] [PubMed]
  89. Bodnaruk, E.W.; Kroll, C.N.; Yang, Y.; Hirabayashi, S.; Nowak, D.J.; Endreny, T.A. Where to Plant Urban Trees? A Spatially Explicit Methodology to Explore Ecosystem Service Tradeoffs. Landsc. Urban Plan. 2017, 157, 457–467. [Google Scholar] [CrossRef] [Green Version]
  90. Grêt-Regamey, A.; Sirén, E.; Brunner, S.H.; Weibel, B. Review of Decision Support Tools to Operationalize the Ecosystem Services Concept. Ecosyst. Serv. 2017, 26, 306–315. [Google Scholar] [CrossRef] [Green Version]
  91. Makovníková, J.; Pálka, B.; Širáň, M.; Kanianska, R.; Kizeková, M.; Jaďuďová, J. Modeling and Evaluation Agroecosystem Services; Belianum: Banská Bystrica, Slovakia, 2017; pp. 15–16. (In Slovak) [Google Scholar]
  92. Purvis, B.; Mao, Y.; Robinson, D. Three Pillars of Sustainability: In Search of Conceptual Origins. Sustain. Sci. 2018, 14, 681–695. [Google Scholar] [CrossRef] [Green Version]
  93. Raudsepp-Hearne, C.; Peterson, G.D.; Bennett, E.M. Ecosystem Service Bundles for Analyzing Tradeoffs in Diverse Landscapes. Proc. Natl. Acad. Sci. USA 2010, 107, 5242–5247. [Google Scholar] [CrossRef] [PubMed] [Green Version]
  94. O’Farrell, P.J.; Anderson, P.M.L. Sustainable Multifunctional Landscapes: A Review to Implementation. Curr. Opin. Environ. Sustain. 2010, 2, 59–65. [Google Scholar] [CrossRef]
  95. Otte, A.; Simmering, D.; Wolters, V. Biodiversity at the Landscape Level: Recent Concepts and Perspectives for Multifunctional Land Use. Landsc. Ecol. 2007, 22, 639–642. [Google Scholar] [CrossRef]
  96. Hou, Y.; Burkhard, B.; Müller, F. Uncertainties in Landscape Analysis and Ecosystem Service Assessment. J. Environ. Manag. 2013, 127, 117–131. [Google Scholar] [CrossRef]
Figure 1. Map of the location of model regions within Slovakia.
Sustainability 15 01076 g001
Figure 2. Area representation of land covers (Ae) in model regions using the CLC database, LPIS database and NFC database (area in hectares).
Sustainability 15 01076 g002
Figure 3. Scheme of evaluation of regulating ecosystem services in model regions.
Sustainability 15 01076 g003
Figure 4. Total point value (score) of the potential of regulating services of individual land covers (“low” yellow color to 400 points, “middle” orange color to 600 points, “high” red color over 600 points).
Sustainability 15 01076 g004
Figure 5. Regulating ecosystem services—average non-monetary point value of the potential of individual regulating ecosystem services per hectare.
Sustainability 15 01076 g005
Figure 6. Regulating ecosystem services—total point value of the potential of individual ecosystem services.
Sustainability 15 01076 g006
Figure 7. (ad) Area distribution of point values of regulating ecosystem services (“low” yellow color to 400 points, “middle” orange color to 600 points, “high” red color over 600 points).
Sustainability 15 01076 g007
Figure 8. Value of individual regulating ecosystem services in euros.
Sustainability 15 01076 g008
Figure 9. Total monetary value of regulating ecosystem services in model regions.
Sustainability 15 01076 g009
Figure 10. Comparison of districts using cluster (Dendrogram) and sun-ray analysis (multivariate visualization).
Sustainability 15 01076 g010
Figure 11. Weighted average of point values of regulating ecosystem services—differences between altitudes in model regions.
Sustainability 15 01076 g011
Figure 12. Values of ecosystem services up to 300 m (average values of the potential of regulatory services in similar regions).
Sustainability 15 01076 g012
Figure 13. Values of ecosystem services above 300 m (average values of the potential of regulatory services in similar regions).
Sustainability 15 01076 g013
Table 1. Model regions—characteristics.
RegionArea (km2)Population Density (km2)ClimateAltitudeGeographical Location
Michalovce101910999.4% within warm climate.96% of the landscape up to 300 m above sea level and 92% of the landscape is on the plain.Bordered on the north by the Vihorlat Hills, part of the East Slovak Lowland.
Piešťany38116495.7% within very warm climate.83.5% of the territory has an altitude of 300 m above sea level.Located in the northern part of the Danubian Lowland within the part of the Trnava Uplands. In the west, it is bordered by the Little Carpathians; in the east, it is bordered by Považský Inovec.
Krupina5483858.9% within very warm climate and 36.6% moderately warm climate.60% of the landscape has an altitude from 300–600 m above sea level. 26% of the area is on the plain.From the northwest, it is covered by the Štiavnica Mountains, from the northeast by the Krupina plain, and from the south by the Ipeľ Uplands.
Brezno12654886.9% within moderately cool climate.88.6% of the landscape has an altitude over 600 m above sea level with the lowest point at 406 m above sea level.The entire length of the northern side is formed by the southern slopes of the Low Tatras ridge, on the southern side by the Poľana massif and the Veporské Hills, and in the central part by the Horehronské Valley; from the east partially extends the Spiš-Gemer karst.
Table 2. Modified matrix for evaluating the potential of regulating ecosystem services according to [3,28,60], with modification for forest categories (expert estimation of NPPC and NFC).
Land CoverCapacity Scores
Local Climate RegulationGlobal Climate RegulationAir quality RegulationWater RegulationErosion RegulationFiltration/ Immobilization of Risk ElementsPollinationBiodiversity Protection
Arable land4020202030303030
Grassland4070203090808050
Vineyards3030301030509050
Fruit trees and berries3030301030508050
Agro-forestry areas: fast growing woody plants4070206090709040
Water bodies704054030303070
Wetlands9090304030807080
Natural protected areas9090906090908090
Productive forest9090906090707040
Protective forest9090906090907070
Special purpose forest9090906090907070
Explanation: yellow color to 30 points, blue color 31–60 points, green color above 60 points.
Table 3. The computation of the non-monetary value (scores) of regulating ecosystem services based on the potential matrix table.
Score/Value FormulaVariables
The complex index score for individual ecosystem serviceISESISES = (∑ISe × Ae)ISe—the index score of the potential of the evaluated service of a particular ecosystem
Ae—area of a particular ecosystem
Weighted average score for individual ecosystem service (in scores per ha)ISESwISESw = (∑ISe × Ae)/AA—the total area of ecosystems in a pilot region
Complex non-monetary value of ES in regionNMVNMV = (∑ISES)ISES—the complex index score for individual ecosystem service
Table 4. The computation of the monetary value of regulating ecosystem services in Euro based on potential matrix.
Value FormulaVariables
The complex monetary value for individual ecosystem serviceMISESMISES = ISES × MeISES—the complex index score for individual ecosystem service
Me—monetary value of score 1 in EUR
Weighted average value for individual ecosystem service (in EUR per ha)MISESwMISESw = ISESw × MeMISESw—weighted average score for individual ecosystem service
Me—monetary value of score 1 in EUR
Complex
monetary value
MVMV = NMV ×MeNMV—complex non-monetary value
Me—monetary value of score 1 in EUR
Table 5. Spearman correlation coefficients of the total value of regulating ecosystem services between model regions.
RegionBreznoMichalovcePiešťanyKrupina
Brezno 0.61790.67160.9411 **
Michalovce0.6179 0.9169 **0.8075
Piestany0.67160.9169 ** 0.7696
Krupina0.9411 **0.80750.7696
** Statistically significant at the level of significance α = 0.01.
Table 6. Average point values of the potential of regulating ecosystem services as a function of altitude.
Ecosystem ServiceAltitudeBreznoKrupinaMichalovcePiešťany
Point Value per Hectare
Local climate regulationup to 300 m058.048.746.9
over 300 m80.565.490.086.3
Global climate regulationup to 300 m053.238.230.3
over 300 m84.766.990.086.5
Air quality regulationup to 300 m045.130.428.8
over 30076.655.690.084.8
Water regulationup to 300 m036.228.225.6
over 300 m54.042.760.057.4
Erosion regulationup to 300 m061.146.638.7
over 300 m88.274.090.087.6
Filtration/immobilization of risk elementsup to 300 m055.644.137.2
over 30075.163.482.673.9
Pollinationup to 300 m052.742.536.6
over 300 m70.461.870.069.0
Biodiversity protectionup to 300 m042.138.834.4
over 30048.442.758.948.2
Disclaimer/Publisher’s Note: The statements, opinions and data contained in all publications are solely those of the individual author(s) and contributor(s) and not of MDPI and/or the editor(s). MDPI and/or the editor(s) disclaim responsibility for any injury to people or property resulting from any ideas, methods, instructions or products referred to in the content.

