Abstract
Scientifically judging the environmental effects of embedding in the global value chain (GVC) has important theoretical significance and practical value, especially for emerging economies, but there are few studies on the relationship between GVC embedment and environmental pollution in emerging economies. Based on the classical theory of Grossman, this study analyzed the mechanism framework of GVC embedment on environmental pollution and then used the panel data of 16 emerging economies from 1998 to 2019 for empirical tests. After using the FGLS regression model and a series of empirical tests, the main conclusions are as follows. (1) The impact of GVC embedment on environmental pollution in emerging economies includes five effects. The scale effect brings about the expansion of production activities and increases the emission of environmental pollutants. The technological effect refers to improvements in the level of clean technology, which are brought about by the acquisition and acceptance of “technology spillover” in the value chain. The structural effect is the reduction in pollutant emissions and improvement in the environment through economic upgrading. The income effect is a “demand push” to improve the environment and reduce pollution triggered by an increase in national income. The lock-in effect means that the leaders of the value chain hinder emerging economies from achieving high-level economic upgrades, intending to lock them into the links with relatively high pollution. These effects are not static but are interlinked and affect each other. (2) The results of the empirical study show that embedding in the GVC initially has a negative impact on the environment, but with the deepening of GVC embedment, environmental pollution will decrease; that is, it shows an inverted U-shaped relationship. (3) The density of energy use, the share of fossil fuels, and the per capita income of emerging economies are positively correlated with environmental pollution, while population density and manufacturing share are negatively correlated. This study also provides suggestions on how to improve the environment in the process of GVC embedment in the future.
1. Introduction
Since the 21st century began, environmental pollution has become a major theoretical and social issue, which has plagued the economic development of countries around the world. Among the range of environmental problems, the emission of CO2 is the most serious one, which represents two-thirds of the global greenhouse gas [1]. As a new engine of the global economy [2], emerging economies have witnessed a rapid increase in CO2 emissions with the rapid growth of their economies. Wang and Wei [3] calculated the carbon emissions of major emerging economies, pointing out that they accounted for more than half of the global total. Figure 1 shows the real-time carbon emission data for 2019; the representative countries of emerging economies, such as China, India, Indonesia, Brazil, Mexico, and South Africa, all had a “hot zone” status, which represents high emissions. This figure points to a boom in regional economic activity in emerging economies (the vast majority of carbon emissions are linked with economic activity), and it also indicates that if we want to make efforts to control global carbon emissions, emerging economies must be the focus.
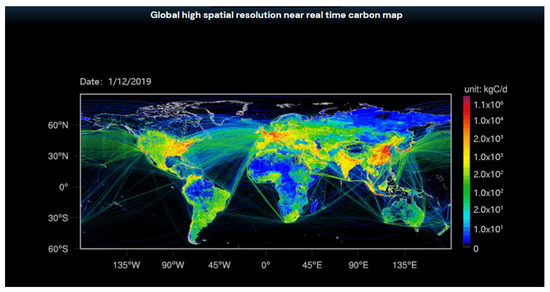
Figure 1.
The global near-real-time carbon map (high spatial resolution). Data source: the website of Carbon Monitor (www.carbonmonitor.org.cn), accessed on 1 November 2022.
Extensive participation in the global value chain (GVC) and full utilization of international specialization are important reasons for emerging economies’ rapid rise, but is this, at the same time, an important driver of their environmental degradation? Andrew and Peters [4] suggested that international trade accounts for one-quarter of global carbon emissions, whereas Boutabba [5] and Skai et al. [6] established the causal relationship between carbon emissions and international trade. Some scholars argue that international trade could “outsource” dirty production from developed countries to the so-called “pollution heaven”, which is mainly located in emerging economies [7,8]. This type of “outsourcing” is mainly achieved through the GVC. Liu et al. [9] and Ye et al. [10] found that the process of producing goods and the associated carbon emissions are shifting through the GVC from consuming countries to producing countries; in other words, from developed countries to developing countries. Thus, the GVC contributes to the change in the distribution of global carbon emissions and leads to a separation between carbon consumption and carbon emissions. Emerging countries are mainly responsible for the production of goods in the GVC, so they produce more carbon emissions through this separation and create more environmental pollution.
For this reason, it is necessary to include the GVC in research into controlling environmental pollution in emerging economies. Unfortunately, it has not attracted enough attention for a long time. Among the few studies, Meng et al. [11] first linked the GVC to carbon emissions, and Wang et al. [12] carried out an empirical study and found that the relationship between participation in the GVC and CO2 emissions had an inverted U-shape correlation. Later, some scholars conducted research on developing countries and reached unanimous conclusions; however, few of them have discussed the influencing mechanism of the GVC on CO2 emissions in developing countries.
A correct understanding of the environmental effects of GVC embedment and its influencing mechanism is of great significance. It could help emerging economies to reduce pollutant emissions and improve their environments in the context of the international division. In this study, we analyzed the mechanisms of the impact of GVC embedment on environmental pollution, put forward a framework of the influencing mechanisms with five aspects, and established a research model; then, we took 16 representative emerging economies as the research sample, and we used 22 years of panel data (from 1998 to 2019) to test the analysis. Based on the empirical results, the corresponding conclusions, countermeasures, and future research outlooks could be presented.
The possible marginal contributions of this study are as follows. First, we selected emerging economies as the research sample; most of the available studies were conducted from the global perspective or on all developing countries. The global perspective is not a good way to identify the “outsourcing” and separation effects. On the other hand, there are many developing countries with low participation in the GVC, so including these countries may distort the study’s results. In other words, the effect of the GVC on the carbon emissions of production-side countries is not well reflected, but our selection of emerging economies was able to avoid these problems. Secondly, we proposed a framework of the influencing mechanisms with five aspects, then we discussed the interrelationships among the aspects, which provided a systematic understanding for subsequent research. Research into this issue will help to clarify the understanding of the environmental effects of GVC embedment, and it is important for emerging economies to gain higher benefits from GVC embedment.
The rest of this article includes the following aspects. Section 2 contains the literature review; Section 3 analyzes the possible framework of the influencing mechanisms; Section 4 establishes the research model, the index used for measurement, and the data sources; Section 5 reports and discusses the empirical results; and Section 6 includes the conclusion, policy suggestion, and future prospects.
2. Literature Review
For the environmental pollution caused by the international division of labor factors, traditional studies have focused on the impact of multinational corporations (MNCs) and foreign direct investment, but the findings have been significantly different. The beneficial theory argues that FDI brings new green production technologies, advanced pollution control technologies, and emission management methods to developing countries, which can improve their environmental quality [13,14]. The harmful theory argues that MNCs will aggravate environmental pollution in developing host countries by transferring polluting industries [15,16]. The uncertainty theory argues that FDI can have multiple and complex effects [17].
Since the 1990s, the relationship between international trade and environmental pollution has become a new research theme. At present, studies on this issue have focused on the use of the MRIO (multi-regional input–output) model; the model can be used to calculate the emissions of the implied pollutants (mainly implied carbon) of trade. In this way, scholars have explained the pollutant emissions from the activities of trade as a whole or via subsectors in different periods [18,19,20].
With the in-depth development of economic globalization and specialization in production, academics have started to shift the research on environmental pollution to the influence of the GVC. At present, scholars mainly focus on the relationship between embeddedness in the GVC and the implied carbon of trade. Meng, Peters, and Wang [21] innovatively proposed a new accounting system for tracing carbon emissions in the GVC, which was combined with the classification and algorithm of the GVC’s added value, proposed by Wang et al. [22] and Koopman et al. [23]. This system explores carbon emissions on the production side and the consumption side and explains which producers and consumers are responsible for a country’s carbon emissions.
For the relationship between GVC embedment and carbon emissions in developing countries, scholars have proposed three different views [24,25]. One view holds that embedding developing countries into the GVC will increase their carbon emissions [26,27]. Some scholars have argued that developing countries will actively reduce the intensity of their environmental regulations (the so-called “race to the bottom”); in this way, they can gain advantages from industries transferred from developed countries, which are often pollution-intensive. On the other hand, developing countries embedded in the GVC will ship out intermediate products with high-intensity pollution in the production process; in other words, they have more carbon emissions included in their export process [28,29]. Another view is that developing countries could reduce carbon emission intensity by learning advanced technology and with experience [30], and the FDI absorbed could also generate green technology spillover effects, which would promote the progress of domestic emission reduction technology [31]. Other scholars believe that the relationship between GVC embedment and carbon emissions is not a simple linear relationship. When emerging countries initially participate in the labor division of the GVC, their carbon emissions will increase, but with the development of GVC embedment, their energy consumption intensity will gradually decrease, thus reducing carbon emissions [26]. Finally, some researchers have conducted separate studies based on heterogeneity, revealing that with different embedding modes and degrees the carbon emission intensity of production is significantly different. Wang and Yao [32] argued that developed countries mainly participate in the GVC with the forward embedding pattern, which helps them transfer pollution-intensive production processes to developing countries, while Su et al. [33] and Qian et al. [34] pointed out that developing countries are more inclined to participate through the backward embedding pattern, in which they engage in low-end production chains by importing foreign intermediate products.
These existing studies are of great theoretical and practical significance for an in-depth study. Economic activities inevitably produce carbon emissions; engaging in heavy industry and processing and manufacturing activities will create more environmental pollution than other activities, such as services, light industry, R&D, and marketing. The difference in the international division between emerging economies and developed countries inevitably results in disparate environmental pollution emissions. Existing research has ignored the impact of GVC embedment on the overall environmental pollution in emerging economies for a long time. Some recent studies have begun to pay attention to this problem, but only with a relatively small sample size for analysis, and they have not reached relatively consistent conclusions, let alone a complete analytical framework of the influencing mechanisms.
3. Analysis of the Influencing Mechanism
Since the mid-to-late 1970s, the GVC has gradually become the dominant mode of the contemporary international division. As the value-added links of products have continuously decomposed, developing countries have found more opportunities to participate in the GVC, and they have been embedded in labor-intensive manufacturing or assembly processes. The division of labor and trade-in value chains has stimulated the factor potential of developing countries; it also brought about a boom in domestic production, which, in turn, has promoted the rapid rise of emerging economies. The expansion of the scale of production and economic growth have also brought about an increase in energy consumption and pollution emissions. From this perspective, embedding in the GVC will bring about deterioration due to overall environmental pollution, but these negative effects are not the whole picture. Based on the classical research idea of the three impact paths of the scale effects, structural effects, and technological effects of trade on the environment [35], we propose that GVC embedment will produce five environmental effects, and we believe that these five effects are interrelated and influence each other so that their combined effects form the final relationship between GVC embedment and the overall environmental quality of a country (or its environmental pollutant emissions).
3.1. Environmental Effects of GVC Embedment
3.1.1. Scale Effect
Embedding within the GVC has led to the expansion of the scale of production and the economic scale in emerging economies. As their energy consumption has risen rapidly, their pollution emissions have also risen. At the sectoral level, industry, especially manufacturing, is a major sector that emits many kinds of pollutants, and manufacturing is also emerging economies’ most mainstream industry embedded in the GVC. In the division of the manufacturing industry’s value chain, developed countries keep the R&D, design, marketing, and aftersales service links with high added value and low emissions at home, while the midstream links of the value chain, such as processing, manufacturing, and assembly, which have low added value, high energy consumption, and high pollution, are transferred to emerging economies. In the GVC dominated by developed countries’ MNCs, the division of labor in emerging economies is at a disadvantage, located at the bottom of the value-added “smile curve” and the top of the environmental “crying curve” (see Figure 2). Therefore, as the scope of embedded industries expands, the emission of environmental pollutants also increases.
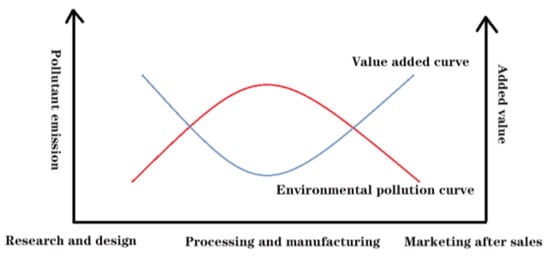
Figure 2.
Value-added and environmental pollution curves of the value chain.
3.1.2. Structural Effects
At the early stages of GVC embedment, emerging economies are at a disadvantage in the division of low-end labor. In order to obtain more added value and lower environmental costs, upgrading activities from the processing and manufacturing links to the upstream or downstream participants in the value chain, such as research and development, marketing, or other links, have become the common goals pursued by governments and processing enterprises. Embedded enterprises gradually promote industrial upgrades in the GVC through technology spillover effects, “learning by doing” effects, and technological imitation. With the growth of the domestic economy, domestic vocational and technical education, and higher education have also developed rapidly, and thus, the supply capacity of middle and senior technical professionals has increased. Leading enterprises in the GVC have noticed the difference in the price of human capital between developed countries and emerging economies, so they have started to set up R&D centers and sale centers for certain products in some emerging economies. The government’s policy support, enterprises’ profit-oriented investments, the rapid development of human capital, and the new strategic layout of the value chain of MNCs have led to a leap in the integration of industrial structure for emerging economies, while the transformation and upgrading of industrial structures have promoted improvements in enterprises’ production efficiency and caused a change in the structure of energy demand, thus reducing pollution emissions.
3.1.3. Technological Effects
Leading enterprises in the GVC generally have more advanced energy utilization technology and equipment for cleaner production. Embedded enterprises in emerging economies can obtain opportunities to reduce emissions by importing equipment and technology, with technology spillover, and through learning effects in the value chain. At the same time, with the international community’s extensive attention on and supervision of CSR (corporate social responsibility), MNCs must be responsible for the social and environmental impacts of the value chains under their control. Therefore, MNCs take environmental protection factors as one of the criteria of value chain participation or one of the conditions for obtaining orders. Such environmental requirements will put direct pressure on embedded enterprises; they have to take the initiative in introducing technology and technological innovations to reduce the consumption of energy and emissions.
3.1.4. Income Effects
As emerging economies have become more embedded in the GVC, the scale of their production and employment has expanded, and people’s income and living standards have gradually increased. People have changed their basic economic needs from employment and food to the pursuit of a better life. A healthy ecological environment has become necessary for economic development. Such “bottom-up” social demands form a “force demand”, which forces the government to strengthen environmental governance and forces enterprises to take more stringent measures to save energy, reduce carbon emissions, and implement cleaner production techniques.
3.1.5. Low-End Lock-In Effects
In terms of the operational characteristics of the GVC, the structural upgrades and educational catch-up effects of emerging economies are carried out in the context of multinational corporations’ governance. Generally speaking, manufacturing enterprises are more likely to receive technological spillovers and active help from the leading enterprises in processing and producing upgrades. They will also achieve significant results by improving energy utilization and reducing environmental pollution. In contrast, in the process of converting to the functional upgrades and chain upgrades of emerging economies, MNCs will use various methods to hinder foundry enterprises for their own competitive interests and monopoly needs, making it difficult to realize a transition to links with low energy consumption and low pollution, such as R&D or brand marketing.
3.2. Relationship of the Five Effects
The five effects of embedment in the GVC are not isolated and static; they are interconnected and affect each other. They were used in combination to build a basic framework of the influencing mechanisms.
The scale effect is the starting point for the other four effects (see Figure 3).
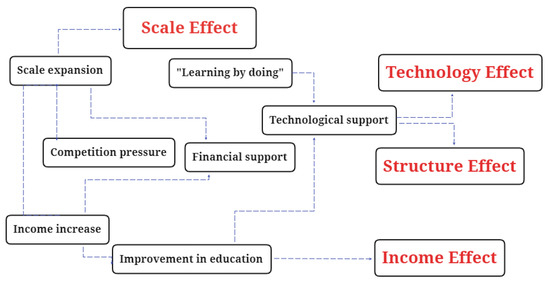
Figure 3.
The framework of the four effects of GVC embedment.
- With an increase in the number of embedded enterprises and industry sectors, the opportunities for technology spillover and technology diffusion have increased, the effect of “learning by doing” has become apparent, and the positive environmental effects of technology have gradually emerged.
- The expansion of the scale of embedding has brought about an increase in the level of employment, which has a multiplier effect on national income. The accumulation of national income creates demand pressure on enterprises and the government, encouraging them to clean up the environment and improve quality management, thus triggering the income effect.
- The scale effect leads to an increase in the revenue of embedded enterprises and provides financial support for enterprises, which helps them to upgrade their structure to lower the pollution of their processing and production links. In addition, an increase in the national income level enables the government to have sufficient financial support for such structural upgrades of enterprises. The increase in national income also raises awareness of education and the level of national education, which provides enterprises with adequate support from human capital.
On the other hand, enterprises in emerging economies also face their own development obstacles and potential risks in the process of economic and environmental upgrades. In the long run, after the learning effect of environmental technology reaches a certain level, the positive momentum will weaken, and the marginal effect triggered by the “reverse demand” of income accumulation will gradually become smaller. In particular, it is difficult to promote structural upgrades smoothly and sustainably. The control imposed by the leading companies in the value chain, through the lock-in effect on technology and market control, is also a huge obstacle. The lock-in effect is contrary to the other four effects, as shown in Figure 4. It will increase the negative effect of scale effects but reverse the positive effect of technological effects, structural effects, and income effects.
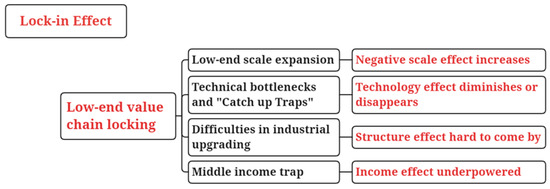
Figure 4.
Influence of lock-in effects on other effects.
- 4.
- Being locked into low-end value chain links leads emerging economies into low-end scale expansion, and the negative impacts of scale effects on the environment will increase.
- 5.
- In the case of low-end lock-in, if the technology is still dependent on the introduction and learning of technology, the progress of technology will lock the impetus and lead to the “technology catch-up trap”, and the technological effect will weaken or disappear completely.
- 6.
- Low-end lock-in means that it is difficult to achieve higher stages of economic upgrades, and the positive impacts of structural effects cannot continue to play a role.
- 7.
- Low-end lock-in will make growth in income lose the momentum of sustained growth, leading to the danger of the middle-income trap, making the income effect unsustainable.
3.3. Hypotheses
In summary, the impact of GVC embedment on emerging economies involves a combination of multiple effects. In general, structural, technological, and income effects will have positive effects on the environment. Scale effects could initially be negative, but income effects can be seen as a long-term cumulative effect of scale. As the famous Kuznets curve shows, when the economic scale reaches a certain level, its effect on the environment will become positive. The low-end locking effect adversely affects environmental conditions in emerging economies.
In the early stages of embedment in the GVC, emerging economies mainly adopt the strategy of taking high-pollution and low-value-added industries (the middle parts of the smile curve and crying curve) from developed countries, and thus, they mainly engage in the processing and manufacturing links. The income from added value is not great, and it will take time to upgrade the technology and optimize the industrial structure. In other words, emerging economies become locked into the relatively low end of the value chain, and the low-end lock-in effect plays a large role, while other effects have few positive effects on the environment. Thus, during this stage, emerging economies have more carbon emissions apart from the carbon of consumption. The deeper the country is embedded in the GVC, the more production activities and energy consumption are carried out, and the corresponding increase in the amount of carbon emissions will lead to the deterioration of environmental conditions. It could also be seen from the hot zones in Figure 1 that regions with more prosperous economic activities have denser carbon emissions. In view of this, we propose the first hypothesis:
H1:
Embedment in the GVC initially has a negative impact on the environment in emerging economies by increasing carbon emissions.
However, this impact is not sustainable and stable, and it may undergo a reversal. As the degree of embedding deepens, emerging economies will receive more returns to scale, which will increase their national income provide more adequate talent and financial support for R&D, and result in industrial upgrades; at the same time, the increasing income level will improve the national demand for environmental quality. On the other hand, in the process of GVC embedment, advanced technologies from developed countries at both ends of the value chain will spread to emerging economies spontaneously or passively, providing another strong boost for technological upgrades and industrial optimization. Under the combined action of scale effects, structural effects, technological effects, and income effects, the low-end lock-in will be gradually broken, and the position of emerging economies in the value chain curves will gradually climb to both ends. More high-tech, low-energy, and low-pollution industries will emerge, thus reducing environmental pollution. For this reason, we propose the second hypothesis:
H2:
With the deepening of GVC embedment, environmental pollution in emerging economies will decrease; that is, they will show an inverted U-shaped relationship.
4. Establishment of the Model, Index Measurement and Data Sources
We selected 16 emerging economies (Bangladesh, Brazil, China, Egypt, Indonesia, India, Iran, Korea, Mexico, Nigeria, Pakistan, Philippines, Russia, South Africa, Turkey, and Vietnam) as our research sample, including the “BRICS” and the “Next-11” countries. Depending on the data’s availability, we used panel data from 1998 to 2019 for our study. These 16 countries are typical examples of developing countries embedded in the GVC, and they carry out most of the global production of developing countries. This research on emerging economies could reduce the distortion caused by the inclusion of other developing countries with relatively weak economic activities, and thus, the research results obtained here are more realistic.
4.1. Model Assumptions
As mentioned earlier, the impact of GVC embedment on the environment may have two effects caused by scale. On the one hand, there will be structural, technological, and income accumulation effects. On the other hand, in the long term, when the production systems of emerging economies reach the stage of functional upgrades or chain upgrades, value chain leaders will use monopoly control to hinder the process of upgrading, thus inhibiting the fundamental improvement of environmental technology and efficient energy utilization. The combination of the two effects may produce a nonlinear relationship between GVC embedment and environmental pollution, so this study introduced the squared term of GVC embeddedness to examine whether this nonlinear effect exists. The econometric model is as follows.
In the equation above, the explained variable is the environmental pollution index; the explanatory variable, , is the degree of embeddedness; is the set of vectors formed by the other control variables; I ∈ [1,16] denotes the cross-sectional sample of countries; t ∈ [1,22] represents the year; α is a vector of the constant terms; are the vector coefficients; and is the random disturbance term.
4.2. Selection and Measurement of Indicators and Data Sources
4.2.1. Explained Variables
Environmental pollution can be divided into air pollution, water pollution, and solid pollution. The measurement and quantification of air pollution, which is mainly caused by CO2 emissions, is usually the most interesting. There are many indexes for CO2 emissions, and most scholars use total or per capita emissions. In this study, we adopted per capita CO2 emissions as our explained variable. In order to reduce the numerical differences, we used the natural logarithm.
4.2.2. Explanatory Variables
There are many methods of measuring the GVC embedment index. Hummels et al. [36] used a regional vertical specialization index to represent a region’s embedment in the GVC, but this method took exports and imports as exogenous variables, so it ignored the impacts from the rest of the world. Yeats [37] and Sturgeon et al. [38] used the proportion of exports within intermediate product trade, and Koopman [23] adopted the proportion of intermediate value added to measure the degree of embedment, but these methods used intermediate products, which can easily cause double calculation errors. To avoid these problems, Fally [39] first proposed the concept of value chain length, taking the number of production stages a product needs to go through in the production process as the industry length of its value chain. On this basis, Antras and Fally [40] proposed the concept of upstreamness, which is defined as the average distance from the product of an industry to the final product. Chor [41] applied upstreamness to analyze the embedded position in a value chain. Wang [42] further decomposed it into the forward and backward value chain lengths so as to accurately locate the embedded position; this method provides a more “observational” estimation of a country’s relative participation in the GVC, so it has been increasingly used by scholars. This study also used Wang’s method to measure the GVC embeddedness index.
According to the input–output analysis framework, we have the following:
where Yr and Ys denote the gross output in countries, r and s, respectively; Arr denotes the matrix of intermediate deliveries produced by country r and required by country r; Ars represents the matrix of intermediate deliveries produced by country r and demanded by country s; Frr is the matrix of final products produced and required by country r; Frs represents the matrix of final products produced country r and consumed by country s; and EMr is the total exports of country r. Thus, on the basis of multiplying both sides of Equation (2) by the Leontief inverse (Mrr = (I − Arr) − 1), we have
The total exports of a country to other countries or regions include intermediate and final products, so we have
Bsu (Bsu = (I − Asu) − 1) is the Leontief inverse matrix representing the intermediate deliveries produced by country s and demanded by country u. In addition, the value-added coefficient vector is defined as V = V−1. Moreover, u, r, s ∈ N, N = 39. denotes the diagonal matrix with the gross output vector, Y, of a country in its diagonal. If we substitute Equation (4) into Equation (3) and multiply both sides by the diagonal matrix (), for country r, the decomposition of added value based on forward inter-industrial linkages can be expressed as follows:
where V_GVC represents the added value that is embodied in the intermediate products in the export trade.
For country r, the decomposition of added value based on forward inter-industrial linkages can be deduced as follows:
where Y_GVC represents the added value that is embodied in imports of intermediate products, which reflects the scale of backward participation in the GVC. Based on the derivation above, the degree of embedment in the GVC can be measured as
where gvcf estimates the ratio of domestic added value to the GDP generated by a country’s participation in GVC activities, and gvcb quantifies the proportion of a country’s production of final products provided by domestic and international factors.
4.2.3. Control Variables and Data Sources
According to the foundational articles of Meng et al. [11] and Wang et al. [12] on the relationship between GVC embedment and carbon emission, this study selected the following control variables: the population density (popden), the density of energy utilization (energyden), the per capita income (income), the industrial structure (industry), the energy utilization structure (energystr), and the government’s R&D expenditure (rdexp). The specific measurement details and data sources are shown in Table 1.

Table 1.
Data details and sources.
5. Empirical Results and Discussion
5.1. Empirical Methodology
The panel data cover 22 years, so they may have heteroskedasticity and serial correlation problems. Therefore, this study directly used FGLS (feasible generalized least squares) to estimate the model above. Since there may be a problem of multicollinearity, this study introduced the stepwise regression of the control variables to control the effects of multicollinearity in turn. Table 2 and Table 3 report the empirical results using different explanatory variables. The results of the intra-group heteroskedasticity and inter-group autocorrelation tests for the regression data of all the control variables strongly rejected the null hypothesis of inter-group homoscedasticity and showed no inter-group autocorrelation, indicating that the FGLS estimation method was applicable.
Table 2.
Regression results of GVC embedment and environmental pollution (forward index).
Table 3.
Regression results of GVC embedment and environmental pollution (backward index).
5.2. Effects of GVC Embedment
The signs of the explanatory variable did not change during the process of introducing the other control variables in turn, and most of them are significant at the 1% level, indicating that the estimation’s results are relatively robust. It can be seen that regardless of whether we used the forward or backward embedding index, the primary terms of the explanatory variables were significantly positively correlated with per capita carbon emissions. When the quadratic terms of the embedding index were introduced into the equation, the primary terms did not change significantly, while the quadratic terms presented a significant negative correlation with the dependent variable.
These results confirm the hypothesis we proposed before, namely, that there is a nonlinear inverted U-shaped relationship between the degree of GVC embedment in emerging economies and their environmental pollution, represented by carbon emissions. When emerging economies begin to participate in the GVC, they are mainly engaged in chain links with high pollution and low value-added, so there is a significant positive correlation between carbon emissions and the degree of GVC embedment, which is caused by the scale effect of expanded production and the separation of carbon consumption and emissions through the value chain. However, with the deepening of the degree of embedment, scale effects start to have positive impacts, and the impacts of technological effects, structural effects, and income effects gradually start to appear, thus breaking the low-end lock-in within the GVC and having an inhibitory effect on environmental pollution. In addition, if we compare the two tables, it can be seen that the effect of the degree of forward GVC embedment on environmental pollution is more obvious than that of backward embedment, and the curve of its influence effect is steeper.
Using the last columns in Table 2 and Table 3, the corresponding approximate solution can be obtained, i.e., when the direction of the effect changes. Through calculation, when the degree of GVC forward embedding exceeds 2.181, and backward embedding exceeds 2.415, the GVC embedding in emerging economies will have an inhibitory effect on environmental pollution. Of course, these values are within the data range of the sample in this article.
5.3. Effects of Other Control Variables
The empirical results of the energy-use intensity and energy structure variables are consistent with the general understanding that, when more energy is used, the proportion of the share of fossil fuels will increase, and more carbon emissions will naturally be generated. Areas with higher per capita incomes tend to have more economic activities and, therefore, contribute more carbon emissions.
It is worth noting and discussing how, in the empirical results of this study, population density and the proportion of the manufacturing industry were significantly negatively correlated with per capita carbon emissions, which is inconsistent with previous mainstream views. Unlike previous studies on developing countries, our research sample focused on emerging economies, which have begun to climb in terms of where they are embedded within the GVC. Compared with other developing countries, they are more embedded and more adapted to the GVC, so they could gain more benefits. In this case, some of their characteristics have begun to converge with those of developed countries on both ends of the value chain, which have a higher proportion of green technology in manufacturing and better environmental pollution management, so our research presents different results from previous studies. This is why we chose this sample and what our marginal contribution relies on.
5.4. Robustness Tests
The empirical study of this paper focuses on the inverted U-shaped nonlinear relationship; to test the reliability of results, Hanns et al. (2016) [43] summarized a series of constructive methods, including adding a cubic term, splitting the data, excluding the extreme values, etc. The following two robustness testing methods were adopted.
First, the cubic term of the GVC embedment degree was added to verify that the nonlinear relationship is actually an inverted U type, not an S type. The first two columns of Table 4 show the corresponding regression results; it can be seen that the influence of the cubic term is not significant, thus excluding the possibility of other nonlinear relationship types to a certain extent.
Table 4.
Results of robustness tests.
Secondly, considering the influence of the extreme GVC embedding degree, samples were screened; 5% on both sides were excluded, and the regression was performed again. The results are reported in the last two columns of Table 4, and it can be seen that there was no significant difference in the results of the baseline regression, so the influence of the extreme values is excluded.
5.5. Endogenous Treatments
Our empirical research may have two endogenous problems. First, there may be a two-way causal relationship between the state of environmental pollution in emerging economies and their degree of embedment in the GVC; that is, the leading players of the value chains are more willing to locate the links of both ends in areas with a relatively better environment. To solve this problem, we used the instrumental variable method, according to Zhong et al. [44]; this study took the one-period lagged variable of the GVC embedment index as the instrumental variable, which was significantly correlated with the core variable but was less affected by the other control variables. Then, we reconducted the empirical test; it is worth noting that the lag term was used in both the primary and quadratic terms of the core variable to avoid the “forbidden regression” problem [43]. The results are reported in the first two columns of Table 5. Second, the model is likely to have the problem of missing variable deviation, and measurement errors may also cause the endogeneity problem, so we changed the regression method and used the SYS-GMM (system-generalized method of moments) method to re-estimate the model; the results are reported in the last two columns of Table 5.
Table 5.
Results of endogenous treatments.
As shown in Table 5, after we considered and dealt with the endogeneity, the degree of GVC embedment and its quadratic term still had a significant influence on the carbon emissions of emerging economies, and the direction of this effect was consistent with the previous results, indicating that the robustness was not influenced by potential endogeneity. Moreover, the effect of government expenditure on scientific research was not significant in the basic regression, but it became significant when a lag term was introduced, indicating that its impact on the carbon emissions of emerging economies has a lagged effect, Ih Is an additional finding.
6. Conclusions, Insights, and Future Research
In the context of economic globalization, a country’s environmental management problem cannot be separated from the international labor division. This is especially true for emerging economies, which have high degrees of participation in globalization and relatively serious environmental pollution problems. It is an important purpose of this paper to clarify the relationship between globalization participation and environmental pollution through GVC embedment, a key measure index.
The theoretical analysis of this study suggests that embedment within the GVC will have a profound impact on environmental pollution in emerging economies. (i) Embedment in the GVC brings about the expansion of the scale of production, and this increase in economic activities brings about an increase in energy consumption, thus causing an increase in pollution. However, the GVC embedment of emerging economies can also have a dampening effect and impetus on environmental pollution. (ii) Structural improvements by emerging economies in the GVC will bring about a transformation in the structure of the division of labor from high-energy and high-pollution links to low-energy and low-pollution links. (iii) Embedment in the GVC brings more learning opportunities in terms of energy use and environmental protection technologies, resulting in higher energy utilization and higher levels of clean energy technologies. (iv) The cumulative effect of income from GVC embedment also leads to a gradual increase in the demand for a better environment from domestic consumers and the public, thus creating a pushback mechanism of environmental management and pollution emissions. (v) The environmental pollution effects of embedment in the GVC are the result of a combination of multi-faceted forces. The leading enterprises in the value chain hinder the functional upgrades and chain upgrades of emerging economies, which may lead to the risk of structural lock-in and weaken or even reverse the positive environmental effects. The effects are not isolated and static; they are interlinked and mutually influence each other. Economies of scale are the logical starting point of the technological effects, structural effects, and income effects, while the lock-in effect will reverse the positive effects of the first environmental effects.
According to the calculation method of Wang [42], we used the degree of both forward and backward GVC embedment of 16 emerging economies for our empirical test. The results proved that the two previous hypotheses held. (i) Embedment in the GVC initially has a negative impact on the environment in emerging economies by increasing carbon emissions. (ii) With the deepening of GVC embedment, environmental pollution in emerging economies will decrease; that is, they show an inverted U-shaped relationship. (iii) In addition, the density of energy utilization, the share of fossil fuels, and the per capita income are significantly positively correlated with environmental pollution in emerging economies, while the population density and the share of the manufacturing industry showed significant negative relationships.
Through our analysis, we argue that to reduce environmental pollution under the GVC system it is necessary to improve a country’s position in the division of the GVC; promote technological progress by improving collaboration among industries, academia, and research; and promote the development of the service industry as the key to unlock the “structural lock-in” effect and actively move to both ends of the value chain (e.g., R&D, marketing, brand services, etc.). It is also important to make high-tech industries use real high technology instead of mere processing and assembly. At least, they should pay attention to making environmental protection, energy conservation, and emission reduction strategic goals, which are as important as GDP, by improving environmental regulatory policies and implementing environmental policies as well.
Limited by the availability of data and the expertise of the authors, this study failed to examine the proposed framework of the influencing mechanisms further, nor did it verify the hypotheses of the results of the control variables. These issues will be solved in future studies.
Author Contributions
Writing—original draft preparation, G.L.; writing—review and editing, G.Z. All authors have read and agreed to the published version of the manuscript.
Funding
This research was funded by the Natural Science Foundation of Fujian Province, grant number 2020J01927.
Institutional Review Board Statement
Not applicable.
Informed Consent Statement
Not applicable.
Data Availability Statement
The datasets used and/or analyzed during the current study are available from the corresponding author on reasonable request.
Conflicts of Interest
The authors declare no conflict of interest.
References
- Oliver, A.; Khanna, M. What Is the Cost of a Renewable Energy–Based Approach to Greenhouse Gas Mitigation? Land. Econ. 2017, 93, 437–458. [Google Scholar] [CrossRef]
- Wang, J.; Wan, G.; Wang, C. Participation in GVCs and CO2 emissions. Energy Econ. 2019, 84, 104561. [Google Scholar] [CrossRef]
- Wang, H.; Wei, W. Coordinating technological progress and environmental regulation in CO2 mitigation: The optimal levels for OECD countries & emerging economies. Energy Econ. 2020, 87, 104510. [Google Scholar]
- Andrew, R.M.; Peters, G.P. A Multi-region Input-Output Table Based on the Global Trade Analysis Project Database (GTAP-MRIO). Econ. Syst. Res. 2013, 25, 99–121. [Google Scholar] [CrossRef]
- Boutabba, M.A. The Impact of Financial Development, Income, Energy and Trade on Carbon Emissions: Evidence from the Indian Economy. Econ. Model. 2014, 40, 33–41. [Google Scholar] [CrossRef]
- Sakai, M.; Barrett, J. Border Carbon Adjustments: Addressing Emissions Embodied in Trade. Energ. Policy. 2016, 92, 102–110. [Google Scholar] [CrossRef]
- Grether, J.M.; De Melo, J. Globalization and Dirty Industries: Do Pollution Havens Matter? In Challenges to Globalization: Analyzing the Economics; University of Chicago Press: Chicago, IL, USA, 2004; pp. 167–205. [Google Scholar] [CrossRef]
- Kleemann, L.; Abdulai, A. The Impact of Trade and Economic Growth on the Environment: Revisiting the Cross-Country Evidence. J. Int. Dev. 2013, 25, 180–205. [Google Scholar] [CrossRef]
- Liu, H.Z.; Zong, Z.; Hynes, K.; De Bruyne, K. Can China Reduce the Carbon Emissions ofits Manufacturing Exports by Moving up the Global Value Chain? Res. Int. Bus. Financ. 2019, 51, 101101. [Google Scholar] [CrossRef]
- Ye, C.; Ye, Q.; Shi, X.; Sun, Y. Technology Gap, Global Value Chain and Carbon Intensity: Evidence from Global Manufacturing Industries. Energ. Policy 2020, 137, 111094. [Google Scholar] [CrossRef]
- Meng, B.; Peters, G.P.; Wang, Z.; Li, M. Tracing CO2 Emissions in Global Value Chains. Energy. Econ. 2018, 73, 24–42. [Google Scholar] [CrossRef]
- Wang, S.H.; Li, Z.Z.; Song, M. How Embodied Carbon in Trade Affects Labor Income in Developing Countries. Sci. Total Environ. 2019, 672, 71–80. [Google Scholar] [CrossRef] [PubMed]
- Chichilnisky, G. North—South trade and the global environment. Am. Econ. Rev. 1994, 84, 851–874. [Google Scholar]
- Eskeland, G.S.; Harrison, A.E. Moving to greener pastures? Multinationals and the pollution haven hypothesis. J. Dev. Econ. 2003, 70, 1–23. [Google Scholar] [CrossRef]
- Baumol, W.J.; Oates, W.E. The Theory of Environmental Policy; Cambridge University Press: Cambridge, UK, 1988. [Google Scholar]
- Mani, M.; Wheeler, D. In search of pollution havens? Dirty industry migration in the world economy. J. Dev. Econ. 1997, 7, 215–247. [Google Scholar]
- He, J. Pollution haven hypothesis and environmental impacts of foreign direct investment: The case of industrial emission of sulfur dioxide (SO2) in Chinese Provinces. Ecol. Econ. 2006, 60, 228–245. [Google Scholar] [CrossRef]
- Wyckoff, A.W.; Roop, J.M. The embodiment of carbon in imports of manufactured products:Implications for international agreements on greenhouse gas emissions. Energy Policy 1994, 22, 187–194. [Google Scholar] [CrossRef]
- Lenzen, M. Primary energy and greenhouse gases embodied in Australian final consumption: An Input-Output Analysis. Energy Policy 1998, 26, 495–506. [Google Scholar] [CrossRef]
- Hertwich, E.G.; Peters, G.P. Carbon footprint of nations: A global, trade-linked analysis. Environ. Sci. Technol. 2009, 43, 6414–6420. [Google Scholar] [CrossRef]
- Meng, B.; Peters, G.P.; Wang, Z. Tracing Greenhouse Gas Emissions in Global Value Chains; Working Paper; Stanford Center for International Development: Stanford, CA, USA, 2015. [Google Scholar]
- Wang, Z.; Mattoo, A.; Wei, S.J. Trade in Value-Added: Developing New Measures of Cross-Border Trade; Centre for Economic Policy Research and the World Bank: London, UK, 2013. [Google Scholar]
- Koopman, R.; Wang, Z.; Wei, S.J. Tracing value-added and double counting in gross exports. Am. Econ. Rev. 2014, 104, 459–494. [Google Scholar] [CrossRef]
- Chen, H.; Zhang, C.; Yin, K. The Impact of Global Value Chain Embedding on Carbon Emissions Embodied in China’s Exports. Front. Environ. Sci. 2022, 10, 950869. [Google Scholar] [CrossRef]
- Zhu, S.; Tang, Y.; Qiao, X.; You, W.; Peng, C. Spatial Effects of Participation in Global Value Chains on CO2 Emissions: A Global Spillover Perspective. Emerg. Mark. Financ. Trade 2022, 58, 776–789. [Google Scholar] [CrossRef]
- Xiao, H.; Sun, K.J.; Bi, H.M.; Xue, J.J. Changes in carbon intensity globally and in countries: Attribution and decomposition analysis. Appl. Energy 2019, 235, 1492–1504. [Google Scholar] [CrossRef]
- Wang, Z.; Zhang, Y.; Liao, C.; Ai, H.; Yang, X. What Contributes to the Growth of China’s Embodied CO2 Emissions? Incorporating the Global Value Chains Concept. Appl. Econ. 2022, 54, 1335–1351. [Google Scholar] [CrossRef]
- Su, B.; Thomson, E. China’s Carbon Emissions Embodied in (Normal and Processing) Exports and Their Driving Forces, 2006–2012. Energy Econ. 2016, 59, 414–422. [Google Scholar] [CrossRef]
- Chen, H.; Wang, S.; Song, M. Global Environmental Value Chain Embeddedness and Enterprise Production Efficiency Improvement. Struct. Change Econ. Dyn. 2021, 58, 278–290. [Google Scholar] [CrossRef]
- Liu, C.J.; Zhao, G.M. Can Global Value Chain Participation Affect Embodied Carbon Emission Intensity? J. Clean. Prod. 2020, 287, 125069. [Google Scholar] [CrossRef]
- Liu, Z.; Liu, G.; Han, X.; Chen, Y. Green Technology of Foreign Direct Investment on Public Health: Evidence from China. Sustainability 2022, 14, 13526. [Google Scholar] [CrossRef]
- Wang, Y.F.; Yao, J.M. Complex Network Analysis of Carbon Emission Transfers under Global Value Chains. Environ. Sci. Pollut. Res. 2022, 1–23. [Google Scholar] [CrossRef]
- Su, H.Y.; Li, T.Y.; Hou, F.M. Analysis of the Impact of China’s Manufacturing Industry in the Global Value Chain on Carbon Emissions. Int. J. Environ. Pollut. 2020, 67, 132–152. [Google Scholar]
- Qian, Z.; Zhao, Y.; Shi, Q.; Zheng, L.; Wang, S.; Zhu, J. Global Value Chains Participation and CO2 Emissions in RCEP Countries. J. Clean. Prod. 2022, 332, 130070. [Google Scholar] [CrossRef]
- Grossman, G.M.; Krueger, A.B. Economic growth and the environment. Q. J. Econ. 1995, 110, 353–377. [Google Scholar] [CrossRef]
- Hummels, D.; Ishii, J.; Yi, K.M. The nature and growth of vertical specialization in world trade. J. Int. Econ. 2001, 54, 75–96. [Google Scholar] [CrossRef]
- Yeats, A.J. Just how big is global production sharing? Available at SSRN 1998, 597193. Available online: https://papers.ssrn.com/sol3/papers.cfm?abstract_id=597193 (accessed on 1 November 2022).
- Sturgeon, T.J.; Nielsen, P.B.; Linden, G. Direct measurement of global value chains: Collecting product-and firm-level statistics on value added and business function outsourcing and offshoring. In Trade in Value Added: Developing New Measures of Cross-Border Trade; The World Bank and CEPR: Washington, DC, USA, 2013; p. 313. [Google Scholar]
- Fally, T.; Hillberry, R. Quantifying Upstreamness in East Asia: Insights from a Coasian Model of Production Staging. 2013. Available online: https://www.semanticscholar.org/paper/Quantifying-Upstreamness-in-East-Asia%3A-Insights-a-Fally-Hillberry/ee8161ae1f4f41eeb23b5a9abef16b0e7c3e412f (accessed on 1 November 2022).
- Antràs, P.; Chor, D.; Fally, T. Measuring the upstreamness of production and trade flows. Am. Econ. Rev. 2012, 102, 412–416. [Google Scholar] [CrossRef]
- Chor, D.; Manova, K.; Yu, Z. The global production line position of Chinese firms. Ind. Upgrad. Urban. Conf. 2014, 28, 29. [Google Scholar]
- Wang, Z.; Wei, S.J.; Yu, X.D.; Zhu, K.F. Characterizing Global Value Chains: Production Length and Upstreamness; Working Paper 23261; National Bureau of Economic Research: Cambridge, MA, USA, 2017. [Google Scholar]
- Haans, R.F.; Pieters, C.; He, Z.L. Thinking about U: Theorizing and testing U-and inverted U-shaped relationships in strategy research. Strateg. Manag. J. 2016, 37, 1177–1195. [Google Scholar] [CrossRef]
- Zhong, Z.; Guo, Z.; Zhang, J. Does the participation in global value chains promote interregional carbon emissions transferring via trade? Evidence from 39 major economies. Technol. Forecast. Soc. Chang. 2021, 169, 120806. [Google Scholar] [CrossRef]
Disclaimer/Publisher’s Note: The statements, opinions and data contained in all publications are solely those of the individual author(s) and contributor(s) and not of MDPI and/or the editor(s). MDPI and/or the editor(s) disclaim responsibility for any injury to people or property resulting from any ideas, methods, instructions or products referred to in the content. |
© 2023 by the authors. Licensee MDPI, Basel, Switzerland. This article is an open access article distributed under the terms and conditions of the Creative Commons Attribution (CC BY) license (https://creativecommons.org/licenses/by/4.0/).