Article

Research on Distributed Energy Storage Planning-Scheduling Strategy of Regional Power Grid Considering Demand Response

School of Electrical Engineering and Automation, Wuhan University, Wuhan 430072, China
*
Author to whom correspondence should be addressed.
Sustainability 2023, 15(19), 14540; https://doi.org/10.3390/su151914540
Submission received: 14 June 2023 / Revised: 3 September 2023 / Accepted: 22 September 2023 / Published: 7 October 2023

Abstract

:
Distributed energy storage and demand response technology are considered important means to promote new energy consumption, which has the advantages of peak regulation, balance, and flexibility. Firstly, this paper introduces the carbon trading market and the new energy abandonment penalty mechanism. Taking the energy storage cost, distribution network operation cost, network loss cost, carbon transaction cost, and new energy abandonment cost as the objective functions, the distributed energy storage optimization allocation model is established. Considering the scheduling problems of various units in the system, the operation strategy of distributed energy storage and demand response linkage is proposed. The improved bat algorithm is used to solve the problem. The example analysis shows that under the combined action of energy storage and demand response, the annual total cost of the distribution network is effectively reduced, the consumption rate of new energy is improved, and the voltage quality and network loss of the power grid are improved to ensure the reliability and stability of the distribution network.

1. Introduction

With the active and steady advancement of the goal of ‘carbon emission peak and carbon neutrality’, green, low-carbon, safe, and efficient are the new requirements for the new energy system in the new era. It is gradually necessary to shift from a non-renewable fossil energy supply to a renewable green energy supply. New energy power generation is uncertain and difficult to predict. This will lead to the unstable operation of the power grid and have a certain impact on the service life of the power grid equipment. Energy supply as the main body, large-scale new energy access to the distribution network has the problem of source-load time mismatch. In view of the above problems, the application of energy storage is very important for the power grid. Energy storage can effectively deal with the volatility and uncertainty caused by new energy access [1,2]. Energy storage has the dual attributes of source-load, which can generate electric energy and consume electric energy, and can effectively cope with the source-load mismatch caused by new energy access [3].
The configuration of energy storage has many effects on the distribution network; to improve the stability of the system, in Ref. [4], a peaking and frequency modulation working area division method and cooperative control strategy based on the state of charge of energy storage are proposed. In Ref. [5], considering the increasing demand for new energy access for grid flexibility, a two-layer energy storage optimization configuration model considering both economy and flexibility is established, which effectively quantifies the improvement effect of energy storage on system peak regulation flexibility. In improving the system economy, in Ref. [6], a bi-level optimal scheduling method that comprehensively considers the reliability and economy of peak shaving and valley filling is proposed. Considering the network loss and the net income of the distribution network, the optimal scheduling strategy for energy storage is obtained. In Ref. [7], a long-term planning model for the coordination of fixed and mobile energy storage is proposed. The optimal location and capacity of energy storage are determined by taking the minimum cost of the system as the objective function. In Ref. [8], a hierarchical optimization method considering centralized energy storage and distributed energy storage systems is proposed, which aims to minimize the sum of operation costs and energy storage investment costs of different levels of power grid and effectively improve the utilization efficiency of energy storage capacity. In Ref. [9], aiming at the non-schedulability of distributed new energy generation in an active distribution network, optimal scheduling is carried out considering the minimization of system cost, and the optimal energy storage capacity and installation node of the system are calculated by an intelligent optimization algorithm. In Ref. [10], a practical method for site selection and capacity optimization of distributed energy storage systems is proposed. In this paper, the grid-connected node set of energy storage is selected by the method of weighted voltage sensitivity, and the distributed energy storage positioning model is established. An energy storage partition method based on an improved flame propagation model is proposed to obtain the partition result, and the maximum annual net income of the partition energy storage is taken as the objective function to obtain the system energy storage capacity. In terms of improving energy consumption. In Ref. [11], considering improving the absorptive capacity of the distribution network for photovoltaic power generation, a distributed energy storage strategy is proposed. In Ref. [12], considering the integration of centralized and distributed energy storage into the power grid, a bi-level programming model based on the cost minimization objective is constructed to optimize the capacity and power configuration of the energy storage system. In Ref. [13], a joint planning model of energy storage and power supply is proposed, aiming at minimizing the cost of the distribution network and obtaining the decision of energy storage and power supply capacity planning in a power grid with high renewable energy penetration. In Ref. [14], two parameter optimization models are proposed to quantify the power and capacity of the energy storage unit from the aspects of new energy reduction and system flexibility for uncertainty mitigation. The proposed model is reduced to multi-parameter mixed integer linear programming and solved by a decomposition algorithm.
From the above analysis, it can be seen that the existing literature has completed some research on the configuration of energy storage, but the research on new energy consumption, system economy, and stability is still in its infancy. This paper considers the importance of the emission reduction effect of new energy in the carbon market, establishes a carbon emission cost model, and proposes to convert the consumption of new energy into the penalty cost of new energy ladder abandonment, so as to improve the profit means and abandonment cost of new energy in essence. In this paper, the new energy consumption capacity of the system is proposed as an important decision-making factor for power planning, and an optimal configuration model of distributed energy storage considering demand response and new energy consumption is proposed. The operation economy of the distribution network, energy storage costs, wind curtailment costs of new energy, carbon transaction costs, and network loss costs are included in the optimization objectives of the study. The improved bat algorithm is used to solve the problem. The IEEE33 node is used for simulation experiment verification, and the location and capacity selection scheme and scheduling strategy of distributed energy storage in the distribution network are obtained.
The rest of this article is organized as follows. In Section 2, the carbon emission cost model is described. In Section 3, the optimal allocation model for distributed energy storage is described. In Section 4, after establishing the model, the INBA (Improved-Bat) algorithm is proposed to solve the model. In Section 5, some numerical experiments are presented. Section 6 concludes this article.

2. Carbon Emission Cost Model

Carbon emission cost is the cost of carbon trading in the system, which consists of Chinese Emission Allowance (CEA) and China Certified Emission Reductions (CCER) costs.
C carbon , s = C carbon , grid C carbon , reduce
In the equation: C carbon , s , C carbon , grid , and C carbon , reduce mean carbon emission cost, CEA transaction cost and CCER transaction cost, respectively.

2.1. Carbon Emission Quota Model

In this paper, the baseline method is used to establish the carbon emission quota baseline for the system, and on this basis, the free carbon emission interval of the system is determined. If the carbon emissions of the system exceed the initial carbon emission quota benchmark, the quota needs to be obtained through trading. The initial carbon emission quota of the system is shown in Equation (2):
Q carbon , free = γ grid , carbon Q grid , buy
In the equation, Q carbon , free is the baseline of carbon emission quota allocated to the system by government agencies, Q grid , buy is the electricity purchased by the system last year, and γ grid , carbon is the carbon emission quota coefficient of purchased unit electricity traded with the superior power grid.
Due to the different proportions of generating units in different places, the carbon emission coefficient of purchased unit power and the carbon emission quota coefficient of purchased power in the actual power grid are different. Similarly, due to the influence of specific technology and operation characteristics, the fuel source used, and the efficiency of the power generation process, the carbon emission coefficient of a unit power gas turbine and the carbon emission quota coefficient of a unit power gas turbine are also different. The actual carbon emissions of the system are shown in Equation (3):
Q carbon , grid = γ grid , carbon t = 1 T P grid , buy , t
In the equation, Q carbon , grid is the actual carbon emissions of the system, T is the cycle of system participation in carbon trading, P grid , buy , t is the power purchased by the power grid from the superior power grid at time t, γ grid , carbon is the carbon emission coefficient of the purchased unit power.

2.2. CEA Transaction Costs

The ladder carbon trading mechanism is added to the carbon emission trading market. The ladder carbon trading is different from the traditional carbon trading. Its carbon price changes according to the different carbon emissions of the system, which increases the cost of fossil fuel power generation. The calculation method of step carbon trading is shown in Equations (4) and (5).
ρ carbon , CEA = ρ carbon , CEA 1 Q carbon , free Q carbon , grid + Q carbon , l ρ carbon , CEA 2 Q carbon , free Q carbon , grid + 2 Q carbon , l ρ carbon , CEA 3 Q carbon , free Q carbon , grid + 3 Q carbon , l
C carbon , grid = ρ carbon , CEA 1 Q carbon , grid Q carbon , free Q carbon , free Q carbon , grid + Q carbon , l ρ carbon , CEA 2 Q carbon , grid Q carbon , free Q carbon , l + ρ carbon , CEA 1 Q carbon , l          Q carbon , free Q carbon , grid + 2 Q carbon , l ρ carbon , CEA 3 Q carbon , grid Q carbon , free 2 Q carbon , l + ρ carbon , CEA 1 + ρ carbon , CEA 2 Q carbon , l Q carbon , free Q carbon , grid + 3 Q carbon , l
In the equations, ρ carbon , CEA is carbon price in the carbon emission quota market, which is the CEA carbon price. ρ carbon , CEA 1 , ρ carbon , CEA 2 and ρ carbon , CEA 3 are carbon prices under different carbon emissions, which are set to 58, 62, and 68 yuan/t. Q carbon , l is equal to the carbon price in the carbon emission range.

2.3. CCER Transaction Costs

In this paper, only new energy emission reduction projects are considered in the CCER project. The CCER transaction cost is the system’s photovoltaic and wind power generation to replace fossil fuel power generation to reduce the system’s carbon emissions. The CCER transaction calculation equations are shown in Equations (6) and (7):
Q carbon , reduce = γ carbon , reduce t = 1 T P pv , t + P wt , t
C carbon , reduce = ρ carbon , CCER Q carbon , reduce
In the equations, Q carbon , reduce is the certified voluntary emission reduction obtained by the system participating in CCER projects. P pv , t and P wt , t are the actual power generation of photovoltaic and wind power at time t. γ carbon , reduce is the carbon emission reduction per unit of new energy power. ρ carbon , CCER is the carbon price of the voluntary emission reduction market; it is usually set at 58 yuan/t, namely the CCER carbon price.

3. Optimal Allocation Model of Distributed Energy Storage

3.1. Objective Function

The objective function consists of energy storage cost C ESS , operation cost C op , penalty cost of new energy abandonment C Punish , carbon transaction cost C carbon , and network loss cost C loss , the unit is yuan, as shown in Equation (8):
min f 1 = C ESS + C op + C Punish + C carbon + C loss
The cost of network loss is shown in Equation (9):
C loss = i , j N t = 1 T ρ buy , t R i j ( P i j , t 2 + Q i j , t 2 ) U i , t 2
In the equation, N is the total number of nodes. ρ buy , t is the real-time price of purchasing electricity from the superior power grid at time t; the unit is yuan. R i j is the resistance of line ij. P i j , t and Q i j , t are the active and reactive power flowing through the line ij at time t, the units are kW and kVar respectively. U i , t is the voltage of node i at time t; the unit is kV.

3.1.1. Energy Storage Cost

The energy storage cost [12] consists of energy storage investment cost C 1 ESS , energy storage operation and maintenance cost C 2 ESS , and energy storage recovery cost C 3 ESS ; the unit is yuan, as shown in the Equation (10):
C ESS = C 1 ESS + C 2 ESS C 3 ESS
The investment cost of energy storage is shown in (11):
C 1 ESS = r ( 1 + r ) n ( 1 + r ) n 1 r P P ESS + r e E ESS + C ESS , I C ESS , I = r ESS , I ( r P P ESS + r e E ESS )
In the equation, r is the interest rate. n is the life cycle of energy storage equipment; the unit is year. r e is the unit energy capacity cost; it is usually set to 1200 yuan/kWh. r P is the unit power cost; it is usually set to 300 yuan/kW. C ESS , I is the energy storage infrastructure cost; the unit is yuan. r ESS , I is energy storage infrastructure price, it is usually taken as 5%. E ESS is the capacity of energy storage in power grid construction; the unit is kWh. P ESS is the energy storage configuration power; the unit is kW. The equal annual value coefficient is introduced to convert the operation and maintenance costs to the present value.
The cost of energy storage operation and maintenance is shown in (12):
C 2 ESS = i = 1 S r P 2 P ess , i + r E 2 E ess , i
In the equation, r P 2 is unit power maintenance cost; it is usually set to 3 yuan/kW. r E 2 unit capacity maintenance cost of energy storage system; it is usually set to 12 yuan/kWh. S is the sum of operation and maintenance years, and the equal annual value coefficient is introduced to convert the operation and maintenance cost to the present value.
The energy storage recovery cost refers to the economic benefits that can be obtained by the energy storage system at the end of its service life. The recovery cost of energy storage is proportional to the investment cost of energy storage. The expression of energy storage recovery cost is shown in Equation (13):
C 3 ESS = r res C 1 ESS
In the equation, r res is the coefficient factor of energy storage investment cost into recovery cost, namely energy storage recovery rate. This article takes it as 5%.

3.1.2. Distribution Network Operation Cost

The operating cost is composed of electricity purchase and sale cost C grid and operation and maintenance cost C m , and the unit is yuan, as shown in Equation (14):
C op = C grid + C m
The cost of purchasing and selling electricity is shown in Equation (15):
C grid = C buy C sell C buy = ρ buy Q buy C sell = ρ sell Q sell
In the equations, C buy is the cost of power grid purchase; the unit is yuan. C sell is the income of power grid sales; the unit is yuan. ρ buy is the electricity price at the time of purchase; the unit is yuan/kWh. ρ sell is the price of electricity sales; the unit is yuan/kWh. Q buy is the amount of electricity purchased; the unit is kWh. Q sell is the amount of electricity sold; the unit is kWh.
Operation and maintenance costs are shown in Equation (16):
C m = i = 1 S r pv P pv , i + r wt P wt , i
In the equation C m is the operation and maintenance cost of the distribution network; the unit is yuan. r pv and r wt are the unit power operation and maintenance cost coefficients of photovoltaic and wind turbines; they are usually set to 41 and 600 yuan/kW, respectively. P pv , i and P wt , i are the power that photovoltaic and wind turbines need to maintain; the units are kW.

3.1.3. The Punishment of Ladder New Energy Abandonment

Considering that it is unreasonable to use the fixed abandonment of wind and light to calculate the grid with different new energy permeability [15], the new energy abandonment rate is used to judge the penalty coefficient. The calculation method is shown in Equations (17) and (18):
r Punish = α 1 0 λ s < λ s 1 α 2 λ s 1 λ s < λ s 2 α 3 λ s 2 λ s 1
C Punish = β 1 + α 1 λ s Q s 0 λ s < λ s 1 β 2 + α 2 λ s λ s 1 Q s λ s 1 λ s < λ s 2 β 3 + α 3 λ s λ s 2 Q s λ s 2 λ s 1
In the equation r Punish is the penalty coefficient of segmented new energy abandonment, and C Punish is the penalty cost of new energy abandonment; the unit is yuan. α 1 , α 2 , and α 3 are the penalty coefficients at different new energy abandonment rates; it is usually set to 0.1, 0.12, and 0.15 yuan/kWh. λ s is the new energy abandonment rate and λ s 1 and λ s 2 are the new energy abandonment rates at different stages; it is usually set to 0.05 and 0.1. β 1 , β 2 , and β 3 are the starting cost of new energy abandonment penalty at different new energy abandonment stages; Q s is the new energy power generation in the prediction cycle; the unit is kWh.

3.1.4. Carbon Emission Efficiency

The carbon reduction benefit of energy storage can be expressed as the carbon dioxide emissions reduced by the new energy abandoned power absorbed by energy storage instead of the power generation of thermal power units; it can also be used as a new energy project to obtain CCER-certified emission reductions, thereby achieving carbon reduction benefits. The carbon emission benefits of energy storage are shown in Equations (19) and (20):
Q carbon , reduce = γ discharge Q ab , 0 Q ab
C carbon , reduce = ρ carbon , CCER Q carbon , reduce
In the equations, Q carbon , reduce is to reduce the carbon emissions caused by thermal power generation by investing in new energy power generation; the unit is t. Q ab , 0 and Q ab are the amount of new energy abandonment before and after the allocation of energy storage; the unit is kWh. γ discharge is the carbon emission intensity of thermal power units; it is usually set to 0.5703 t/MWh. ρ carbon , CCER is the carbon price; it is usually set to 58 yuan/t.

3.2. Constraint Condition
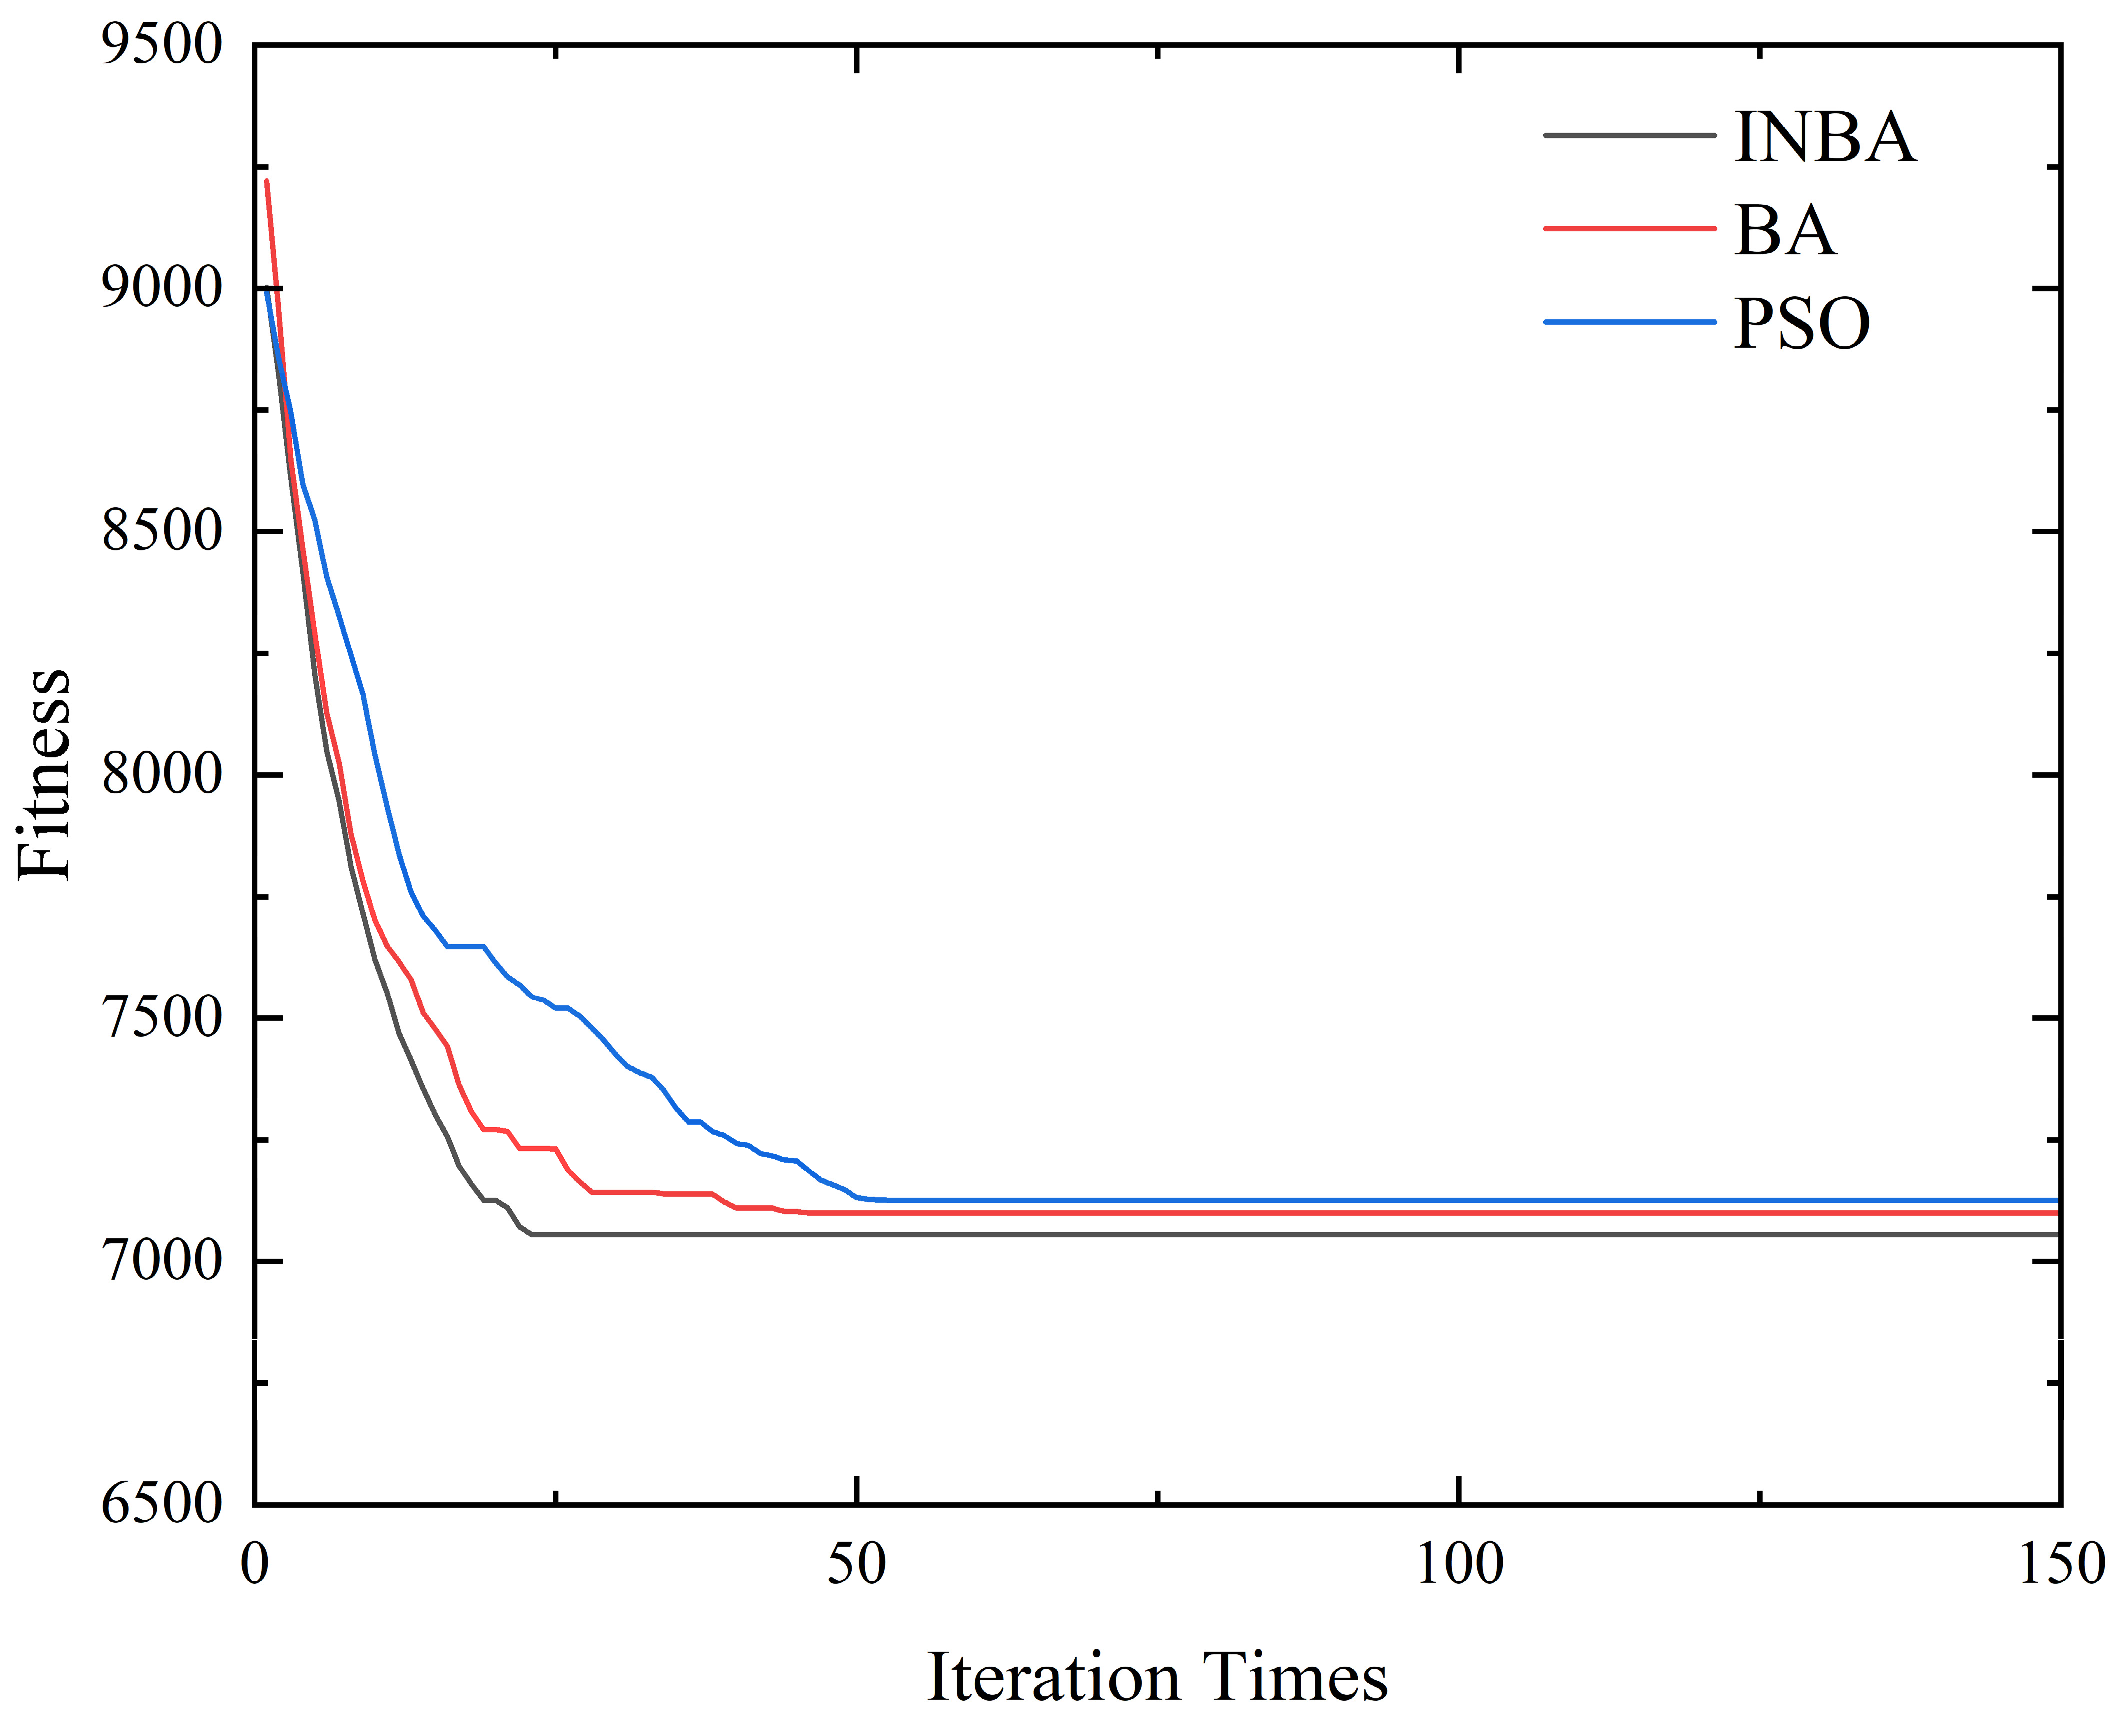
Power flow equation constraints are shown in Equation (21):
P i , t = U i , t j = 1 N b u s U j , t G i j cos θ i j , t + B i j sin θ i j , t Q i , t = U i , t j = 1 N b u s U j , t G i j cos θ i j , t B i j sin θ i j , t
In the equation: P i , t and Q i , t are the active power and reactive power injected into node i at time t, respectively; U i , t and U j , t are the voltage amplitude of nodes i and j at time t, respectively; G i j and B i j are the real and imaginary parts of the node admittance matrix, respectively; θ i j , t is the phase angle difference between nodes i and j at time t; N bus is the number of grid nodes.
The node voltage constraint is shown in Equation (22):
V min , i V i , t V max , i
In the equation: V min , i and V max , i represent the minimum and maximum voltage of node i, and V i , t is the voltage value of node i at time t.
Branch current constraints are shown in Equation (23):
I l . t I l max
In the equation, I l . t is the branch current of branch l at time t, and I l max is the maximum branch current flowing through branch l.
Energy storage charge and discharge constraints are shown in Equation (24):
P c , min P c , t P c , max P d , min P d , t P d , max γ c , t + γ d , t = 1 P ess , t = γ c , t η c , t P c , t γ d , t η d , t P d , t S i , min S i , t S i , max S O C min S O C i , t S O C max S O C 0 = S O C T = 0.5
In the equation, P c , min and P c , max are the minimum and maximum charging power of the energy storage device, and P d , min and P d , max are the minimum and maximum discharge power of the energy storage device; these two equations indicate the charge and discharge constraints of energy storage. γ c , t and γ d , t are the charge and discharge judgment coefficients of energy storage. When the energy storage is charged, γ c , t is 1 and γ d , t is 0. When the energy storage discharges, γ c , t is 0 and γ d , t is 1. η c , t and η d , t are charge and discharge efficiency, respectively, which are 0.95 in this paper. S i , t is the energy storage capacity of the i-node energy storage device at time t; S i , min and S i , max are the minimum and maximum values of the capacity of the energy storage device are connected to the i node; S O C min and S O C max are the minimum and maximum charge of the energy storage device; S O C 0 and S O C T are the initial and end charge of the energy storage device; the initial value is 0.5.
Energy storage installation constraints are shown in Equation (25):
E ESS , i E ESS , max P ESS , i P ESS , max
In the equation, E ESS , i and P ESS , i are the capacity and power of energy storage installed at node i, respectively, and E ESS , max and P ESS , max are the maximum capacity and power of energy storage installation, respectively.

4. Solution Method

4.1. Improved Bat Algorithm Principle

The bat algorithm is a meta-heuristic optimization algorithm that was first proposed by Yang in 2010 [16]. It has been applied to solve various optimization problems in different fields and is suitable for problems that require a global search for the best solution.
When the bat algorithm updates the speed, it only considers the speed of the previous generation of bats and the group cognitive items and lacks its own flight experience. When the bat population has excellent fitness and is far superior to other groups, the bat individuals will lose diversity according to the update strategy of the traditional bat algorithm and will follow the optimal individual and lose their own search ability, resulting in a local optimum.
In order to solve the problem that the bat algorithm falls into the local optimum, the particle swarm optimization algorithm is introduced to improve the bat algorithm. The individual learning factor and the group learning factor of the particle swarm optimization algorithm are combined to improve the speed update strategy of the bat algorithm, and the inertia coefficient weight is introduced to improve the flight speed of the bat.
First, initialize. The position of the i-th bat in the D-dimensional space x i is shown in Equation (26):
x i = x i 1 , x i 2 , x i 3 , , x i D
The velocity of the i-th bat v i is shown in Equation (27):
v i = ( v i 1 , v i 2 , v i 3 , , v i D )
The particle swarm optimization algorithm is used to improve the bat algorithm to enhance the bat’s exploration ability and accelerate the convergence process. The bat algorithm frequency, speed, and position update equation are as follows:
f i = f min + δ f max f min
v i t + 1 = k BA t v i t + c 1 f i x i t p i , t , b e s t + c 2 f i x i t g t , b e s t
x i t + 1 = x i t + v i t + 1
In the equation, f i is the ultrasonic pulse frequency of the i-th bat. f min and f max are the lower and upper limits of the ultrasonic pulse frequency. δ is the uniform variable of [0, 1]. x i t and v i t are the position and speed of the i-th bat at the t-th iteration. k BA t is the weight of the inertia coefficient at the t-th iteration. c 1 and c 2 are the individual learning factor and the group learning factor, respectively. p i , t , b e s t is the local optimal solution after the t-th iteration of the i-th bat, and g t , b e s t is the global optimal solution after the t-th iteration.
The inertia coefficient weight is introduced to further regulate the speed of the bat. In the initial stage, k BA t is larger, which makes the bat have better global search ability, and at the end of the fast iteration, k BA t is smaller, which improves the local search ability of the bat.
k BA t = k BA , max k BA , max k BA , min t t max
In the equation, k BA , max and k BA , min are the maximum and minimum inertial coefficient values, respectively, and t max is the maximum number of iterations.
In the bat algorithm, each bat has a certain probability of performing random walk near the optimal solution, which adds a small amount of random disturbance to the movement of the bat. The occurrence of the random walk mechanism is determined by the random variable rand1 in [0, 1]. When the pulse signal emission frequency is less than rand1, the bat enters the local search, which triggers the random walk mechanism and generates a new solution. The bat random walk equation is shown in Equation (32):
x i , new ( t ) = g t , b e s t + ε A t
In the equation, ε is the random number of [−1, 1], A t is the average pulse signal loudness of all bats in iteration t, and x i , new ( t ) is the new position obtained by the random walk of bats.
The loudness and emission frequency update strategy of a bat pulse signal are shown in Equation (33):
A i t + 1 = β BA A i t 0 < β BA < 1 r i t + 1 = r i , s 1 exp γ BA t γ BA > 0
In the equation, A i t is the pulse signal loudness of the t-th i-th bat, β BA and γ BA are constants, r i , s is the initial pulse signal emission frequency of the i-th bat, and r i t + 1 is the pulse signal emission frequency of the (t + 1)-th i-th bat.

4.2. Algorithm Implementation Steps

In summary, the specific implementation steps of the INBA (Improved-Bat) algorithm proposed in this paper are as follows:
Step 1: Initialize the parameters of the algorithm, take the charge and discharge power and capacity of the energy storage and the location variable as the position of the bat, and initialize the pulse frequency, loudness, and other parameters of each bat; randomly initialize the speed and position of the bat.
Step 2: Calculate the fitness value, the individual optimal fitness p best , and find the optimal fitness of the group g best according to the objective function.
Step 3: Update the parameters of the algorithm according to Equations (28)–(30).
Step 4: For each bat individual, if rand1 > ri, a random walk is performed near the current optimal individual according to Equation (31) to generate a new position, and generate a random number, rand2, if rand2 < A, and the bat individual ‘s new moderate value is improved, the current position is updated to the new position.
Step 5: If the fitness of bat individuals is better than the global optimal fitness, the global optimal fitness is updated. The pulse frequency r i and loudness A i are updated.
Step 6: Determine whether to meet the maximum number of iterations. If the answer is yes, then transfer to step 7; otherwise, transfer to step 3.
Step 7: Output the global optimal solution.

5. Example Analysis

5.1. Example Setting

In this paper, MATPOWER is used to analyze the IEEE 33-node distribution network. The reference power of the distribution network is 1 MVA, the reference voltage is 12.66 kV, the scheduling period is 24 h, and each period is 1 h. The load is 4000 kW, the photovoltaic unit is 250 kW, which is connected to nodes 22 and 32, respectively, and the wind turbine is 300 kW, which is connected to node 18. The time-of-use electricity price is set as shown in Table 1. The variables are the power, capacity, installation location, and scheduling strategy of energy storage; the objective function is Equation (8); and the constraint is Equations (21)–(25).

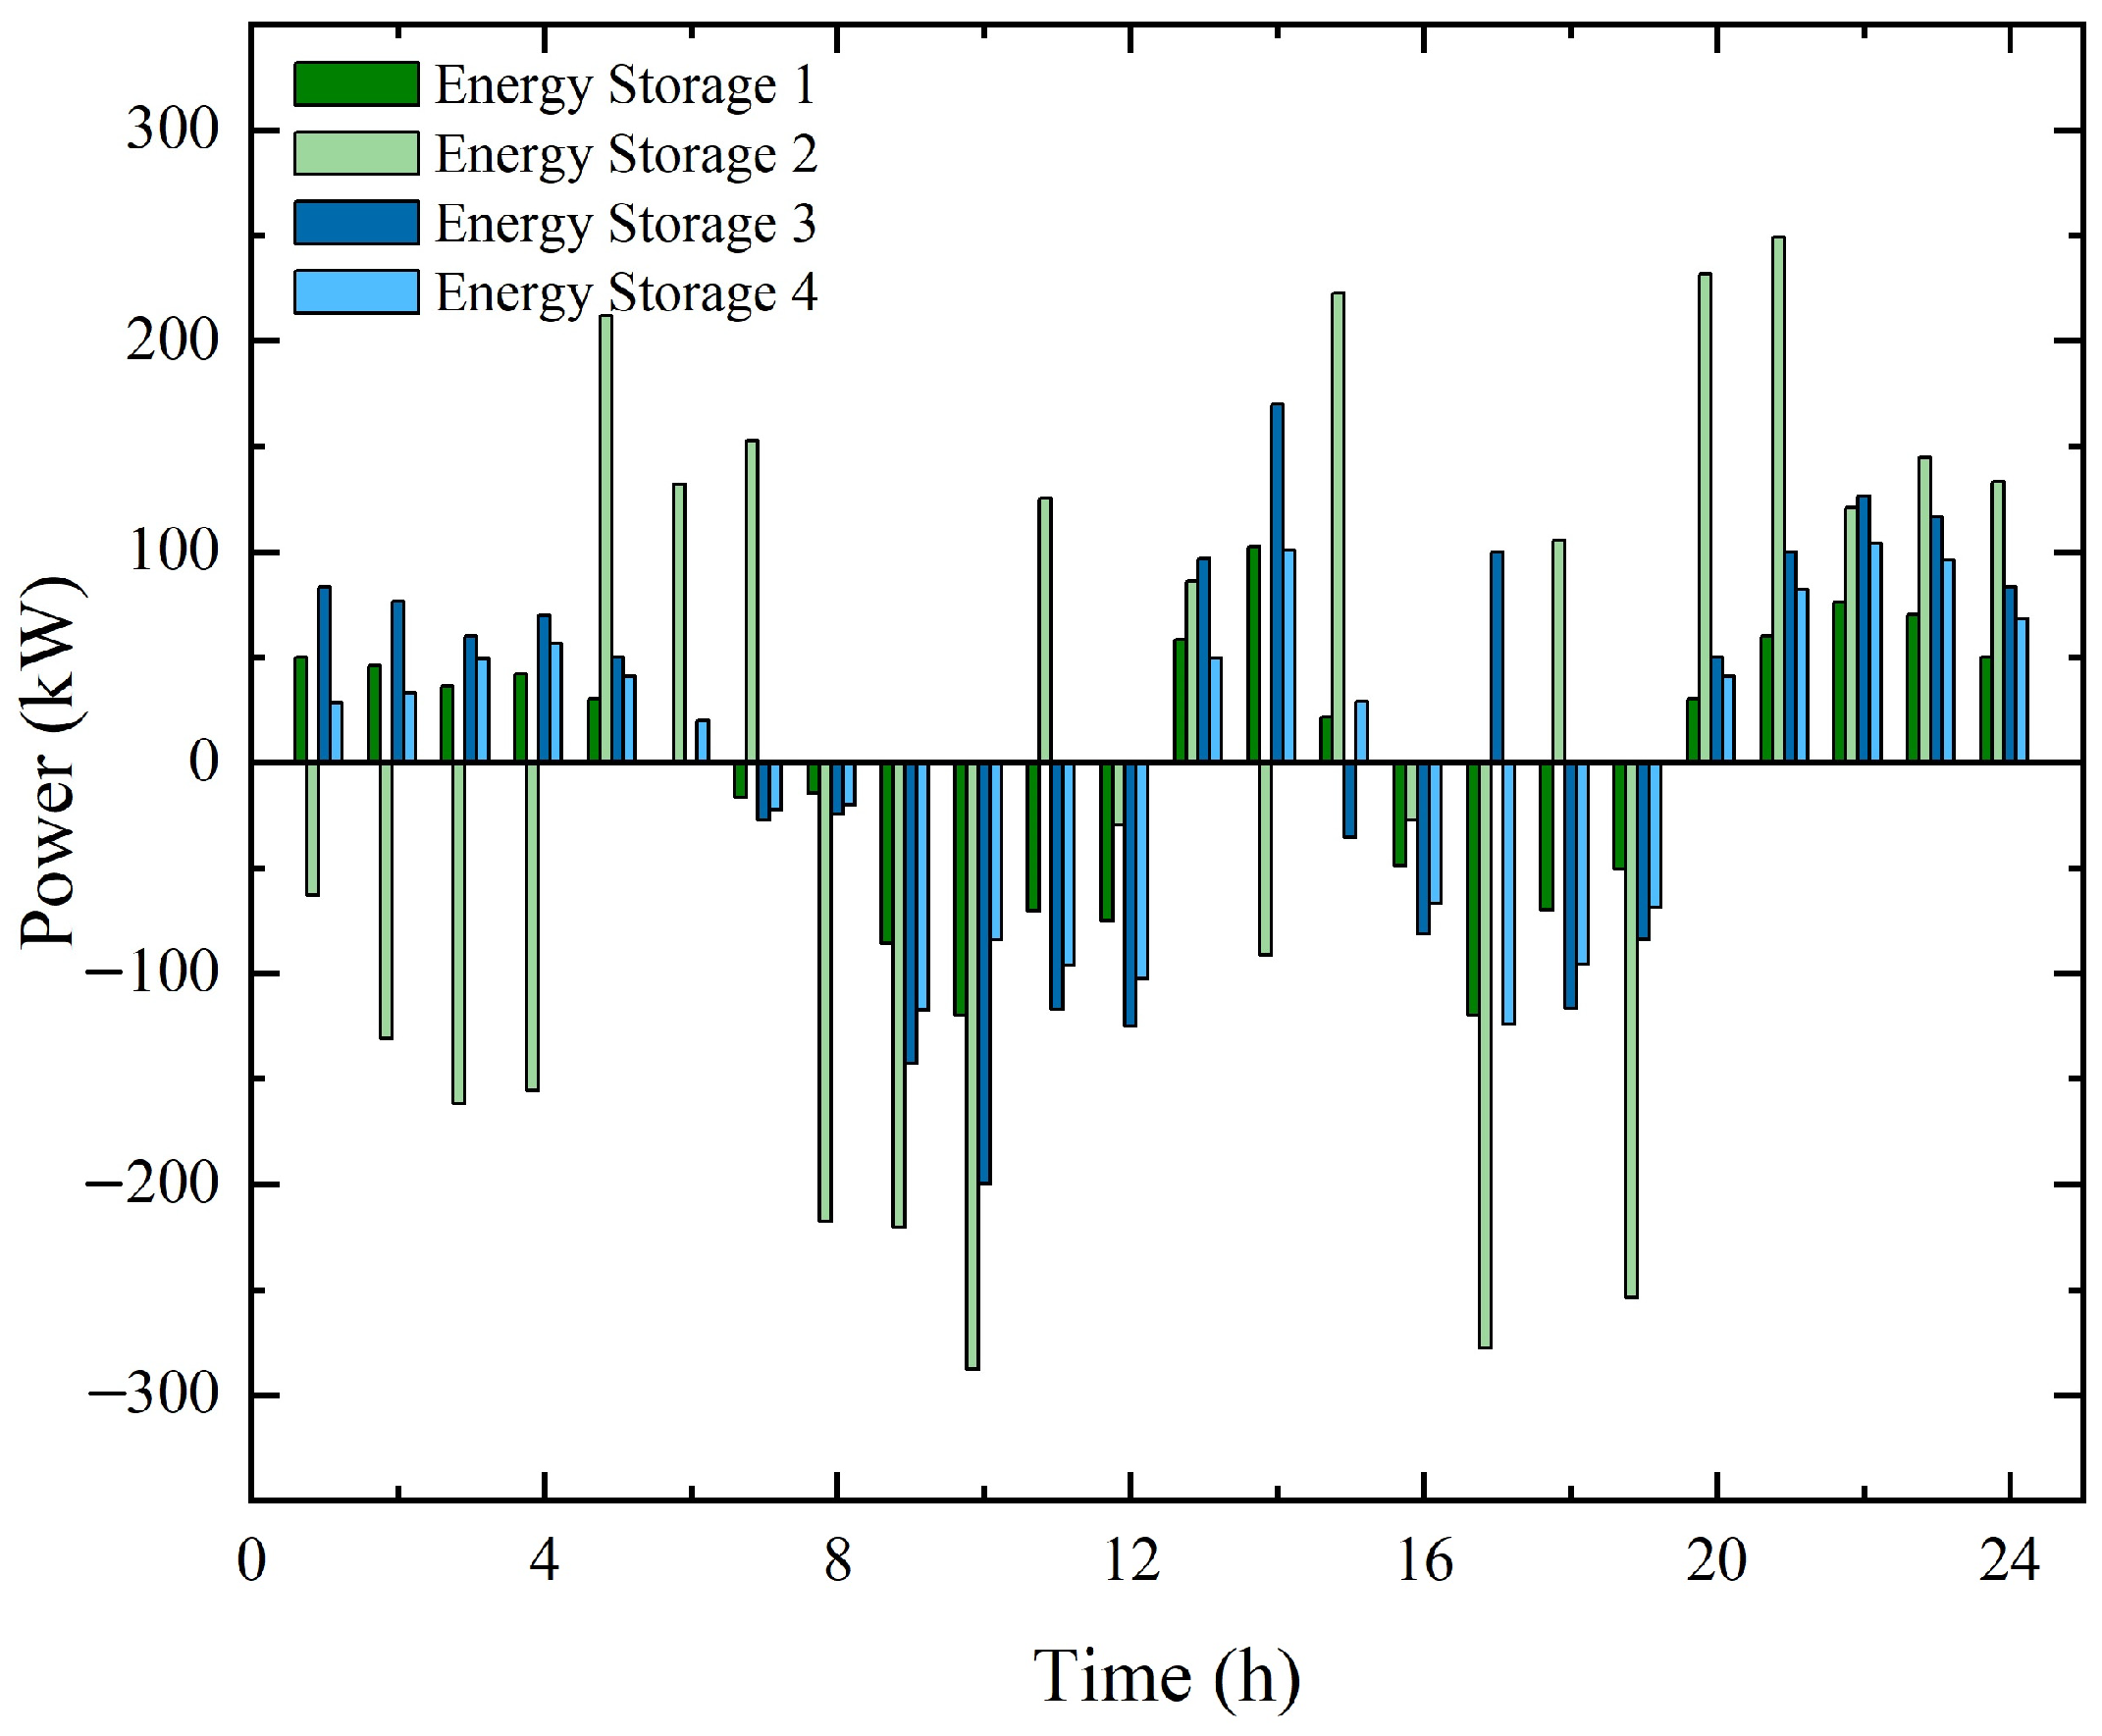
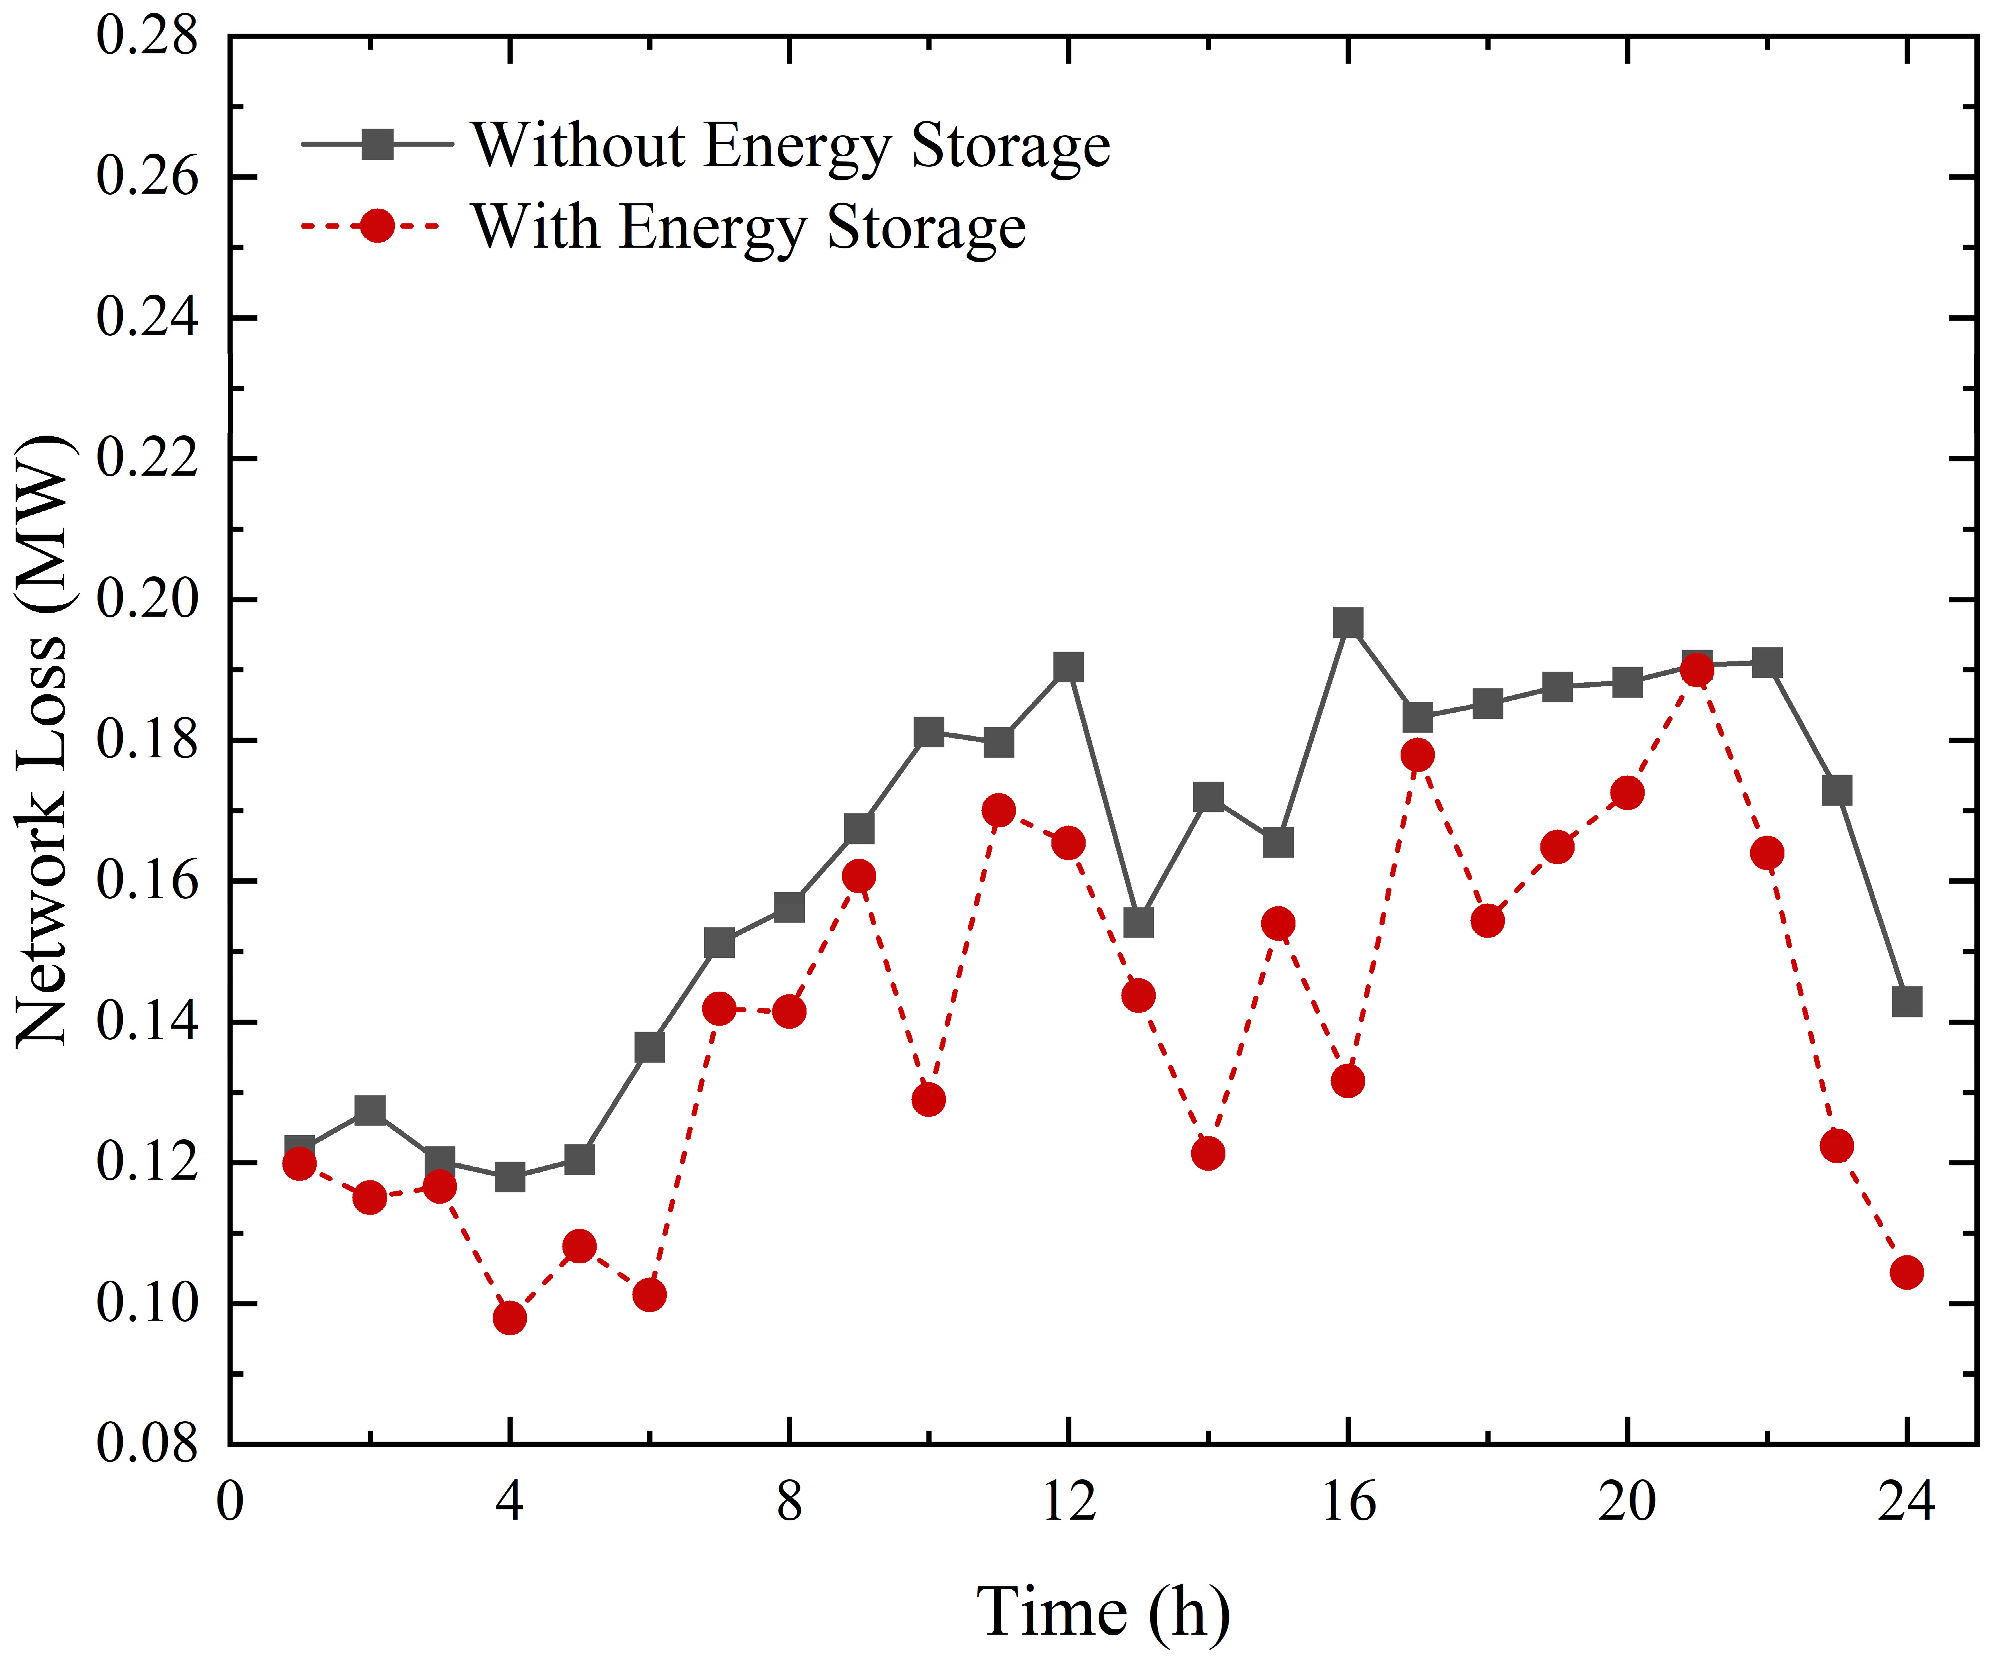
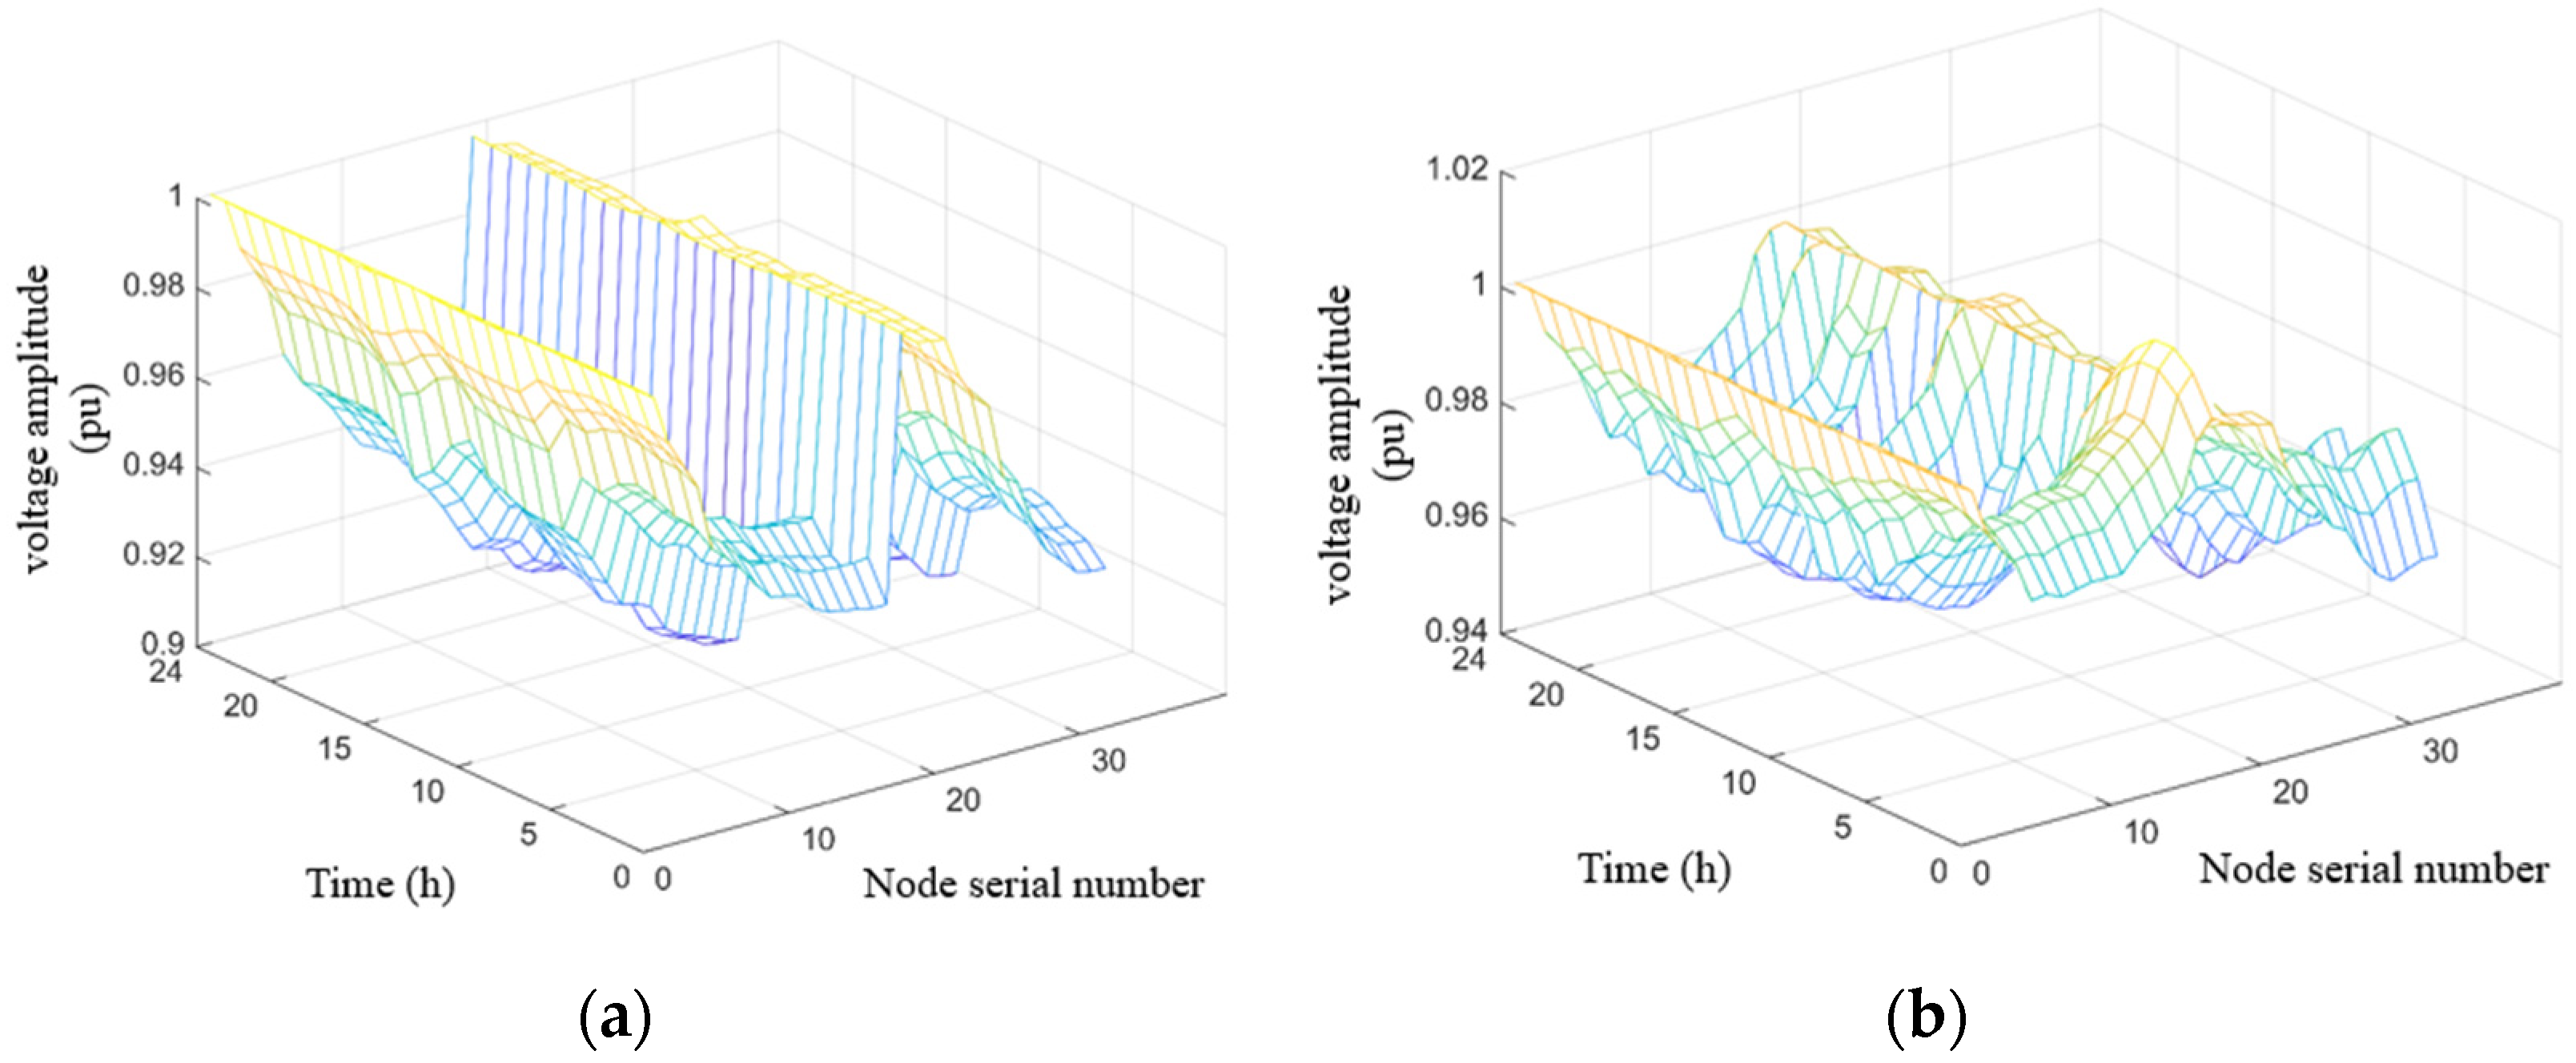
5.2. Results Analysis

The model established in this paper is a planning-running model. The model is a Mixed Integer Nonlinear Programming (MINLP) problem. It is difficult to solve it directly by using MATLAB to call GUROBI and other solvers. In this paper, the INBA algorithm is used to solve the problem. In order to verify the advantages of the algorithm, other algorithms are introduced for comparative analysis.
The energy storage setting refers t” ref’rence [12], the time-of-use electricity price setting refers to reference [16], the INBA algorithm parameters refer to reference [17], and specific parameter settings are shown in Table 2. The INBA, BA, and PSO algorithms are used to solve the model. Considering that the global optimal solution obtained by each operation is different, multiple solutions are needed to ensure the accuracy of the experiment. Therefore, different algorithms are used to solve the model 50 times, respectively, and the optimal results obtained are compared and analyzed.
The optimal costs of INBA, BA, and PSO are 7054.95, 7099.96, and 7125.99. The optimization curves of different algorithms are shown in Figure 1. It is not difficult to find that the operating cost of the system obtained by the INBA algorithm is smaller than that of the other two algorithms, which are reduced by 45.01 and 71.04, respectively, and the reduction ratios are 0.64% and 1.01%, respectively. The INBA, BA, and PSO algorithms converge at the 23rd, 46th, and 54th generations, respectively. It can be seen that the INBA algorithm has certain advantages over the BA and PSO algorithms. The INBA algorithm can obtain a better global optimal solution and has better convergence speed.
Through calculation, the energy storage will be allocated at nodes 2, 18, 22, and 33. The specific allocation is shown in Table 3.
The charging and discharging power of the energy storage is shown in Figure 2. The scheduling strategy of each energy storage is relatively concentrated, charging at 0–6 a.m., 13–15 p.m., and 20–24 p.m., and discharging at 8–12 a.m. and 16–20 p.m.
Energy storage equipment can reduce the power fluctuation and voltage fluctuation in the power system, reduce the voltage loss of the power grid, and reduce the line loss in the process of power transmission. The total network loss of the system before and after the energy storage equipment is added to the power grid is shown in Figure 3. After the dis-tributed energy storage device is allocated, the network loss of the power system is reduced by 0.53 MW, and the loss reduction effect is 13.6%, which excellently improves the active network loss of the distribution network.
The voltage comparison before and after the grid allocation of the energy storage is shown in Figure 4a,b. When the energy storage is not allocated, the voltage shown in Figure 4a at nodes 18 and 33 is low. After the energy storage is allocated, the energy storage performs reactive power compensation to increase its voltage, the voltage is shown in Figure 4b. The minimum voltage before and after the grid allocation of the energy storage shows that the minimum voltage per unit value after the grid allocation of the energy storage is 0.9534, while the minimum voltage per unit value before the energy storage is 0.9032, which indicates that the access of the energy storage device helps to improve the voltage level of the grid, thereby improving the voltage quality of the grid. By increasing the grid voltage level, energy storage devices can help the grid maintain a stable voltage level in the face of load changes or other problems, thereby improving the stability of the grid.
The consumption of new energy under different schemes is shown in Table 4; four schemes are designed according to whether to configure energy storage and whether to participate in demand response. From the analysis of participating in demand response, through the comparison between scheme 1, scheme 2, scheme 3, and scheme 4, it is found that after participating in demand response, the consumption rate of new energy is increased by 8.56% and 8.78%, respectively, and the consumption of new energy is reduced by 602.3 kW·h and 618.78 kW·h, respectively. From the analysis of energy storage allocation, through the comparison between scheme 1 and scheme 3, scheme 2 and scheme 4, it is found that the new energy consumption rate is increased by 26.92% and 27.14%, respectively, and the amount of new energy abandonment is reduced by 1896.09 kW·h and 1912.57 kW·h, respectively. After the allocation of energy storage, the amount of new energy abandonment is reduced. After the load participates in demand response, the volatility is reduced. In summary, under the combined effect of energy storage and demand response, the promotion effect on new energy consumption is the best.
The costs of the four schemes proposed in this paper are shown in Table 5. Comparing the four schemes, it can be seen that the introduction of energy storage and demand response at the same time can effectively reduce the amount of new energy abandonment and the cost of new energy abandonment. Due to the increase in new energy consumption, the system can obtain more CCER certification in the carbon trading market, improve the profit from the carbon trading market, and reduce the carbon trading cost. At the same time, it also reduces the network loss and the operating cost of the system, which is helpful to achieve the goal of economic and stable operation of the distribution network.

6. Conclusions

This paper proposes a new energy carbon reduction benefit model, that is, new energy that participates in the carbon trading market, including CEA and CCER. In the carbon trading market, new energy can obtain CCER-certified emission reductions, bringing economic benefits and emission reduction benefits. At the same time, using the ladder carbon transaction cost model, a high proportion of traditional energy systems will therefore pay more costs, improve the importance of new energy in the transition to green energy, and help promote the green energy transition of power grid systems.
In order to solve the problem of consumption in the distribution network with distributed new energy units, this paper proposes a joint strategy of distributed energy storage and demand response to cope with the growing demand for new energy consumption in the distribution network. Firstly, a price-based demand response mechanism is established to guide users to increase electricity consumption during the peak period of new energy and improve load distribution. Secondly, the location, capacity, power, and scheduling strategy of distributed energy storage are taken as variables, and the operation cost of the distribution network, energy storage cost, new energy abandonment cost, carbon transaction cost, and network loss cost are taken as objective functions. The INBA algorithm is used to solve the problem, and the simulation experiment is carried out by an IEEE33 node. The results show that the scheme has a good economy while effectively improving the level of new energy consumption. The application of distributed energy storage and demand response strategies can effectively reduce system network loss and carbon transaction costs, improve the voltage level of the power grid, and improve the stability of power grid operation.
In future power grid construction, the application of distributed energy storage should be considered, and the enthusiasm of users to participate in demand response should be improved. The application of these means can effectively improve the peaking capacity of the power grid and improve power quality. The cost analysis of the distributed energy storage application scheme proposed in this paper helps operators make investment decisions that are more in line with their interests, which is extremely important for the future power grid with increasing new energy penetration.
Combined with the current research progress, the following work needs to be further carried out:
(1) The power, discharge depth, and state of charge of battery-type energy storage have an impact on the life of energy storage. The impact of various operating indicators of energy storage on its life is a very complex issue. Next, the energy storage capacity degradation model under the influence of various factors can be considered to accurately calculate the energy storage life and the number of replacements during the planning period.
(2) The fixed energy storage and mobile energy storage studied in this paper are set to install lithium-ion batteries. In fact, there are various types of energy storage in the power system. The optimal configuration of electrochemical energy storage, mechanical energy storage, and electromagnetic energy storage in fixed and mobile forms can be further considered.
(3) Compared with the traditional BA algorithm and PSO algorithm, the INBA algorithm has a certain degree of improvement, and the solution speed is faster, but the solution results are only improved by 0.64% and 1.01%. The follow-up work can further improve the INBA algorithm.

Author Contributions

Formal analysis, Y.R.; investigation, X.C.; methodology, Y.R.; project administration, X.C. and L.Y.; resources, X.C. and X.Z.; software, X.Z. and Y.R.; supervision, X.C. and L.Y.; validation, Y.R.; visualization, Y.R.; writing—original draft, Y.R.; writing—review and editing, P.T. and J.L. All authors have read and agreed to the published version of the manuscript.

Funding

This research was funded by National Natural Science Foundation of China, grant number 72174151.

Institutional Review Board Statement

Not applicable.

Informed Consent Statement

Not applicable.

Data Availability Statement

Not applicable.

Conflicts of Interest

The authors declare no conflict of interest.

References

  1. Legrand, M.; Labajo-Hurtado, R.; Rodríguez-Antón, L.M.; Doce, Y. Price arbitrage optimization of a photovoltaic power plant with liquid air energy storage. Implementation to the Spanish case. Energy 2022, 239, 121957. [Google Scholar] [CrossRef]
  2. Wolf-Dieter, S. Thermo-mechanical concepts for bulk energy storage. Renew. Sustain. Energy Rev. 2017, 75, 205–219. [Google Scholar]
  3. Yafei, L. Distributed Energy Storage Optimal Allocation and Life Cycle Economic Evaluation Method in Distribution Network; Southeast University: Nanjing, China, 2019. [Google Scholar]
  4. Changqing, C.; Xinran, L.I.; Zhang, B. Energy storage peak and frequency modulation cooperative control strategy based on multi-time-scale. Power Syst. Prot. Control 2022, 50, 94–105. [Google Scholar]
  5. Sun, W.; Song, H.; Qin, Y.; Li, H. Energy Storage System Optimal Allocation Considering Flexibility Supply and Demand Uncertainty. Power Syst. Technol. 2020, 44, 4486–4497. [Google Scholar]
  6. Wang, Y.; Zheng, Y.; Xue, H.; Mi, Y. Optimal dispatch of mobile energy storage for peak load shifting based on enhanced firework algorithm. Autom. Electr. Power Syst. 2021, 45, 48–56. [Google Scholar]
  7. Pulazza, G.; Zhang, N.; Kang, C.; Nucci, C.A. Transmission Planning with Battery-based Energy Storage Transportation for Power Systems with High Penetration of Renewable Energy. IEEE Trans. Power Syst. 2021, 36, 4928–4940. [Google Scholar] [CrossRef]
  8. Shi, Z.; Wang, W.; Huang, Y.; Li, P.; Dong, L. Simultaneous Optimization of Renewable Energy and Energy Storage Capacity with the Hierarchical Control. CSEE J. Power Energy Syst. 2022, 8, 95–104. [Google Scholar]
  9. Sedghi, M.; Ahmadian, A.; Aliakbar-Golkar, M. Optimal Storage Planning in Active Distribution Network Considering Uncertainty of Wind Power Distributed Generation. IEEE Trans. Power Syst. 2015, 31, 304–316. [Google Scholar] [CrossRef]
  10. Tang, X.; Deng, K.; Wu, Q.; Feng, Y. Optimal Location and Capacity of the Distributed Energy Storage System in a Distribution Network. IEEE Access 2020, 8, 15576–15578. [Google Scholar] [CrossRef]
  11. Tao, Q.; Sang, B.; Ye, J.; Xue, J. Optimal Configuration Method of Distributed Energy Storage Systems in Distribution Network with High Penetration of Photovoltaic. High Volt. Eng. 2016, 42, 2158–2165. [Google Scholar]
  12. Cai, F.; Hu, Z.; Cao, M.; Cai, D.; Chen, R.; Sun, G. Coordinated planning of centralized and dis-tributed battery energy storage for improving renewable energy accommodation capability. Autom. Electr. Power Syst. 2022, 46, 23–32. [Google Scholar]
  13. Yang, P.; Nehorai, A. Joint Optimization of Hybrid Energy Storage and Generation Capacity with Renewable Energy. IEEE Trans. Smart Grid 2014, 5, 1566–1574. [Google Scholar] [CrossRef]
  14. Guo, Z.; Wei, W.; Chen, L.; Dong, Z.Y.; Mei, S. Impact of Energy Storage on Renewable Energy Utilization: A Geometric Description. IEEE Trans. Sustain. Energy 2021, 12, 874–885. [Google Scholar] [CrossRef]
  15. Yang, Y.; Zheng, P.; Mao, R.; Qin, H.; Wang, Y. Islanded Microgrid Economic Dispatch Based on Segmented Quantization of Uncertainty Margin and Segmented Penalty of Curtailed Wind and Solar Power. Mod. Electr. Power 2023, 40, 73–81. [Google Scholar]
  16. Yang, X. A new metaheuristic bat-inspired algorithm. Nat. Inspired Coop. Strategies Optim. 2010, 284, 65–74. [Google Scholar]
  17. Han, Y.; Yu, S.; Li, L.; Hou, Y.; Li, Q.; Chen, W. Low-carbon and Economic Configuration Method for Solar Hydrogen Storage Microgrid Including Stepped Carbon Trading. High Volt. Eng. 2022, 48, 2523–2533. [Google Scholar]
Figure 1. Comparison of optimization evolution curves of different algorithms.
Sustainability 15 14540 g001
Figure 2. Charging and discharging power of each energy storage.
Sustainability 15 14540 g002
Figure 3. Comparison of network loss before and after allocating energy storage in power grid.
Sustainability 15 14540 g003
Figure 4. Node voltage before and after energy storage allocation.
Sustainability 15 14540 g004
Table 1. Time-of-use price.
TimeElectricity Sales Price/(yuan·kWh−1)Electricity Purchase Price/(yuan·kWh−1)
00:00–08:00
23:00–24:00
0.280.37
12:00–15:00
19:00–23:00
0.530.69
08:00–12:00
15:00–19:00
0.720.87
Table 2. INBA algorithm parameters.
ParameterNumerical Value
f min 20
f max 500
A min 0
A 0 [1, 2]
β BA 0.9
r 0 [0, 1]
c 1 1.5
c 2 0.5
k BA , max 0.9
k BA , max 0.4
Table 3. Allocation of distributed energy storage.
Energy StorageAllocation NodeRated Capacity/kWhNominal Power/kVA
122400200
22676300
318666200
433547200
Table 4. New energy consumption under different schemes.
SchemeWhether to Allocate Energy StorageWhether to
Participate in DR
New Energy
Consumption/kW·h
New Energy Waste
/kW·h
New Energy Accommodation
1NoNo3930.913115.8955.77%
2NoYes4533.212513.5964.33%
3YesNo58271219.882.69%
4YesYes6445.78601.0291.47%
Table 5. Cost analysis of different schemes.
SchemeCapitalized Cost/yuanOperation and Maintenance Cost/yuanNew Energy Abandonment Cost/yuanNetwork Loss Cost/yuanCarbon Trading Cost/yuanTotal Cost/yuan
11383.713713902570.22490.77971.6
21383.71371159.72536.42388.77605.5
32248.4163.6627.82444.32280.37764.4
42248.4163.6308.52240.52114.97075.9
Disclaimer/Publisher’s Note: The statements, opinions and data contained in all publications are solely those of the individual author(s) and contributor(s) and not of MDPI and/or the editor(s). MDPI and/or the editor(s) disclaim responsibility for any injury to people or property resulting from any ideas, methods, instructions or products referred to in the content.

