Article

A Study of Sustainable Product Design Evaluation Based on the Analytic Hierarchy Process and Deep Residual Networks

Key Laboratory of Air-driven Equipment Technology of Zhejiang Province, Quzhou University, Quzhou 324000, China
*
Author to whom correspondence should be addressed.
Sustainability 2023, 15(19), 14538; https://doi.org/10.3390/su151914538
Submission received: 8 May 2023 / Revised: 25 September 2023 / Accepted: 5 October 2023 / Published: 6 October 2023
(This article belongs to the Section Sustainable Products and Services)

Abstract

:
Traditional product design evaluation processes are resource-intensive and time-consuming, resulting in unsustainably higher costs and longer lead times. Therefore, sustainable product design evaluation has become an increasingly crucial aspect of product design, focusing on creating a high-efficiency, high-reliability, and low-carbon-emission approach. In this study, we proposed an integrated approach that combines manual design evaluation based on the analytic hierarchy process (AHP) with an automatic design evaluation based on a ResNet-50 network in order to develop a sustainable design evaluation method. First, the evaluation level and indicators for the shape design of a tail-light were defined using the AHP. We followed this by establishing a determination matrix and weight coefficients for the design indicators to create a manual design evaluation model. Second, tail-light shape image datasets were manually annotated based on the evaluation indicators, and design datasets were constructed. The ResNet-50 algorithm was introduced to train the datasets, and the automatic evaluation model for product design was constructed through training and tuning. Finally, we validated the feasibility and effectiveness of the product design evaluation method, which was based on AHP and ResNet-50, by comparing the results obtained using both manual design and automatic design evaluations. The results showed that the proposed sustainable product design evaluation model provides an efficient and reliable method for evaluating product design, improves the decision-making process, and empowers the design and development process. The model enhances resource efficiency and economic sustainability.

1. Introduction

Sustainability evaluation, also known as sustainability assessment, can be broadly defined as the process that directs planning and decision making towards sustainable development [1,2]. Sustainability evaluation involves assessing the potential environmental, social, and economic impacts of proposed activities and projects in order to ensure that they are sustainable and contribute to the overall wellbeing of people and the planet. In recent years, sustainability evaluation has gained increasing attention from the scientific research community [3,4,5,6]. The existing sustainability evaluation literature predominantly focuses on efficiency improvements [7,8,9], with the objective of reducing waste and decreasing energy consumption. Sustainability evaluation often includes reporting on the environmental impact, economic benefits, and social benefits of an activity [1,10]. For example, sustainability evaluation may consider the economic costs and benefits of different options, the social implications of a project, and its impact on the environment. As such, sustainability evaluation can serve as a tool for identifying trade-offs among various sustainability goals and developing strategies for negative impact mitigation.
In the field of product design, sustainable design evaluation is an essential stage in improving the efficiency of the entire product development process and is widely regarded as one of the most important practices in achieving sustainability [11,12]. The traditional design evaluation process often requires significant resource allocation and tends to be time-consuming, resulting in increased costs and longer lead times for product development. In contrast, sustainable design evaluation offers to expedite decision making, accelerate time to market, reduce labor costs, and improve resource efficiency. These benefits contribute to mitigating the negative environmental impact of products while maximizing their economic and social advantages. As such, sustainable design evaluation has attracted widespread attention in the field of product design and is seen as an important step towards creating a more sustainable and responsible approach to product development.
Design evaluation involves a systematic assessment of design quality [13,14,15], functionality [16,17], and usability [18,19]. For example, Isler et al. [16] evaluated a sudden brake warning system (SBWS) using a video-based simulation dual task, revealing that the SBWS was effective and beneficial in enabling smoother deceleration and reducing fuel consumption. Lai et al. [17] conducted objective experiments and subjective evaluations through an on-road test to evaluate the effect of tinted helmet visors on visibility. They proposed an optimal tinted helmet visor design for motorcycle riders that effectively avoids a reduction in visibility performance. Azham et al. [20] evaluated the usability of mobile phone app designs and proposed a usability metric framework that establishes links between usability goals, such as simplicity, accuracy, and safety. To achieve these evaluations, specific criteria and standards were established to measure the design’s compliance and effectiveness in achieving desired objectives. These criteria and standards can vary depending on the product’s purpose, target audience, and industry standards. Design evaluation can be performed using various methods, including manual evaluation by human evaluators, automatic evaluations using computer-based algorithms, or a combination of both.
Manual design evaluation is conducted by human evaluators, who use their experience, skills, and expertise to assess a design. Evaluation criteria are generally based on various factors, including aesthetics, functionality, user experience, and sustainability. Manual design evaluation relies on the personal preferences, expertise, and knowledge of the human evaluators and can be particularly useful when evaluating designs that involve subjective criteria, such as aesthetics or user experience. Several studies have been conducted regarding manual design evaluation. For example, Ariffe et al. [21] presented a methodology for evaluating and selecting the most appropriate design concepts at the conceptual design stage based on the analytical hierarchy process (AHP). Kapkın et al. [22] evaluated product form design based on a method of thinking aloud and subjective rating, and they suggested that the physical quality of the form and the perceived meaning followed patterns akin to Fechner’s law of perception. Luo et al. [23] conducted a preliminary study of perceptual matching in order to evaluate beverage bottle design based on a classification task and a semantic differential (SD) experiment. Sonderegger and Sauer [24] investigated the role of non-visual aesthetics in consumer product evaluations based on a subjective rating with a Likert scale. Lin et al. [25] evaluated headphone design based on Kansei engineering and proposed headphone design strategies that conformed to consumer perception and preference.
Automatic design evaluation refers to the use of computer-based algorithms and software tools to evaluate a design based on predefined criteria and standards. These algorithms can analyze various aspects of a design, such as its functionality, manufacturability, and cost-effectiveness, to provide quantitative feedback on the design’s performance. With the development of artificial intelligence technologies such as big data and machine learning algorithms, automatic design evaluation has started to empower the product design and evaluation process. It can provide a fast, objective, and comprehensive evaluation of a design’s performance, while also improving the quality and efficiency of the design process. Several researchers have studied automatic design evaluation. For example, Wu [26] proposed a method for evaluating the design of product shapes using a multilayer perceptron genetic algorithm in a neural network (GA-MLP-NN). Hao et al. [27] proposed a novel quality-guided deep neural network and weighting scheme to achieve a multiobjective evaluation and decision across multiple industrial products and their design processes.
A combination of manual and automatic evaluation methods has also been used. In such instances, human evaluators performed the initial evaluation, and the results were then verified and validated using computer-based algorithms. This approach combined the benefits of both methods, providing a comprehensive evaluation that was both objective and captured the human evaluators’ expertise. Xing et al. [28] constructed a dataset using GUI images with the ratio of likes/views as the ground-truth annotation, and proposed a GUI (graphic user interface) aesthetic evaluation model based on squeeze-and-excitation VGG19 network architecture. Zhang et al. [29] constructed a self-adaptive deep aesthetic model of Chinese ink paintings using a subject query mechanism. The results demonstrated that the proposed aesthetic model had a higher aesthetic evaluation performance. Although several studies have been conducted on the combination of manual and automatic evaluation methods, few studies have been carried out in the field of sustainable product design. The relevant studies on design evaluation are presented in Table 1.
This study aimed to develop a sustainable product design evaluation method that integrates an AHP-based manual design evaluation method with an automatic design evaluation method using deep residual network algorithms (i.e., ResNet). After considering multiple factors and criteria, this sustainable design evaluation method could improve the efficiency of the design process while also ensuring that the product met necessary requirements.

2. Theoretical Background

2.1. The Analytic Hierarchy Process

The analytic hierarchy process (AHP) is a decision-making tool developed by Saaty [30]. It is a mathematical model that organizes and prioritizes complex decision-making processes by comparing the relative attributes and importance of two items. AHP is based on the concept that decision making involves several criteria, each with different levels of importance, and that these criteria can be organized into a hierarchical structure [31,32]. This hierarchy consists of a goal, which is broken down into a series of criteria. These are then further broken down into sub-criteria, and so on. In this study, operating based on AHP, decisionmakers were asked to evaluate each criterion and sub-criterion in relation to each other using a pairwise comparison method. The results of these comparisons were then used to calculate the weights for each criterion, reflecting their relative importance in achieving the overall goal. The AHP method involved five primary steps:
  • Define the decision problem: The first step was to define the decision problem and identify relevant, important, and measurable criteria.
  • Create a hierarchy: The second step was to develop a hierarchy of the decision problem. This hierarchy consisted of the goal, criteria, and indicators. The goal was the overall objective, the criteria were the factors used to evaluate the indicators, and the indicators were the options evaluated.
  • Importance pairwise comparison: This involved comparing each decision criterion with every other criterion and each indicator with every other indicator in terms of their importance. The comparisons were made using a scale of 1–9, where 1 indicated that the two elements were equally important, and 9 indicated one element was significantly more important than the other. Each of the comparison matrices followed the form of Equation (1).
D = [ d 11 d 12 d 1 n d 21 d 22 d 2 n d n 1 d n 2 d n n ]
In this matrix, dij refers to the pairwise comparison rating for attributes i and j.
4.
Calculate the weights: The weights of the criteria and indicators were calculated using a mathematical formula that considered the pairwise comparisons. To ensure that the pairwise comparisons were consistent, a consistency ratio was calculated. If the consistency ratio was greater than 0.1, then the pairwise comparisons required review and revision. Once the weights were calculated, the indicators could then be evaluated using the decision criteria. The indicators were scored based on how well they met the decision criteria.
5.
Calculate the overall rankings: We calculated the overall rankings of the indicators by multiplying the indicator performance scores by the corresponding criteria weights and summing the results for each indicator.
The AHP method has been widely used in various fields, including design, engineering, environmental sciences, and management, due to its flexibility in handling complex decision-making tasks [33,34,35,36]. For example, Ginting et al. [37] used the AHP method, value engineering, and a brainstorming model to design a standard static bicycle for post-stroke patients. Zhou et al. [38] employed the AHP method to evaluate the landslide susceptibility of a construction site for photovoltaic power generation facilities. Uzoka and Ijatuyi [39] utilized the AHP approach to investigate library management, specifically focusing on the acquisition process. They considered various criteria such as costs, resource availability, and the required number of book copies. Dožić et al. [40] structured and rated the criteria regarding the airline choices of freight forwarders using the AHP method. Veisi et al. [41] assessed the opinions of elite farmers, agricultural water specialists, extension experts, and agricultural non-governmental organizations on three irrigation systems using the AHP method based on nine indicators to select the best irrigation system.

2.2. Residual Neural Network

Deep residual networks (ResNet) are a type of deep neural network architecture proposed by He et al. [42] in 2015. By incorporating a unique design involving identity mapping in the deep convolutional neural network, ResNet addressed the challenges caused by the deep network architecture, such as gradient disappearance, gradient explosion, and network degradation [42,43]. ResNet enhanced the number of information transmission paths, extended the network depth from dozens to thousands of layers, and significantly improved the accuracy of the system.
Figure 1 shows the structure of the residual learning module of ResNet, comprising a parametric network layer mapped to H, with x as input and H(x) as output [44]. In contrast to traditional deep convolutional neural networks that directly learn the expression formula for H, ResNet learned the mapping of the residual F(x) and x itself through multiple parameterized layers, resulting in H(x) = F(x) + x. The residual network only derived H(x) − x, making it easier and more effective to directly obtain the residuals using a generalized parametric layer. ResNet has demonstrated outstanding performance in various fields, such as image classification [45,46], facial detection [47], and semantic segmentation [48]. Additionally, it has proven to be a highly effective image feature extractor [49,50].
In the field of product design evaluation, ResNet is starting to be applied for design evaluation, enhancing traditional design evaluation methods. For example, Wu et al. [51] developed an evaluation prediction model for the products of an industrial design competition based on a deep neural convolutional network (DCNN) and introduced the SEFL-ResNet (squeeze-and-excitation Focal-ResNet) model to accurately predict the evaluation of product design awards. Wang et al. [52] trained the side profiles of lifting machinery using ResNet and presented an artificial intelligence decision-making model for lifting machinery.
Various types of ResNet architectures have been introduced, such as ResNet-18, ResNet-34, ResNet-50, ResNet-101, and ResNet-152. Among these, ResNet-50 is a variant that has been broadly applied in many computer vision applications [53,54,55,56]. The ResNet-50 network consists of six stages, as depicted in Figure 2 [57], comprising the input stage (stage 1), four residual stages (stage 2–5), and the output stage (stage 6). It consists of a total of 49 convolutional layers and 1 fully connected layer, with each layer utilizing batch normalization and a ReLU activation function to enhance the model’s fitting ability.
ResNet-50 has demonstrated outstanding performance in numerous image recognition tasks, aesthetic evaluations, and assessment predictions. For example, Dewi et al. [58] combined ResNet-50 with spatial pyramid pooling (SPP) to identify musical instruments that were identical in size, form, and sound. The authors then proposed a ResNet-50 SPP model with strong identification performance. Fulton et al. [59] used ResNet-50 to predict the presence and severity of clinical dementia ratings (CDRs) from MRIs (multiclass classification) and demonstrated that a ResNet-50 network model could help to identify Alzheimer’s disease patients automatically, prior to the provider review. Wang et al. [60] proposed a multidimensional aesthetic evaluation method of mobile game images based on a ResNet-50 algorithm and verified the effectiveness of the proposed evaluation algorithm through comparative experiments. The high recognition accuracy and real-time performance of ResNet-50 made it a suitable choice for product design evaluation. Furthermore, considering the equipment applied in this study, ResNet-50 was selected as a tool for product design evaluation.

3. Methods

This study aimed to combine a manual design evaluation method based on the analytic hierarchy process (AHP) with automatic design evaluation based on deep residual network algorithms (i.e., ResNet) to develop a sustainable evaluation method for product design. As the design of a tail-light profile plays an essential role in the overall aesthetics and functionality of a vehicle and is becoming an increasingly important aspect for vehicle design evaluation and decision making, tail-light design was used as a case study for product design evaluation.

3.1. Experiment 1: Manual Design Evaluation Based on the AHP Method

This section outlines the development of a manual design evaluation model based on the AHP method for tail-light design evaluation.

3.1.1. Establishment of Design Evaluation Indicators

Luo et al. [61,62] demonstrated that safety and aesthetics are the two primary criteria for tail-light shape design. In terms of the safety criterion, their study revealed that a longer tail-light shape is safer in comparison to a shorter tail-light shape [61]. Furthermore, an enclosed-shaped tail-light was found to significantly enhance vehicle conspicuity when compared to an open-contour-shaped tail-light. The visibility of the tail-light shape has a direct impact on driving safety [63,64], making it a crucial safety criterion.
Regarding the aesthetic criteria, it was found that consumers exhibit a preference for tail-light shapes with contour features or medium length. Consequently, tail-light shapes with contour features and medium length can be considered as important aesthetic criteria [61]. Complexity has been identified as a strong predictor of aesthetic judgment [65,66,67]. Previous studies have consistently demonstrated that as stimulus complexity increases, there is an initial rise in preference until reaching an optimal point, beyond which preference declines in an inverted-U pattern [68,69]. Maintaining a moderate level of complexity can effectively capture observers’ attention [69] and enhance visual aesthetic preferences [70,71]. Therefore, complexity can be regarded as one of the indicators for tail-light shape design.
The word “streamline” refers to the incorporation of sleek and aerodynamic characteristics into the shape of tail-lights. This design approach aims to reduce air resistance and minimize drag, resulting in improved aerodynamic efficiency for vehicles [72]. By creating a streamlined profile, tail-lights contribute to the smooth flow of air around a vehicle, reducing turbulence and optimizing performance. This not only enhances fuel efficiency but also improves handling and stability at higher speeds [73]. The Integration of streamline principles into tail-light design showcases the commitment of automotive manufacturers to achieving greater efficiency and enhancing the overall performance of their vehicles. Moreover, streamline tail-light shape design often contributes to the overall aesthetic appeal of a vehicle, creating a more modern and stylish look [74].
Harmony refers to the overall coherence and balance achieved in the tail-light shape. According to Van Poolen [75], “delightful harmony” is the central norm that characterizes the aesthetic dimension of engineering design. Pirsig [76] defines aesthetically good design as inducing a holistic, delightful harmony between human and machine. As our sense of beauty corresponds to our innate sense of harmony [77], achieving harmonious tail-light shape design is crucial for the overall appearance of a vehicle. Such a design enhances the vehicle’s aesthetic appeal, imparting elegance and a sense of completeness. When the tail-light shape complements other elements of the vehicle, it creates visual consistency, resulting in a smoother and more appealing exterior.
Exquisiteness emphasizes the intricate and refined aspects of the tail-light shape. It is often associated with elegance, refinement, and meticulous attention to detail, particularly in the realm of product design. Exquisiteness plays a significant role in the overall quality and appeal of a product, creating a pleasing and impressive appearance for users or customers [78]. For instance, Hou et al. [79] evaluated smartphone designs based on dimensions such as exquisiteness, balance, color, and reliability, constructing a Kansei image rating system to assess smartphone appearance. Cheng et al. [80] focused their efforts on the design themes of “exquisite” and “intimacy,” showcasing a successful design practice for product form innovation. In the context of tail-light shape, an exquisite design serves as a testament to the exceptional level of precision and attention to detail incorporated into the vehicle’s production. Exquisiteness elevates the tail-light from being a mere functional component to becoming a work of art that adds a touch of luxury and refinement to the overall appearance of the vehicle.
The concept of trendiness captures the incorporation of modern and fashionable elements into tail-light shape design. The product semantics of Hsiao et al. [81] can be categorized into four fundamental dimensions: trendiness, emotion, complexity, and potency. These dimensions play crucial roles in affecting judgments of product shapes and contribute to the development of emotionally appealing product designs. Hung et al. [82] investigated the impact of trendiness, complexity, and emotion on judgments of product novelty and aesthetic preference. Bloch [83] highlighted the influence of prevailing styles and fashion on consumer preferences for product design, emphasizing the significance of trendiness in consumer perceptions of product appearance [82,84]. In tail-light shape design, trendiness entails incorporating contemporary and stylish elements that reflect current fashion and design trends. By embracing trendiness, tail-light designs can appeal to consumers who appreciate modern aesthetics, enhancing overall vehicle appeal and desirability.
The tail-light shape design criteria and their corresponding indicators were defined and are summarized in Table 2, including safety and aesthetics. The safety criteria had three indicators, which were the length of the shape (S1), the closure of the shape (S2), and the visibility of the shape (S3). The aesthetic criteria (A level) had seven indicators, which were the length of the shape (A1), the filling degree of the pattern (A2), streamlining (A3), complexity (A4), balance (A5), exquisiteness (A6), and trendiness (A7). These design criteria and indicators for tail-light shape design have been agreed upon and confirmed based on expert evaluations performed by seven vehicle designers with at least five years of design experience.

3.1.2. Pairwise Comparison

Based on the AHP method, the first steps to achieve a more objective and accurate calculation of weights among the different indicators were to conduct pairwise comparisons and create determination matrices for each level. If we consider the upper-level criteria as D and the lower-level sub-criteria as d1, d2, , dn, it is possible to determine the weights indicating the relative importance of elements di and dj to the criteria D. The typical approach to measuring the relative importance of indicators involves assigning numerical values and their reciprocals on a scale of 1–9 [32]. Table 3 shows the meaning of the scale for the determination matrix used to evaluate the design of the tail-light shape.
The determination matrix equation of the design level was defined by Equation (2):
D = ( d i j ) n × n
where dij > 0, dji = 1/dij, and dii = 1. If all the indicators of the determination matrix D satisfy dij·djk = dik, then D is a consistent matrix.
A group of nine car users with driver’s licenses and over five years of experience in automotive and industrial design were invited to evaluate the tail-light’s shape design using the pairwise comparison. The following scores represent one participant’s ratings for the determination matrices at each level. More comparison scores are shown in Table A1.
V = [ 1 2 1 / 2 1 ]
S = [ 1 2 2 1 / 2 1 1 / 4 2 4 1 ]
A = [ 1 1 / 2 1 / 3 2 1 / 4 1 / 3 1 / 2 2 1 1 / 3 3 1 / 2 1 / 2 1 3 3 1 3 1 / 3 1 1 / 2 1 / 2 1 / 3 1 / 3 1 1 / 5 1 / 4 1 / 3 4 2 3 5 1 1 2 3 2 1 4 1 1 2 2 1 2 3 1 / 2 1 / 2 1 ]

3.1.3. Calculation of Weight Coefficients

Once the determination matrix was constructed, the next step was to calculate the important weights between the indicators. Common methods for weight calculation include the geometric mean, arithmetic mean, eigenvector, and least-squares methods [85]. For this paper, the weight vector for each determination matrix was calculated using the geometric mean method [86] in accordance with the process outlined below:
1.
Calculate the product Di of the scale values in each row of the determination matrix D, as shown in Equation (3):
D i = j = 1 n d i j ( i = 1 , 2 , , n )
where n represents the number of indicators and dij represents the i-th row and j-th column indicators in the determination matrix D.
2.
Calculate the geometric mean of the indicators in each row, as shown in Equation (4):
d i = D i n ( i = 1 , 2 , , n )
3.
Normalize the result to obtain weights, as shown in Equation (5):
ω i = d i i = 1 n d i
4.
Perform a consistency assessment using Equations (6) and (7):
λ max = 1 n i = 1 n D ω i ω i
C I = λ max n n 1
where λ max is the largest eigenvalue, CI is the consistency index, D w i is the i-th component of the vector D w , and n is the order of the determination matrix. The random index (RI) was introduced to measure the magnitude of the consistency index (CI) [87].
Further calculations were performed to obtain the consistency ratio (CR) as CR = CI/RI; generally, the smaller the CR value was, the better the consistency of the determination matrix would be. A CR value of less than 0.1 indicates that the determination matrix meets the consistency test, while a CR value greater than 0.1 indicates that the determination matrix needs to be adjusted and reanalyzed.
Based on this process, the weight coefficient wi, maximum eigenvalue λ max , CI, and CR in criteria layers S and A were calculated. The CR values of the obtained results were all less than 0.1, and all values passed the consistency test. All the data for each determination matrix are shown in Appendix A (Table A2, Table A3 and Table A4).

3.1.4. Ranking of Indicators

The weight coefficients of each indicator in the aforementioned determination matrices were analyzed and are presented in Table 4.
Based on the important weighting coefficients, the indicators could be ranked as follows: In the V level, safety was ranked higher than aesthetics. In the S level, visibility was ranked higher than the length and the closure of the outline. In the A level, harmony was ranked higher than exquisiteness, trendiness, being streamlined, filling degree, complexity, and length. These rankings could provide valuable insights that allow designers to evaluate and make decisions regarding product design.

3.1.5. Calculation of Manual Design Evaluation

Once the indicators and their weights were obtained, manual scoring was conducted based on the indicators. Specifically, we used a 5-point Likert scale to allow evaluators to indicate their attitudes rapidly [88]. After evaluating each indicator, its score was multiplied by its corresponding weight coefficient and then the values were summed to calculate the total score of the solution, as shown in Equations (8)–(10).
R V = ω S R S ¯ + ω A R A ¯
R S = ω S 1 R S 1 ¯ + ω S 2 R S 2 ¯ + ω S 3 R S 3 ¯
R A = ω A 1 R A 1 ¯ + ω A 2 R A 2 ¯ + + ω A n R A n ¯   ( n = 7 )
where RV is the total evaluation score, RS is the safety score, RA is the aesthetic score, R i ¯ is the mean value of evaluation score, and wi is the weight value of the indicator Ri.

3.2. Experiment 2: Automatic Design Evaluation Based on ResNet

This section describes the combination of deep residual networks used to empower manual design evaluation, realizing the automation of design evaluation and compensating for the low efficiency of manual design evaluation.

3.2.1. Datasets

To construct an automatic evaluation model for vehicle tail-light shapes, a design dataset of tail-light shapes was first defined. The dataset consists of two parts: a tail-light shape image dataset and its evaluation scores. The tail-light shape image dataset was the same as that used in the study by Lin et al. [89], which had a total of 1577 images, as shown in Figure 3.
To comprehensively evaluate the tail-light shape design, the labels of the tail-light shape image dataset were defined using the 10 indicators obtained in Section 3.1.1. As there were no specific or standard datasets related to the evaluation of vehicular tail-light shape design, manual labeling was used to perform scoring. Five design experts were invited to participate in the evaluation of the vehicle tail-light shapes. Before the design evaluation, the researcher introduced tail-light safety and aesthetic design knowledge obtained from the research of Luo et al. [61,62] to the experts, which were two of the scoring criteria. Each participant rated all the evaluation indicators independently based on a 5-point Likert scale (5 points for totally agree, 4 points for agree, 3 points for neutral, 2 points for disagree, and 1 point for totally disagree). The specific evaluation indicators are shown in Table 5.
Finally, the average scores given by the five automotive design experts were calculated and used as the score labels for each evaluation indicator. This led to the further development of a design dataset for tail-light shape images and their corresponding score labels.
The design dataset of tail-light shapes consisted of 1577 images corresponding to 10 evaluation indicators. In this experiment, 90% of the dataset was designated as the training set, whereas the remaining 10% was used as the validation set.
Table 5. The specific evaluation indicators for rating.
NoEvaluation IndicatorRating
1The length of the tail-light shape is long.54321
2The outline of the tail-light shape is closed.54321
3The size, shape, and other aspects of the tail-light shape can attract the driver’s visual attention.54321
4The length of the tail-light shape is medium.54321
5The filling degree of the tail-light shape design pattern is low (low degree—contour; high degree—solid; medium degree—texture [55,56]) 54321
6The tail-light shape is streamlined.54321
7The complexity of the tail-light shape is moderate.54321
8The tail-light shape is harmonious.54321
9The tail-light shape is exquisite.54321
10The tail-light shape is trendy.54321

3.2.2. Apparatus

The experiment utilized the Python language and the Pytorch deep learning framework. The computer hardware used for the experiment included a 64-bit Windows 10 operating system, a 2.8 GHz Intel i7 CPU, and an Nvidia RTX 2070 graphics card. The software configuration included Python 3, which integrated Anaconda and Pytorch 1.0.

3.2.3. Model Training

This study used the ResNet-50 framework to construct an evaluation model for the design of the vehicle tail-light shape. As shown in Figure 4, the process of the experimental model construction included data pretraining, transfer learning, fine-tuning of target data, and model performance evaluation.
First, the ResNet-50 model was pretrained on the ImageNet dataset. As the ImageNet dataset contained over 14 million images, including a large number of vehicle images, the model could easily learn some obvious features of cars, such as headlights, via an examination of this large dataset. In order to improve the training speed and efficiency of the model, this experiment pretrained the ResNet-50 model on the ImageNet dataset and then transferred the model parameters to the tail-light dataset for fine-tuning, making the training process more convenient and accelerating the model’s understanding of tail-light image data.
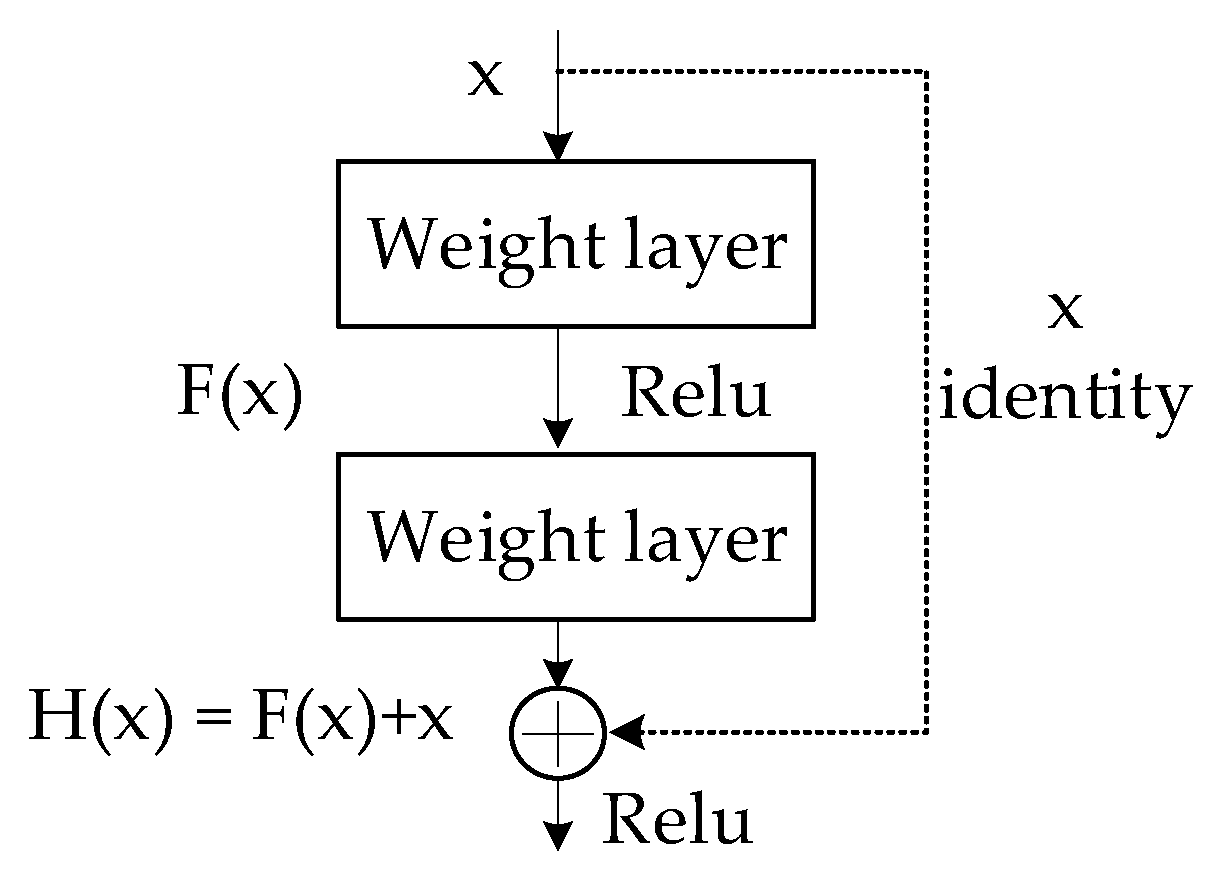
Before inputting the data into ResNet-50, the tail-light images were uniformly scaled to a size of 224 × 224 pixels. The input layer included preprocessed shape images and evaluation labels. After inputting the tail-light shape image dataset, it first underwent a 2D convolution, which changed the original channel number of the image to 64. The convolutional kernel size was 7 × 7, the stride was 2, and the padding was 3. During training, the pooling layer changed the size of the data features. The convolutional kernel size of the first pooling layer was 3 × 3, and the stride was 2. The convolutional kernel sizes of other pooling layers were 2 × 2, and the stride was 2. After the convolution layer, there was a batch normalization layer and a non-linear activation function ReLU, which was followed by maximum pooling for down-sampling. The batch normalization layer had the function of accelerating training and optimizing results, thereby improving the training effect of the deep residual network.
After the first convolutional layer operation, the procedure entered four residual model stages, in sequence, each of which contained multiple repetitive residual modules. Each residual module included a main path and a shortcut. The main path had three convolutional layers that extracted tail-light image features and evaluation information. The shortcut possessed one convolutional layer that controlled the number of features and doubled the convolutional kernel to speed up the residual propagation speed. The tail-light feature dimensions and layer numbers obtained from the main path and shortcut were the same. These were superimposed at the end of the residual module, thereby fusing the deep and shallow features of the tail-light shape image and evaluation data to obtain more tail-light shape image feature information.
After the residual stage, the model continued through a final stage consisting of an average pooling layer and a fully connected layer. It integrated the convolutional features obtained earlier and converted the data into a 10-dimensional, fully connected network output, which was then used for tail-light shape design evaluation and prediction. The mean square error (MSE) loss function was used to determine the degree of convergence between the predicted and true values. ReLU was used as the activation function for each convolutional and fully connected layer.
In this experiment, the batch size of the training parameters was set to 16, the initial learning rate was 0.0001, and the training cycle (epochs) was set to 20 based on the size of the dataset. The stochastic gradient descent was used for training and the Adam optimizer was used to learn the parameters and optimize the network. The optimizer had a momentum parameter set at 0.1, and a weight decay parameter set at 0.0001. The MSE function was used as the optimization loss function, which calculated the square sum of the distance between the predicted value and the true value, as shown in the following formula:
M S E = 1 m i = 1 m ( y i y i ) 2
where m refers to the number of pictures, y i refers to the true value, and y i refers to the predicted value. When continuously training the model, the smaller the loss function that was obtained, the higher the accuracy of the model became, which indicated a higher accuracy when predicting the evaluation of tail-light shape images. Figure 5 illustrates the architecture of the tail-light shape design evaluation model based on ResNet-50.

3.2.4. Results

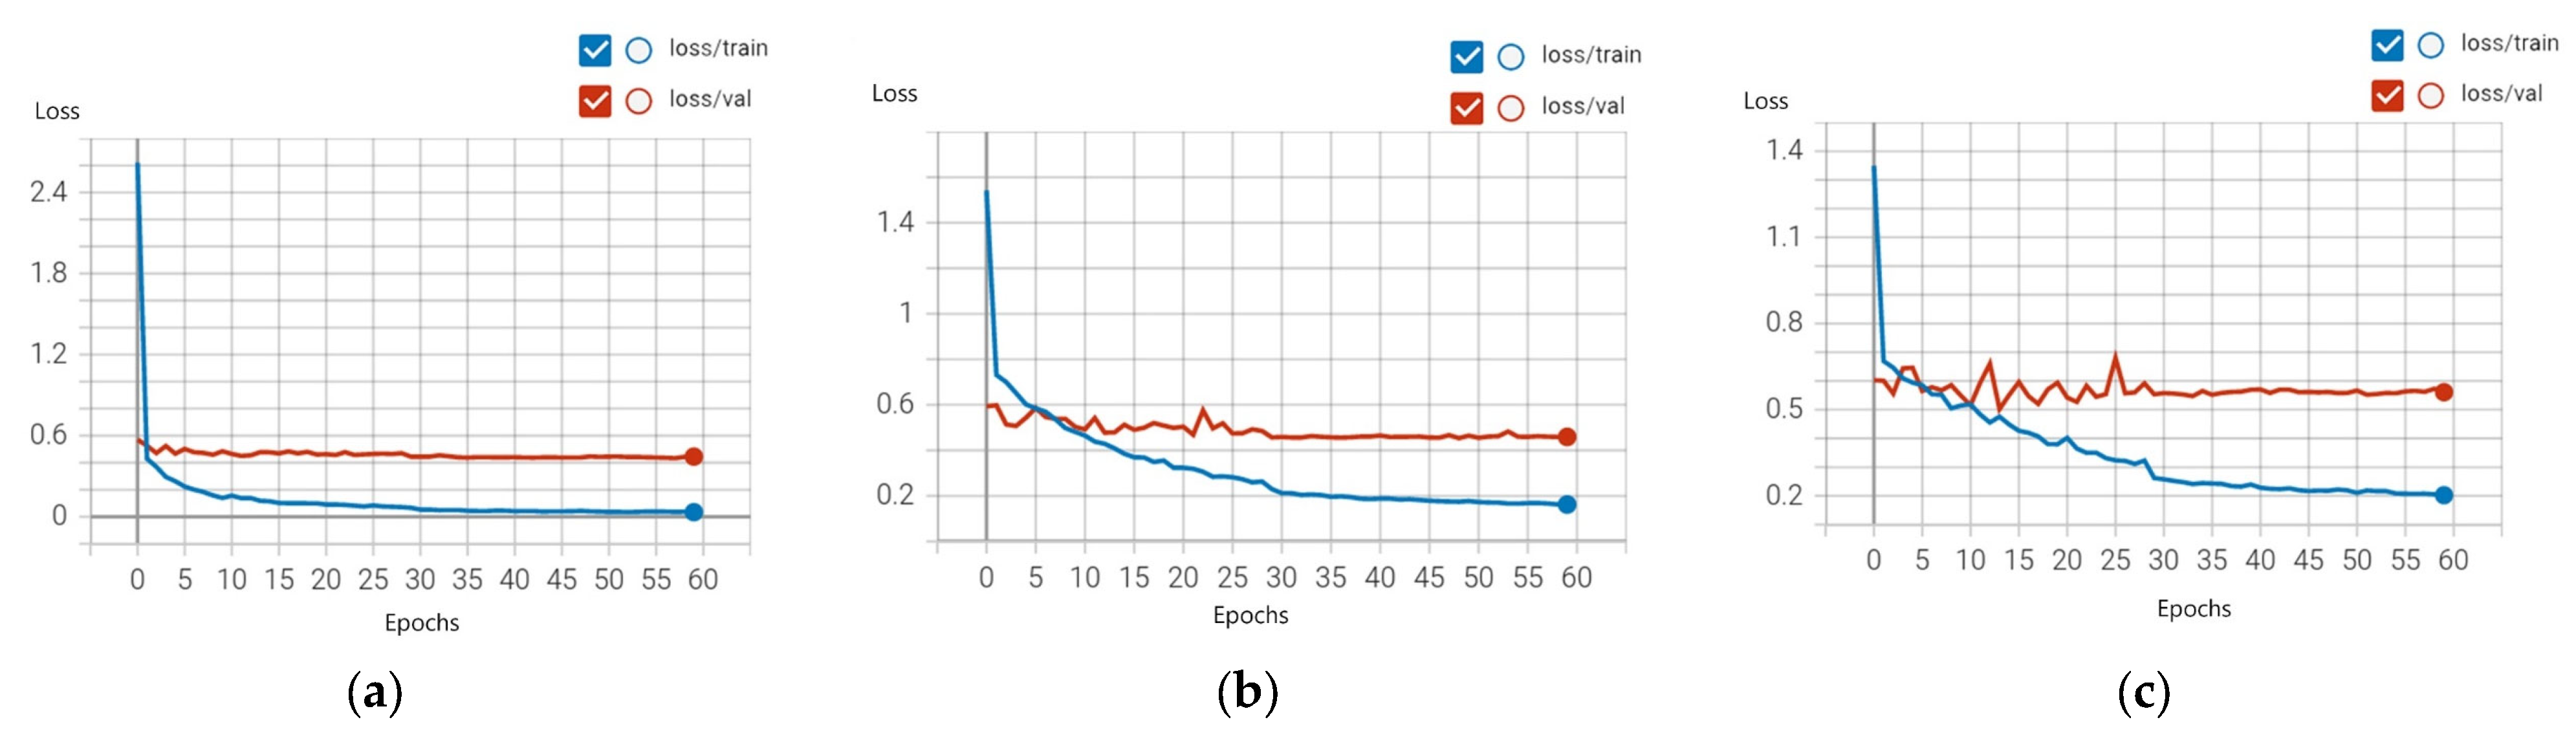
The experimental datasets were split into training and validation sets using the 10-fold cross-validation method, where 90% of the data was used for training and 10% for validation. The model’s performance was evaluated by adjusting the parameters and conducting multiple iterative tests. The MSE was used as the evaluation metric, with a smaller MSE indicating a smaller prediction error and better model performance. During the experiment, it was observed that the model started to converge after 20 training epochs, as shown in Figure 6, where the horizontal axis represents the training epochs and the vertical axis represents the loss.
Additionally, the dataset was trained and compared with the VGG-16 and Alexnet deep learning frameworks. Figure 6 illustrates the MSE loss value curves for the three different models. At the optimal training epoch, the MSE values for the validation set of the three models were obtained at 0.484 (ResNet-50), 0.5058 (VGG-16), and 0.5079 (Alexnet). By combining the MSE loss value curves and MSE values, it was discovered that the prediction accuracy of ResNet-50 for tail-light shape design evaluation was superior to that of the other two deep neural networks. These results suggested that using a deep residual network for the prediction of automotive tail-light shape design evaluation was feasible.

3.3. Comparison and Verification of Experimental Results

To validate the effectiveness and the feasibility of the tail-light shape design evaluation model based on a ResNet-50 network, we compared the scores obtained from the automatic design evaluation with those obtained from the manual design evaluation. Firstly, seven tail-light shape images were randomly selected from the dataset as validation samples, and both manual and automatic design evaluations were performed to compare the different scores.
In the manual design evaluation process, we invited 32 participants, including 10 vehicle designers and 22 consumers, to rate 10 indicators of tail-light shape design. Each participant independently rated all evaluation indicators based on a 5-point Likert scale (5 points for “very consistent”, 4 points for “consistent”, 3 points for “neutral”, 2 points for “inconsistent”, and 1 point for “very inconsistent”). After all participants had completed their assessments, we calculated the total score for each tail-light shape design by weighting the 10 indicators according to Equations (8)–(10). The average score of each tail-light shape design was then calculated as the final score of the manual evaluation. The manual design evaluation score was used as the expected output value (ideal value) of the evaluation in this study.
In the automatic design evaluation process, we selected seven tail-light shape images and input them into the constructed ResNet-50 framework. Through the semantic decoding of the tail-light shape images, we obtained evaluation scores ranging from 1 to 5 for the corresponding 10 indicators. Based on Equations (8)–(10), we calculated the total score for each tail-light shape image by weighting the scores of the 10 indicators. The automatic design evaluation score was used as the training output value (measurement value) of the evaluation model in this study.
In practical applications of theoretical prediction models, reasonable errors are generally allowed. Since relative error can reflect the credibility of measurements [45,46], we used the relative error value to compare the results of the automated evaluation with those of the manual evaluation in order to verify the effectiveness of the automatic evaluation model. The equation for the relative error was as follows:
E r = x μ μ × 100 %
where Er is the relative error, x is the automatic design evaluation score, and u is the manual design evaluation score.
The evaluation scores and relative errors obtained from both the automatic and manual design evaluations are presented in Table 6. This study set the allowable error range at 3% based on studies conducted by Yang et al. [90] and Zhao [91]. The results demonstrated a close agreement between the automatic and manual design evaluation scores, with a maximum relative error of 2.611%. This indicated that the automatic evaluation model had a good generalization ability and could be effectively used to automatically evaluate tail-light shapes.
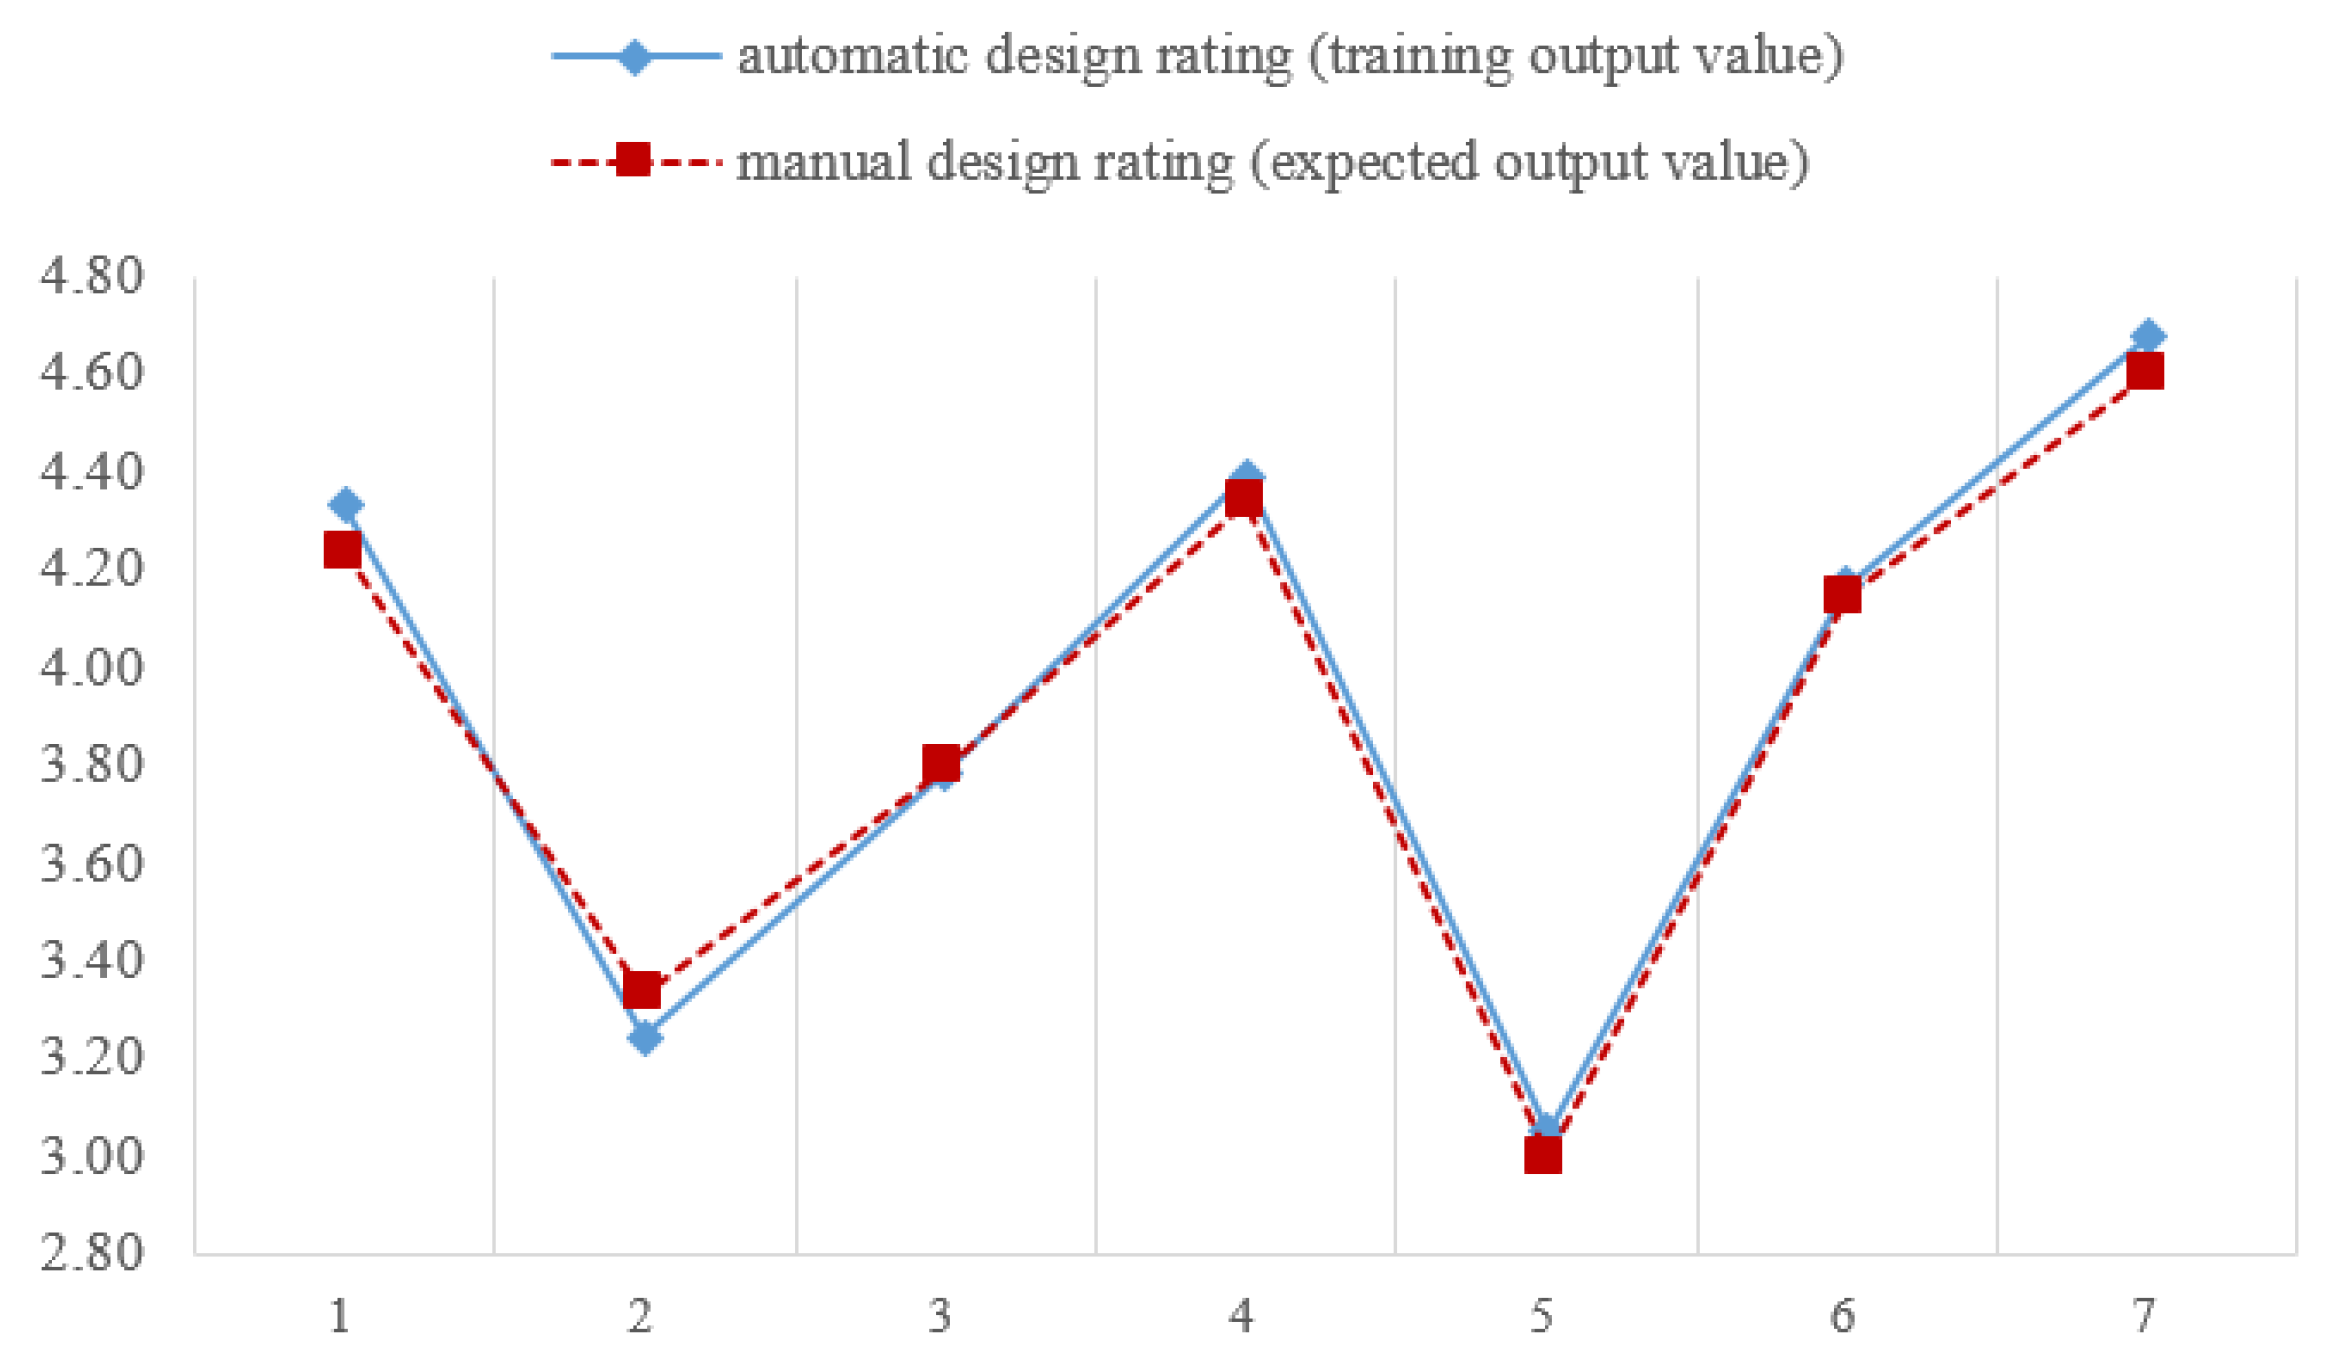
Figure 7 depicts a comparative line chart of the automatic and manual design evaluation scores. The horizontal axis represents the sample number of the test, and the vertical axis represents the user rating. The blue solid line shows the automatic design rating (training output value), whereas the red dashed line shows the manual design rating (expected output value). It was apparent that the trend of the curves was almost identical.
The close similarity between the automatic and manual evaluation scores, as shown in Table 6, supported the concept that an evaluation model based on ResNet-50 could be applied to the automatic evaluation of tail-light shape design. The evaluation model constructed, which integrated AHP with ResNet-50, could achieve a faster evaluation speed, thereby improving efficiency and reliability when evaluating and making decisions about tail-light shape designs during vehicle design and development.

4. Discussion and Conclusions

This study aimed to develop a sustainable design evaluation method for product design that considered multiple factors and criteria by conducting integrated research on a manual design evaluation based on the AHP and an automatic design evaluation based on a ResNet-50 network.
In this study, the tail-light shape design was utilized as a case study for product design evaluation. Firstly, the evaluation level and the indicators of tail-light shape design were defined based on the AHP. Then, a determination matrix was constructed and the weight coefficients for the design indicators were calculated in order to establish the manual design evaluation model. Secondly, the tail-light shape image dataset was manually annotated based on the evaluation indicators to create a relevant dataset. The ResNet-50 algorithm was then introduced to train the dataset, transforming the design evaluation problem into an image feature learning problem, and the product automatic design evaluation model was constructed through modeling and training. Finally, the feasibility and effectiveness of the sustainable evaluation method of tail-light shape design based on AHP and ResNet-50 were validated by comparing the results of manual and automatic design evaluations.
The integrated sustainable product design evaluation model, which incorporates the AHP and ResNet-50, offers a sustainable, efficient, and reliable method for evaluating product design. This innovative approach is particularly significant in the context of vehicle design, on which no related studies have been conducted. By combining the advantages of manual design evaluation, such as flexibility, human judgment, and a holistic view, with the benefits of automatic design evaluation, including speed, consistency, and cost-effectiveness, the constructed evaluation model offers a comprehensive solution. It significantly shortens the product design decision-making process, leading to a faster time to market, reduced labor costs, and more efficient resource utilization. Furthermore, by integrating sustainability considerations into the initial design phase, the model can help to avoid the costly environmental and social impacts associated with unsustainable practices, such as pollution or workforce exploitation, that may arise later in the product lifecycle.
The sustainable product design evaluation model has broad applicability, ranging from vehicle design in the transportation field to consumer product design in the electronics industry. Policymakers at national and local levels, in collaboration with sustainability advocates, can leverage this approach to effectively reduce the carbon footprint across various industries. Moreover, the methods presented in this paper, which initially focus on exploring tail-light shape design, can be extended to other product design and development processes. This flexibility allows for the streamlining of decision making in diverse product domains.
Overall, this integrated approach offers a pathway to improved production efficiency, reduced waste generation, and minimized carbon footprint. It holds significant promise for creating sustainable and environmentally conscious products.
There are some limitations to this study, which should be noted. Firstly, this approach integrates the AHP method with ResNet-50, rendering the robustness of the dataset derived from the AHP method and the training performance based on ResNet-50 crucial and highly influential factors in the final evaluation accuracy and effectiveness. However, due to time and budget constraints, the sample size of experts involved in scoring and labeling the tail-light shape design dataset was small. To enhance dataset robustness, future studies should engage more scoring experts through manual rating tasks. Additionally, this study represents a preliminary exploration and application of automatic tail-light shape design evaluation. A basic ResNet-50 model was introduced for training purposes to achieve an automatic evaluation function. In the future, innovative algorithms should be further optimized to train a tail-light shape design evaluation model in order to achieve higher prediction accuracy. Moreover, more empirical comparative studies of tail-light shape design practice based on the proposed evaluation model and other models could be conducted to identify opportunities for improvement. Examining the scalability and adaptability of the approach to different contexts and regions could also provide valuable insights. Furthermore, exploring potential synergies with related research areas and investigating interdisciplinary collaborations could broaden the scope and impact of this study.

Author Contributions

Conceptualization, methodology, validation, and investigation: H.L.; writing—original draft preparation: D.Z.; writing—review and editing: H.L.; data curation and visualization: H.L. and X.J.; supervision: X.D. and J.Y.; funding acquisition: X.D., J.Y., and X.J. All authors have read and agreed to the published version of the manuscript.

Funding

This research was funded by the National Natural Science Foundation of China (62302263; 52175472; 62102227), Zhejiang Provincial Natural Science Foundation of China (LZY21E050002; LZY21E050003), Zhejiang Provincial Public Welfare Technology Application Research Project (LGG22E050031), the Science and Technology Plan Project of Quzhou (2022K90; 2021K41), and the startup project of doctor scientific research of Quzhou University (KYQD003223004).

Institutional Review Board Statement

Not applicable.

Informed Consent Statement

Not applicable.

Data Availability Statement

Not applicable.

Conflicts of Interest

The authors declare no conflict of interest.

Appendix A

Table A1. Comparison matrices for rating by each user.
User 1User 2
V = [ 1 2 1 / 2 1 ]
S = [ 1 2 2 1 / 2 1 1 / 4 2 4 1 ]
A = [ 1 1 / 2 1 / 3 2 1 / 4 1 / 3 1 / 2 2 1 1 / 3 3 1 / 2 1 / 2 1 3 3 1 3 1 / 3 1 1 / 2 1 / 2 1 / 3 1 / 3 1 1 / 5 1 / 4 1 / 3 4 2 3 5 1 1 2 3 2 1 4 1 1 2 2 1 2 3 1 / 2 1 / 2 1 ]
V = [ 1 5 1 / 5 1 ]
S = [ 1 5 1 / 3 1 / 5 1 1 / 6 3 6 1 ]
A = [ 1 1 / 3 1 / 5 1 / 4 1 / 5 1 / 5 1 / 3 3 1 1 / 5 1 / 5 1 / 3 1 / 5 1 / 3 5 5 1 1 1 / 3 1 / 2 1 / 2 4 5 1 1 1 / 4 1 / 5 1 / 4 5 3 3 4 1 1 1 / 2 5 5 2 5 1 1 1 3 3 2 4 2 1 1 ]
User 3User 4
V = [ 1 5 1 / 5 1 ]
S = [ 1 3 1 / 3 1 / 3 1 1 / 5 3 5 1 ]
A = [ 1 1 / 3 1 / 4 1 1 / 7 1 / 7 1 / 5 3 1 1 / 3 3 1 / 5 1 / 5 1 / 3 4 3 1 5 1 / 5 1 / 5 1 / 3 1 1 / 3 1 / 5 1 1 / 5 1 / 5 1 / 3 7 5 5 5 1 2 3 7 5 5 5 1 / 2 1 2 5 3 3 3 1 / 3 1 / 2 1 ]
V = [ 1 2 1 / 2 1 ]
S = [ 1 1 / 7 1 / 9 7 1 1 / 3 9 3 1 ]
A = [ 1 1 / 3 1 / 3 1 / 5 1 / 5 1 / 6 1 / 4 3 1 1 / 2 1 / 3 1 / 3 1 / 4 1 / 2 3 2 1 1 / 2 1 / 2 1 / 3 1 / 2 5 3 2 1 1 1 / 2 1 / 3 5 3 2 1 1 1 / 3 2 6 4 3 2 3 1 3 4 2 2 3 1 / 2 1 / 3 1 ]
User 5User 6
V = [ 1 7 1 / 7 1 ]
S = [ 1 3 1 / 5 1 / 3 1 1 / 9 5 9 1 ]
A = [ 1 1 / 3 1 / 5 1 / 5 1 / 9 1 / 7 1 / 7 3 1 5 1 / 3 1 / 3 1 / 5 1 / 3 5 1 / 5 1 1 / 2 1 / 3 1 / 2 1 / 4 5 3 2 1 1 / 4 1 / 2 1 / 2 9 3 3 4 1 3 2 7 5 2 2 1 / 3 1 1 7 3 4 2 1 / 2 1 1 ]
V = [ 1 5 1 / 5 1 ]
S = [ 1 4 1 / 5 1 / 4 1 1 / 9 5 9 1 ]
A = [ 1 1 / 5 1 / 3 1 / 2 1 / 7 1 / 5 1 / 9 5 1 1 / 3 1 / 2 1 / 7 1 / 5 1 / 9 3 3 1 1 1 / 7 1 / 5 1 / 9 2 2 1 1 1 / 9 1 / 5 1 / 9 7 7 7 9 1 1 1 5 5 5 5 1 1 1 / 3 9 9 9 9 1 3 1 ]
User 7User 8
V = [ 1 5 1 / 5 1 ]
S = [ 1 4 1 / 3 1 / 4 1 1 / 7 3 7 1 ] A = [ 1 1 / 3 1 / 4 1 / 2 1 / 5 1 / 5 1 / 4 3 1 1 / 4 1 / 3 1 / 4 1 / 5 1 / 4 4 4 1 1 / 2 1 / 3 1 / 2 1 2 3 2 1 1 / 3 1 / 5 1 / 4 5 4 3 3 1 1 / 2 1 / 3 5 5 2 5 2 1 1 4 4 1 4 3 1 1 ]
V = [ 1 3 1 / 3 1 ]
S = [ 1 3 1 / 5 1 / 3 1 1 / 9 5 9 1 ]
A = [ 1 1 / 3 3 5 1 / 5 1 / 3 1 / 3 3 1 3 7 1 / 3 1 / 3 1 / 3 1 / 3 1 / 3 1 1 1 / 3 1 / 3 1 / 3 1 / 5 1 / 7 1 1 1 / 7 1 / 3 1 / 3 5 3 3 7 1 3 3 3 3 3 3 1 / 3 1 1 3 3 3 3 1 / 3 1 1 ]
User 9
V = [ 1 5 1 / 5 1 ]
S = [ 1 1 / 5 1 / 7 5 1 1 / 3 7 3 1 ]
A = [ 1 1 / 3 1 / 3 1 1 / 9 1 / 3 1 3 1 1 / 2 1 1 / 9 1 1 3 2 1 2 1 / 9 1 1 1 1 1 / 2 1 1 / 9 1 1 / 3 9 9 9 9 1 9 9 3 1 1 1 1 / 9 1 1 1 1 1 3 1 / 9 1 1 ]
Table A2. Weight coefficient of determination matrix V.
Subject Number ω S ω A λ m a x CICR
10.6670.3332.0000.0000.000
20.8330.1672.0000.0000.000
30.8330.1672.0000.0000.000
40.6670.3332.0000.0000.000
50.8750.1252.0000.0000.000
60.8330.1672.0000.0000.000
70.8330.1672.0000.0000.000
80.7500.2502.0000.0000.000
90.8330.1672.0000.0000.000
Table A3. Weight coefficient of determination matrix S.
Subject Number ω S 1 ω S 2 ω S 3 λ m a x CICR
10.2860.1430.5713.0000.0000.000
20.2920.0810.6273.0950.0480.092
30.2610.1060.6333.0390.0190.037
40.0570.2950.6493.0810.0410.078
50.1800.0710.7483.0290.0150.028
60.1990.0650.7353.0720.0360.070
70.2650.0800.6563.0330.0160.031
80.1800.0710.7483.0290.0150.028
90.0740.2830.6433.0660.0330.063
Table A4. Weight coefficient of determination matrix A.
Subject Number ω A 1 ω A 2 ω A 3 ω A 4 ω A 5 ω A 6 ω A 7 λ m a x CICR
10.0660.1130.1630.0440.2610.2100.1437.3250.0540.040
20.0380.0560.1290.1020.2100.2350.2307.8000.1330.098
30.0330.0700.1100.0400.3380.2570.1537.5480.0910.067
40.0340.0670.0930.1510.1740.3150.1667.4060.0680.050
50.0240.0970.0710.1150.3160.1850.1917.8040.1340.099
60.0270.0490.0570.0460.2760.1880.3577.6460.1080.079
70.0380.0530.1320.0950.1830.2580.2407.7600.1270.093
80.0910.1360.0540.0400.3370.1710.1717.7940.1320.097
90.0440.0730.0950.0520.5780.0780.0807.3750.0620.046

References

  1. Chen, D.F.; Schudeleit, T.; Posselt, G.; Thiede, S. A state-of-the-art review and evaluation of tools for factory sustainability assessment. Procedia CIRP 2013, 9, 85–90. [Google Scholar] [CrossRef]
  2. Hacking, T.; Guthrie, P. A framework for clarifying the meaning of Triple Bottom-Line, Integrated, and Sustainability Assessment. Environ. Impact Assess. Rev. 2008, 28, 73–89. [Google Scholar] [CrossRef]
  3. Singh, R.K.; Murty, H.R.; Gupta, S.K.; Dikshit, A.K. An overview of sustainability assessment methodologies. Ecol. Indic. 2012, 15, 281–299. [Google Scholar] [CrossRef]
  4. Bond, A.; Morrison-Saunders, A.; Pope, J. Sustainability assessment: The state of the art. Impact Assess. Proj. Apprais. 2012, 30, 53–62. [Google Scholar] [CrossRef]
  5. Ness, B.; Urbel-Piirsalu, E.; Anderberg, S.; Olsson, L. Categorising tools for sustainability assessment. Ecol. Econ. 2007, 60, 498–508. [Google Scholar] [CrossRef]
  6. Gibson, R.B. Sustainability assessment: Basic components of a practical approach. Impact Assess. Proj. Apprais. 2006, 24, 170–182. [Google Scholar] [CrossRef]
  7. Hauschild, M.Z. Better—But is it good enough? On the need to consider both eco-efficiency and eco-effectiveness to gauge industrial sustainability. Procedia CIRP 2015, 29, 1–7. [Google Scholar] [CrossRef]
  8. Gutowski, T.G. A critique of life cycle assessment; Where are the people? Procedia CIRP 2018, 69, 11–15. [Google Scholar] [CrossRef]
  9. Fantke, P.; Illner, N. Goods that are good enough: Introducing an absolute sustainability perspective for managing chemicals in consumer products. Curr. Opin. Green Sustain. Chem. 2019, 15, 91–97. [Google Scholar] [CrossRef]
  10. He, B.; Li, F.F.; Cao, X.Y.; Li, T.Y. Product sustainable design: A review from the environmental, economic, and social aspects. J. Comput. Inf. Sci. Eng. 2020, 20, 0801–0816. [Google Scholar] [CrossRef]
  11. Chen, C.; Zhu, J.; Yu, J.-Y.; Noori, H. A new methodology for evaluating sustainable product design performance with two-stage network data envelopment analysis. Eur. J. Oper. Res. 2012, 221, 348–359. [Google Scholar] [CrossRef]
  12. Suhariyanto, T.T.; Wahab, D.A.; Rahman, M.N.A. Product design evaluation using life cycle assessment and design for assembly: A case study of a water leakage alarm. Sustainability 2018, 10, 2821. [Google Scholar] [CrossRef]
  13. Bansiya, J.; Davis, C.G. A hierarchical model for object-oriented design quality assessment. IEEE Trans. Softw. Eng. 2002, 28, 4–17. [Google Scholar] [CrossRef]
  14. Ohira, H.; Hirao, N. Analysis of skin conductance response during evaluation of preferences for cosmetic products. Front. Psychol. 2015, 6, 103. [Google Scholar] [CrossRef] [PubMed]
  15. Guo, F.; Ding, Y.; Wang, T.B.; Liu, W.L.; Jin, H.Z. Applying event related potentials to evaluate user preferences toward smartphone form design. Int. J. Ind. Ergon. 2016, 54, 57–64. [Google Scholar] [CrossRef]
  16. Isler, R.B.; Starkey, N.J. Evaluation of a sudden brake warning system: Effect on the response time of the following driver. Appl Erg. 2010, 41, 569–576. [Google Scholar] [CrossRef]
  17. Lai, H.-H.; Huang, H. Evaluation of visibility of tinted helmet visors for motorcycle riders. Int. J. Ind. Ergon. 2008, 38, 953–958. [Google Scholar] [CrossRef]
  18. Nayebi, F.; Desharnais, J.-M.; Abran, A. The state of the art of mobile application usability evaluation. In Proceedings of the 2012 25th IEEE Canadian Conference on Electrical and Computer Engineering (CCECE), IEEE, Montreal, QC, Canada, 29 April–2 May 2012; pp. 1–4. [Google Scholar]
  19. Fernandez, A.; Insfran, E.; Abrahão, S. Usability evaluation methods for the web: A systematic mapping study. Inf. Softw. Technol. 2011, 53, 789–817. [Google Scholar] [CrossRef]
  20. Azham, H.; Kutar, M. Usability metric framework for mobile phone application. In Proceedings of the 10th Annual Post Graduate Symposium on the Convergence of Telecommunications, Networking and Broadcasting, Liverpool, UK, 22–23 June 2009. [Google Scholar]
  21. Ariff, H.; Salit, M.S.; Ismail, N.; Nukman, Y. Use of analytical hierarchy process (AHP) for selecting the best design concept. J. Teknol. 2008, 49, 1–18. [Google Scholar] [CrossRef]
  22. Kapkın, E.; Joines, S. An investigation into the relationship between product form and perceived meanings. Int. J. Ind. Ergon. 2018, 67, 259–273. [Google Scholar] [CrossRef]
  23. Luo, S.J.; Fu, Y.T.; Korvenmaa, P. A preliminary study of perceptual matching for the evaluation of beverage bottle design. Int. J. Ind. Ergon. 2012, 42, 219–232. [Google Scholar] [CrossRef]
  24. Sonderegger, A.; Sauer, J. The role of non-visual aesthetics in consumer product evaluation. Int. J. Hum.-Comput. Stud. 2015, 84, 19–32. [Google Scholar] [CrossRef]
  25. Lin, H.; Luo, S.J.; Ying, F.T.; Shan, P.; Zou, W.Y.; Yi, H.M.; Zhu, C.; Ding, H.Z.; Deng, X.L.; Lin, L. A study on the perception of wireless headphone form design based on Kansei engineering. In Proceedings of the AHFE 2019 International Conference on Affective and Pleasurable Design, Washington, DC, USA, 24–28 July 2019; Advances in Affective and Pleasurable Design. Springer: Berlin/Heidelberg, Germany, 2020; pp. 369–380. [Google Scholar]
  26. Wu, J. A product styling design evaluation method based on multilayer perceptron genetic algorithm neural network algorithm. Comput. Intell. Neurosci. 2021, 2021, 2861292. [Google Scholar] [CrossRef]
  27. Hao, J.W.; Luo, S.L.; Pan, L.M. Computer-aided intelligent design using deep multi-objective cooperative optimization algorithm. Future Gener. Comput. Syst. 2021, 124, 49–53. [Google Scholar] [CrossRef]
  28. Xing, B.X.; Si, H.H.; Chen, J.B.; Ye, M.C.; Shi, L. Computational model for predicting user aesthetic preference for GUI using DCNNs. CCF Trans. Pervasive Comput. Interact. 2021, 3, 147–169. [Google Scholar] [CrossRef]
  29. Jing, Z.J.; Hui, Y.J.; Wei, M.Y.; Ren, P. Self-Adaptive Computational Aesthetic Evaluation of Chinese Ink Paintings Based on Deep Learning. J. Comput.-Aided Des. Comput. Graph. 2021, 33, 1349–1360. [Google Scholar]
  30. Saaty, R.W. The analytic hierarchy process—What it is and how it is used. Math. Model. 1987, 9, 161–176. [Google Scholar] [CrossRef]
  31. Saaty, T.L. Decision-making with the AHP: Why is the principal eigenvector necessary. Eur. J. Oper. Res. 2003, 145, 85–91. [Google Scholar] [CrossRef]
  32. Saaty, T.L. Theory and Applications of the Analytic Network Process: Decision Making with Benefits, Opportunities, Costs, and Risks; RWS Publications: Pittsburgh, PA, USA, 2005. [Google Scholar]
  33. Myeong, S.; Jung, Y.; Lee, E. A study on determinant factors in smart city development: An analytic hierarchy process analysis. Sustainability 2018, 10, 2606. [Google Scholar] [CrossRef]
  34. Canco, I.; Kruja, D.; Iancu, T. AHP, a reliable method for quality decision making: A case study in business. Sustainability 2021, 13, 13932. [Google Scholar] [CrossRef]
  35. Lyu, H.-M.; Shen, J.S.; Arulrajah, A. Assessment of geohazards and preventative countermeasures using AHP incorporated with GIS in Lanzhou, China. Sustainability 2018, 10, 304. [Google Scholar] [CrossRef]
  36. Kumar, S.S. AHP-Based Formal System for R&D Project Evaluation; CSIR: New Delhi, India, 2004. [Google Scholar]
  37. Ginting, R.; Ishak, A.; Syahda, A. Product design of post-stroke static bicycle. In IOP Conference Series: Materials Science and Engineering; IOP Publishing: Bristol, UK, 2020; p. 012009. [Google Scholar]
  38. Zhou, J.X.; Tan, S.C.; Li, J.; Xu, J.; Wang, C.; Ye, H. Landslide Susceptibility Assessment Using the Analytic Hierarchy Process (AHP): A Case Study of a Construction Site for Photovoltaic Power Generation in Yunxian County, Southwest China. Sustainability 2023, 15, 5281. [Google Scholar] [CrossRef]
  39. Uzoka, F.-M.E.; Ijatuyi, O. Decision support system for library acquisitions: A framework. Electron. Libr. 2005, 23, 453–462. [Google Scholar] [CrossRef]
  40. Dožić, S.; Babić, D.; Kalić, M.; Živojinović, S. An AHP approach to airport choice by freight forwarder. Sustain. Futures 2023, 5, 100106. [Google Scholar] [CrossRef]
  41. Veisi, H.; Deihimfard, R.; Shahmohammadi, A.; Hydarzadeh, Y. Application of the analytic hierarchy process (AHP) in a multi-criteria selection of agricultural irrigation systems. Agric. Water Manag. 2022, 267, 107619. [Google Scholar] [CrossRef]
  42. He, K.M.; Zhang, X.Y.; Ren, S.Q.; Sun, J. Deep residual learning for image recognition. In Proceedings of the IEEE Conference on Computer Vision and Pattern Recognition, Las Vegas, NV, USA, 30 June 2016; pp. 770–778. [Google Scholar]
  43. He, K.M.; Zhang, X.Y.; Ren, S.Q.; Sun, J. Identity mappings in deep residual networks. In Proceedings of the Computer Vision–ECCV 2016: 14th European Conference, Amsterdam, The Netherlands, 11–14 October 2016; Proceedings, Part IV 14. Springer: Berlin/Heidelberg, Germany, 2016; pp. 630–645. [Google Scholar]
  44. Xu, B.; Liu, R.; Shu, M.; Shang, X.; Wang, Y. An ECG denoising method based on the generative adversarial residual network. Comput. Math. Methods Med. 2021, 2021, 5527904. [Google Scholar] [CrossRef]
  45. Wang, F.; Jiang, M.; Qian, C.; Yang, S.; Li, C.; Zhang, H.; Wang, X.; Tang, X. Residual attention network for image classification. In Proceedings of the IEEE Conference on Computer Vision and Pattern Recognition, Honolulu, HI, USA, 21–26 July 2017; pp. 3156–3164. [Google Scholar]
  46. Mahmood, A.; Bennamoun, M.; An, S.; Sohel, F. Resfeats: Residual network based features for image classification. Proceeedings of the 2017 IEEE International Conference on Image Processing (ICIP), IEEE, Beijing, China, 17–20 September 2017; pp. 1597–1601. [Google Scholar]
  47. Sati, V.; Sánchez, S.M.; Shoeibi, N.; Arora, A.; Corchado, J.M. Face detection and recognition, face emotion recognition through NVIDIA Jetson Nano. In Ambient Intelligence–Software and Applications: 11th International Symposium on Ambient Intelligence; Springer: Berlin/Heidelberg, Germany, 2021; pp. 177–185. [Google Scholar]
  48. Xia, K.J.; Yin, H.S.; Zhang, Y.D. Deep semantic segmentation of kidney and space-occupying lesion area based on SCNN and ResNet models combined with SIFT-flow algorithm. J. Med. Syst. 2019, 43, 2. [Google Scholar] [CrossRef]
  49. Wen, L.; Li, X.Y.; Gao, L. A transfer convolutional neural network for fault diagnosis based on ResNet-50. Neural Comput. Appl. 2020, 32, 6111–6124. [Google Scholar] [CrossRef]
  50. Mahajan, A.; Chaudhary, S. Categorical image classification based on representational deep network (RESNET). In Proceedings of the 2019 3rd International conference on Electronics, Communication and Aerospace Technology (ICECA), IEEE, Coimbatore, India, 12–14 June 2019; pp. 327–330. [Google Scholar]
  51. Wu, J.F.; Xing, B.X.; Si, H.H.; Dou, J.; Wang, J.; Zhu, Y.N.; Liu, X.J. Product design award prediction modeling: Design visual aesthetic quality assessment via DCNNs. IEEE Access 2020, 8, 211028–211047. [Google Scholar] [CrossRef]
  52. Wang, Y.; Yu, S.; Chen, D.; Chu, J.; Liu, Z.; Wang, J.; Ma, N. Artificial intelligence design decision model based on deep learning. Comput. Integr. Manuf. Syst. 2019, 25, 2467–2475. [Google Scholar]
  53. Sarwinda, D.; Paradisa, R.H.; Bustamam, A.; Anggia, P. Deep learning in image classification using residual network (ResNet) variants for detection of colorectal cancer. Procedia Comput. Sci. 2021, 179, 423–431. [Google Scholar] [CrossRef]
  54. Li, B.; Lima, D. Facial expression recognition via ResNet-50. Int. J. Cogn. Comput. Eng. 2021, 2, 57–64. [Google Scholar] [CrossRef]
  55. Sankupellay, M.; Konovalov, D. In Bird call recognition using deep convolutional neural network, ResNet-50. In Proceedings of the ACOUSTICS, Adelaide, Australia, 7–9 November 2018; pp. 1–8. [Google Scholar]
  56. Sabanci, K. Benchmarking of CNN models and mobilenet-BiLSTM approach to classification of tomato seed cultivars. Sustainability 2023, 15, 4443. [Google Scholar] [CrossRef]
  57. Lin, Y.; Chi, W.; Sun, W.; Liu, S.; Fan, D. Human action recognition algorithm based on improved resnet and skeletal keypoints in single image. Math. Probl. Eng. 2020, 2020, 6954174. [Google Scholar] [CrossRef]
  58. Dewi, C.; Chen, R.-C. Combination of resnet and spatial pyramid pooling for musical instrument identification. Cybern. Inf. Technol. 2022, 22, 104–116. [Google Scholar] [CrossRef]
  59. Fulton, L.V.; Dolezel, D.; Harrop, J.; Yan, Y.; Fulton, C.P. Classification of Alzheimer’s disease with and without imagery using gradient boosted machines and ResNet-50. Brain Sci. 2019, 9, 212. [Google Scholar] [CrossRef]
  60. Wang, T.; Sun, W.; Min, X.K.; Lu, W.; Zhang, Z.C.; Zhai, G.T. A multi-dimensional aesthetic quality assessment model for mobile game images. In Proceedings of the 2021 International Conference on Visual Communications and Image Processing (VCIP), IEEE, Munich, Germany, 5–8 December 2021; pp. 1–5. [Google Scholar]
  61. Luo, S.J.; Lin, H.; Hu, Y.Q. Effects of taillight shape on conspicuity of vehicles at night. Appl. Ergon. 2021, 93, 103361. [Google Scholar] [CrossRef]
  62. Luo, S.J.; Lin, H.; Hu, Y.Q.; Fang, C. Preliminary study on the aesthetic preference for taillight shape design. Int. J. Ind. Ergon. 2022, 87, 103240. [Google Scholar] [CrossRef]
  63. Tobitani, K.; Katahira, K.N.K.; Nishijiam, K.; Nagata, N. Visibility Study on Design Pattern of Car Tail Lamp Using Perceptual Sensitivity on Face Recognition Abilities, FCV2016. In Proceedings of the 22nd Korea-Japan Joint Workshop on Frontiers of Computer Vision, Daegu, Republic of Korea, 22–23 February 2016. [Google Scholar]
  64. Tsutsumi, Y.; Maruyama, K. Long lighting system for enhanced conspicuity of motorcycles. JSAE Trans. 2008, 39, 119–124. [Google Scholar]
  65. Dumitrescu, A. The influence of visual complexity of figures and products on aesthetic preference. UPB Sci. Bull. 2017, 79, 151–162. [Google Scholar]
  66. Höfel, L.; Jacobsen, T. Electrophysiological indices of processing aesthetics: Spontaneous or intentional processes? Int. J. Psychophysiol. 2007, 65, 20–31. [Google Scholar] [CrossRef] [PubMed]
  67. Eisenman, R.; Gellens, H.K. Preferences for complexity-simplicity and symmetry-asymmetry. Percept. Mot. Ski. 1968, 26, 888–890. [Google Scholar] [CrossRef] [PubMed]
  68. Berlyne, D.E. Aesthetics and Psychobiology; Appleton-Century-Crofts: New York, NY, USA, 1971. [Google Scholar]
  69. Delplanque, J.; De Loof, E.; Janssens, C.; Verguts, T. The sound of beauty: How complexity determines aesthetic preference. Acta Psychol. 2019, 192, 146–152. [Google Scholar] [CrossRef] [PubMed]
  70. Nayak, B.K.; Karmakar, S. A Review of Eye Tracking Studies Related to Visual Aesthetic Experience: A Bottom-Up Approach. In Research into Design for a Connected World; Springer: Berlin/Heidelberg, Germany, 2019; pp. 391–403. [Google Scholar]
  71. Nicki, R.M. Arousal increment and degree of complexity as incentive. Br. J. Psychol. 1972, 63, 165–171. [Google Scholar] [CrossRef]
  72. Maffei, N.P. Both natural and mechanical: The streamlined designs of Norman Bel Geddes. J. Transp. Hist. 2009, 30, 141–167. [Google Scholar] [CrossRef]
  73. Englar, R.J. Advanced Aerodynamic Devices to Improve the Performance, Economics, Handling and Safety of Heavy Vehicles; SAE Technical Paper 0148-7191; SAE International: Warrendale, PA, USA, 2001. [Google Scholar]
  74. Wishnoebroto, W. Chevy Corvette: Icon of American Life in The Fifties. Ling. Cult. 2007, 1, 111–116. [Google Scholar] [CrossRef]
  75. Van Poolen, L.J. A Philosophical Perspective on Technological Design. Int. J. Appl. Eng. Educ. 1989, 5, 319–329. [Google Scholar]
  76. Pirsig, R.M. Zen and the Art of Motorcycle Maintenance: An Inquiry into Values; Quill: Rock Hill, SC, USA, 1999. [Google Scholar]
  77. Hutcheson, F. Francis Hutcheson: An Inquiry Concerning Beauty, Order, Harmony, Design; Springer Science & Business Media: Berlin/Heidelberg, Germany, 2012; Volume 9. [Google Scholar]
  78. Yu, R. Core Elements of IKEA’s Successful Product Design. J. Phys. Conf. Ser. 2019, 1168, 032118. [Google Scholar] [CrossRef]
  79. Hou, W.; Jiang, Z.; Liao, X. A New Method of Smartphone Appearance Evaluation Based on Kansei Engineering, Design, User Experience, and Usability. In Proceedings of the Design Philosophy and Theory: 8th International Conference, DUXU 2019, Held as Part of the 21st HCI International Conference, HCII 2019, Orlando, FL, USA, 26–31 July 2019; Proceedings, Part I 21. Springer: Berlin/Heidelberg, Germany; pp. 439–449. [Google Scholar]
  80. Cheng, X.; He, Z.; Liu, W.; Zhang, Z. Research on DNA Elements Extraction and Design of Mower Based on DFA and Eye Movement Experiment. In Proceedings of the 2019 9th International Conference on Education and Social Science (ICESS. 2019), Shenyang, China, 29–31 March 2019; pp. 931–936. [Google Scholar]
  81. Hsiao, K.-A.; Chen, L.-L. Fundamental dimensions of affective responses to product shapes. Int. J. Ind. Ergon. 2006, 36, 553–564. [Google Scholar] [CrossRef]
  82. Hung, W.-K.; Chen, L.-L. Effects of novelty and its dimensions on aesthetic preference in product design. Int. J. Des. 2012, 6, 81–90. [Google Scholar]
  83. Bloch, P.H. Seeking the ideal form: Product design and consumer response. J. Mark. 1995, 59, 16–29. [Google Scholar] [CrossRef]
  84. Balaji, A.; Bisht, D.S. Design Evaluation of Cars Taillights in India Based on Novelty and Typicality. In Innovative Product Design and Intelligent Manufacturing Systems; Springer: Berlin/Heidelberg, Germany, 2020; pp. 293–301. [Google Scholar]
  85. Crawford, G.; Williams, C. A note on the analysis of subjective judgment matrices. J. Math. Psychol. 1985, 29, 387–405. [Google Scholar] [CrossRef]
  86. Crawford, G. The geometric mean procedure for estimating the scale of a judgement matrix. Math. Model. 1987, 9, 327–334. [Google Scholar] [CrossRef]
  87. Donegan, H.; Dodd, F. A note on Saaty’s random indexes. Math. Comput. Model. 1991, 15, 135–137. [Google Scholar] [CrossRef]
  88. Bertram, D. Likert scales. Retrieved Novemb. 2007, 2, 1–10. [Google Scholar]
  89. Lin, H.; Deng, X.L.; Zhang, D.S. Taillight Shape Creative Design based on Generative Adversarial Networks. Comput.-Aided Des. Appl. 2023, 20, 1043–1060. [Google Scholar] [CrossRef]
  90. Hao, Y.; Yu, J.R.; Ying, Z. Bionic design features analysis of shared vehicle based on BP neural network. J. Mach. Des. 2019, 36, 125–129. [Google Scholar]
  91. Qin, Z.W. Evaluation of product model design based on BP neural network. Comput. Eng. Des. 2009, 30, 5715–5717+5721. [Google Scholar]
Figure 1. Residual learning module [44].
Sustainability 15 14538 g001
Figure 2. The structure of ResNet-50 network [57].
Sustainability 15 14538 g002
Figure 3. Partial tail-light shape design image dataset.
Sustainability 15 14538 g003
Figure 4. Process diagram of the model.
Sustainability 15 14538 g004
Figure 5. Architecture diagram of tail-light shape design evaluation model based on ResNet-50.
Sustainability 15 14538 g005
Figure 6. (a) MSE loss curve of tail-light shape design evaluation based on ResNet-50. (b) MSE loss curve of tail-light shape design evaluation based on VGG-16. (c) MSE loss curve of tail-light shape design evaluation based on AlexNet.
Sustainability 15 14538 g006
Figure 7. Comparative line chart of automatic design evaluation scores and manual design evaluation score.
Sustainability 15 14538 g007
Table 1. The relevant studies on design evaluation.
Design EvaluationIntroductionRelevant StudiesObject of StudySpecific Evaluation Method
Manual design evaluationConducted by human evaluators, who used their experience, skills, and expertise to assess a design.Ariffe et al. [21]Design conceptAnalytical hierarchy process (AHP)
Kapkın et al. [22]Product form designThinking aloud and subjective rating
Luo et al. [23]Beverage bottle designClassification task and a semantic differential (SD) experiment
Sonderegger and Sauer [24]Non-visual aesthetics in consumer productLikert scale
Lin et al. [25]Headphone designKansei engineering
Automatic design evaluationUse of computer-based algorithms and software tools to evaluate a design based on predefined criteria and standardsWu [26]Product shape designA multilayer perceptron genetic algorithm in a neural network (GA-MLP-NN)
Hao et al. [27]Industrial products and their design processesA novel quality-guided deep neural network and weighting scheme
Combination of manual and automatic evaluation Human evaluators performed the initial evaluation, and the results were then verified and validated by using computer-based algorithms.Xing et al. [28]Graphic user interfaceConstructed a dataset manually and proposed a GUI (graphic user interface) aesthetic evaluation model based on squeeze-and-excitation VGG19 network architecture.
Zhang et al. [29]Chinese ink paintingsConstructed a self-adaptive deep aesthetic model of Chinese ink paintings based on subject query mechanism
Table 2. Tail-light shape design criteria and their indicators.
Primary CriteriaIndicatorsEvaluation of Specific Indicators
Safety
(S)
The length of shape (S1)Evaluates whether the length of the tail-light shape is long
The closure of shape (S2)Evaluates whether the outline of the tail-light is closed
The visibility of shape (S3)Evaluates whether the overall shape (size, shape, etc.) of the tail-light can attract the attention of passengers
Aesthetics
(A)
The length of shape (A1)Evaluates whether the length of the tail-light shape is medium
Filling degree of pattern (A2)Evaluates whether the tail-light shape pattern has low filling degree (low filling, such as hollow; high filling, such as solid; medium filling, such as textured)
Streamline (A3)Evaluates whether the tail-light shape is streamlined
Complexity (A4)Evaluates whether the complexity of the tail-light shape is moderate
Harmony (A5)Evaluates whether the shape of the tail-light is harmonious
Exquisiteness (A6)Evaluates whether the shape of the tail-light is exquisite
Trendiness (A7)Evaluates whether the shape of the tail-light meets the aesthetic development trend of the times
Table 3. Scale for the determination matrix of tail-light design evaluation indicators.
Relative Importance Value (di/dj )Scale Meaning
1Indicator di is as important as indicator dj
3Indicator di is more important than indicator dj
5Indicator di is much more important than indicator dj
7Indicators di is strongly important compared to indicator dj
9Indicators di is absolutely important compared to indicator dj
2, 4, 6, 8Determine the importance level based on adjacent scale values
reciprocalIf the ratio of the importance of di to dj is dij, then the ratio of the importance of dj to di is dji = 1/dij
Table 4. Weight coefficient of each indicator in each layer.
LayerWeight Coefficient of Each Indicator
Goal layerSafetyAesthetic
0.79170.2083
Criterion layerLengthContour closureVisibility
0.19930.13280.6679
Indicator layerLengthFilling degreeStreamlineComplexityHarmonyExquisiteTrendy
0.04370.07930.10050.07620.29710.21080.1924
Table 6. Relative error results.
No.1234567
Sample number (random)1501150315051509151015221533
Training output value (automatic evaluation)4.333.253.784.393.054.174.68
Expected output value (manual evaluation)4.243.333.84.3434.144.6
Relative error (%)2.24%−2.61%−0.32%1.20%1.77%0.58%1.72%
Disclaimer/Publisher’s Note: The statements, opinions and data contained in all publications are solely those of the individual author(s) and contributor(s) and not of MDPI and/or the editor(s). MDPI and/or the editor(s) disclaim responsibility for any injury to people or property resulting from any ideas, methods, instructions or products referred to in the content.

