Article

Evaluating Compound Flooding Risks in Coastal Cities under Climate Change—The Maputo Case Study, in Mozambique

by
José Pedro Matos
1,
Filipa Ferreira
1,2,*,
Diogo Mendes
1 and
José Saldanha Matos
1,2
1
CERIS—Civil Engineering Research and Innovation for Sustainability, Instituto Superior Técnico, University of Lisbon, Av. Rovisco Pais 1, 1049-001 Lisboa, Portugal
2
HIDRA, Hidráulica e Ambiente Lda., Av. Defensores de Chaves, 31, 1º Esq., 1000-111 Lisboa, Portugal
*
Author to whom correspondence should be addressed.
Sustainability 2023, 15(19), 14497; https://doi.org/10.3390/su151914497
Submission received: 31 July 2023 / Revised: 26 September 2023 / Accepted: 29 September 2023 / Published: 5 October 2023
(This article belongs to the Section Sustainable Urban and Rural Development)

Abstract

:
Flooding is a truly ubiquitous problem. Today, it puts an estimated 1.81 billion people at risk. Floods particularly affect coastal cities, where it is expected that the damage associated with inundations exceed the staggering value of USD 50 billion by 2050. Indeed, the risk associated with flooding in coastal cities is increasing due to three unequivocal trends: growing population in large urban centres, sea level rise, and increased intensity of extreme weather events. Planning and implementation of storm drainage systems in large cities is a complex, long, and expensive process. Typically, the effective lifespan of storm drainage systems may extend to nearly a century. Accordingly, such systems should be designed for the future, not the present. Addressing these important challenges, the paper evaluates flood risks in the coastal city of Maputo, in Mozambique. Results show that, although downtown Maputo is not particularly exposed to compound flooding, accounting for rainfall-tide events is essential to understand flooding in the area and evaluating the performance of the storm drainage system.

1. Introduction

Floods are one of the main natural hazards affecting cities worldwide, with an estimated 1.81 billion people at risk [1,2]. With different frequency, depending on climatic conditions, topography, land cover and the capacity of stormwater drainage systems, low and/or flat areas of cities may be prone to inundations in the wake of intense rainfall events. Other concerns related with urban drainage in coastal tropical cities are associated with aging infrastructure and poor asset management [3], as well as odour and corrosion problems linked to long sewer systems and high temperatures [4]. Lack of proper maintenance and corrosion, which is also aggravated, particularly in combined systems, by the presence of saltwater, can affect sewers’ hydraulic capacity and worsen the overall performance of the system, namely during intense rain events.
The frequency and intensity of floods can be exacerbated in coastal cities, which may be additionally prone to flooding due to high sea water levels. Indeed, it is expected that the damages associated with floods in coastal cities exceed the staggering value of USD 50 billion by 2050 [2].
In certain cases, intense rainfalls and high sea levels combine, leading to extreme flooding. In such settings, floods associated with storm drainage systems can arise from the individual contributions or the combination of different hydrological and marine mechanisms, such as rainfall and sea levels [5]. When hazards occur simultaneously, the flood event can be defined as a compound flood. In such an event, the drainage capacity of the storm drainage system depends not only on the intensity, distribution, and duration of the rainfall event, but also on the timing between it and high tidal levels (i.e., rainfall-tide flood).
There are numerous examples of small rainfall events leading to substantial flooding when they coincide with high tidal levels (e.g., high-water level during spring tides). A telling example is the Town of Beaufort, in North Carolina, where 25% of the recorded flood events over a five-month period were driven by land-based mechanisms during moderate high-water tidal levels [6]. Typically, the calculation of the flood risk in coastal cities requires a combined assessment of the relevant mechanisms (e.g., [7,8]). In the present study, rainfall-tide floods are addressed.
Challenges associated with rainfall-tide floods are additionally linked to the effects of climate change [9]. Following the Intergovernmental Panel on Climate Change (IPCC), the mean sea level is expected to rise, and the rainfall events may become more intense in the upcoming decades (e.g., [10]). In this regard, the rise in the mean sea level will undoubtedly increase the flood risk in coastal cities. The combined effect of mean sea level rise and tidal levels can be merged into a full uncertainty statistical distribution instead of just summing up both contributions. This is particularly relevant because the IPCC mean sea level rise predictions are associated with confidence intervals. Therefore, a full uncertainty statistical distribution can be calculated based on the tidal level statistical distribution and a statistical distribution fitted to the mean sea level rise.
Combined flooding is a complex and multidisciplinary phenomenon, requiring the aggregation of concepts stemming from fields such as meteorology, hydrology, coastal engineering, urban drainage, hydraulics, and statistics—a list that is not exhaustive. To model the phenomenon comprehensively one must simulate:
  • Meteorological conditions, including rainfall, winds, and atmospheric pressure.
  • Coastal processes affecting sea level variations such as tidal levels, mean sea level rise and storm surges.
  • Rainfall-runoff processes, characterizing important phenomena such as infiltration, evaporation, and overland flow, that are necessary to estimate when and how much stormwater reaches the drainage systems.
  • The dynamic hydraulic behaviour of the flow within the storm drainage system, which becomes particularly important as backwater effects are caused or amplified by high sea levels.
  • The interaction between the underground flow in the storm drainage system and overland flow once flooding starts to occur.
Many studies refer to adaptation of urban drainage networks to climate change. Kourtis and Tsihrintzis [11] reviewed the main challenges regarding adaptation of urban drainage networks to climate change by comparing 32 case studies from articles published between 2003 and 2020. The majority (93%) of the studies used an integrated hydrologic–hydraulic approach, and 1D simulation of the urban drainage network was the most common (67%), while SWMM was the most widely used software.
In addition, evaluating flooding risks over large time periods may require the consideration of land subsidence issues (e.g., [12,13]).
Accounting for all these processes with detail is a difficult process with substantial computational requirements. Furthermore, to calibrate the simulations detailed meteorological, topographical, and bathymetrical data must be available.
If studies are undertaken with risk assessment in mind, the joint probability of combined high intensity rainfall and strong storm surges must be understood (e.g., [14]), as well as how those probabilities are being affected by climate change.
Compound flooding is not a problem associated with all coastal cities. Indeed, joint assessments are most interesting when effects of intense rainfall and high sea levels do not add up linearly but, when simultaneous, induce non-linear effects that significantly aggravate potential floods. Whether or not such non-linearities are relevant depends obviously on meteorology, sea conditions, but also on the topography of the shoreline and the design of the storm drainage system itself.
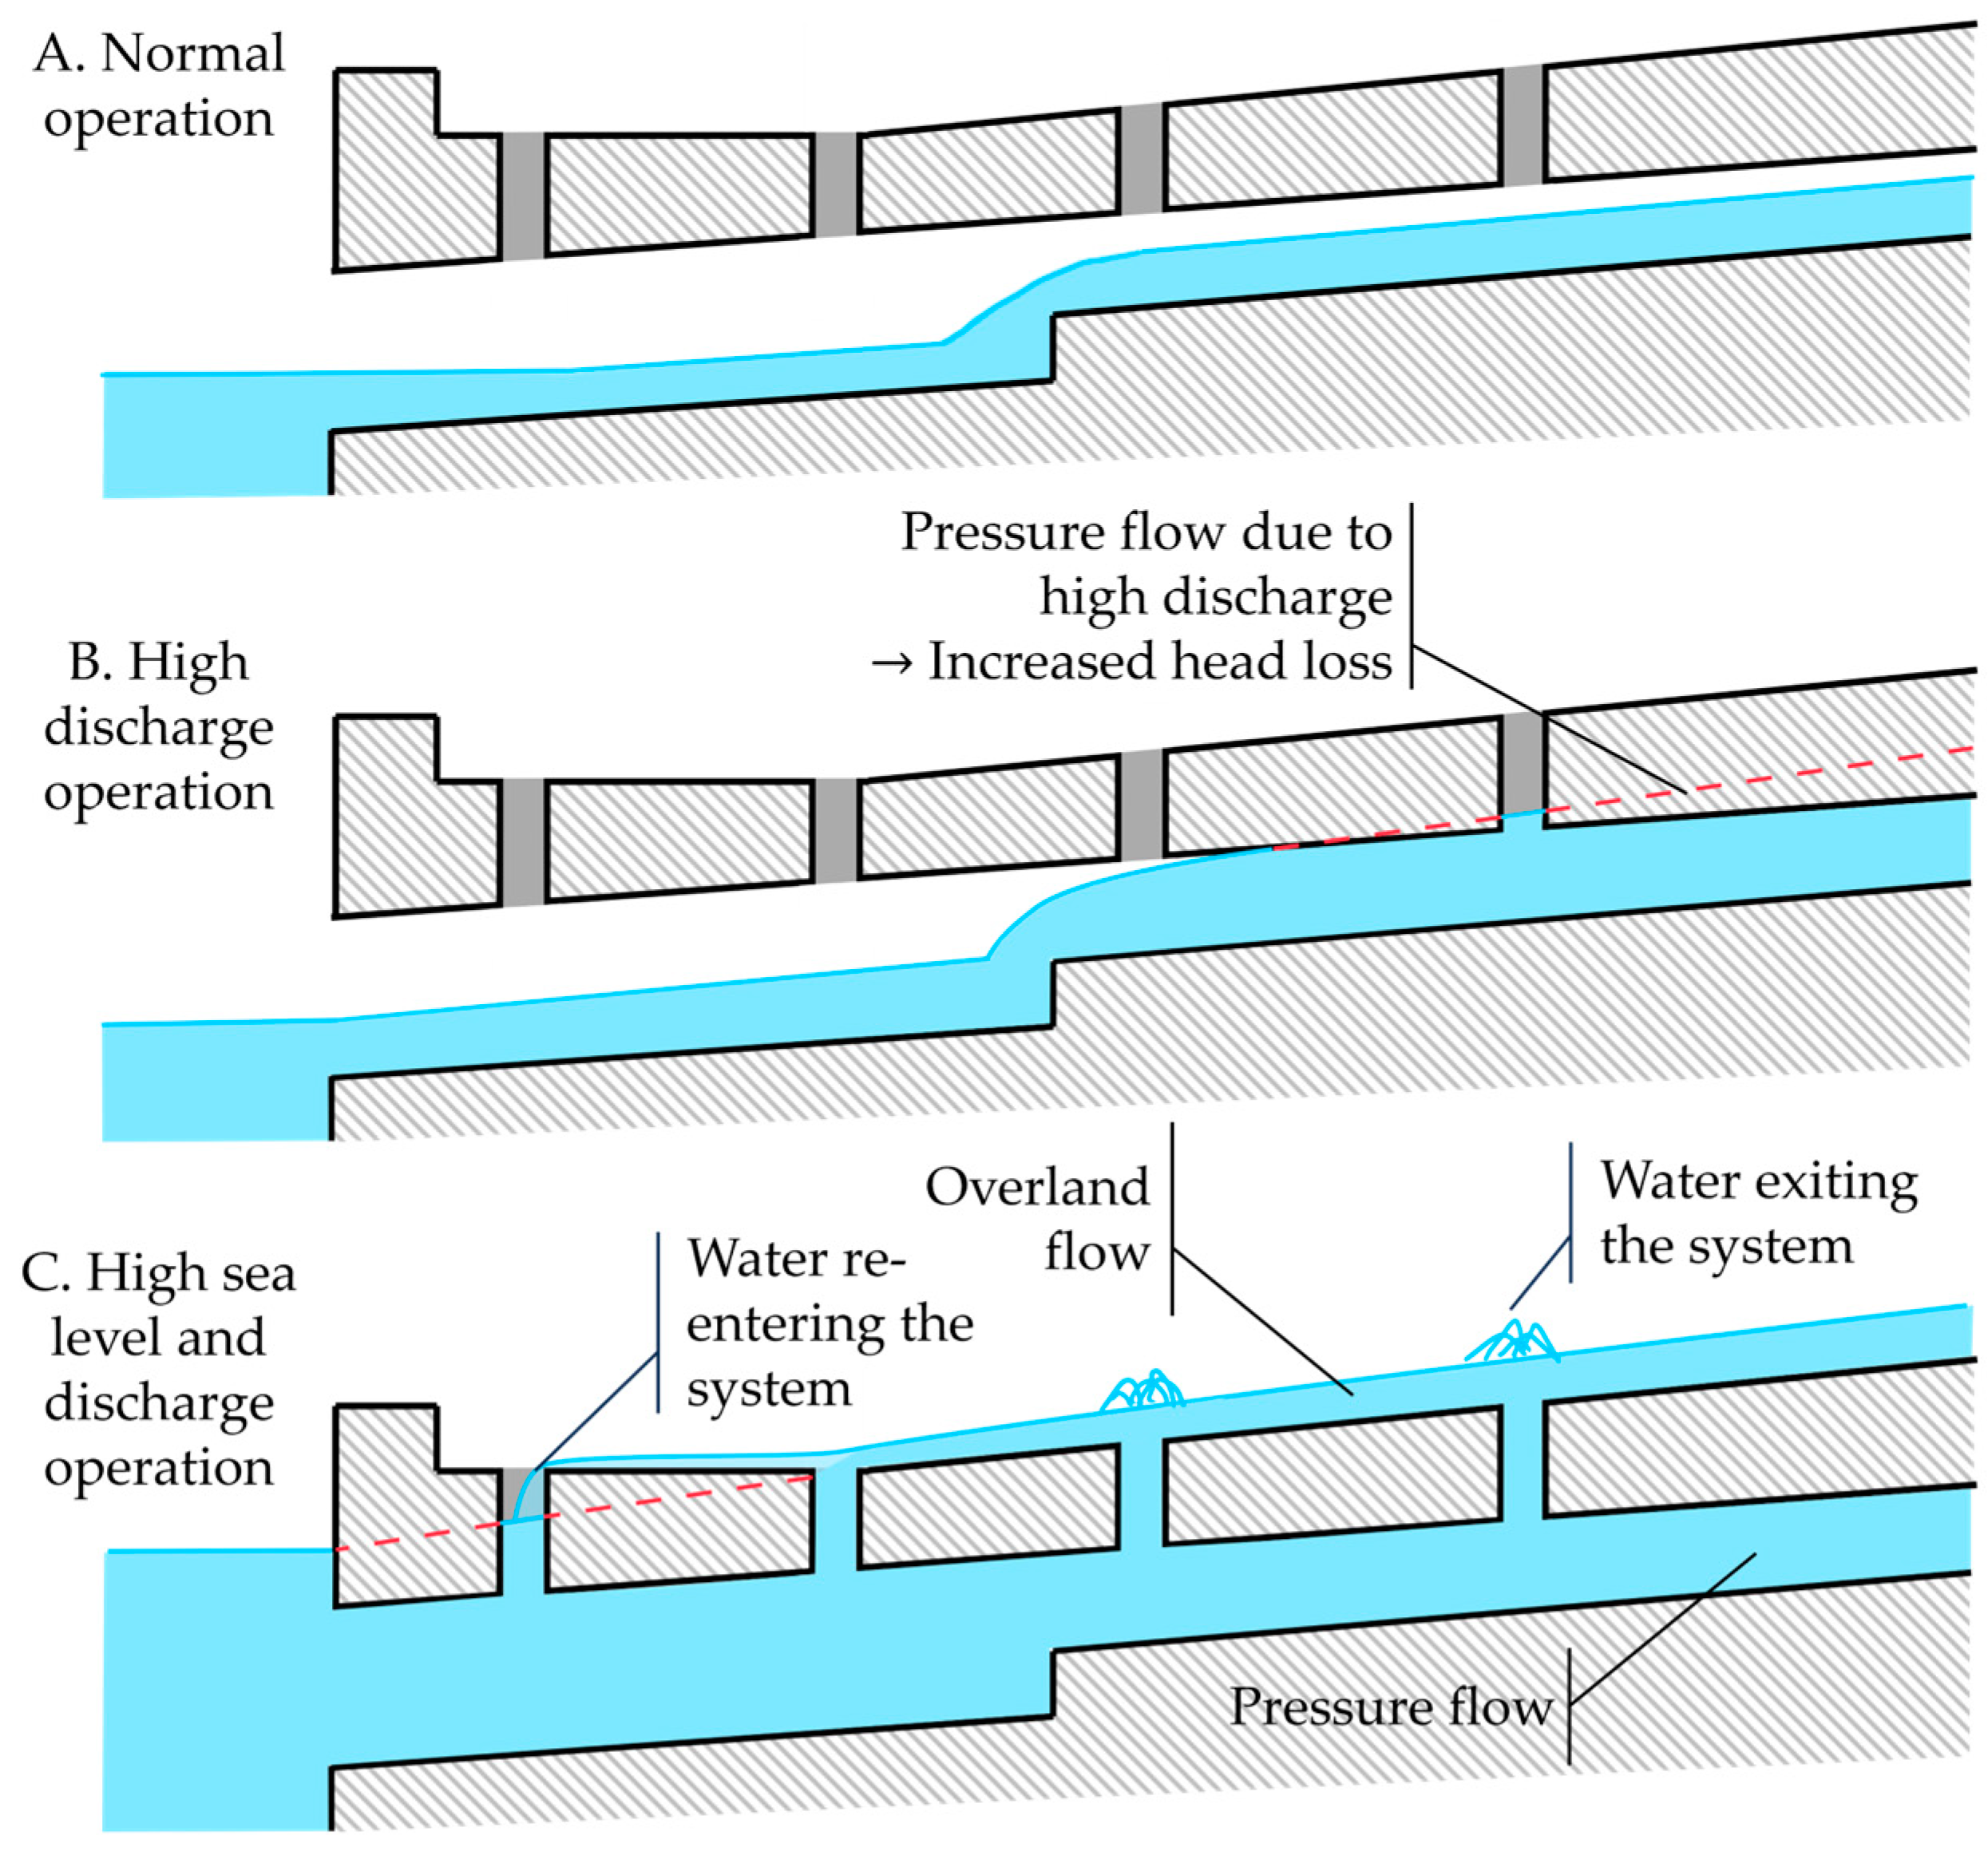
As hinted in Figure 1, flooding is associated with flow energy lines. It can occur due to lack of capacity of the drainage system independently of sea level conditions. When rainfall is excessive and the flow in the system becomes pressurized, head losses increase significantly, causing it to perform suboptimally (see the middle profile—B. High discharge operation—where flooding would eventually occur to the right of the figure independently of low sea levels). In the case of compound floods (see the bottom profile—C. High Sea level and discharge operation), high sea levels aggravate the situation, forcing the pressurization of the system to take place further downstream and, in so doing, augmenting head losses even further. In cases where the terrain elevation increases steeply, the energy line of the flow will quickly fall below the terrain, preventing compound floods altogether or, in the worst case, limiting them to areas of low elevation close to the shore.
Accordingly, compound flooding analyses are most relevant in low and flat areas exposed to strong sea level variations.
In this study, an assessment of the effect of rainfall-tide flood risk on the storm drainage system of Maputo coastal city, both at present and future climate change scenarios, will be undertaken following a full uncertainty approach. To the authors’ best knowledge, this study provides the first assessment of the rainfall-tide flood risk in this city.
The Municipality of Maputo, with the assistance of the World Bank, is implementing since 2021 the “Maputo Urban Transformation Project” (PTUM) [15]. The main objective of PTUM is to improve urban infrastructures and strengthen institutional capacity to promote sustainable urban development in the city. Within the scope of PTUM, a design project was developed for the improvement of the drainage system of the downtown area of Maputo (the so-called System 1), to significantly reduce flooding problems for design precipitations with a minimum return period of 10 years.
The underlying principle of the project is to create conditions for the existing system to function efficiently by reinforcing storm drainage infrastructures and building new pressurized flow storm sewers, which will drain stormwater from the upper part of the city directly into the bay. For 10-year return period events, the resulting piezometric lines will not be higher than 2 to 3 m. The execution of this project is expected to significantly mitigate the flood risks of Maputo city centre, both for present solicitations and under climate change scenarios.
In order to study the causes of flooding in the downtown of Maputo, including combined effects of rainfall and sea levels and the potential effect of climate change, numerical models of the existing and proposed stormwater drainage systems were tested under an extended range of combinations of rainfall intensity events and sea water levels. The followed methodology is in line with the integrated urban adaptation framework to climate change proposed by Kourtis and Tsihrintzis [11], as it considers climate change projections, expected urban development, hydrologic–hydraulic analysis, adaptation scenarios and flood risk assessment.
By dynamically simulating the systems under each combination, the flood risk profile of the area was determined. The intensity of flooding was represented as the integral of food volume over time.
Following this introduction, the study is divided into 4 additional sections. Section 2 presents the methodology in detail. Section 3 provides necessary information about the Maputo downtown case study. Results and discussion are expanded in Section 4. Finally, conclusions are drawn in Section 5.

2. Methodology

2.1. Preparation and Validation of a Dynamic Hydraulic Simulation Tool

SWMM is a United States Environmental Protection Agency open-source dynamic rainfall-runoff simulation model, used worldwide to analyse wastewater and stormwater systems’ performance [16]. The first version of SWMM was released in 1971, and it has been continually updated [17].
The simulation tool developed used the SWMM model and considered the main drainage infrastructures, namely sewers with a diameter greater than or equal to 400 mm. Two models were developed, representative of the current situation (with the existing infrastructures) and the future situation (after the rehabilitation of the drainage system is implemented).
In the absence of monitoring data, the model was validated by the comparison of model results with recorded observations of past events, namely with the flood heights reported through surveys performed in 2022 to entities based in the downtown area of Maputo.
A 1D model approach was deemed adequate for the performed analysis and therefore no overland flow was used. Although conservative (overland flow will typically provide an alternative route for water to reach parts of the system that are not operating at full capacity and, therefore, reducing overall flooding), the lack of an overland flow model hinders efforts to estimate flooded areas and water elevations precisely.

2.2. Simulation Conditions

The simulations carried out in the scope of this study were simplified in relation to the state-of-the-art in the risk assessment of compound floods. This was necessary due to lack of information available to simulate such events in Maputo and deemed acceptable because the focus of the work is the design of storm drainage systems, infrastructures that are expected to overflow during exceptional storms (they are associated with moderate design return periods, in the range of 5 to 25 years). The simulations were based on two SWMM models developed (see the previous section).
Numerical models of the existing and improved storm drainage systems for Maputo were tested under two scenarios: a reference scenario that reproduces present conditions of rainfall events and sea level variability and a future scenario that incorporates possible climate change effects.
Rainfall events were characterized according to intensity–duration–frequency curves published for Maputo. To characterize rainfall, the duration of the event and the shape of the corresponding hyetograph are important. In a simplification, a duration of 60 min and a generic design hydrograph were used. The probability distribution of sea levels was based on astronomical tides, neglecting storm surge effects. Furthermore, sea level variations during the event were not considered, being that the sea level remains static during each simulation.
Information about the possible magnitude of storm surges is important to frame the analysis, as the range of tested sea level conditions should encompass reasonable combinations of sea level rise due to climate change, tidal variability, and storm surge contributions.
It should be expected that rainfall and storm surges are correlated to some degree in Maputo. Information about that correlation is lacking, however, which renders the inclusion of storm surge in the analysis uninformative (without a valid means to assess the joint probability of extreme rainfall and storm surges, assuming the hazards are independent results in very low probabilities of occurrence that do not affect overall risk significantly).

2.3. Evaluation of Results

In the case of combined floods, high sea water levels may contribute to flooding in several ways, namely:
  • Direct flooding of areas below sea level.
  • Reduction in the available sections of the drainage system in low areas, causing stormwater overflows.
  • Increase in the water level in the system, leading to a reduction in hydraulic radius, the establishment of pressurized flow in some sections, and the increase in head losses.
Typically, low and relatively flat areas close to the sea can become flooded when extreme rainfalls are combined with high sea levels, which results not only in part of the stormwater drained at higher elevations exiting the system through interception devices and manholes, but also in the permanence of that water above the ground until both sea level and rainfall decrease. In the analysis of this type of system it makes sense to analyse flooding not only from the perspective of how much water exits the system, but also accounting for how long that water remains above ground. Accordingly, and as mentioned previously, this study models the intensity of flooding as the integral of flooded volume over time.

3. Case Study

3.1. The Maputo Downtown Drainage System

Maputo, the capital of Mozambique, is located near the southern end of the country (Figure 2). The city has a population of over 1 million inhabitants (information from the Mozambican National Institute of Statistics—INE, 2017) distributed over a land area of 348 km2.
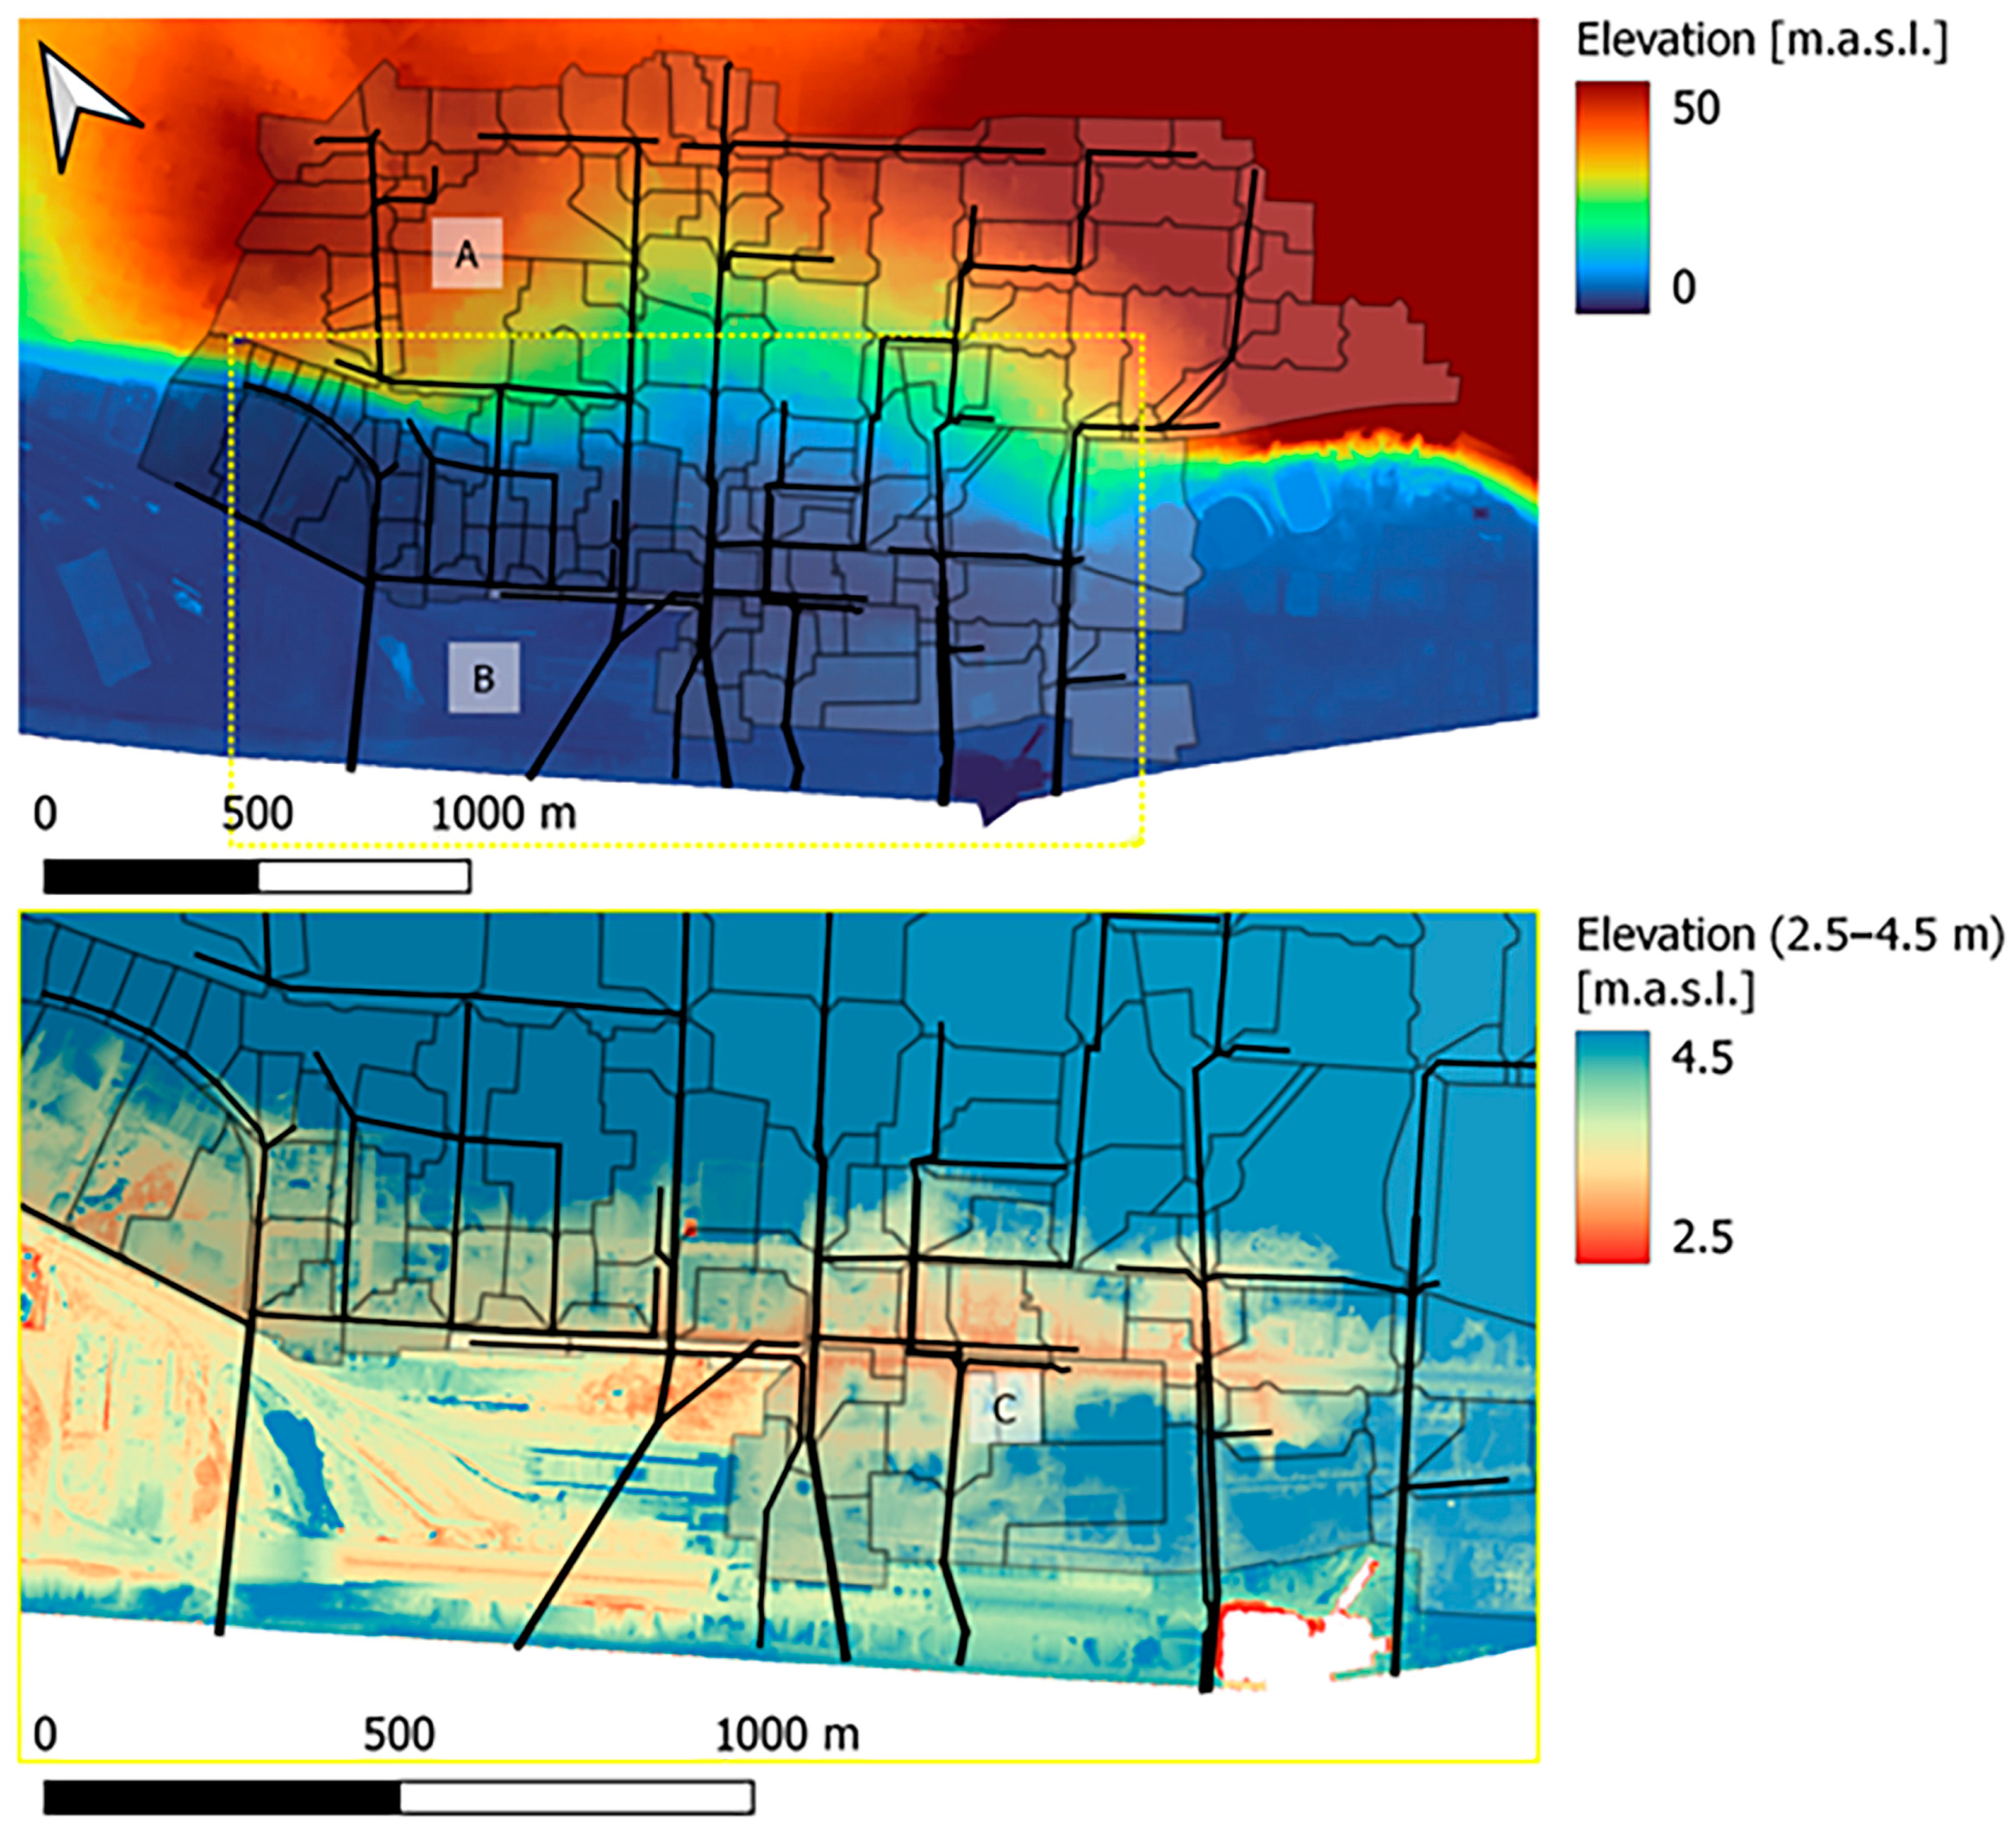
The drainage and sanitation system of Maputo had its genesis in the late 1940s: its construction began in the lower part of the city, the city centre, and evolved to the upper and newer urban areas. Presently, the system includes 206 km of sewers with diameters between 200 and 3000 mm. The lower part of the city (downtown), and historic centre of Maputo, is served by the so-called “System 1”, which covers an area of about 6.55 km2. Additional sewer systems of other peri urban areas of Maputo (i.e., the so-called systems 2, 3, and 4) were not included in this study. System 1, the more consolidated in the city, serves the city centre and is mostly combined. It includes 96 km of sewers. As shown in Figure 3, the lower part of the city (B) presents a relatively flat topography (the terrain varies between 3 and 5 m above mean sea level) and develops along Av. 25 de Setembro, for approximately 3 km. At the shoreline, the terrain elevation is over 4 m, about 1 m higher than at the lower parts of Av. 25 Setembro (C) that consequently benefit from some protection from direct flooding from the sea. The higher urban areas are located at elevations up to 40 and 50 m (A).
The operational, structural, and hydraulic performance problems of System 1 are known and have been reported in previous studies [15,18]. During rainfall events, the majority of runoff from the upper part of the city does not enter the drainage network, and flows superficially to the streets of downtown Maputo, accumulating in the low elevation area of Av. 25 de Setembro. This area is, therefore, frequently flooded.
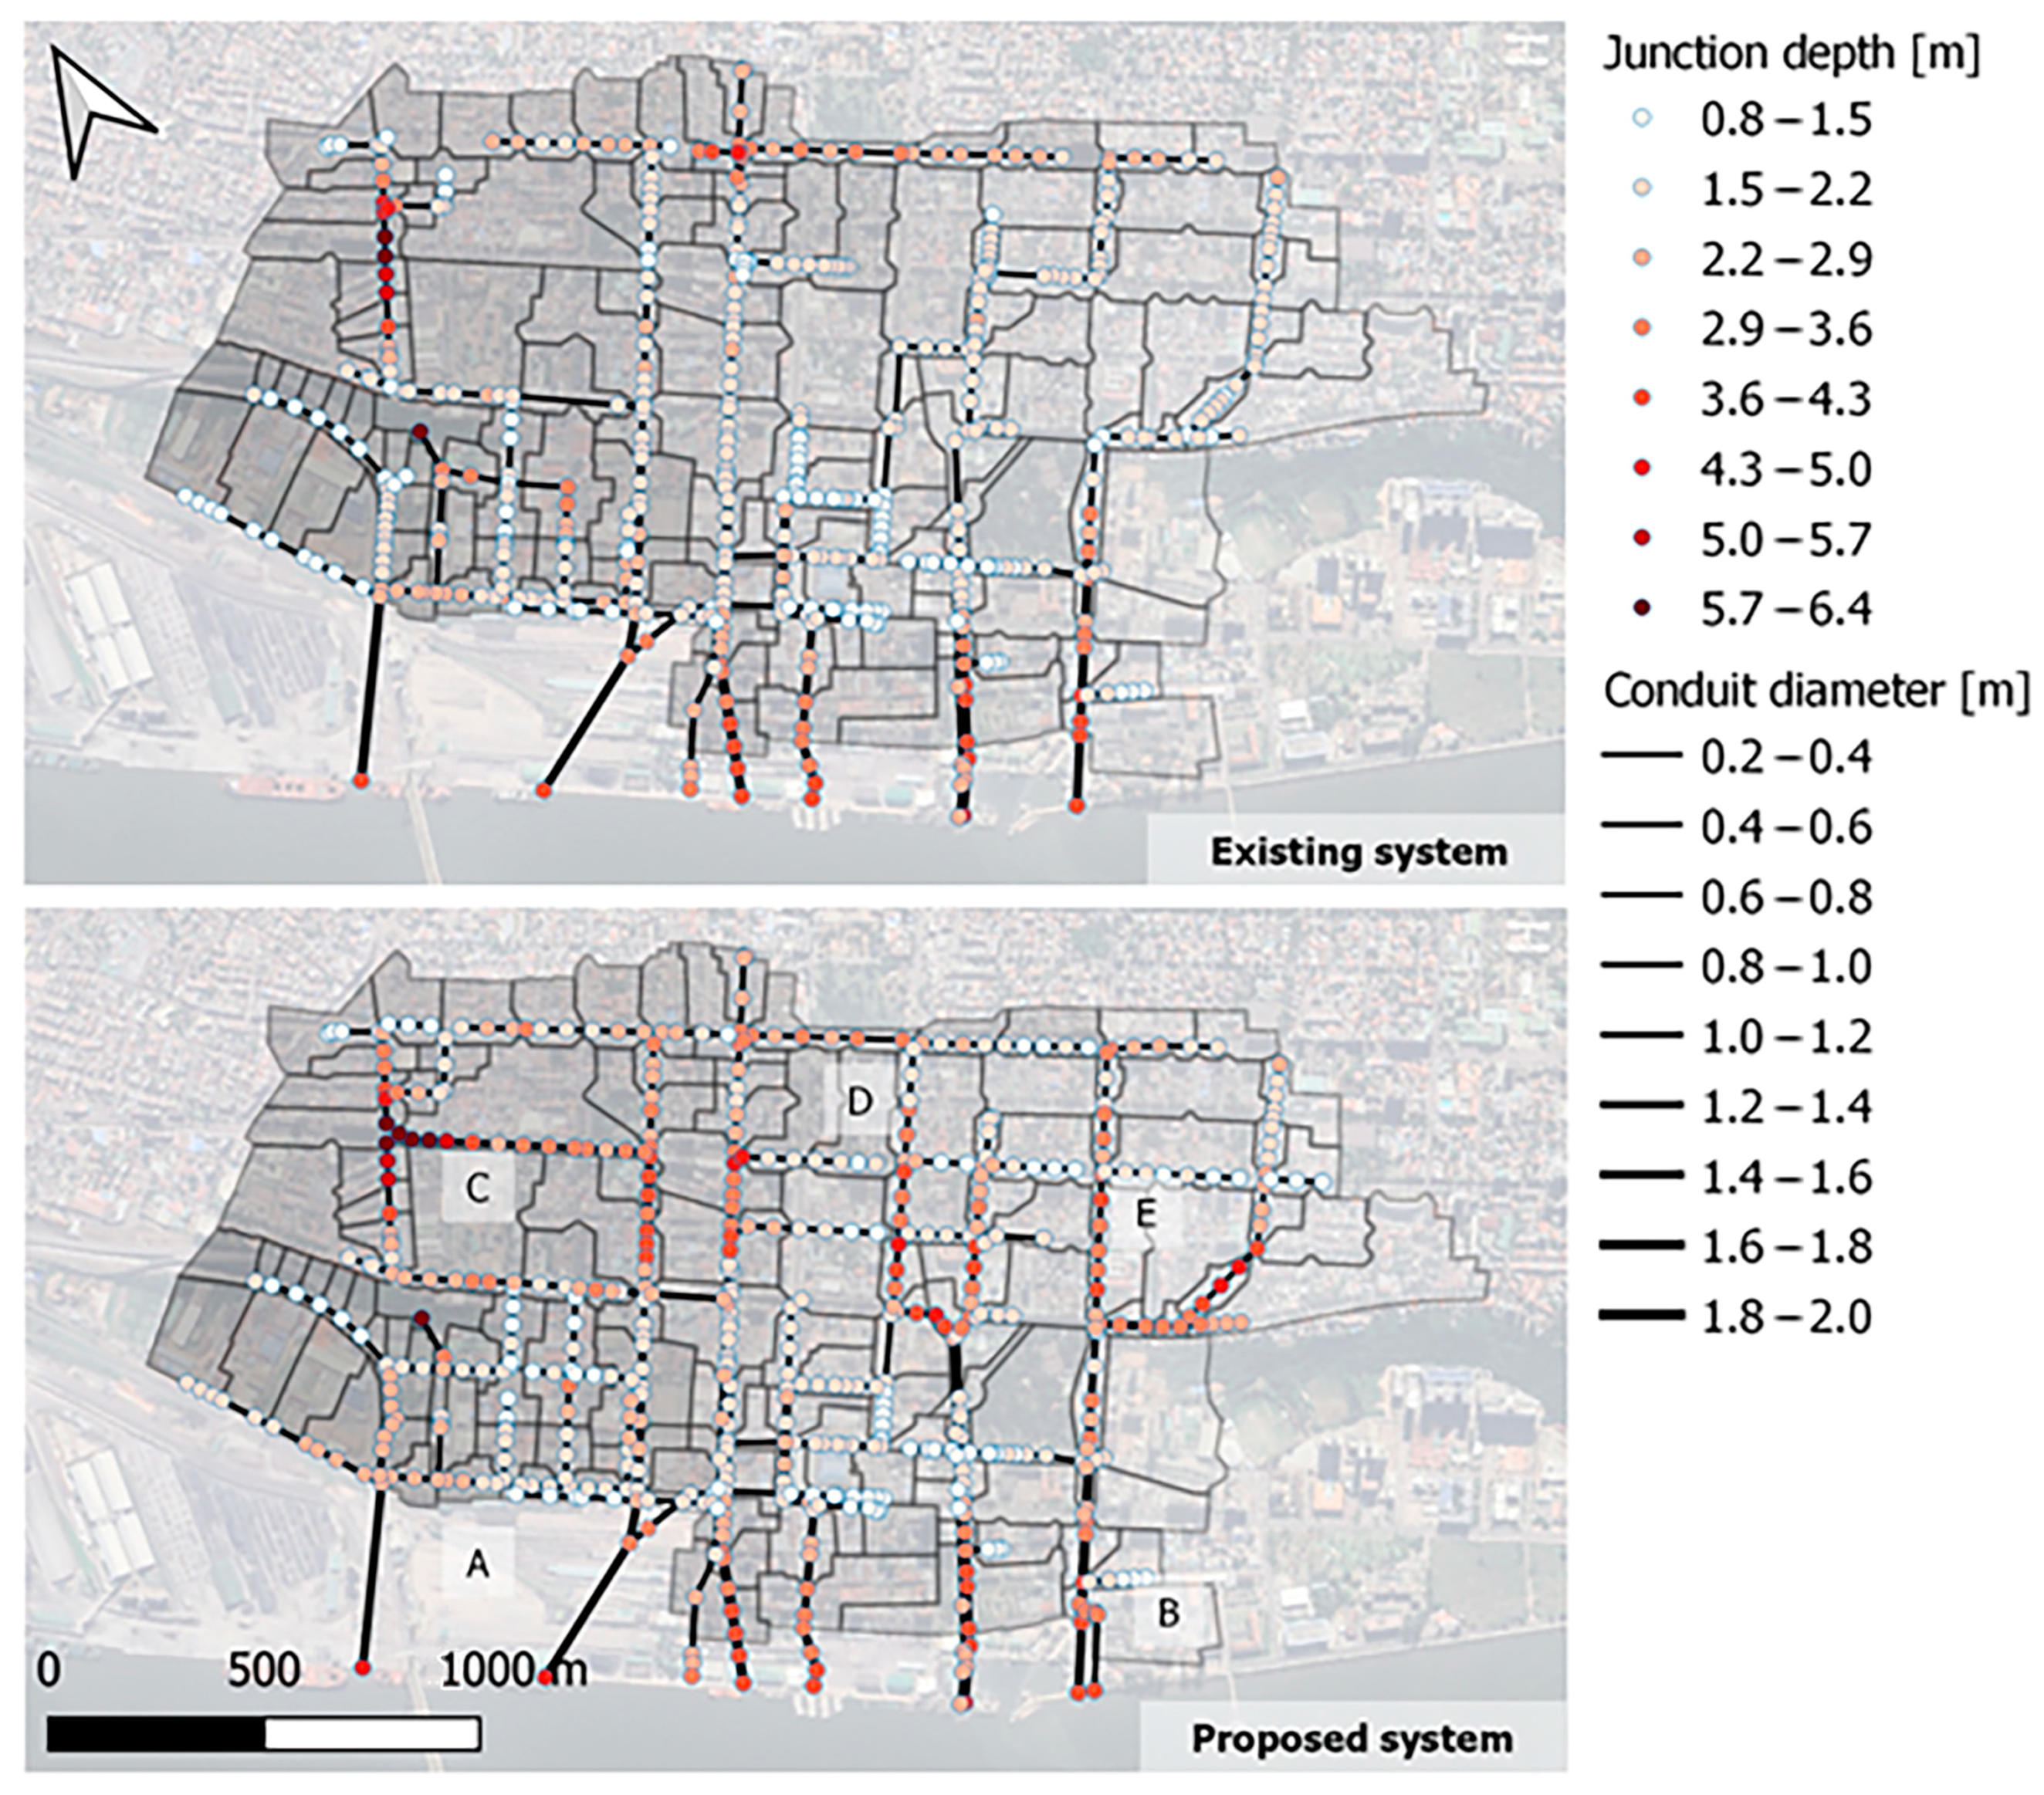
The existing combined sewer system comprises exclusively open flow gravity sewers, a significant part of which with insufficient hydraulic capacity to drain stormwater originated by 2 to 5-year return period events. The number and capacity of inlet gutters are also quite limited. In the flat downtown areas, existing sewers are usually partially clogged with sand and other sediments (i.e., do not present self-cleansing conditions). Flooding events are frequent and have serious impacts on people, leading also to significant material loss. Consequently, rehabilitation of the system was considered urgent, and a detailed project was developed. [19]. Figure 4 offers a schematic view of the existing and proposed systems for the study area. The approved solution foresees, as priority interventions, the construction/replacement of 12.1 km of stormwater pipes (e.g., B, C, D, and E), with diameters from 400 to 1500 mm, and the significant reinforcement of the interception devices (i.e., large gutters). The stormwater from the upper part of the city will be diverted directly to the Maputo Bay through three new pressurized flow storm sewers, with variable sections and a total length of 2.5 km (A). At the start of the pressurized sewers, overflow chambers will be executed. The design also includes the implementation of source control solutions, namely infiltration trenches, consisting of 10 m long and 1 to 2 m wide modules, on Av. 24 de Julho, Av. Ahmed Sekou Touré, and Av. Eduardo Mondlane. In the future, online storage tanks are also foreseen. Not neglecting serviceability, the project also included an operation and maintenance manual promoting regular inspections and cleaning operations, emphasizing actions in critical reaches. The concretization of this project will significantly mitigate the flooding risks in the downtown area of Maputo, improving the quality of life and the safety of goods and people [13].
In the numerous discussions had with the municipality and other stakeholders, Maputo’s downtown area land subsidence was never flagged as a problem or cause for concern. Resorting to global datasets, the broad area where Maputo lies even shows a rising tendency [13]. Accordingly, this analysis did not take subsidence effects into account.

3.2. Data

3.2.1. Precipitation during Storm Events

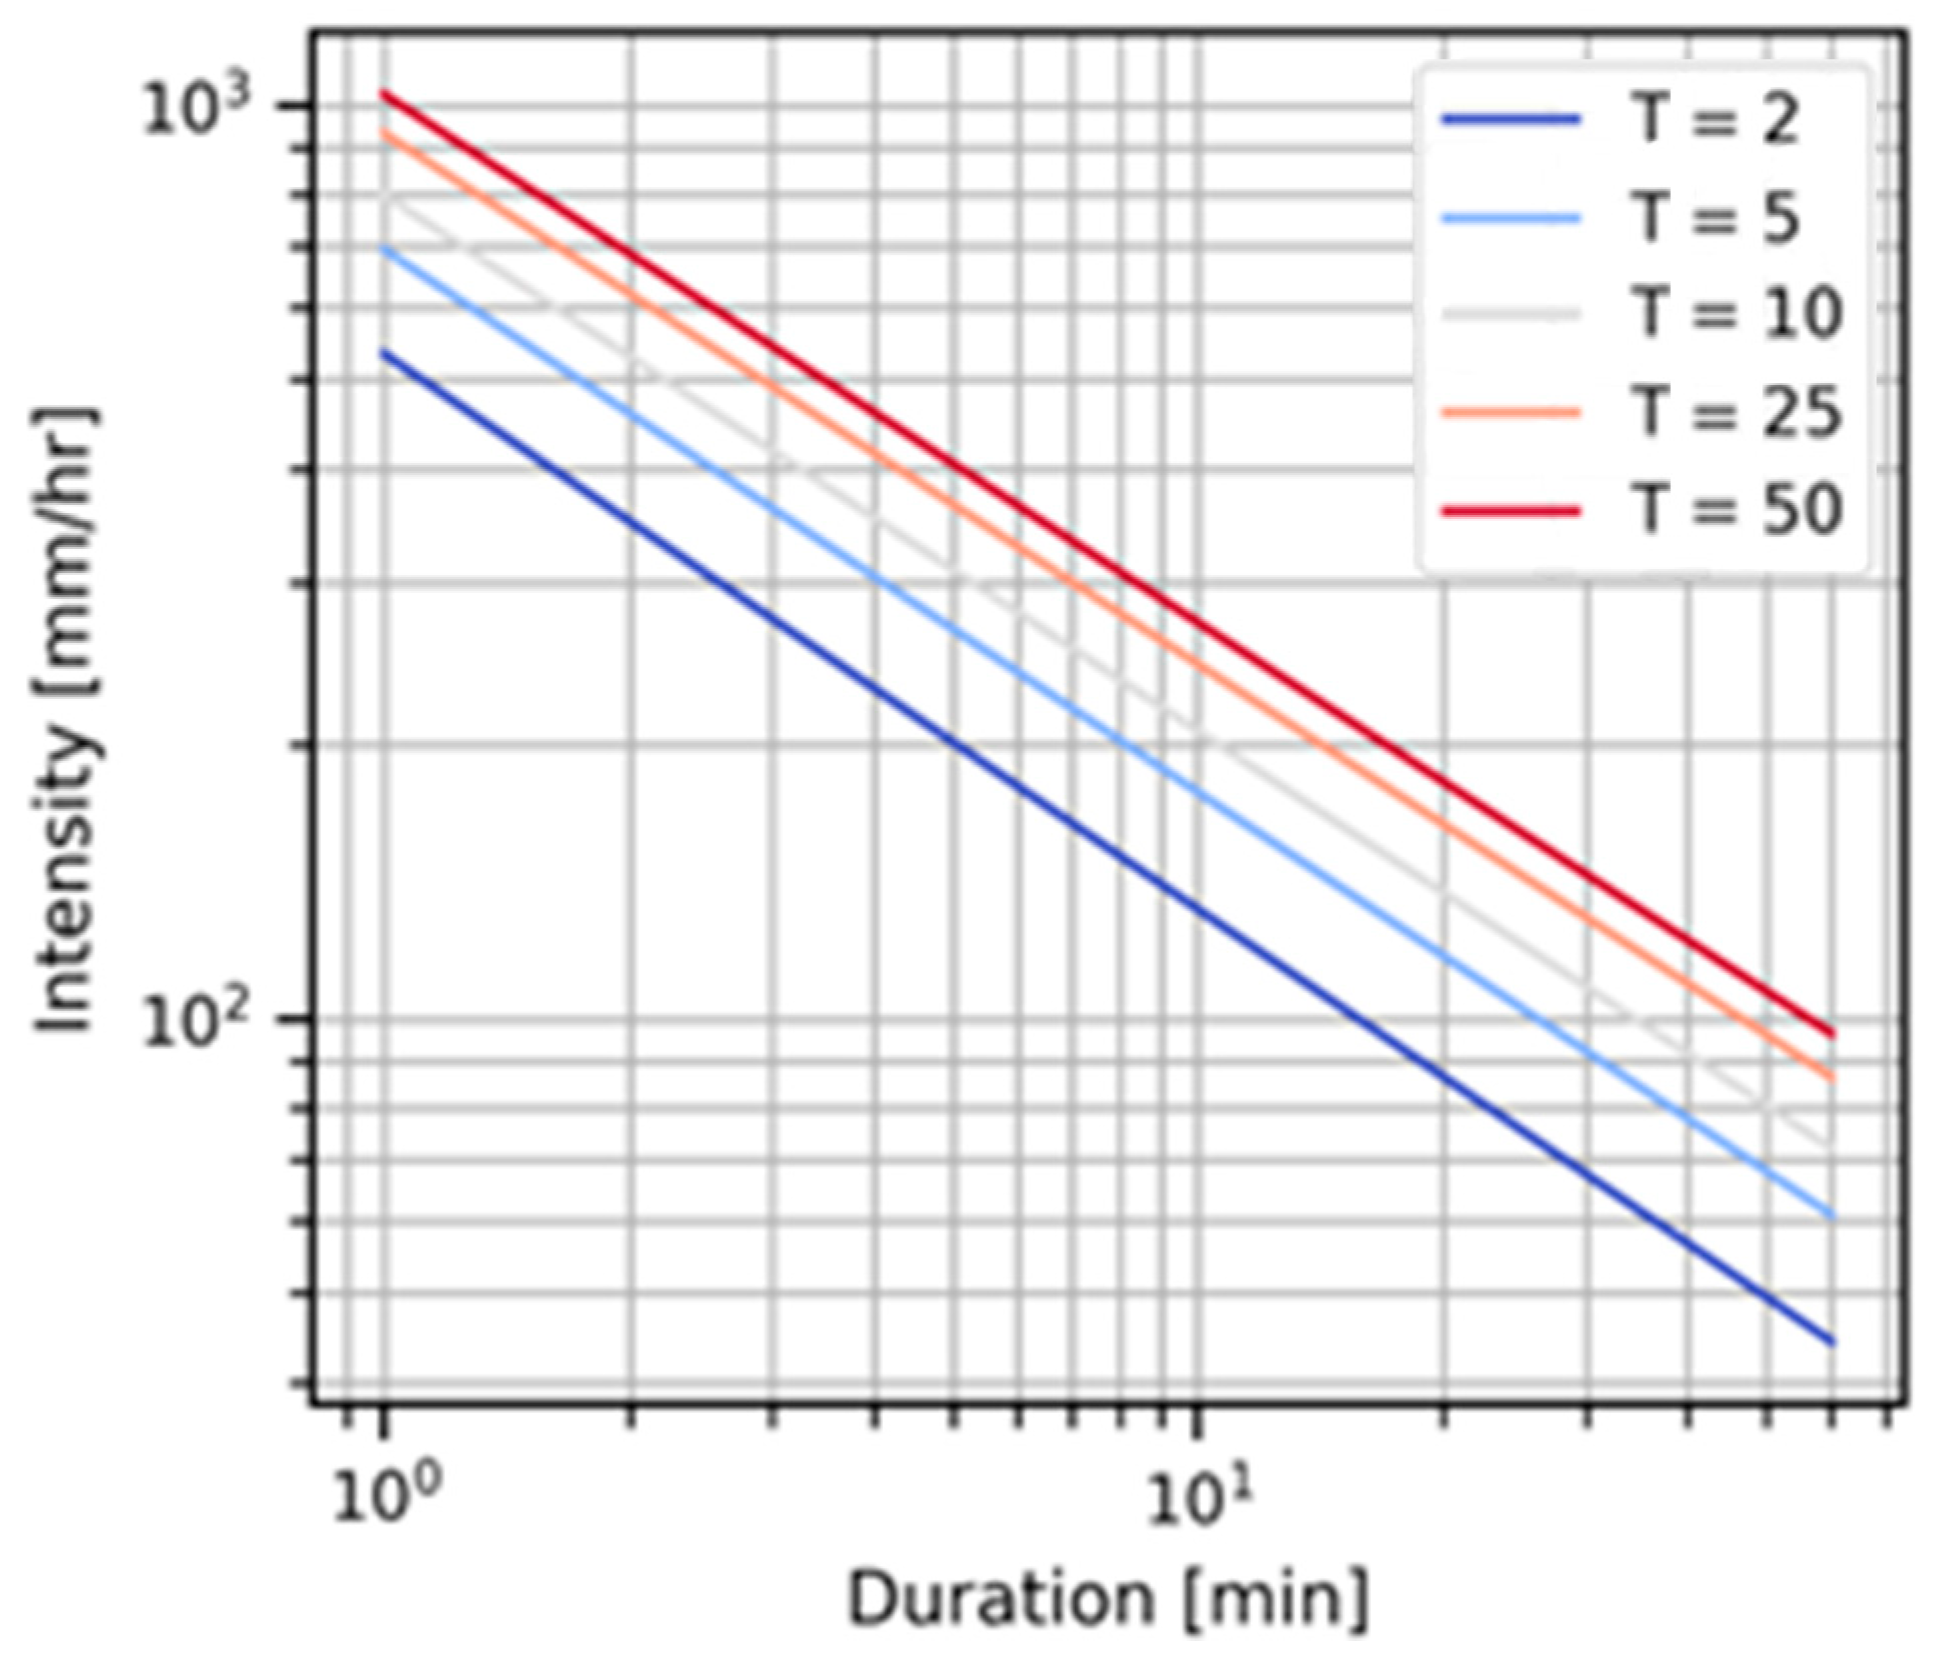
The intensity–duration–frequency (I-D-F) curves for Maputo region used in this study were adapted from Mozambican legislation, namely from Decree-Law no. 30/2003, and are presented in Figure 5. They follow a standard I-D-F formulation, i = a · t b , where i [mm/h] represents average rainfall intensity during the event, t [min] is the duration of the event, and a and b are coefficients. They are presented in Table 1 for several return periods.
The duration of the tested events was always equal to 1 h, with the adopted hyetograph consisting of a central 30 min block of uniform intensity sided by two triangular “limbs” of matching rainfall depth. The central and side blocks were built to agree with the chosen I-D-F for durations of 30 min and 1 h. The design hyetograph is presented in Figure 6.
Rainfall events with return periods ( T ) from 2 years to 100 years were analysed (only results up to 50 years are presented). I-D-F curves for return periods non included in Table 1 were obtained resorting to a logarithmic regression, relating ln T with l n ( i ) for every duration up to 1 h.

3.2.2. Sea Levels

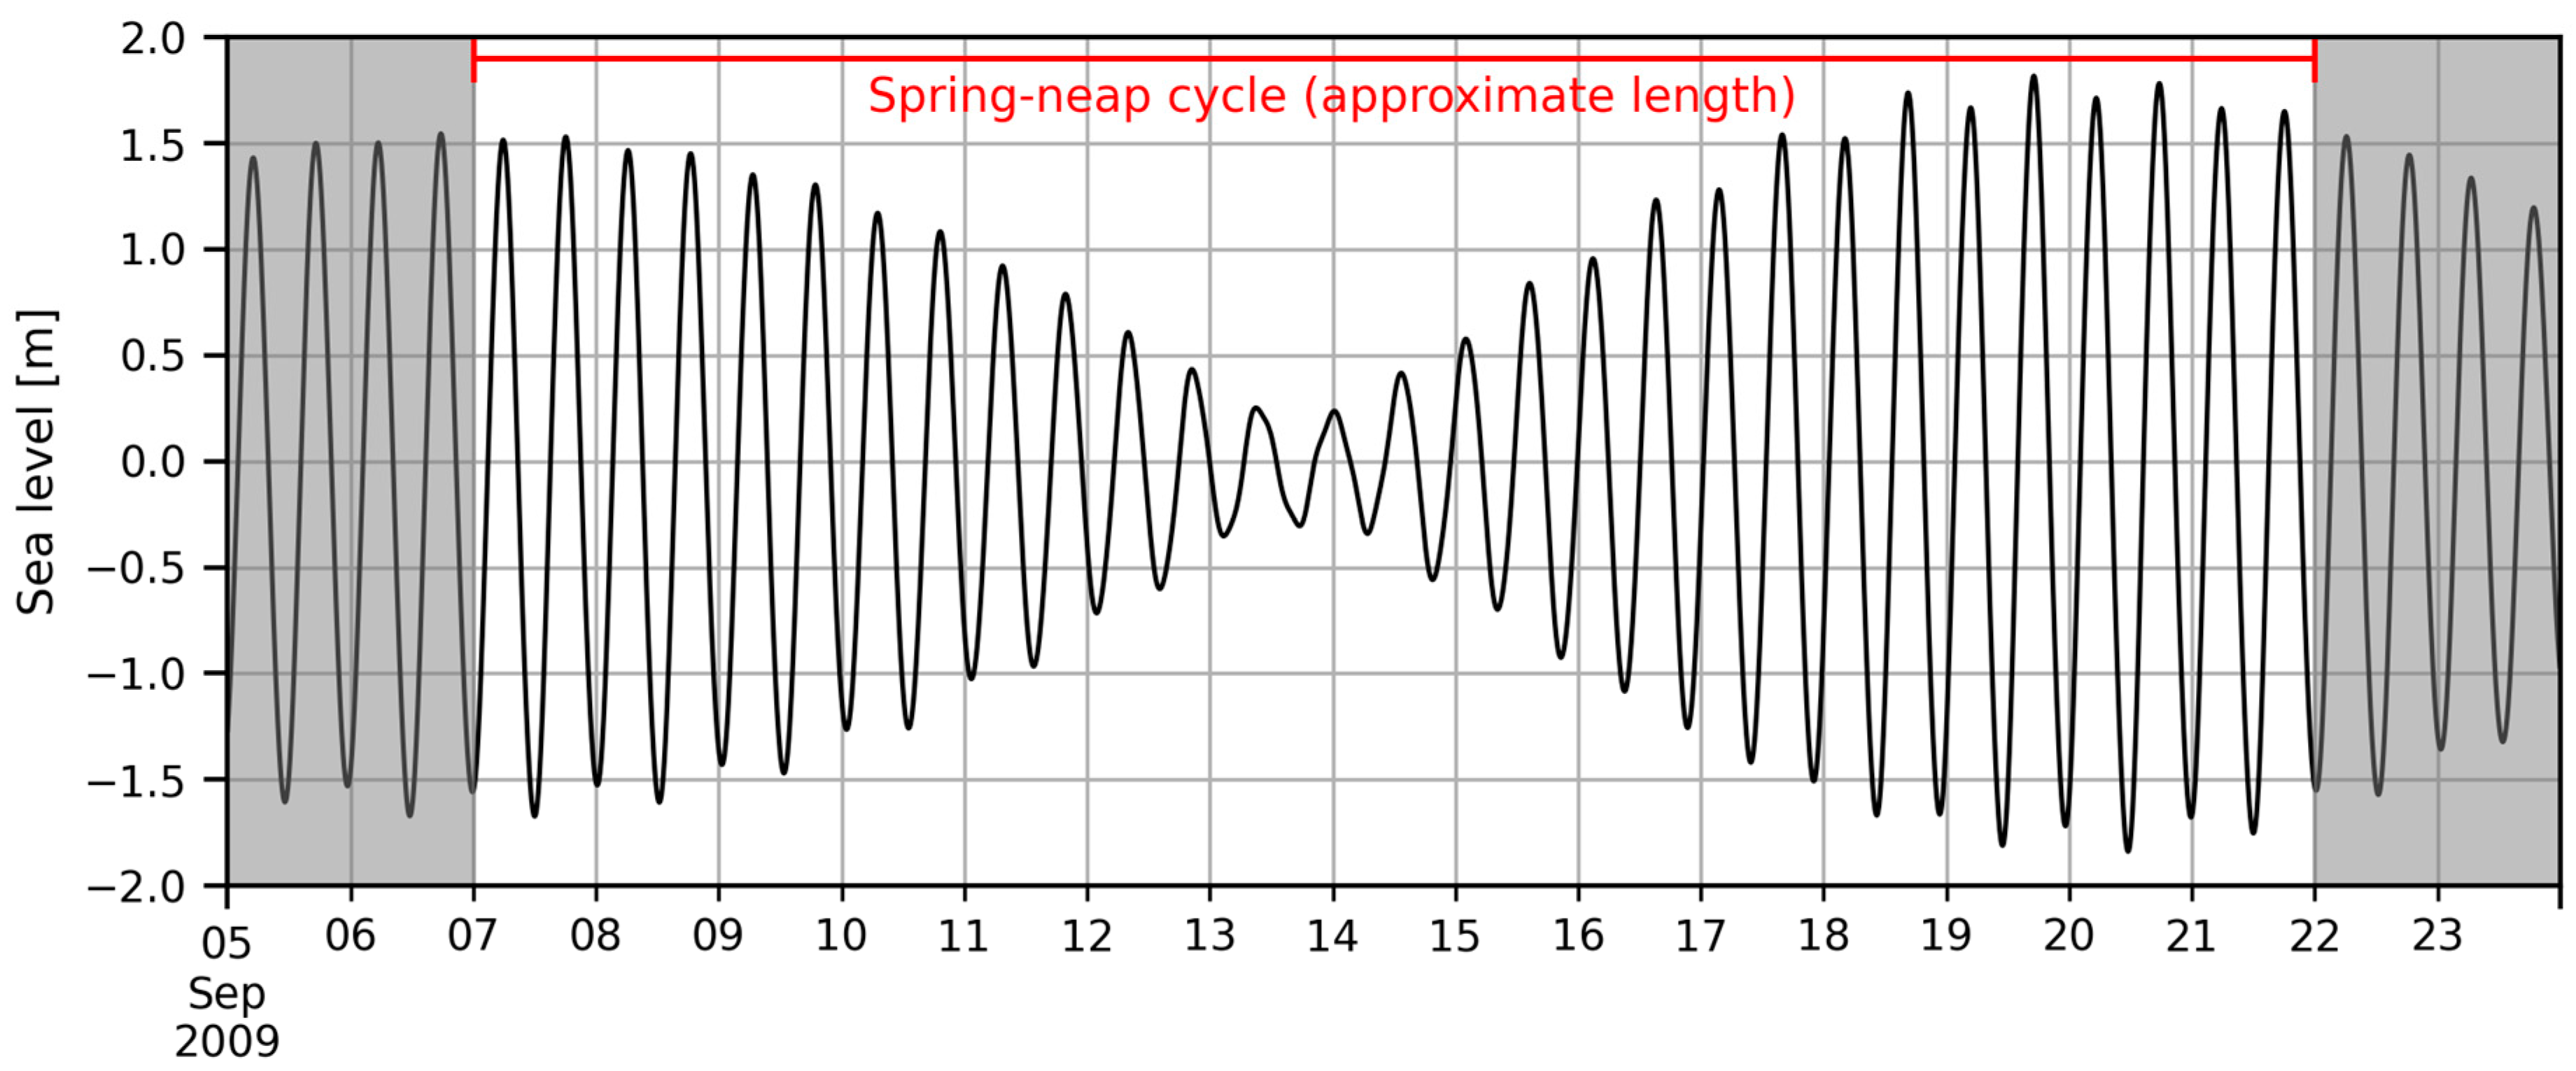
The time series of astronomical tide was obtained using the tidal information available from the Delft Dashboard open-source program [20]. This information was based on a harmonic tidal analysis to calculate the amplitude and phase of tidal constituents provided by the International Hydrographic Organization. The astronomical tide at Maputo was taken from Delft Dashboard between 1 January 1990 and 1 January 2023 with a time resolution of 6 min. Figure 7 illustrates the spring–neap cycle. The tidal regime is semi-diurnal and mesotidal. Maximum astronomical tidal range changes between −2 m and 2 m around mean sea level during spring tides. During neap tides, the tidal range changes between −0.5 m and 0.5 m.
Information about storm surges in Maputo is limited and access to observed data is difficult. In Neumann et al. [21], probabilities associated with storm surges in Maputo have been published, classifying a 1 m surge as “very rare” (return period in the order of 30 years).

3.3. Description of Future Scenarios under Climate Change

3.3.1. Expected Evolution of Mean Sea Level

The expected rise in the mean sea level in future was obtained from the last IPCC report through the NASA Sea Level Projection Tool (https://sealevel.nasa.gov/, accessed on 26 July 2023). The closest available station from Maputo was Zanzibar. At the latter location, the mean sea level is expected to rise 0.72 m (0.80 m) under the SSP3-7.0 (SSP5-8.5) scenarios in 2100.
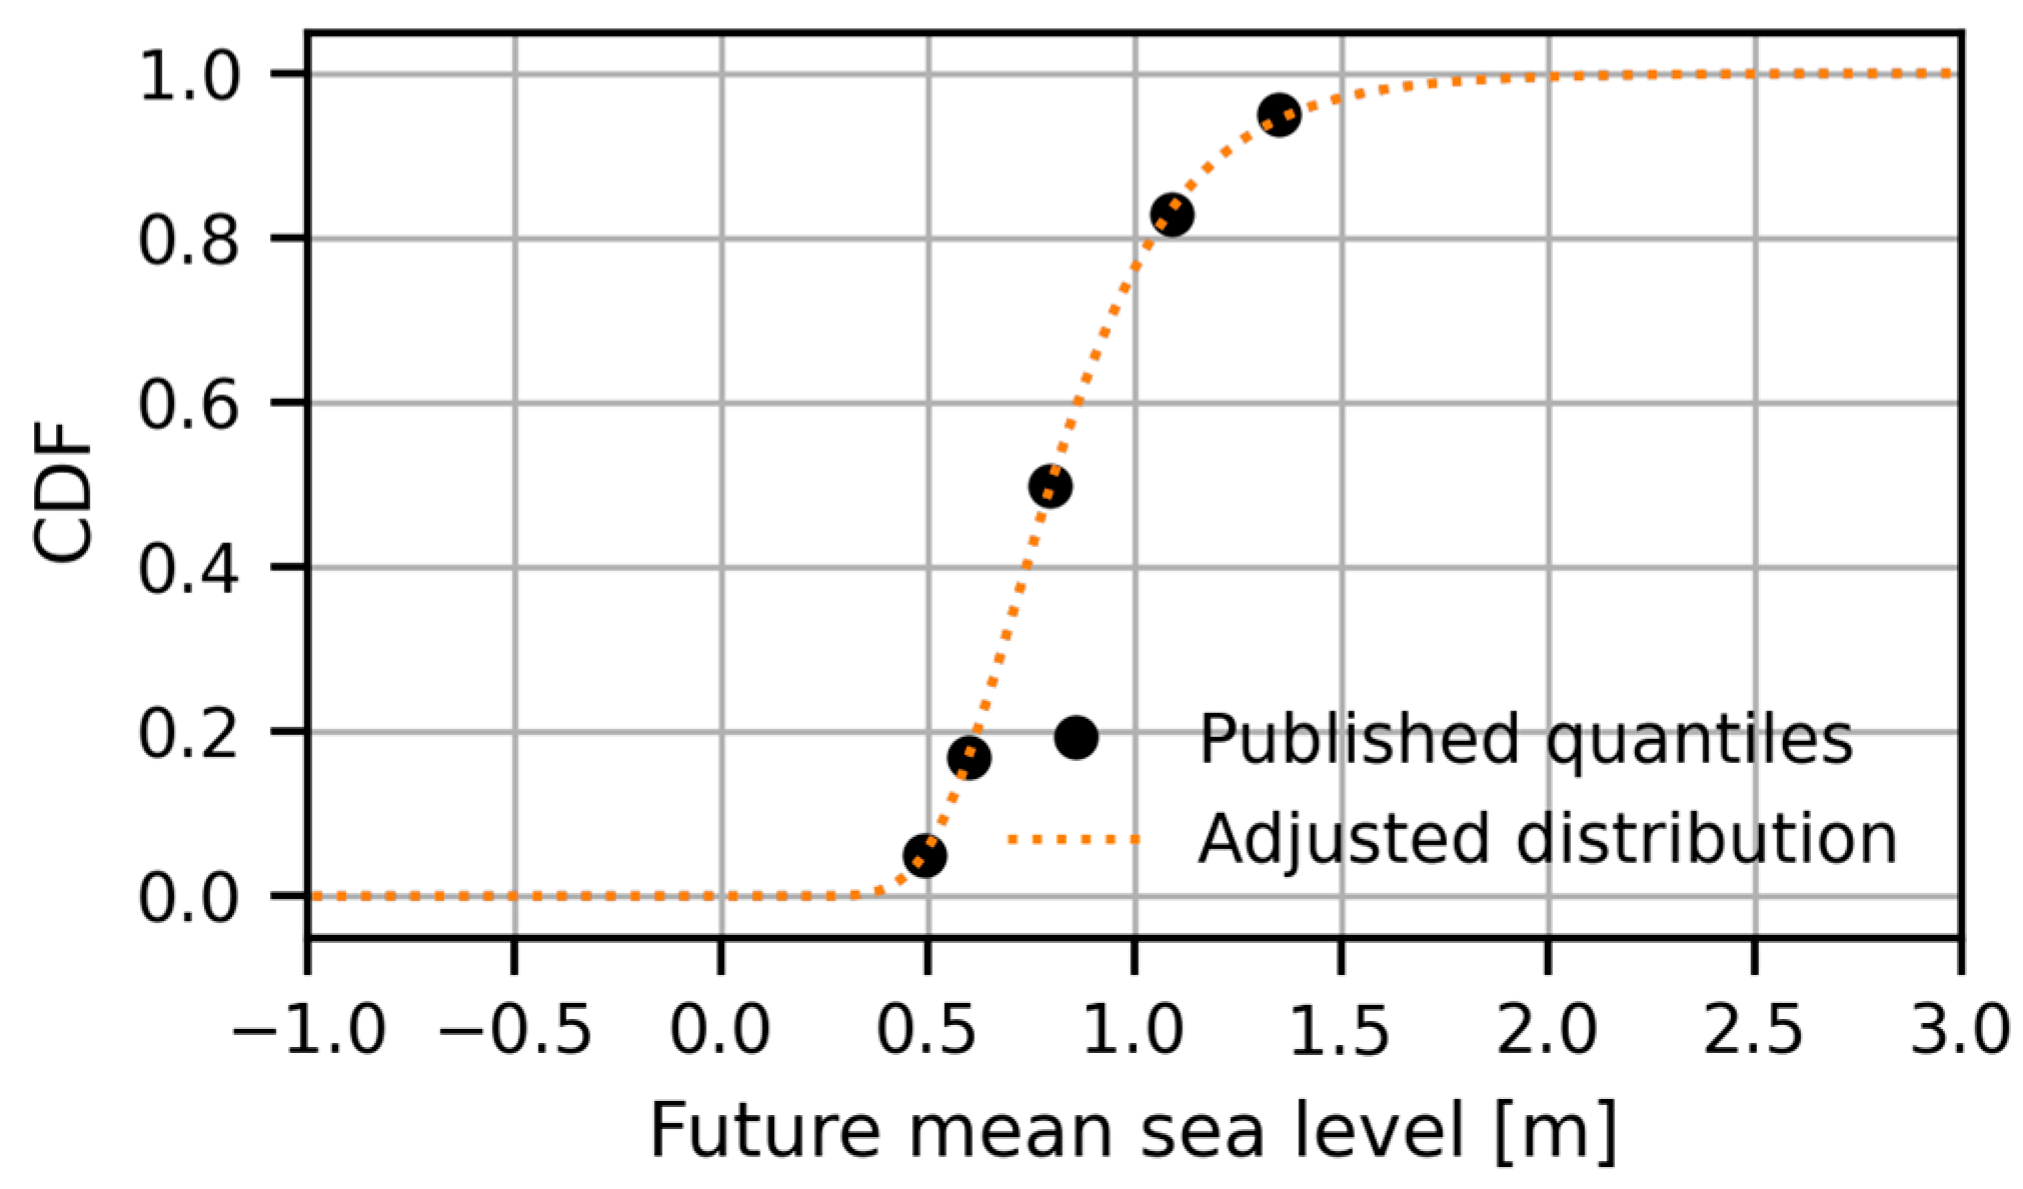
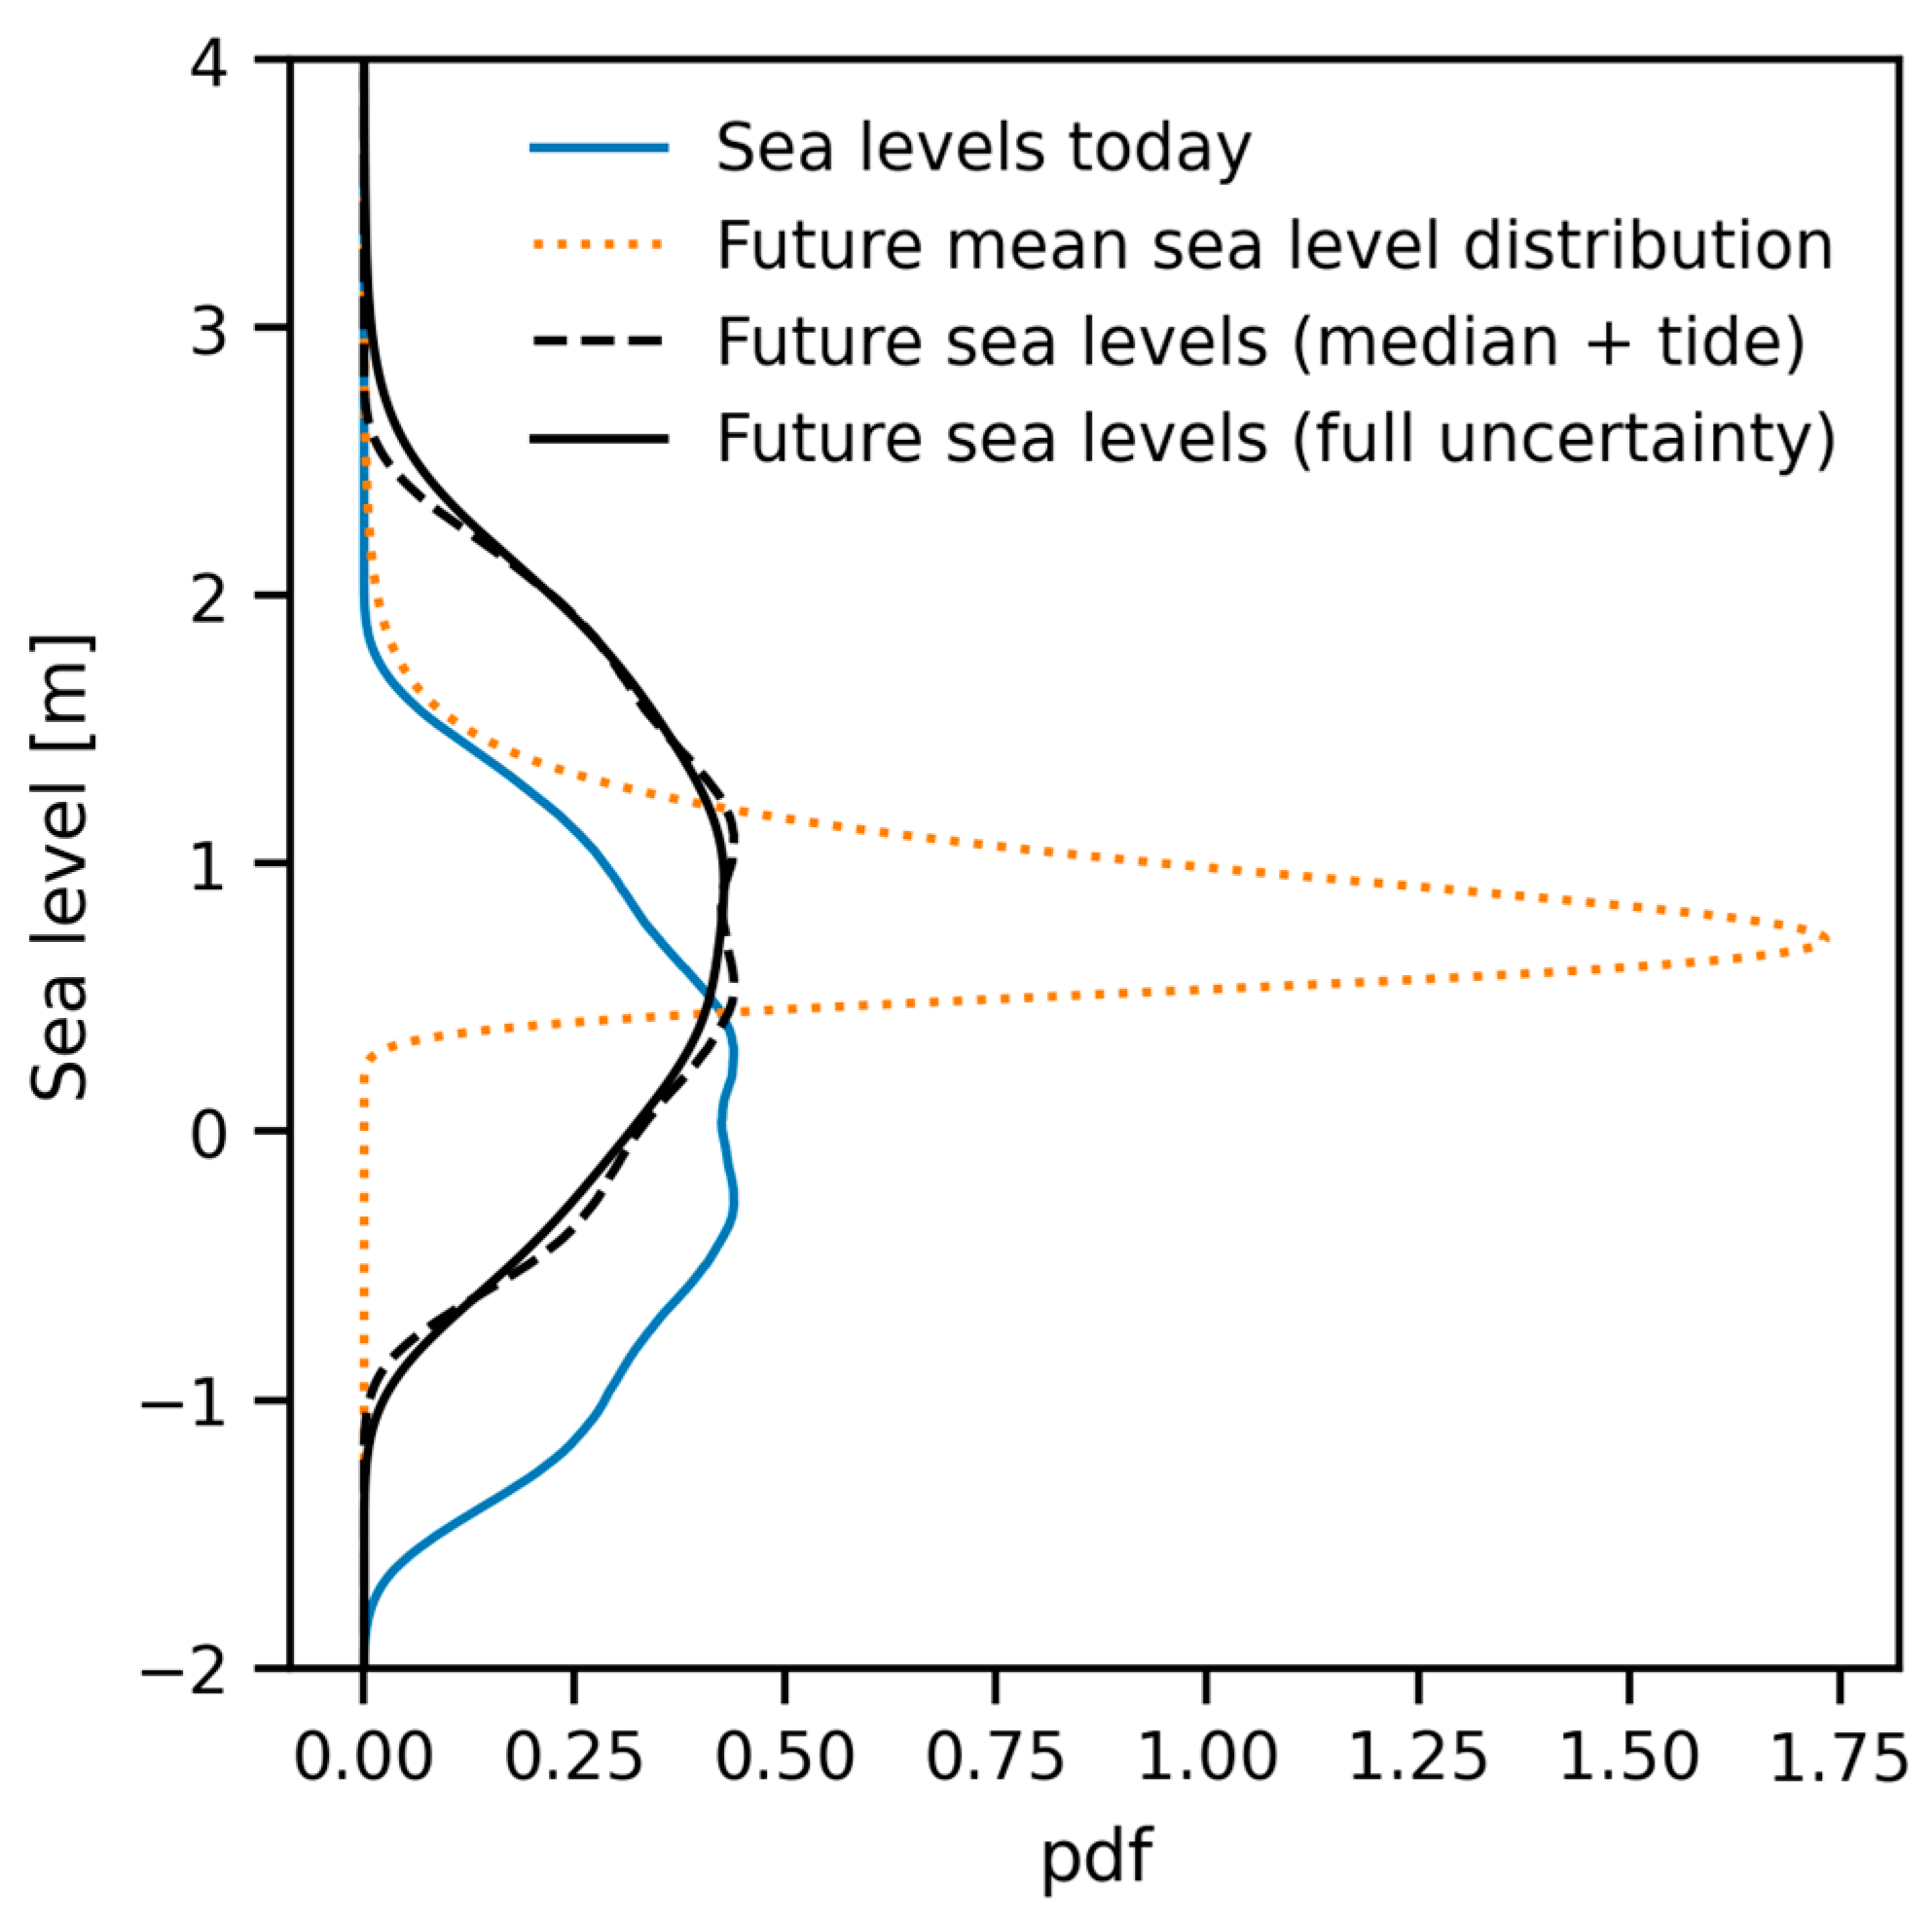
Moreover, the IPCC report provides information on the quantiles (i.e., 5%, 17%, 50%, 83%, and 95%) associated with the expected mean sea level change (Figure 8). To account with the statistical variability associated with the expected change in the mean sea level, we adjusted a noncentred t-student (with 4 parameters) to the quantile information (Figure 8, orange dashed line).
The probability distribution function associated with the astronomical tide time series is depicted in Figure 9 (blue line). For future climate change scenarios, this astronomical tide distribution can be shifted (black dashed) or it can be combined with the future expected mean sea level adjusted distribution (orange dashed). Combining the latter by convolution, a full uncertainty distribution of astronomical tide time series was obtained. Interestingly, the uncertainty associated with future higher tidal levels is larger than that associated with lower tidal levels. This can be observed based on the vertical difference between the shifted astronomical tidal level distribution (black dashed) and the full uncertainty distribution (black line) for sea levels around −1 m and between 2.5 m and 3.0 m. This effect is due to the skewed future mean sea level distribution (orange dashed).

3.3.2. Expected Evolution of the Intensity of Rainfall Events

The last IPCC report [22] concludes that global warming is projected to cause substantial changes in the water cycle at global and regional scales. Although in most land regions the future changes in precipitation are subject to high uncertainty, there is a strong model consensus on heavy precipitation increasing and becoming more frequent over most land areas. Notably, the multi-model median change in precipitation is inferior to 10% in many regions, at 1.5 °C global warming.
According to INGC [23], the General Circulation Models (GCM) models project an increase in rainfall over most of Mozambique during the rainy season (mainly from December to March), revealing a widespread increase in precipitation, on average between 10% and 25%, respectively, for 2046 to 2065. However, the projections vary significantly throughout the country.
McKinsey et al. [24] considered two scenarios regarding precipitation fluctuations to account for future uncertainty. In the context of the moderate climate change scenario, the study projected a rainfall increase of 1.2 mm per week during the period from December to March, while the severe scenario foresees a 3.3 mm per week rainfall increase. Considering the average monthly precipitation of 121 mm historically observed from December to March [25], this represents a rainfall increase between 4 and 12%.
Due to the high uncertainty associated with the evolution of the frequency of extreme rainfall events due to climate change, the future I-D-F curves were assumed to be very similar to the present ones. To account for climate change effects, a straightforward increase of 5% in the intensities associated with all durations and return periods was assumed for 2100 under an RCP 8.5 scenario. The value of 5% was chosen illustratively, but also as it is in line with previous studies in the scope of the Drainage and Sanitation Master Plan of the Greater Maputo area [26].

3.4. Numerical Model

According to the described methodology, a dynamic simulation model was developed for the drainage system under study using SWMM 5.2. It comprises the following components: 336 sub catchments; 672 nodes (manholes); 14 outfall nodes to simulate discharge points into the sea; 670 conduit links (sewers); 3 weirs; and 1 rain gage.
On 27 and 28 May 2022, 153 entities based in downtown Maputo were surveyed. According to the survey results, periodic and annual flooding in the area is a reality and presents environmental, social, and financial impacts. The perception of the respondents is that flooding is caused by runoff coming from Av. Guerra Popular, Filipe Samuel Magaia, Karl Max, and Samora Machel, in the North–South direction, concentrating mostly on Av. 25 de Setembro. The coincidence of high tide with the occurrence of precipitation causes the water to remain for periods of more than 3 h. Also mentioned was the lack of maintenance and cleaning of the drainage system which, combined with poor urban solid waste collection, results in the obstruction of the drainage system’s interception devices.
Based on the information collected in these surveys, namely regarding flooded areas and maximum flood heights, an approximate calibration of the model for the current situation was carried out for rainfalls with a return period of 2 years.

4. Results and Discussion

4.1. Performance of the Exisiting System

Dynamical simulations of the storm drainage system of downtown Maputo were undertaken for every return period (1-year steps) and sea levels from −1.5 to 3.5 m at 10 cm steps. In total, over 10,000 simulations were completed with the existing and the proposed systems.
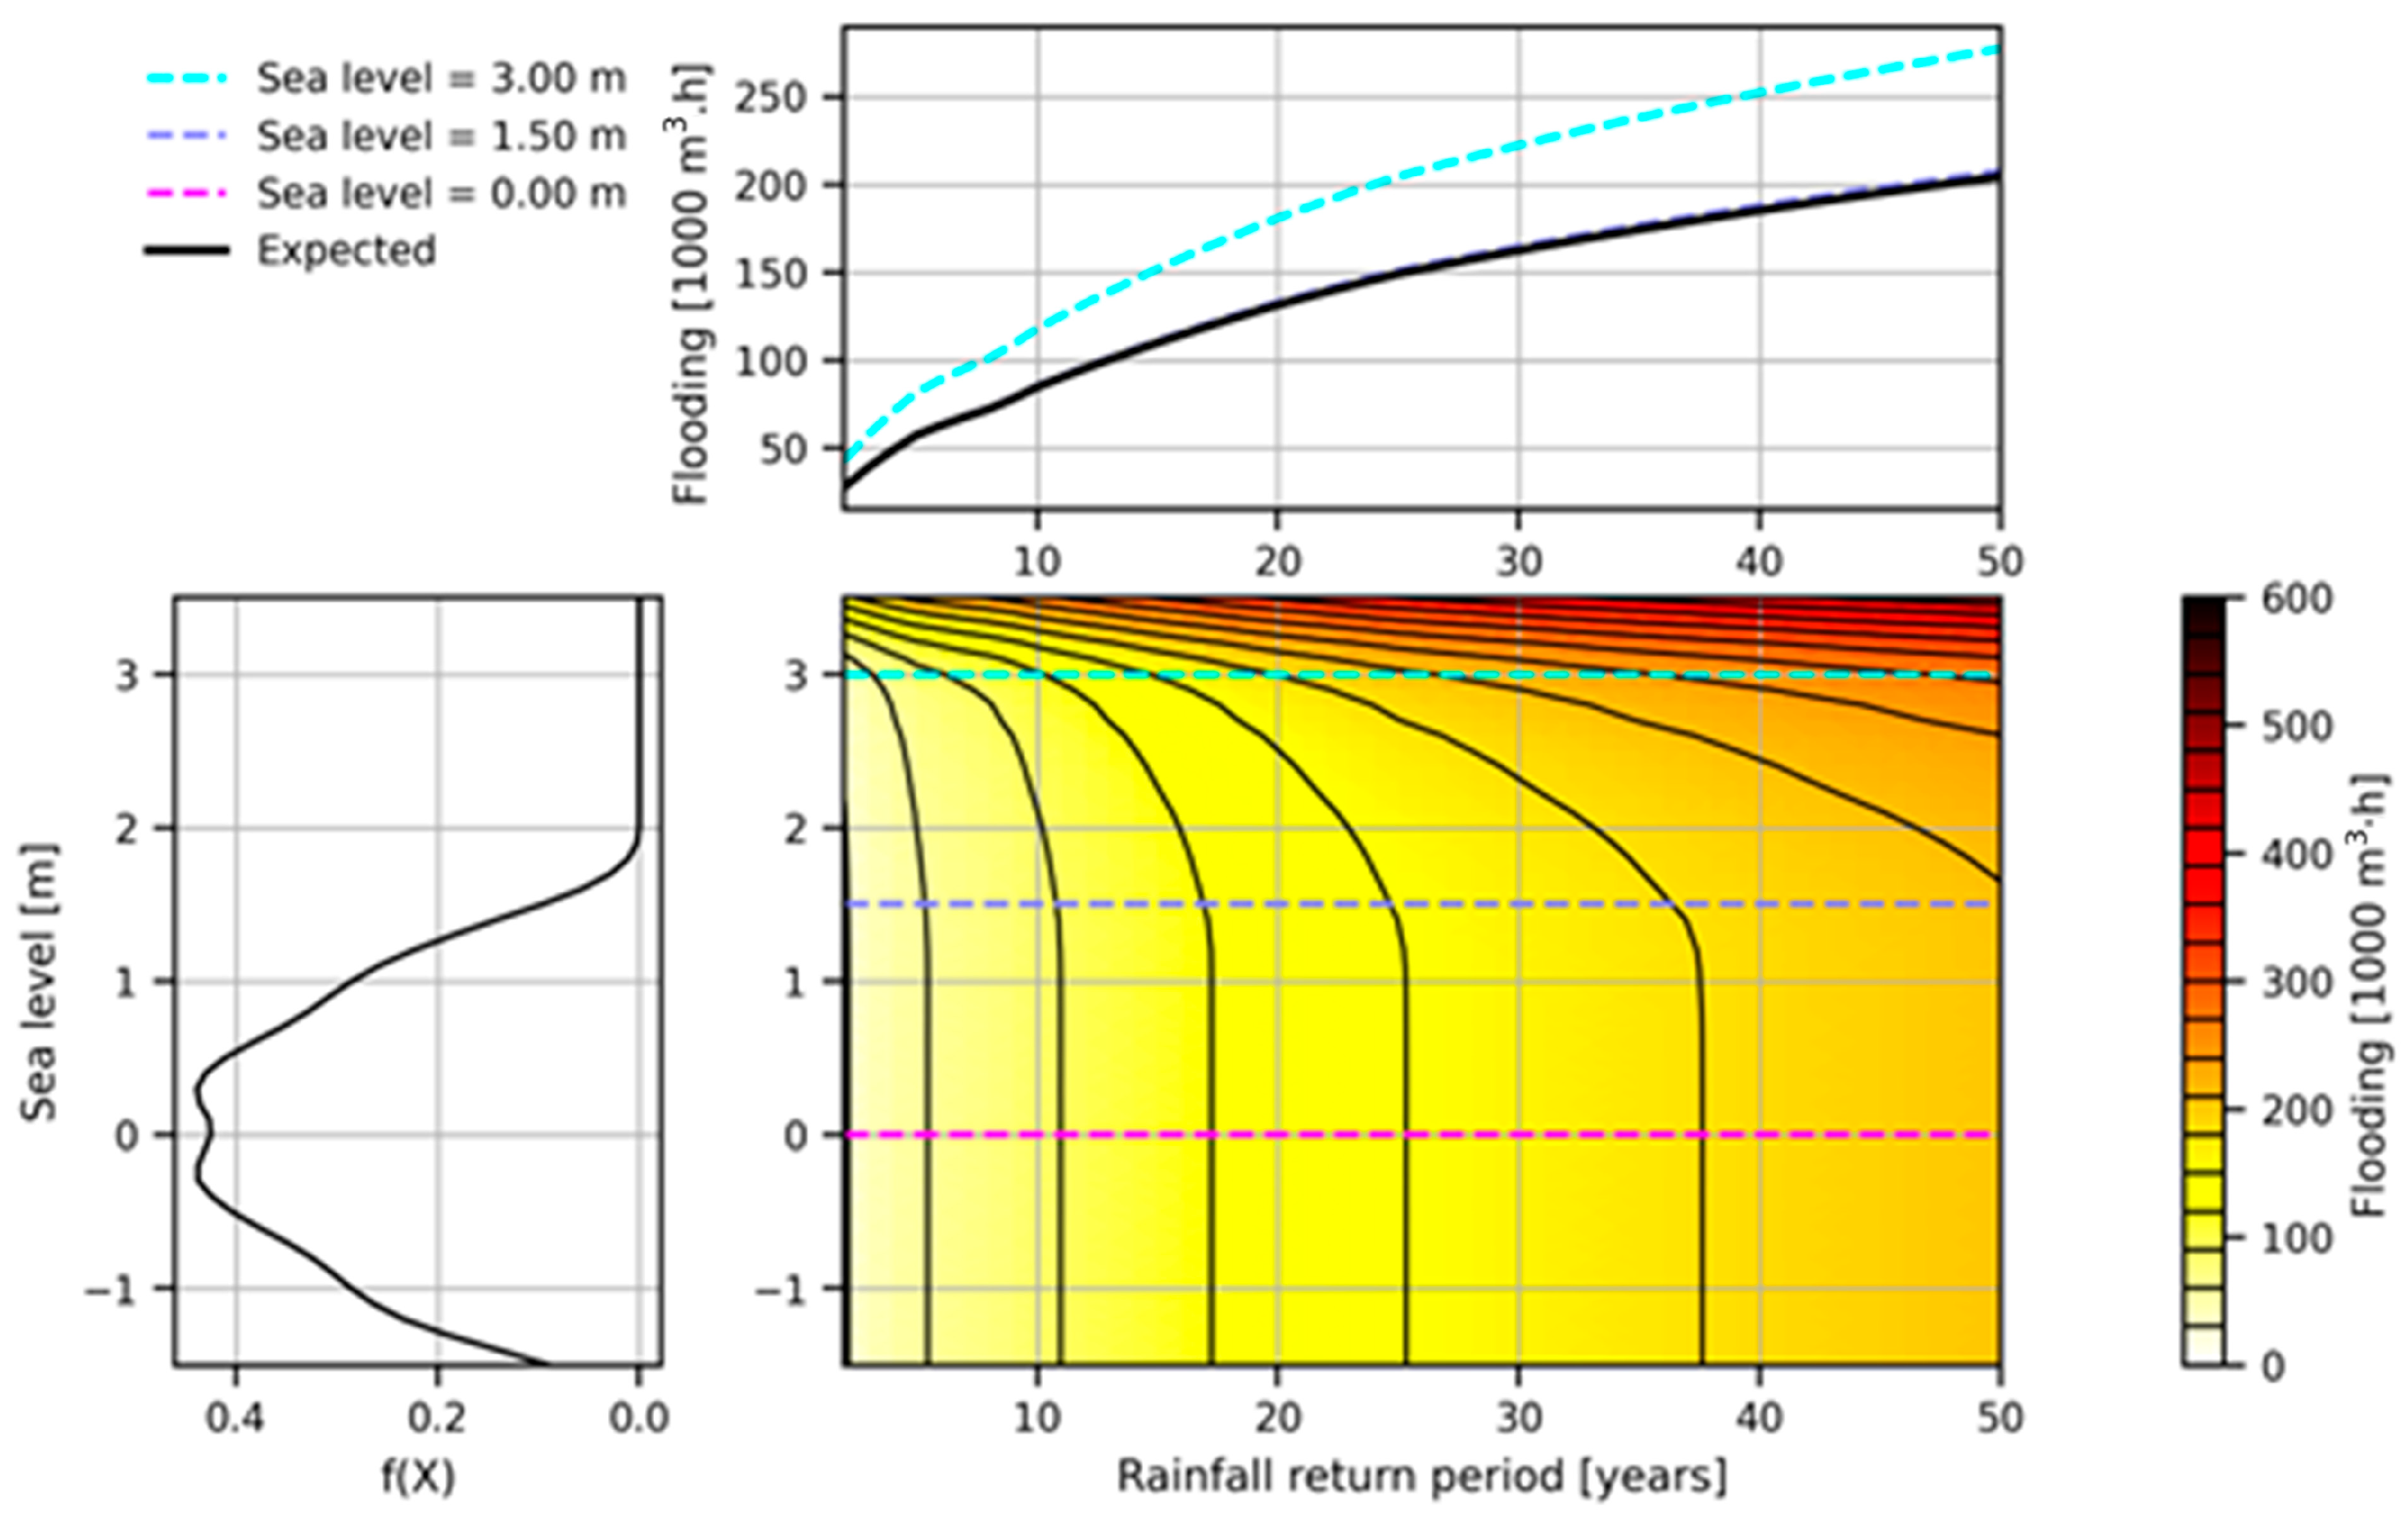
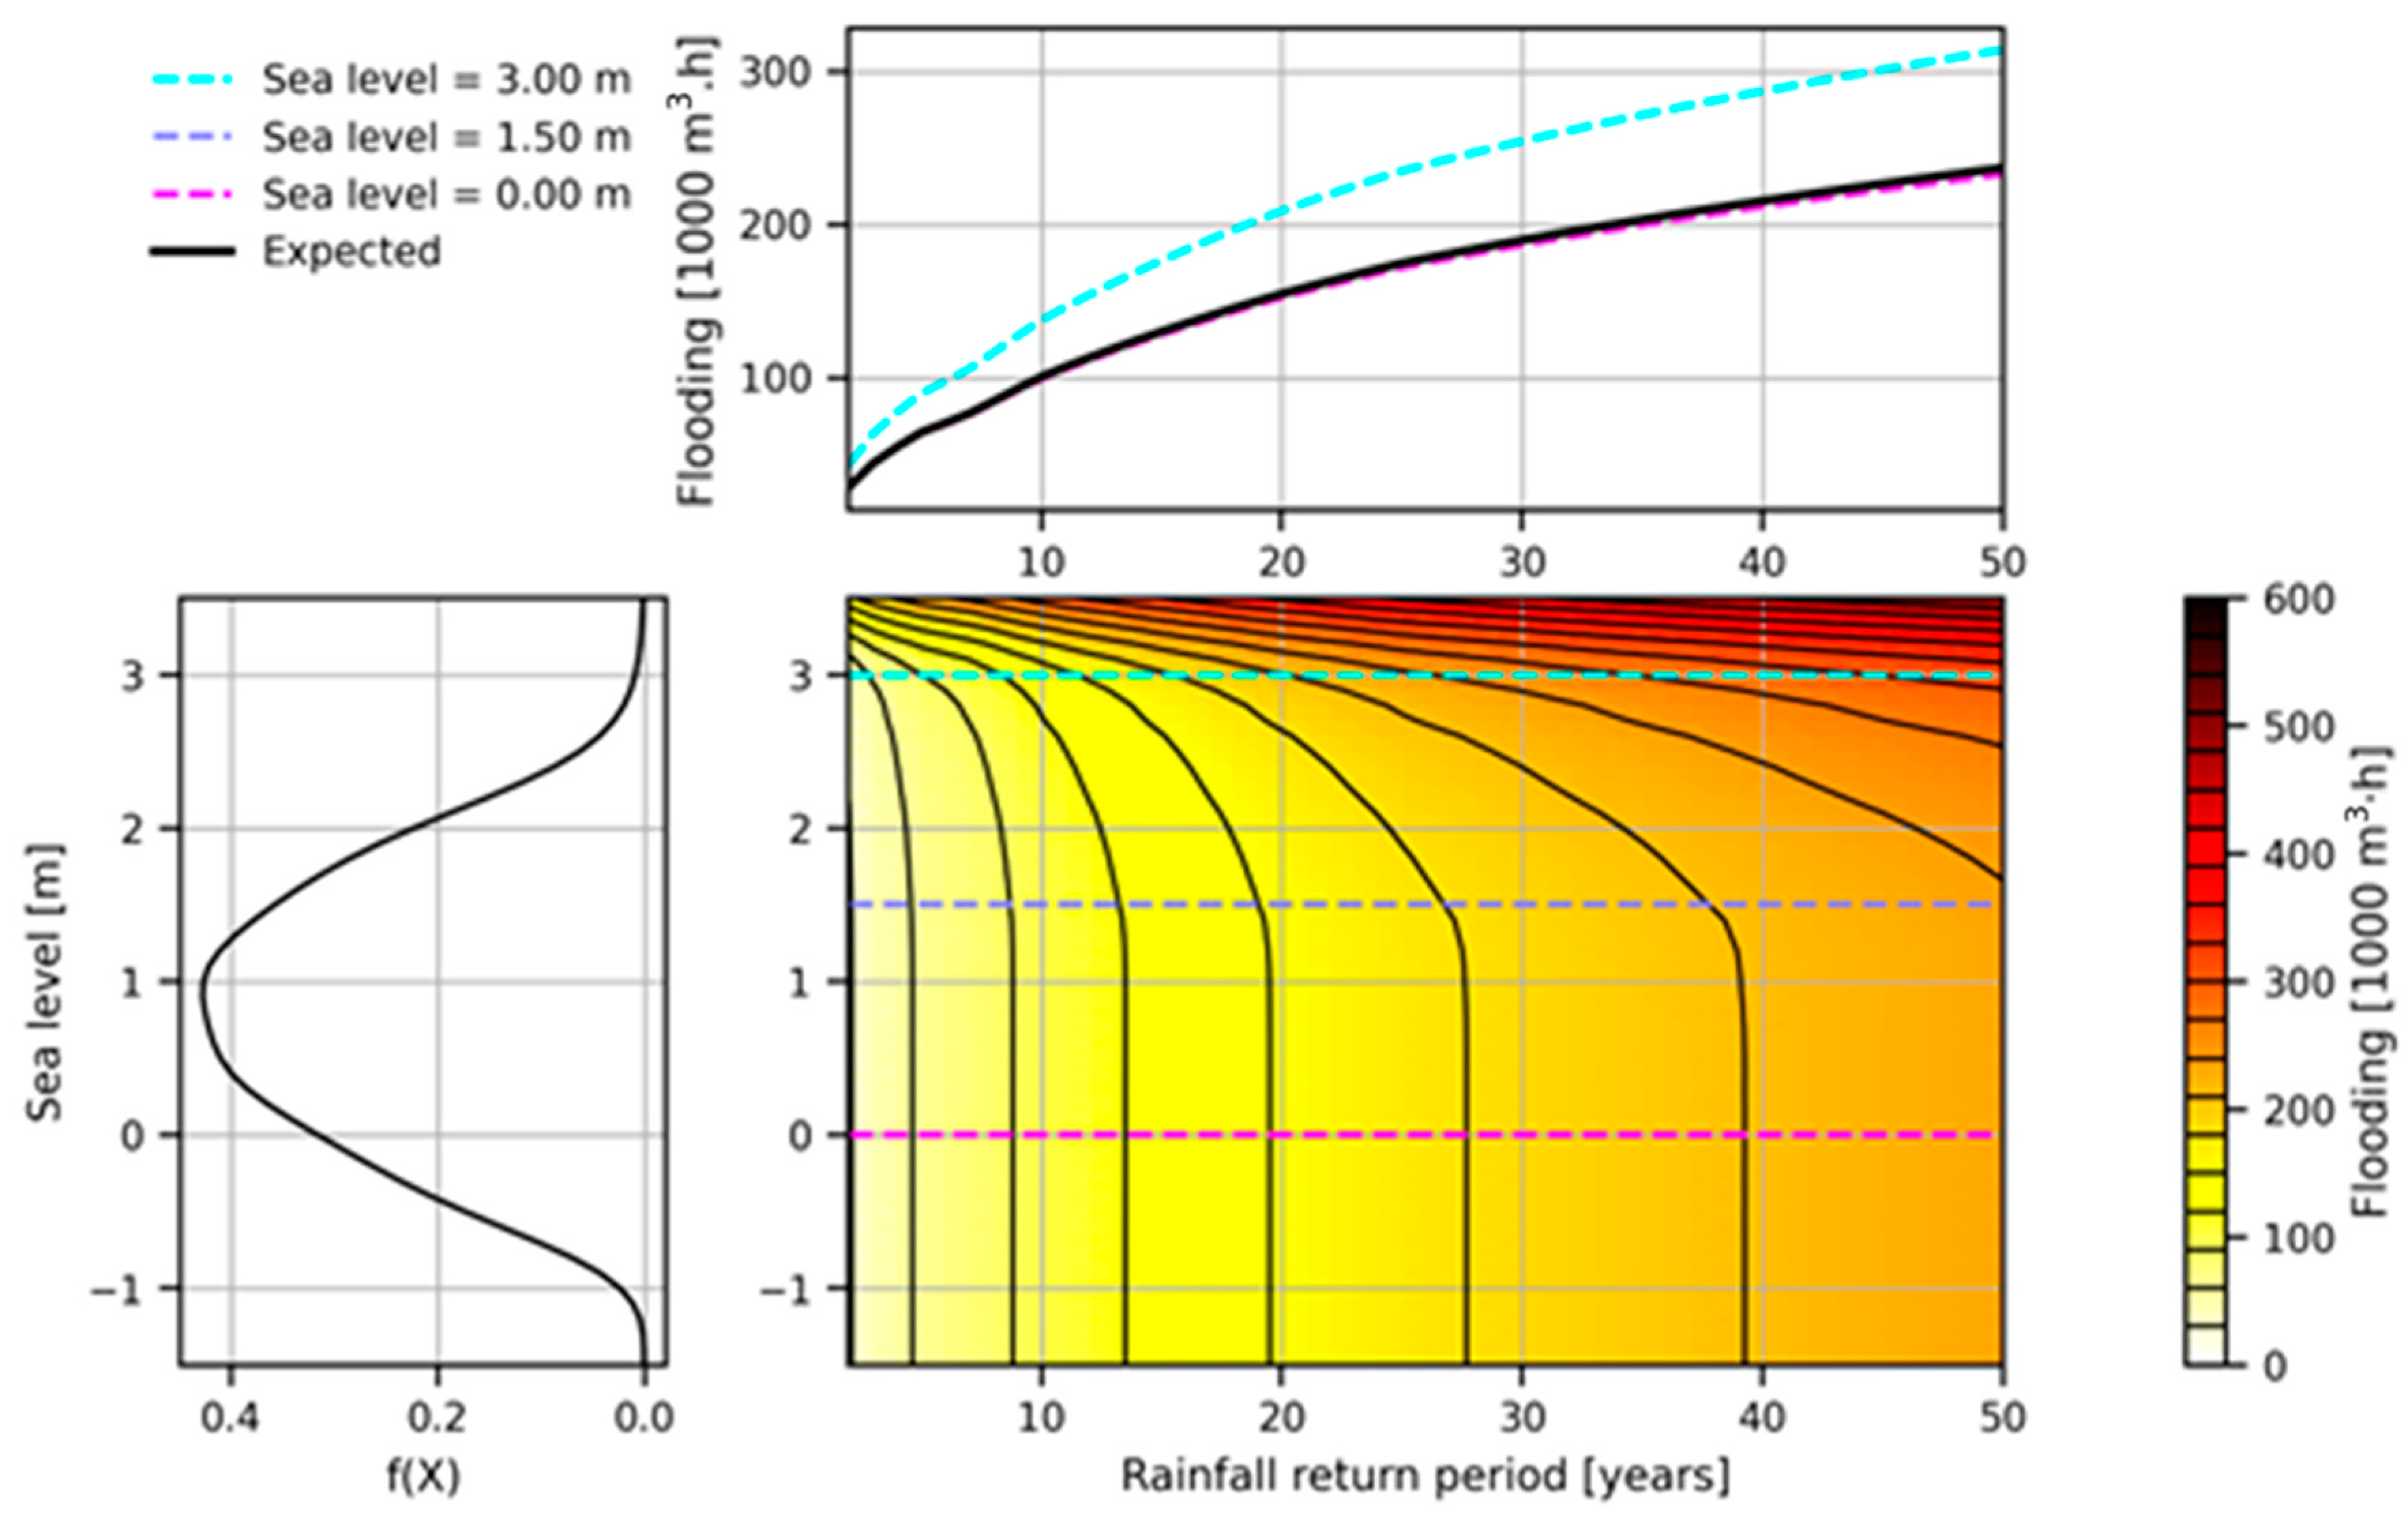
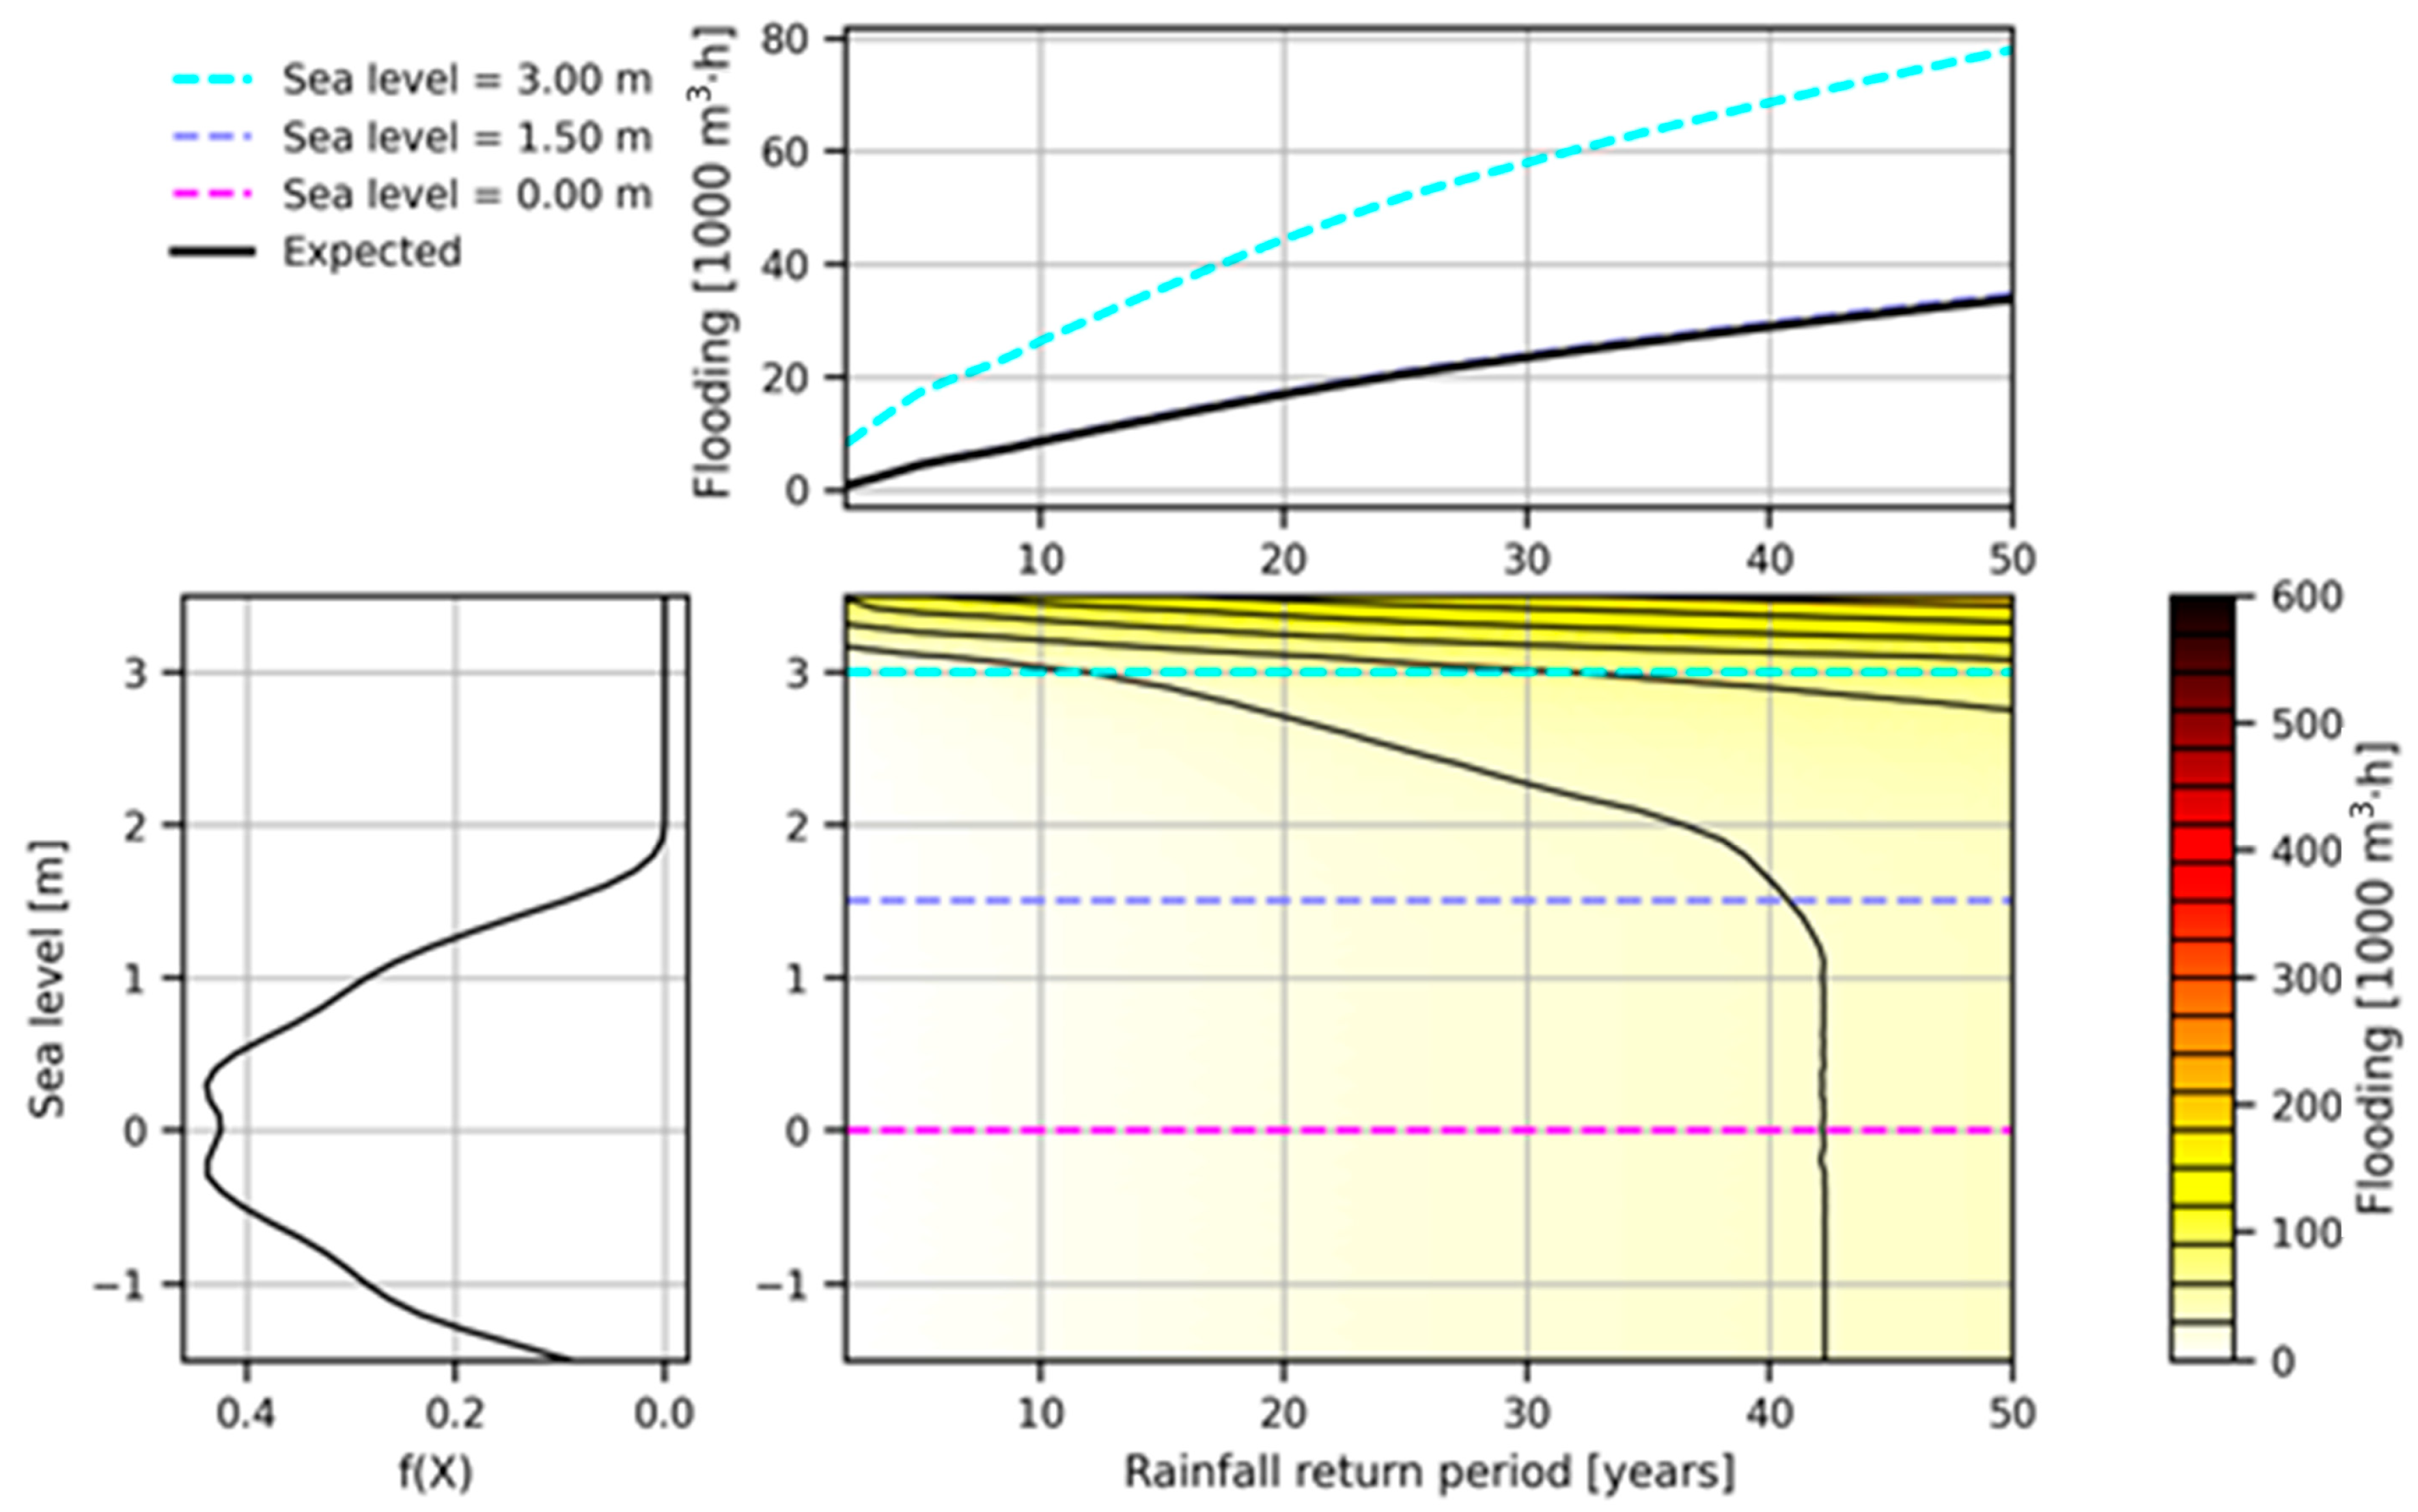
Flooding results for the existing system under present-day conditions are shown in Figure 10. The figure, as the ones that follow it, includes three areas. The one at the centre portrays the most important information, being coloured proportionally to the simulated flooding for each combination of sea level and return period of the rainfall event. Contours are spaced every 30,000 m3·h. The one on the left depicts the probability density function of sea levels. Finally, the top area shows flooding as a function of return periods. It presents curves associated with sea levels of 0, 1.5, and 3.0 m, as well as the expected flooding, which integrates flooding across all sea level probabilities.
Figure 10 presents results for the existing system under present-day conditions. Several aspects are worth noticing about it. First and foremost, it can be highlighted that the flooding contour lines are practically vertical for sea levels below 1 m, meaning that most flooding that occurs is independent from it and due solely to lack of hydraulic capacity of the existing storm drainage system. Secondly, it can be seen that high sea levels worsen the flooding, particularly above 3 m. Despite that, the probability of such high sea levels is extremely low, which translates into a negligible effect on expected flooding (the expected flooding curve overlaps with flooding for sea levels of 0 and 1.5 m).
Figure 11 explores the performance of the existing system under future conditions. The future conditions are representative of RCP 8.5 by 2100 and include a 5% increase in rainfall intensity during extreme events. This naturally worsens flooding, but mostly due to the additional rainfall intensity, not higher sea levels. That can be concluded from the expected flooding curve, which is now slightly above flooding during events sea level at 0 m, but remains practically the same.
The figures below characterize flooding as the integral of flooded volume over time. The rationale for this metric is laid out in Section 2.3. As an alternative, equivalent plots considering the maximum flooded volume during events are presented in Appendix A.

4.2. Performance of the Future System

The risk profile depicted by Figure 12 is dramatically different from the previous ones. For the proposed system, flooding is very significantly reduced for present-day conditions, with an almost 10-fold decrease in the expected flooding for a 10-year return period rainfall event. Again, flooding is independent of sea levels below 1 m.
Figure 13 presents the analysis of the proposed system by 2100 under the RCP 8.5 scenario. Again, flooding increases due to the higher intensity of the rainfall events but remains largely unaffected by sea levels. As before, compound floods occur, but their impact on overall risk is not significant.
Overall, the proposed design meets the expectations typically associated with urban flooding and has been proven resilient against rising sea levels.

4.3. Impact of Climate Change on Flooding

The impact of climate change on flooding in downtown Maputo can be visualized in Figure 14. In it, the relative changes in flooding between the proposed system under future conditions and the present system under today’s conditions are presented.
For return periods close to 2 years, flooding is practically eliminated (reductions close to 100%). For all sea levels below 3.0 m (comprising the majority of situations), reductions in flooding are greater than 70%. Above 3.0 m sea levels, flooding is also reduced, but only by 40 to 70%.

4.4. Discussion of the Role of Sea Levels and Site Specific Characteristics on Urban Flooding

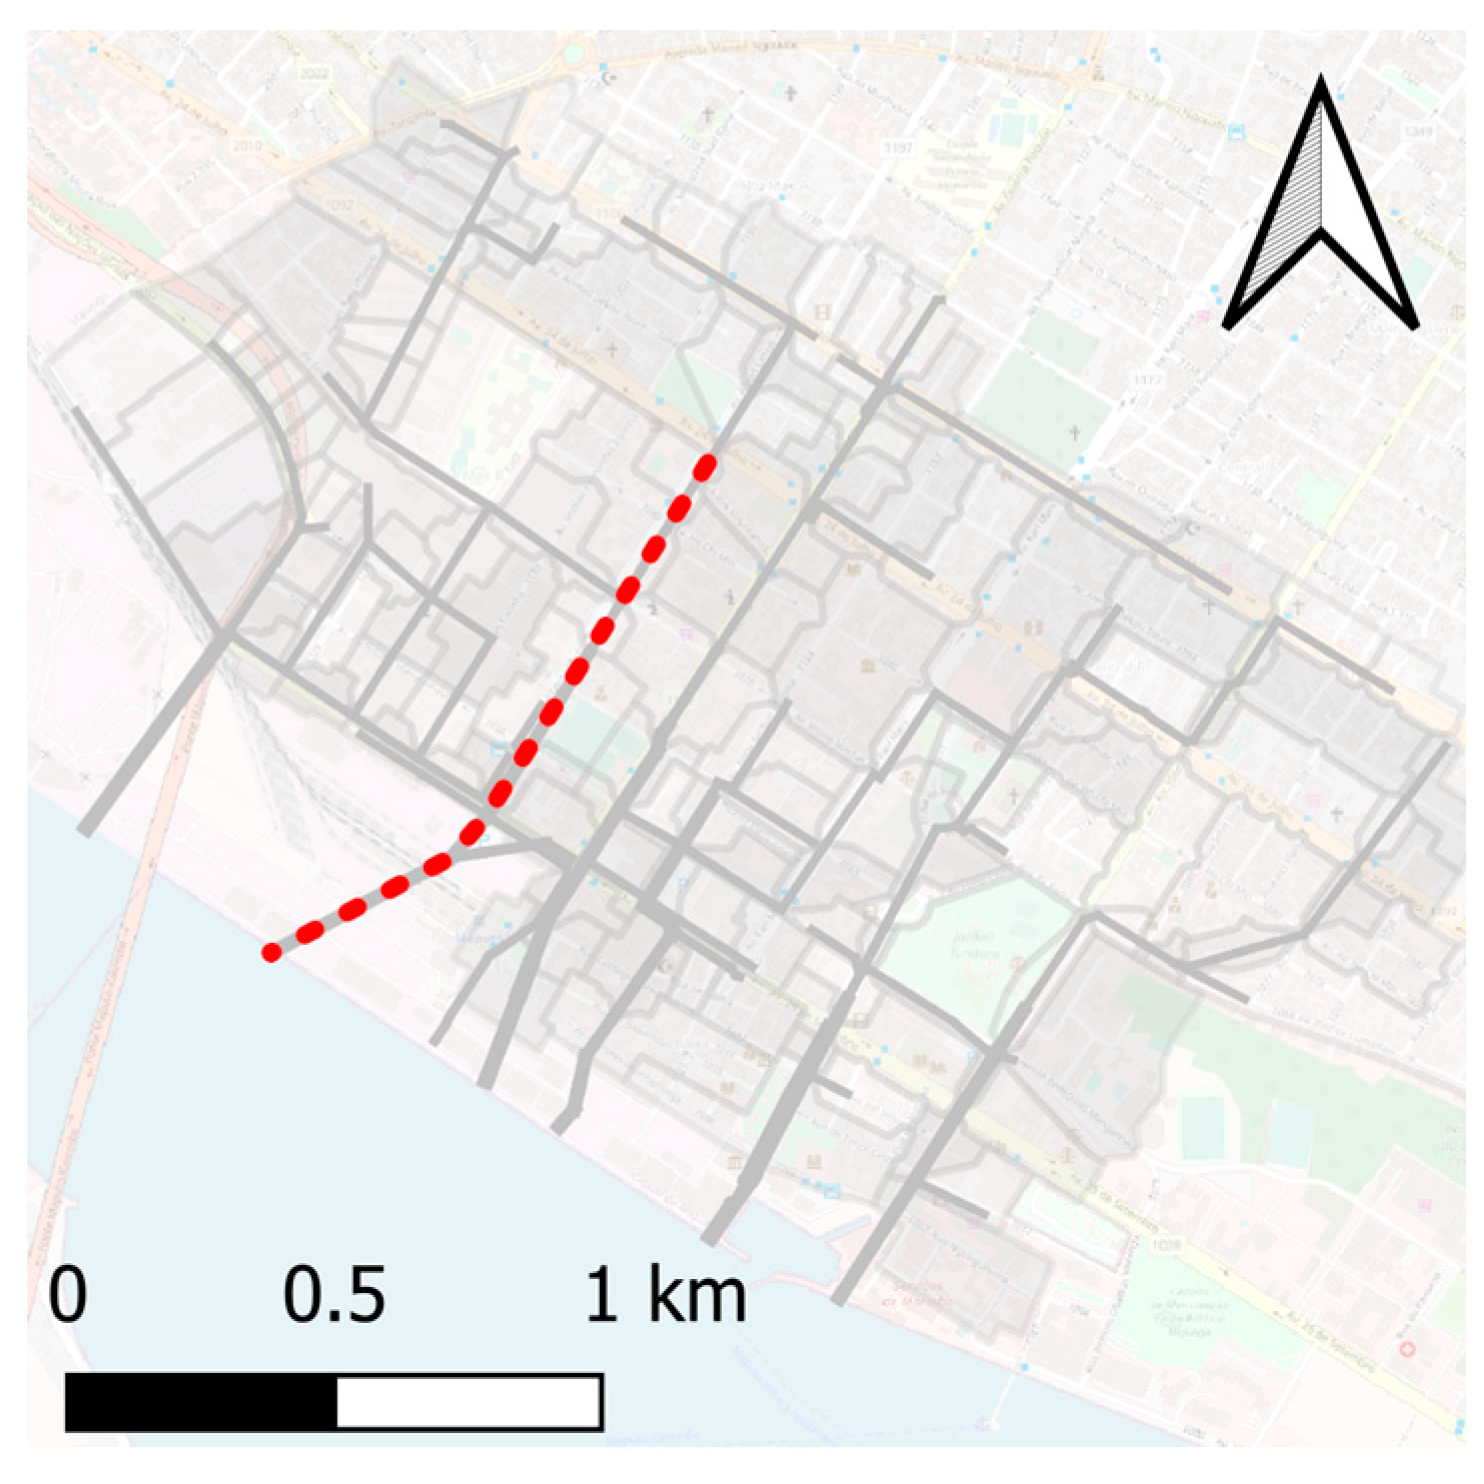
Storm drainage in downtown Maputo evidences a split between rainfall-driven flooding and sea level-driven flooding: due to the elevation profile of the city (see Figure 3), most of the drainage system is not affected by high sea levels. Drainage pipe A (Figure 15) is one of the spots where compound floods can be felt and was therefore selected to provide further insight about the behaviour of the system.
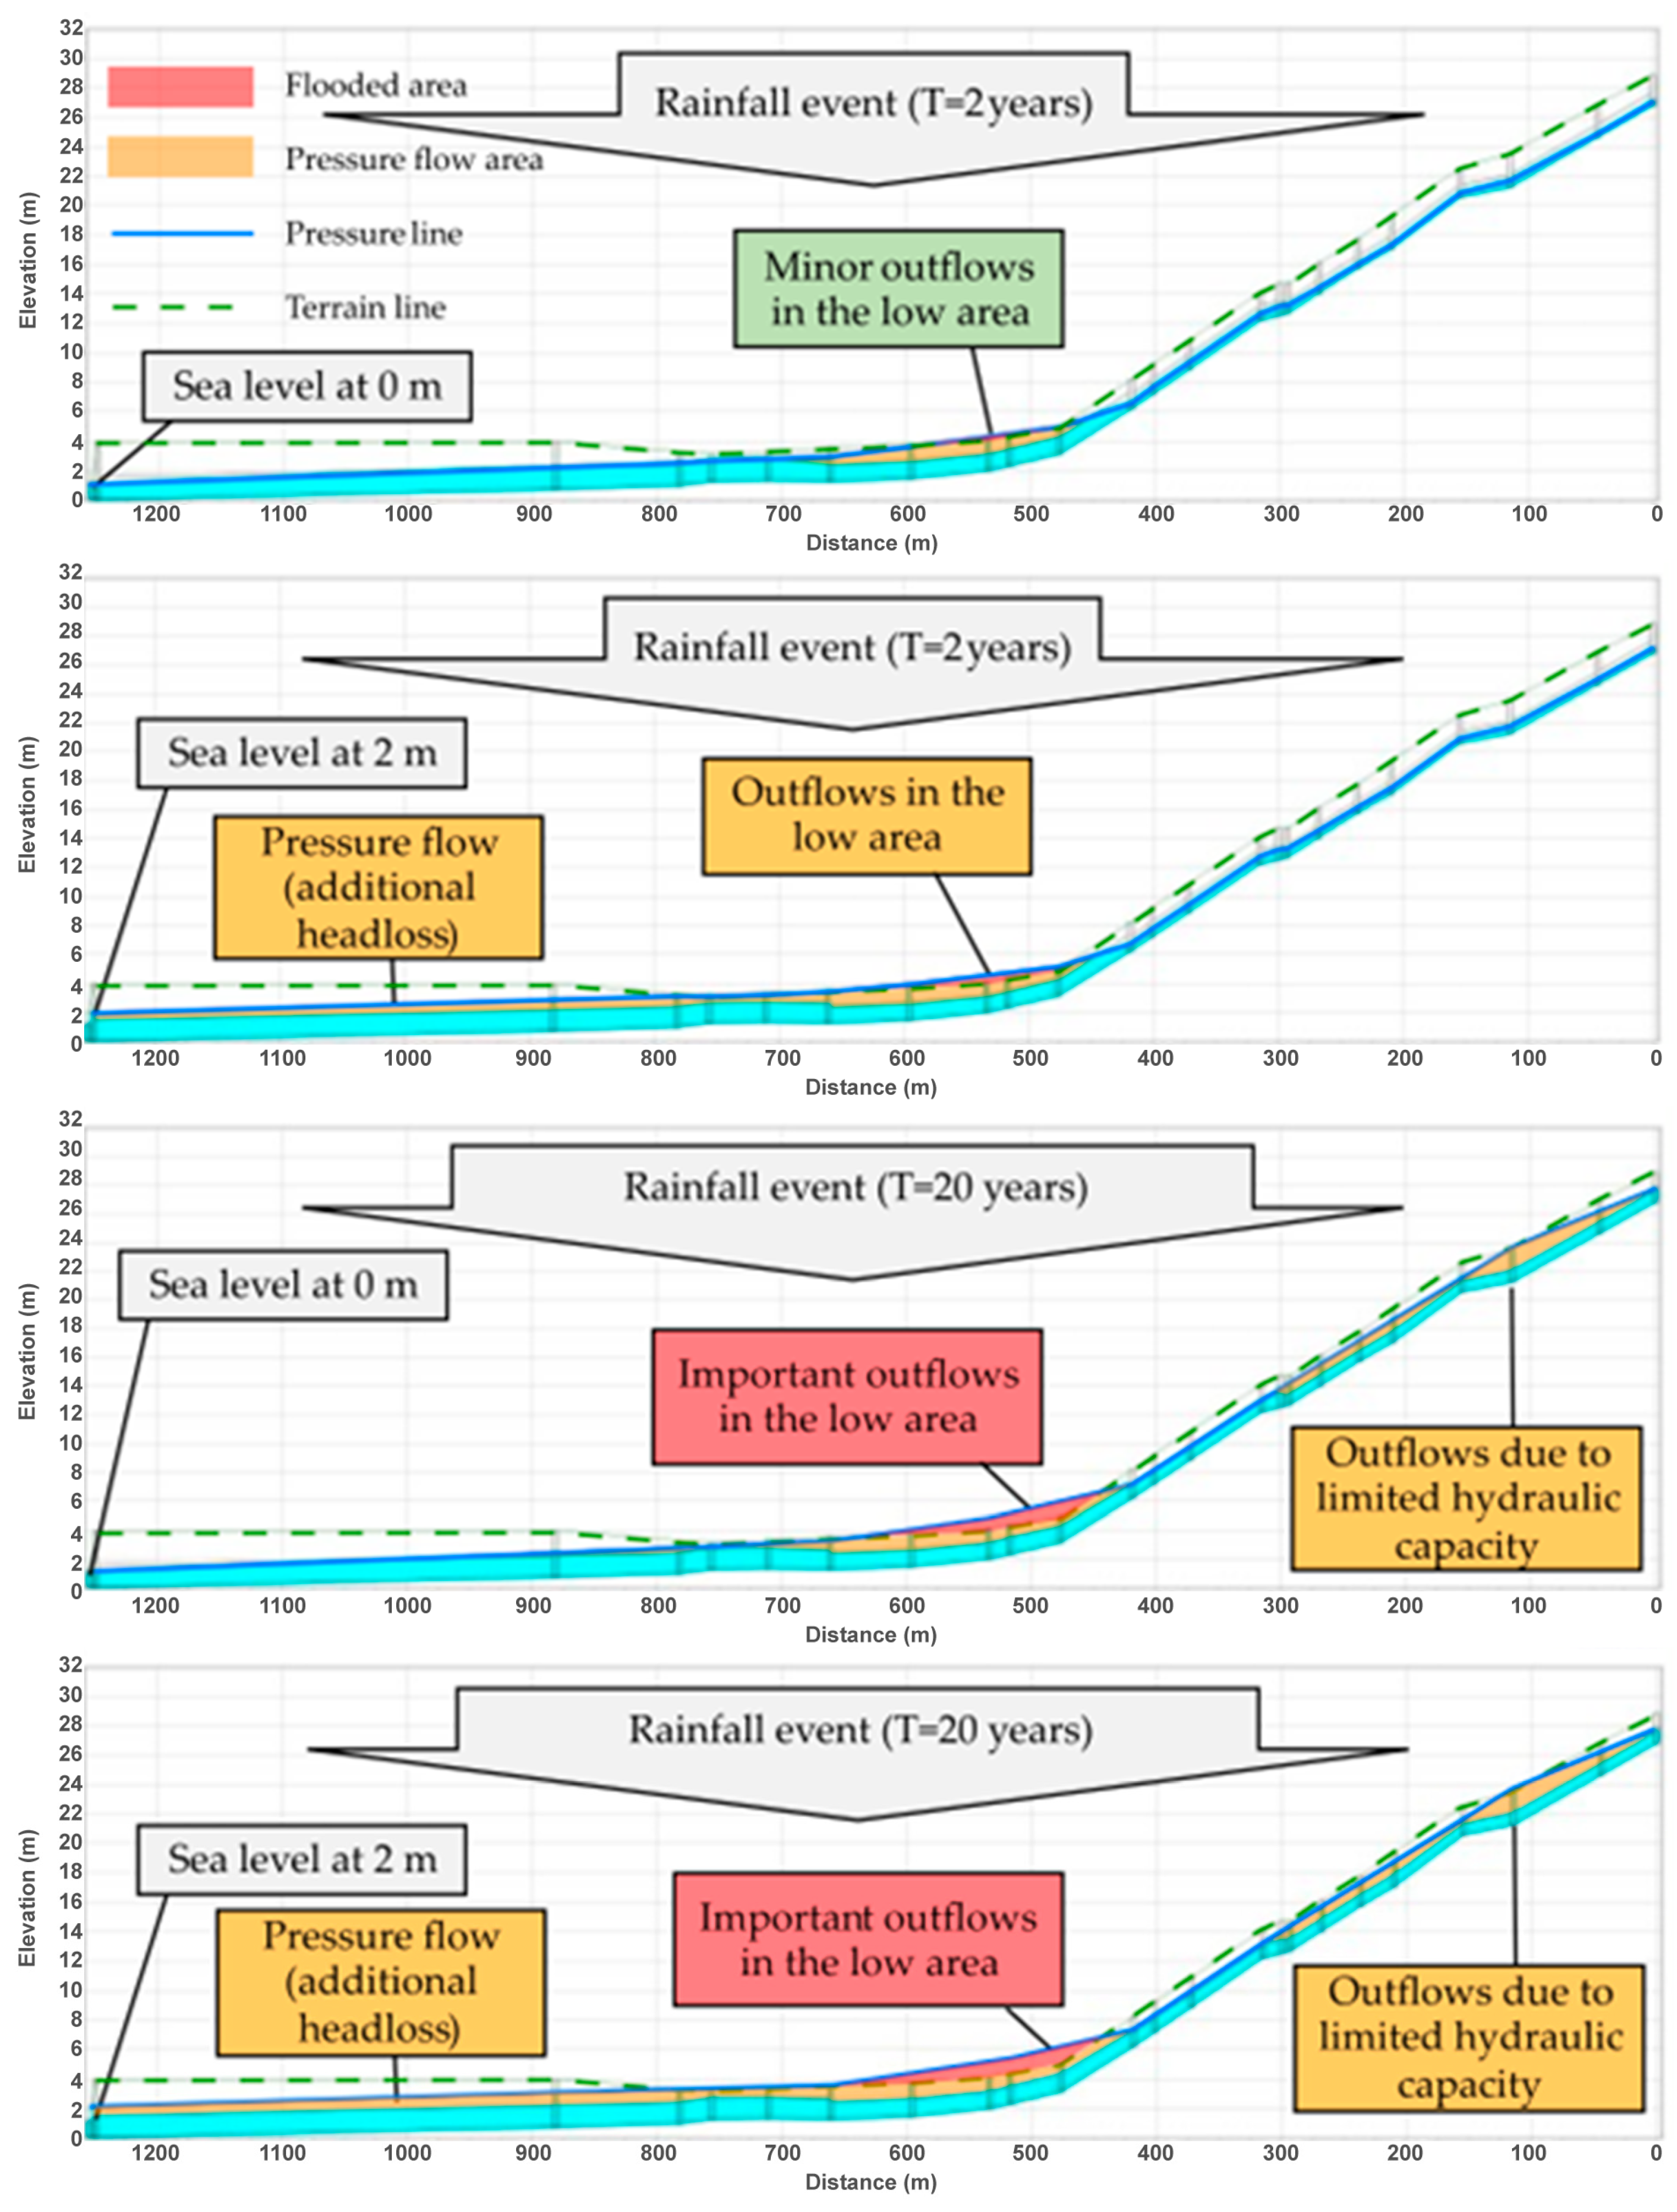
Inspecting the profiles in Figure 16, it is immediately apparent that compound floods can only affect a swath of roughly 750 m from the shoreline (on the left). Further inland, the topography rises steeply, quickly overcoming any backwater effects induced by the sea. For rainfall events with return period of 2 years the hydraulic capacity of the pipe is exceeded at the base of the slope (orange shaded). When sea levels are low (top profile), the energy line practically does not cross the terrain elevation and, therefore, little flooding takes place. Higher sea levels (second profile) will induce a stronger backwater effect on the lower part of the pipe, contributing to stronger head losses and more flooding (red shaded—here barely visible at the base of the slope).
When the rainfall is more intense (20-year return period; third and fourth profiles), flooding becomes more substantial. Interestingly, some flooding starts to occur on the slope, well protected from any influence of the sea, due to the limited hydraulic capacity of the system. Such upstream flooding “alleviates” the situation in the lower area, as it delays the inflow of water to its critical zones. Despite the outflows on the upper area, the additional rainfall worsens flooding in the lower area even when sea levels are low in a process that, again, is solely function of the capacity of the drainage system.
When the high intensity rainfall is combined with high sea levels, the situation worsens (fourth profile). Indeed, the combination of high-water downstream boundary conditions and additional discharge causes all of pipe in the low area to become pressurized, reducing its hydraulic capacity and increasing head losses, ultimately leading to more flooding.
Pipe A constitutes one of the pipes of the proposed system where the analysis of compound floods is most relevant. In most of the others, there is an even clearer divide between rainfall- and sea level-induced flooding.
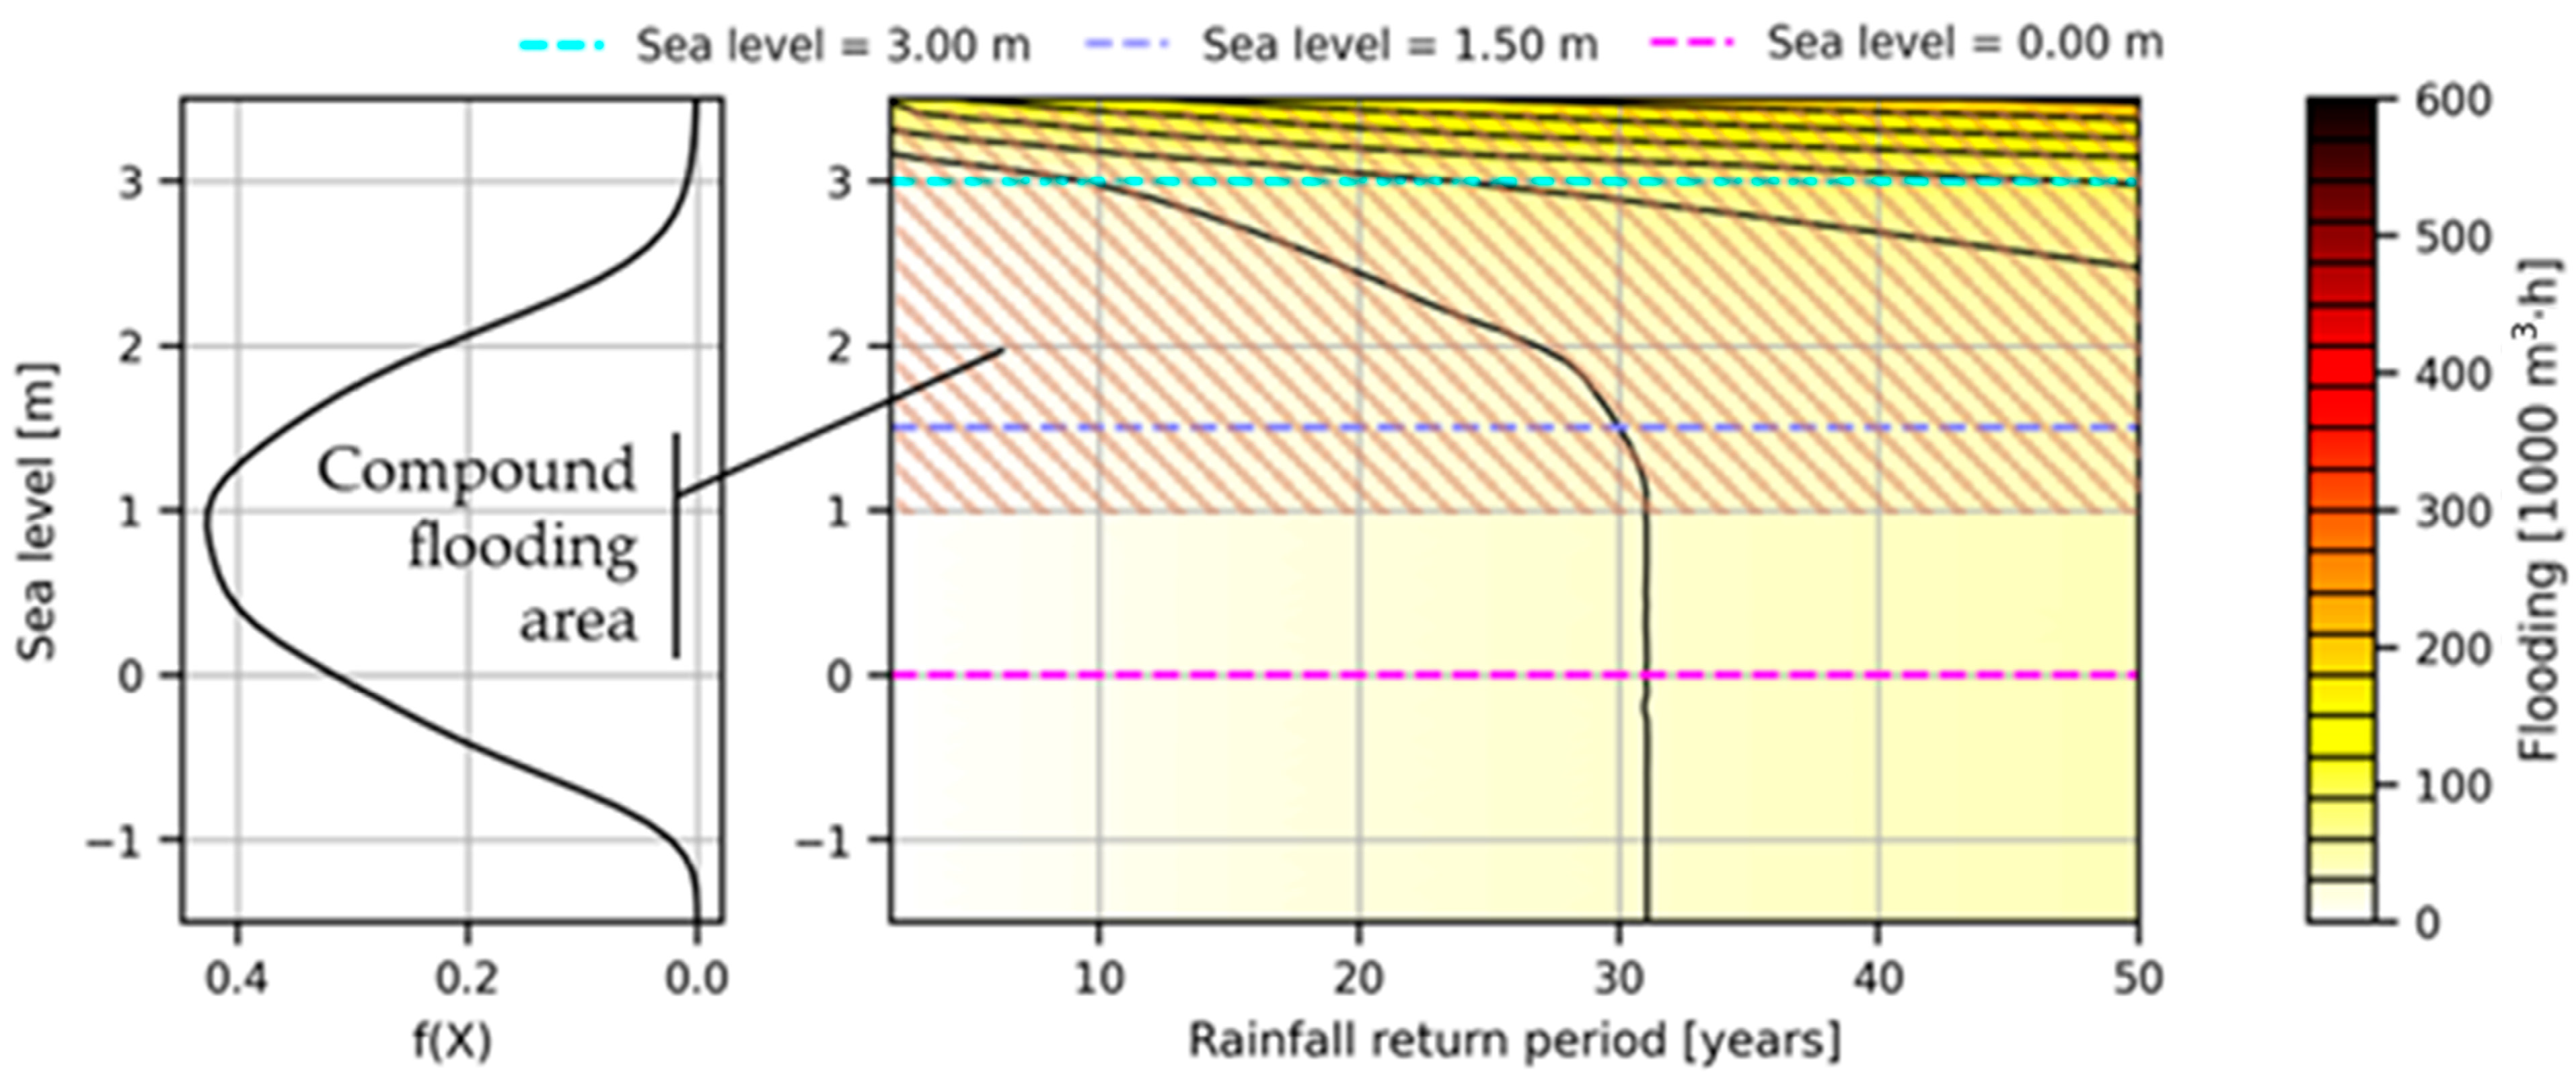
Although, due to the city’s topography, compound flooding in downtown Maputo is “limited”, it will become more relevant as sea levels rise during the present century. Indeed, revisiting Figure 13, it is evident that compound effects will exacerbate flooding in almost half of the events by 2100, even discounting storm surges (Figure 17).
Despite the full uncertainty approach used in this study, other contributions to sea levels exist, such as storm surges. During extreme storm events, the combination of atmospheric pressure depressions, strong onshore winds, and breaking waves (i.e., storm surges) will raise the sea levels to higher levels than the astronomical tide alone. Future research studies may include this mechanism to assess the capacity of stormwater drainage systems both under present and future climate change scenarios. Moreover, and if storm surge and rainfall are considered non-independent processes, the phase-lag between maximum storm surge elevation and rainfall may be explored in future studies to examine the possible implications to stormwater drainage systems. If storm surge effects are considered independent from extreme rainfall, their consideration will not modify considerably the risk of flooding in Maputo. In more details, Figure 14 shows that for all sea levels below 3.0 m, which comprise the majority of situations, even including some buffer to account for storm surge effects, reductions in flooding are greater than 70%.
It should be stressed that, even with a suitable design, an adequate operation and maintenance of the system is crucial, particularly regarding the poor self-cleansing conditions of the sewers serving the downtown Maputo area. In fact, the operation and maintenance of drainage systems significantly influence their hydraulic performance, particularly in low-lying areas where the sewer slopes do not ensure self-cleaning.
In the specific case of System 1 in Maputo, the amplitude of the tides and does not strongly affect the hydraulic performance of the drainage system, especially for current storm runoffs and sea level conditions. The effect of climate change in terms of rising sea levels exacerbate risks, however.
Risks related to sea levels may be much more pronounced in other settings. The compound flooding risks in coastal cities under climate change depend greatly on site-specific characteristics, being more serious in large urban drainage basins, with a high percentage of impermeable areas, discharging into low-lying marginal areas with limited energy available for runoff, and subject to relevant sea levels.

5. Conclusions

In this study, insights are presented about how high tides may aggravate flooding risks in coastal areas by limiting the available head for discharge. Flood assessment procedures based on systematically combining tides and rainfall events to evaluate the risk profile of flooding caused by high tides and intensive rainfall occurring simultaneously were discussed.
The proposed procedures were applied to a coastal tropical climate city, the city of Maputo, in Mozambique, considering its specificities. Therefore, the present study analysed compound floods driven by rainfall-tide events in downtown Maputo by simulating a comprehensive set of sea levels and rainfall events in two dynamic numerical models (SWMM) of the storm drainage system—depicting the existing system and the proposed future design (corresponding to the stormwater drainage system rehabilitation, to significantly reduce flooding problems in downtown Maputo).
The analysis was performed by using a full uncertainty approach which combines the statistical tidal level distribution with a statistical distribution fitted to the modelled mean sea level change.
As expanded upon in Section 4.4, Maputo’s topography renders the city relatively resilient to compound flooding. In cities with lower, flatter topographies, compound flooding should be expected to have significantly more relevant role.
From the analysis that was undertaken, it can be concluded that:
  • Although downtown Maputo is not particularly exposed to compound flooding, accounting for rainfall-tide events is essential to understand flooding in the area and evaluating the performance of the storm drainage system.
  • Climate change will increase the flooding hazard in the city and compound flooding analysis will become more relevant in the future.
  • The proposed rehabilitation interventions in System 1 will have a highly beneficial effect on the city, greatly reducing flooding even under pessimistic climate change scenarios (reductions of nearly 90% for the proposed system under future conditions (2100), for a 10-year return period event).
Correlation between rainfall and storm surge effects (which is likely to occur in the region) can affect the risk profile. In the future, it may be interesting to analyse the statistical behaviour of rainfall and storm surge events in Maputo, possibly going even further by combining that analysis with the use of a 1D-2D coupled model and taking into account overland flows, inlet behaviour, and risks of partial clogging (e.g., sedimentation) on the overall performance of the system.

Author Contributions

Conceptualization, J.S.M. and F.F.; methodology, J.P.M., F.F. and D.M.; numerical simulations, J.P.M.; characterization of sea level variations, D.M.; Writing and Editing, J.P.M., F.F. and D.M. All authors have read and agreed to the published version of the manuscript.

Funding

This research received no external funding.

Institutional Review Board Statement

Not applicable.

Informed Consent Statement

Not applicable.

Data Availability Statement

Due to the private nature of the work, the authors are not allowed to share research data.

Acknowledgments

The authors thank Conselho Municipal de Maputo for making this study possible. The authors are grateful for the Foundation for Science and Technology’s support through funding UIDB/04625/2020 from the research unit CERIS.

Conflicts of Interest

The authors declare no conflict of interest.

Appendix A

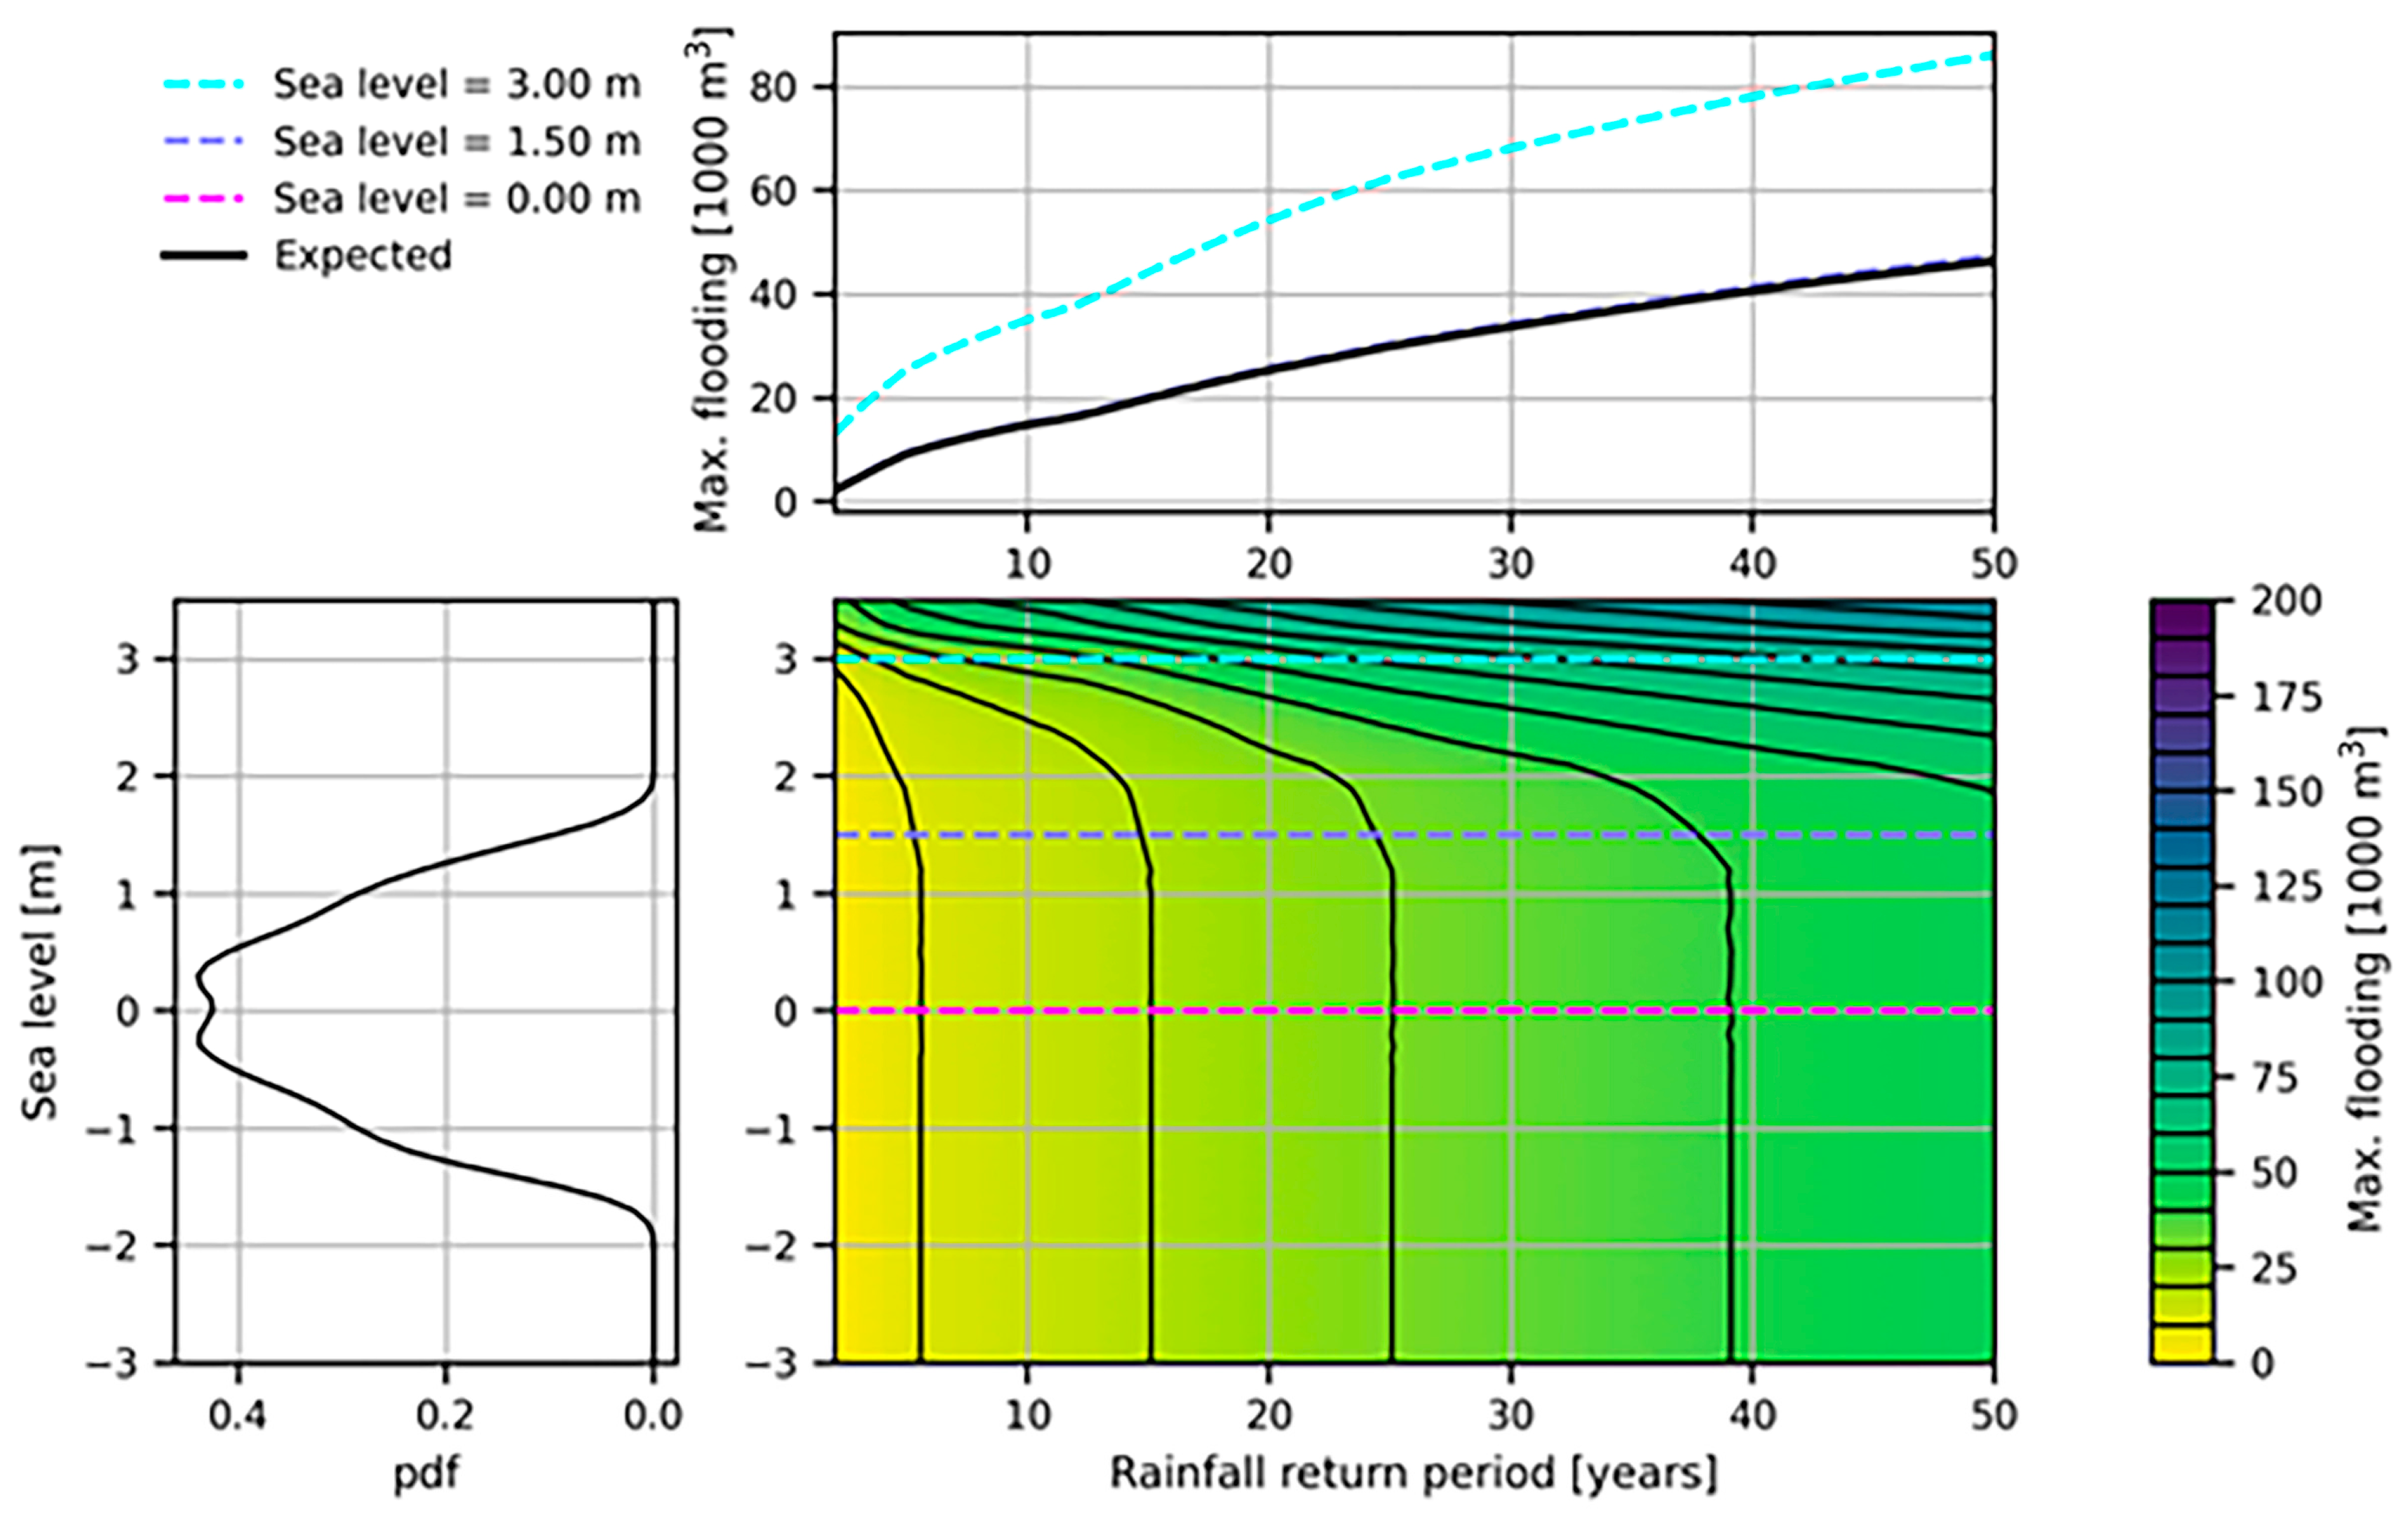
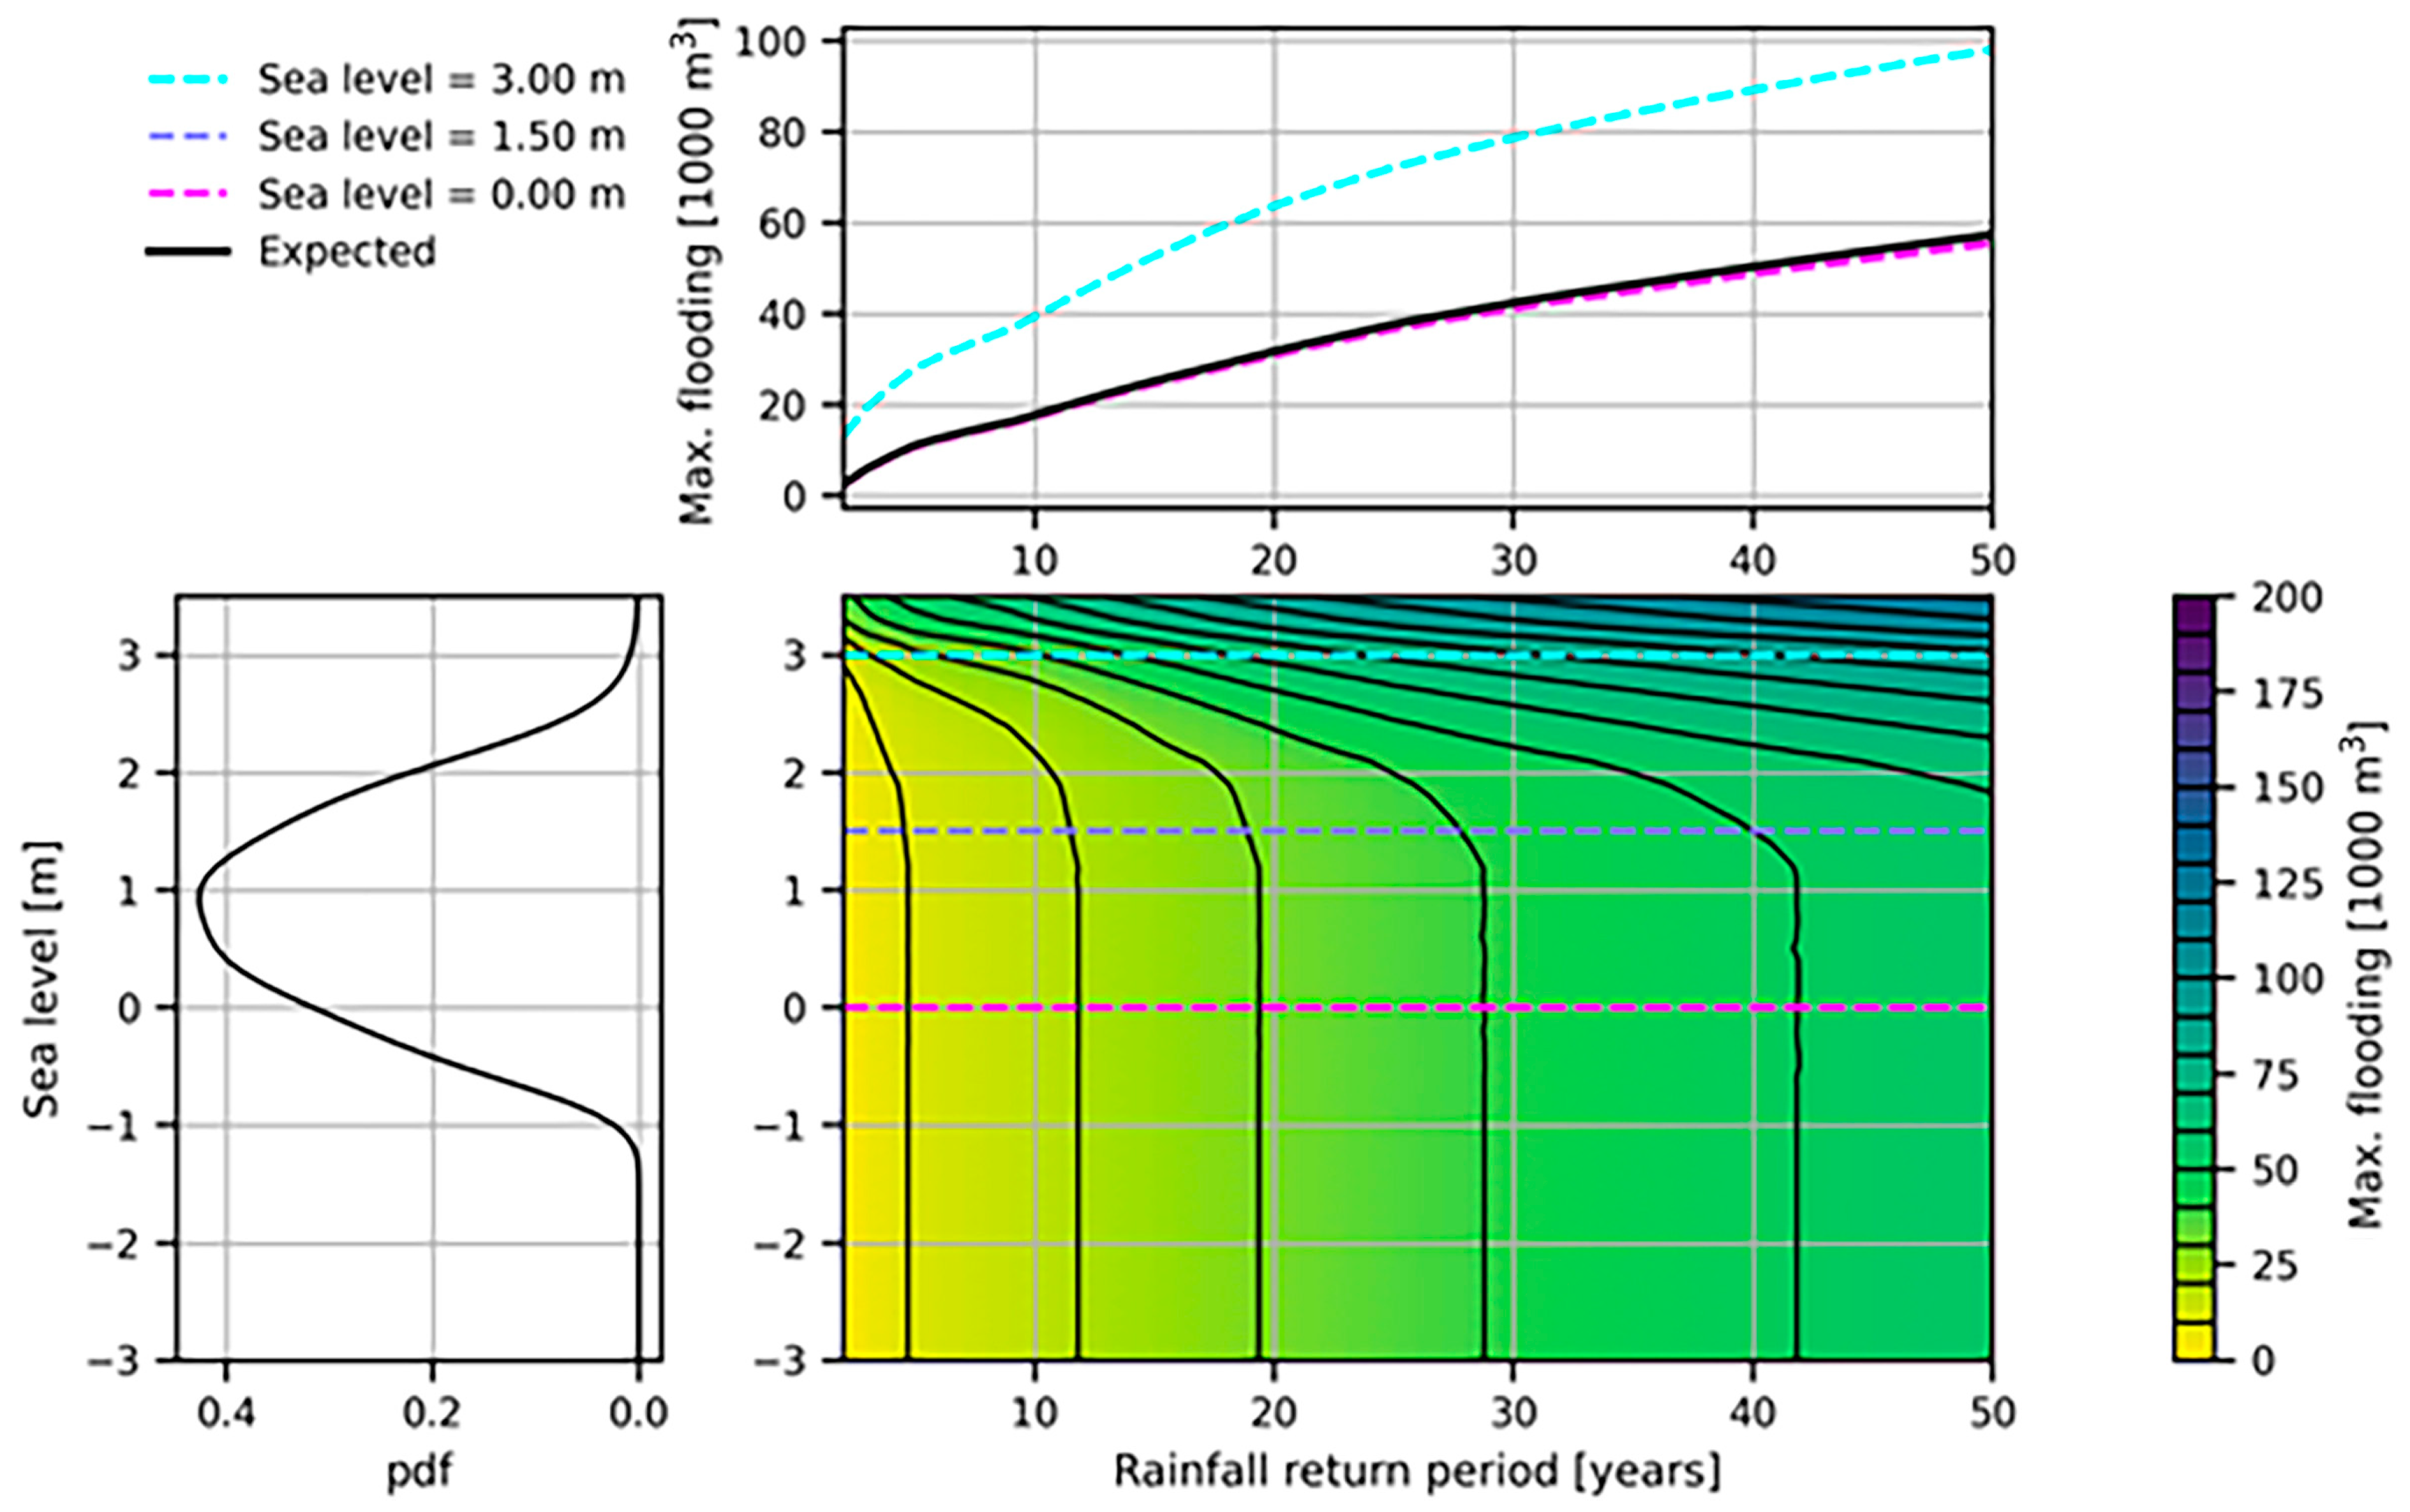
Below, additional results that quantify flooding in terms of maximum inundated volume (alternatively to results that integrate volume and time, used in the main body of the article) are reproduced (Figure A1, Figure A2, Figure A3 and Figure A4). These figures match the ones presented in Section 4.1 and Section 4.2 (Figure 10, Figure 11, Figure 12 and Figure 13).
Figure A1. Maximum flooding for the existing system as a function of rainfall intensity and sea level under present conditions.
Sustainability 15 14497 g0a1
Figure A2. Maximum flooding for the existing system as a function of rainfall intensity and sea level under future conditions (2100, RCP 8.5).
Sustainability 15 14497 g0a2
Figure A3. Maximum flooding for the projected system as a function of rainfall intensity and sea level under present conditions.
Sustainability 15 14497 g0a3
Figure A4. Maximum flooding for the projected system as a function of rainfall intensity and sea level under future conditions (2100, RCP 8.5).
Sustainability 15 14497 g0a4

References

  1. Rentschler, J.; Salhab, M.; Jafino, B.A. Flood Exposure and Poverty in 188 Countries. Nat. Commun. 2022, 13, 3527. [Google Scholar] [CrossRef] [PubMed]
  2. Hallegatte, S.; Green, C.; Nicholls, R.J.; Corfee-Morlot, J. Future Flood Losses in Major Coastal Cities. Nat. Clim. Change 2013, 3, 802–806. [Google Scholar] [CrossRef]
  3. Sousa, V.; Ferreira, F.M.; Meireles, I.; Almeida, N.; Saldanha Matos, J. Comparison of the Inspector and Rating Protocol Uncertainty Influence in the Condition Rating of Sewers. Water Sci. Technol. 2014, 69, 862–867. [Google Scholar] [CrossRef] [PubMed]
  4. Matias, N.M.; Matos, J.S.; Ferreira, F. Hydrogen Sulfide Gas Emission under Turbulent Conditions—An Experimental Approach for Free-Fall Drops. Water Sci. Technol. 2014, 69, 262–268. [Google Scholar] [CrossRef]
  5. Hsiao, S.-C.; Chiang, W.-S.; Jang, J.-H.; Wu, H.-L.; Lu, W.-S.; Chen, W.-B.; Wu, Y.-T. Flood Risk Influenced by the Compound Effect of Storm Surge and Rainfall under Climate Change for Low-Lying Coastal Areas. Sci. Total Environ. 2021, 764, 144439. [Google Scholar] [CrossRef] [PubMed]
  6. Gold, A.; Anarde, K.; Grimley, L.; Neve, R.; Srebnik, E.R.; Thelen, T.; Whipple, A.; Hino, M. Data from the Drain: A Sensor Framework That Captures Multiple Drivers of Chronic Coastal Floods. Water Resour. Res. 2023, 59, e2022WR032392. [Google Scholar] [CrossRef]
  7. Lian, J.; Xu, H.; Xu, K.; Ma, C. Optimal Management of the Flooding Risk Caused by the Joint Occurrence of Extreme Rainfall and High Tide Level in a Coastal City. Nat. Hazards 2017, 89, 183–200. [Google Scholar] [CrossRef]
  8. Tang, B.; Gallien, T.W. Predicting Compound Coastal Flooding in Embayment-Backed Urban Catchments: Seawall and Storm Drain Implications. J. Mar. Sci. Eng. 2023, 11, 1454. [Google Scholar] [CrossRef]
  9. Zscheischler, J.; Westra, S.; van den Hurk, B.J.J.M.; Seneviratne, S.I.; Ward, P.J.; Pitman, A.; AghaKouchak, A.; Bresch, D.N.; Leonard, M.; Wahl, T.; et al. Future Climate Risk from Compound Events. Nat. Clim. Change 2018, 8, 469–477. [Google Scholar] [CrossRef]
  10. Gallien, T.; Kalligeris, N.; Delisle, M.-P.; Tang, B.-X.; Lucey, J.; Winters, M. Coastal Flood Modeling Challenges in Defended Urban Backshores. Geosciences 2018, 8, 450. [Google Scholar] [CrossRef]
  11. Kourtis, I.M.; Tsihrintzis, V.A. Adaptation of Urban Drainage Networks to Climate Change: A Review. Sci. Total Environ. 2021, 771, 145431. [Google Scholar] [CrossRef] [PubMed]
  12. Shirzaei, M.; Freymueller, J.; Törnqvist, T.E.; Galloway, D.L.; Dura, T.; Minderhoud, P.S.J. Measuring, Modelling and Projecting Coastal Land Subsidence. Nat. Rev. Earth Environ. 2021, 2, 40–58. [Google Scholar] [CrossRef]
  13. Hammond, W.C.; Blewitt, G.; Kreemer, C.; Nerem, R.S. GPS Imaging of Global Vertical Land Motion for Studies of Sea Level Rise. J. Geophys. Res. Solid Earth 2021, 126, e2021JB022355. [Google Scholar] [CrossRef]
  14. Lai, Y.; Li, J.; Gu, X.; Liu, C.; Chen, Y.D. Global Compound Floods from Precipitation and Storm Surge: Hazards and the Roles of Cyclones. J. Clim. 2021, 34, 8319–8339. [Google Scholar] [CrossRef]
  15. Conselho Municipal de Maputo Projeto de Transformação Urbana de Maputo. Componente 2: Revitalização do Centro da Cidade de Maputo. Diagnóstico Integrado; Município de Maputo: Maputo, Mozambique, 2021.
  16. Rossman, L.A.; Simon, M.A. Storm Water Management Model User’s Manual Version 5.2; United States Environmental Protection Agency: Cincinnati, OH, USA, 2022.
  17. Krebs, G.; Kuoppamäki, K.; Kokkonen, T.; Koivusalo, H. Simulation of Green Roof Test Bed Runoff. Hydrol. Process. 2016, 30, 250–262. [Google Scholar] [CrossRef]
  18. Engidro; Hidra; Aquapor. Plano Director de Saneamento e Drenagem da Área Metropolitana de Maputo; Município de Maputo: Maputo, Mozambique, 2016. [Google Scholar]
  19. Hidra; Consultec; Aquapor. Serviços de Consultoria Para a Revisão das Soluções de Drenagem e Saneamento, Incluindo Elaboração de Estudos, Planos e Projectos Base e Executivos Para a Baixa Da Cidade de Maputo – Fase 2; Município de Maputo: Maputo, Mozambique, 2023. [Google Scholar]
  20. Van Ormondt, M.; Nederhoff, K.; van Dongeren, A. Delft Dashboard: A Quick Set-up Tool for Hydrodynamic Models. J. Hydroinformatics 2020, 22, 510–527. [Google Scholar] [CrossRef]
  21. Neumann, J.E.; Emanuel, K.A.; Ravela, S.; Ludwig, L.C.; Verly, C. Assessing the Risk of Cyclone-Induced Storm Surge and Sea Level Rise in Mozambique; WIDER Working Paper, No. 2013/036; The United Nations University World Institute for Development Economics Research (UNU-WIDER): Helsinki, Finland, 2013. [Google Scholar]
  22. Caretta, M.A.; Mukherji, A.; Arfanuzzaman, M.; Betts, R.A.; Gelfan, A.; Hirabayashi, Y.; Lissner, T.K.; Liu, J.; Lopez Gunn, E.; Morgan, R.; et al. Water. In Climate Change 2022: Impacts, Adaptation and Vulnerability. Contribution of Working Group II to the Sixth Assessment Report of the Intergovernmental Panel on Climate Change; Cambridge University Press: Cambridge, UK, 2022; pp. 551–712. [Google Scholar]
  23. INGC Synthesis Report. In INGC Climate Change Report: Study on the Impact of Climate Change on Disaster Risk in Mozambique; INGC: Maputo, Mozambique, 2009.
  24. McKinsey & Co. Responding to Climate Change in Mozambique: Theme 3: Preparing Cities; INGC: Maputo, Mozambique, 2012. [Google Scholar]
  25. Braccio, S. Flood-Prone Areas Due to Heavy Rains and Sea Level Rise in the Municipality of Maputo; Springer Climate Series; Springer: Berlin/Heidelberg, Germany, 2014; pp. 171–185. [Google Scholar]
  26. Administração de Infra-Estruturas de Água e Saneamento de Moçambique (AIAS). Sanitation and Drainage Master Plan for the Greater Maputo Metropolitan Área; Contract No. 06/PCMC/AIAS/2014; Phase III—Feasibility Studies for Priority Solution; AIAS: Maputo, Mozambique, 2013. [Google Scholar]
Figure 1. Scheme of flooding due to combined effects in coastal storm drainage systems.
Sustainability 15 14497 g001
Figure 2. Maputo bay with the location of the study area (System 1, marked in red).
Sustainability 15 14497 g002
Figure 3. Study area (top: digital elevation map of the study area; bottom: detail showing the terrain elevation in the low area).
Sustainability 15 14497 g003
Figure 4. Schematic view of the drainage system. Top: existing system; Bottom: proposed system.
Sustainability 15 14497 g004
Figure 5. I-D-F curves adopted for the Maputo region.
Sustainability 15 14497 g005
Figure 6. Design storm hyetograph adapted to the Maputo region.
Sustainability 15 14497 g006
Figure 7. Astronomical tidal time series obtained at Lourenço Marques station from Delft Dashboard. Illustration of a spring–neap cycle starting from 6 September 2009.
Sustainability 15 14497 g007
Figure 8. Adopted distribution of future mean sea level by 2100 (RCP 8.5).
Sustainability 15 14497 g008
Figure 9. Future tidal time series with and without mean sea level uncertainty by 2100 (RCP 8.5).
Sustainability 15 14497 g009
Figure 10. Flooding for the existing system as a function of rainfall intensity and sea level under present conditions.
Sustainability 15 14497 g010
Figure 11. Flooding for the existing system as a function of rainfall intensity and sea level under future conditions (2100, RCP 8.5).
Sustainability 15 14497 g011
Figure 12. Flooding for the projected system as a function of rainfall intensity and sea level under present conditions.
Sustainability 15 14497 g012
Figure 13. Flooding for the projected system as a function of rainfall intensity and sea level under future conditions (2100, RCP 8.5).
Sustainability 15 14497 g013
Figure 14. Reduction in flooding. Proposed system under future conditions (2100, RCP 8.5) vs. existing system under present conditions.
Sustainability 15 14497 g014
Figure 15. Drainage pipe A.
Sustainability 15 14497 g015
Figure 16. Longitudinal profile of a drainage pipe A under different rainfall and sea level conditions. Situation 50 min after the start of the rainfall event. Proposed system.
Sustainability 15 14497 g016
Figure 17. Flooding for the projected system as a function of rainfall intensity and sea level under future conditions (2100, RCP 8.5). Compound flooding area.
Sustainability 15 14497 g017
Table 1. I-D-F coefficients adopted for Maputo (adapted from Decree-Law no. 30/2003).
Return Period [Years]ab
2534.047−0.608
5694.504−0.594
10797.384−0.587
20896.580−0.582
25930.880−0.581
501026.690−0.578
Disclaimer/Publisher’s Note: The statements, opinions and data contained in all publications are solely those of the individual author(s) and contributor(s) and not of MDPI and/or the editor(s). MDPI and/or the editor(s) disclaim responsibility for any injury to people or property resulting from any ideas, methods, instructions or products referred to in the content.