Article

A Lower Threat than I Thought: How the Analysis of the Interdependence between Risks Influences Smallholder Farmers’ Perceptions

School of Agriculture, Policy and Development, University of Reading, Reading RG6 6AR, UK
*
Author to whom correspondence should be addressed.
Sustainability 2023, 15(19), 14467; https://doi.org/10.3390/su151914467
Submission received: 26 August 2023 / Revised: 22 September 2023 / Accepted: 26 September 2023 / Published: 4 October 2023
(This article belongs to the Special Issue Agribusiness and Rural Development)

Abstract

:
Smallholder farming businesses are exposed to numerous risks which significantly affect productivity, income, and farmers’ livelihoods. These risks are interdependent in nature and co-occur, which makes managing a single risk in isolation an inadequate approach. This study examined how the analysis of the interdependence between risks can influence farmers’ perceptions of risk. The study employed focus group discussions and participatory activities, which involved the use of Scored Causal Diagrams (SCDs) to analyse risks with farmers and assess changes in perception. The results showed that the analysis of the interdependence between risks influenced a change in perceptions of risk for farmers, by enabling farmers to identify the important risks, cause-and-effect relationships between risks, and the root causes of risks. This also led to changes in the farmers’ own perceived ability to manage these risks. The analysis of the interdependence between risks provides insight into the design of holistic approaches for the management of risks. It enables farmers to identify the cause-and-effect relationships between risks, identify risks which contribute substantially to hindering their farming goals, and identify entry points for managing multiple interdependent risks. A unique contribution of this study is it presents a process for eliciting and analysing farmers’ perceptions of the interdependence between risks and explores how such analysis contributes to changes in farmers’ perceptions of individual risks. These changes in perceptions of individual risks ultimately shape farmers’ decisions about whether and how to adapt risk-management behaviour.

1. Introduction

Smallholder farming businesses are exposed to numerous risks that significantly affect farmers’ productivity, incomes, and livelihood. Risk can be defined as the uncertain exposure to an unfavourable event that can affect an individual’s welfare, leading to adversity and loss [1,2]. Risks in smallholder farming can result from several sources, such as natural abiotic and biotic factors, weather variations, volatile prices of agricultural products, reduction of usable land for farming, changing consumer tastes for agricultural products, adoption of new technologies, and changes in policies resulting from regional and international competition. These risks can be categorized into five main groups, namely: production, market, financial, personal, and institutional risks [1,2,3]. Production risks are risks that are associated with and affect the production of a farm, whereas market risks are those associated with changes in the buying and selling of agricultural inputs and products. On the other hand, financial risks are the risks associated with changes in the way a farm is financed, while institutional risks are those that are associated with changes in policies that affect the ownership, access, and management of agricultural resources and activities by farmers. Lastly, personal risks, which are also referred to as human risks, are risks associated with the health of the person or people managing a farm. These risks are interdependent in nature [4,5,6], which makes the management of risks in smallholder farming a complex process. This interdependent nature of risks has resulted in the need for incorporating the analysis of the interdependence between risks in the design and use of risk-management approaches for smallholder farmers [4,5,7,8,9].
Risk management refers to the ‘systematic application of management policies, procedures, and practices to the tasks of identifying, analysing, assessing, treating, and monitoring risks’ [2]. Risk-management behaviour, which includes the decision of whether or not to use a particular risk-management strategy, is largely influenced by one’s perception of risk [10,11,12,13]. Therefore, to understand how the analysis of the interdependence between risks can influence risk-management behaviour, the effect of this analysis on changing risk perceptions will be examined. This study analyses the interdependent nature between risks and investigates how the analysis influences a change in perceptions of risks among smallholder farmers. The next section of the paper reviews the key literature, identifies a research gap and presents the aims of the study.

2. Literature Review and Study Aims

2.1. Understanding Multiple Risks and Their Interdependence

Research on agricultural risks has mainly focused on understanding the perceptions and management of single types of risk, where only 15% of studies conducted from 1974 to 2019 looked at more than one type of risk [5]. Among the most studied types of risk are production and market risks [5,10], which are also reported as the most important risks as perceived by farmers [10,14]. This focus on analysis and management of single sources and single types of risk does not provide an adequate and effective risk-management approach for farmers [8,15], especially when farmers manage multiple risks at the same time [5,16]. This focus has been reported to result in a low use of risk-management strategies [17,18]. For example, studies have indicated how farmers choose not to adopt potential risk-management strategies that managed a single type of risk, because they perceived the strategies to be ineffective in managing risks of importance to them [10,19]. Similarly, others have been observed to prefer strategies that consider the management of multiple risks to those that manage single risks [18].
In addition to the repercussions of considering single risks, the sources, frequency, and severity of risks in agriculture have recently increased as a result of climate change, regional and global conflicts, and disease outbreaks. Climate change has been shown to increase the severity and frequency of agriculture risks [20,21,22], while the COVID-19 pandemic caused devastating impacts on trade in agricultural products [23,24]. Moreover, the recent wars in Ukraine and Russia exacerbated market and financial risks from changes in international trade [25,26,27]. The increasing sources of risks make agriculture more uncertain, while uncertainties in agriculture remain evident. This makes the management of risks more complex and hence a simultaneous analysis of multiple risks can enable farmers to better assess and manage risks.
Additionally, the risks in agriculture are interdependent and co-occur [4,5,9,16,28]. However, there has been limited research attempting to understand the interdependent nature of risks and the impact of this interdependence of risks on farmers’ management of risks [6,7,9].
The highlighted effect of considering a single type of risk in the risk-management behaviour of farmers, and the associated effect of the interdependence of risks on smallholder farmers’ risk management, has highlighted the need to explore holistic approaches in the analysis, assessment and management of risk [5,7,8,9,29]. In these studies, an holistic approach refers to the management of multiple risks, which considers the interdependence between risks [4,5], and considers multiple risk-management strategies involving multiple stakeholders [4,28]. Henceforth, a holistic approach to risk management requires an analysis of the interdependence between risks. This analysis can provide insight into how the different types of risks interact [9], and facilitate the identification of root causes of risks, which will enable prioritisation in risk management [7].

2.2. Changing Risk Perception as a Requisite in Changing Risk-Management Behaviour

The influence of risk perception on risk-management behaviour implies that a change in how one perceives risks could influence a change in one’s behaviour towards that risk [2,6,11,12,13,30,31]. Risk perception can be referred to an individual’s judgement of the likelihood of an unfavourable event happening and the level of concern for the associated consequences [32]. Risk perception is influenced by a number of factors, including individual demographic characteristics such as age and education [33], gender [30], and resources [34]. Risk perceptions are also said to differ according to the type of farming activity one engages in [35,36,37]. The political and cultural context of a place also influence risk perceptions [30,38]. For example, in a recent study to understand the perceptions of COVID-19 risks, Dryhurst and colleagues [30] found that people in Mexico and South Korea who had a politically conservative leaning perceived higher risk perceptions of COVID-19 than those who did not, while in the United Kingdom and United States, a politically conservative leaning was associated with lower risk perception. In addition to institutional, political and conservative leanings, risk perceptions are said to be dependent on one’s knowledge about risks, where people with knowledge of the mechanisms around particular risks were shown to display perceptions that were more aligned to objective predictions about the risks than those who did not have such knowledge [38]. Moreover, people have been found to be optimistic about their chances of successfully facing a risk where they have been shown to assume that the personal effects of a risk would be more favourable to them than would be suggested by an objective prediction of the risk [39,40]. Sometimes, people tend to think that the effects of a risk will be more favourable to them than to their peers [12,41].
In addition to the individual-based characteristics that influence risk perceptions, heuristics (which are people’s techniques for estimating risks) have been shown to influence risk perception. Among the common heuristic types are representative, availability, and affect heuristics. The representative heuristic suggests that people are likely to perceive a higher chance of occurrence of event A, if event A resembles or is highly associated with event B, where B is an event familiar to people. Alternatively, the availability heuristic predicts that people are likely to perceive a higher chance of occurrence for event A, if it has ever occurred or frequently occurs in their surroundings or neighbouring surroundings, than event C, which has never occurred. The affect heuristic, on the other hand, explains why people are more likely to perceive an event as high risk following an experience of adverse effect from the risk.
Changing risk perception brings about a change in risk-management behaviour [12,42]. For example, COVID-19 studies examining the relationship between people’s perceptions of COVID-19 risks and the protective measures they took, revealed that risk perceptions were highly correlated with protective behaviour [12,30,42]. Those who perceived a low risk of contracting the virus did not take protective measures, and as risk perception increased over time, people’s behaviour also changed, where more people took up protective measures against the risk [12]. Due to this influence of risk perception in changing risk-management behaviour, it is essential to examine how an analysis of the interdependence between multiple risks would influence farmers’ perceptions of the risks. This study hypothesises that an analysis of the interdependence between risks brings about a change in farmers’ perceptions of risk. This is a requisite to changing risk-management behaviour towards an holistic management of risks.

2.3. Aims

This study aimed to analyse the interdependence between risks in smallholder farming businesses in the Singida District in Tanzania and investigate the change in perceptions of risks resulting from the analysis of the cause-and effect relationship between risks. The study was guided by the following questions: (i) What are farmers’ perceptions of the interdependence between risks? (ii) Are farmers’ perceptions of individual risks changed through analysing their interdependence? (iii) How and why are the perceptions changing?

3. Materials and Methods

3.1. Study Site

The field work in this study was conducted with support from staff of a local non-governmental organisation called Research, Community, and Organisational Development (RECODA) who work with smallholder farmers in Singida Region on various development initiatives to improve smallholder farmers’ food security and livelihoods. The cooperation with staff from RECODA was essential for this study, which required frequent engagement with farmers. This cooperation with RECODA enhanced a quick building of rapport between the researcher (corresponding author) who conducted the field activities and the farmers in the villages, which was necessary for the field work in this study.
The Singida District in Singida Region in Tanzania is characterised by a semi-arid climate, with temperatures ranging between 15 °C to 30 °C and annual average rainfall ranging between 500 mm and 800 mm. It is located between latitudes 4° and 6° below the equator and 33° and 36° east of the Greenwich meridian. Around 90% of the population in the region engage in agriculture [43], with a majority being smallholder farmers whose average farm size is 2.7 hectares [44].
The study was undertaken in two villages in the Singida District—Malolo and Mdilu villages. The two villages were noted by RECODA staff as having differing rainfall patterns, where Malolo village’s rainfall patterns were reported to be different to other neighbouring villages in the district. Farmers in the two villages practice similar farming activities, though Mdilu is commonly known for sugarcane production in the district. Given these characteristics, the two villages were selected to investigate and compare farmers’ risks analysis and perceptions, and were not expected to be a representation of the whole population of villages in the district.

3.2. Tools

The study employed multiple methods in its implementation, which included focus group discussions (FGDs), participatory activities that involved the use of Scored Causal Diagrams (SCDs) [45] and farmers scoring risks using score cards. The SCD is a tool designed to enable farmers, in collaboration with researchers and practitioners, to identify relationships between different problems, where, specifically, the causes and effects of problems and the root causes are identified and analysed. The SCDs were employed in this study to facilitate the analysis of the interdependence between risks by farmers. To develop SCDs of the interdependence between risks, elicitation of farmers’ views and beliefs on the interdependence between risks was used.

3.3. The FGD Procedure and Sampling

The focus group discussion had four main steps. The first step involved risk identification, which started off by identifying the main goals for growing maize and sunflowers, and the risks associated with these activities. The second step was farmers’ risk assessments of the identified risks in terms of the level of threat posed by each risk to the farmer. This was followed by an analysis of the interdependence between risks through Scored Causal Diagrams (SCDs). All farmers in the study participated in developing the Scored Causal Diagrams. Lastly, focus group discussions were concluded with a second farmers’ risk assessment of the identified risks. Perceptions of levels of threat posed by each risk were measured by assigning scores against the risks on a score card [33]. To enhance farmer participation in the focus groups, in each group farmers selected a note-taker who participated in drawing activities. The FGD protocol outlining the steps in analysing the interdependence between risks using Scored Causal Diagrams is provided in the list of supplementary material in this paper.
Given the objective of the study, which was to analyse the interdependence of risks with farmers, it was important to select participants who were familiar with the risks. On this basis, a criterion was used to identify and select participants for the research. The target participants in this study were farmers who had at least 5 years of experience farming in the region and lived in the village. Participation in the study was voluntary; with the support of staff from RECODA and village leaders in the respective villages, farmers were identified and invited to participate in the research. Similar to a number of studies [46,47], the purpose for involving RECODA staff and village leaders in the selection of participants for the study was so as to secure participants who were knowledgeable about risks and were willing to share their experiences and opinions effectively [48].
A focus group consisted of five to seven farmers [49]. The focus group discussions and associated activities were conducted in each village until no new information emerged from additional focus groups, which was observed as the saturation point. Eight focus groups were conducted in total–five in Malolo village and three in Mdilu village–which were divided into groups of men and women. The basis for the single-sex grouping was (i) to enhance an open discussion between participants, following the observation during piloting the data collection that men dominated the discussions in the focus groups, while women seemed more hesitant to speak in the groups with men than in all-women groups, and (ii) to compare men and women’s perceptions of the interdependence between risks. In addition, for easy facilitation and engagement of the focus group discussions, the groups of women and men were further split by age (Table 1) into: (i) participants below 50 years of age, which were referred to as the ‘young’ groups and (ii) participants above 50 years of age, which were referred to as the ‘elderly’ group. The number of focus groups observed at saturation point in each village is consistent with a number of studies who reported that three to four focus groups were sufficient to identify most of the codes and prevalent themes in a community [50,51]. In addition, given the grouping by sex and age, Hennink and colleagues [51] add that having two groups for each grouping is sufficient to capture most of the themes in the data. In total, eight focus groups were conducted in this study and a total of 46 farmers participated in the study: 23 men and 23 women.
The age range of the farmers was between 20 years and 67 years. All farmers who took part in the study could speak, write, and read Swahili (local language), except for three farmers. The three farmers who could not read or write were supported by a research assistant to discuss and assign scores to the risks they faced. Although their participation was limited, they were able to follow through the analysis of the interdependence of risks and provided meaningful contributions to the discussions.

3.4. Data Collection and Analysis

The data collected from focus group discussions and the analysis plan are summarised in Table 2. The scores on a Scored Causal Diagram represented the relative importance of a risk in contributing to other risks in the diagram. Farmers’ individual scores for a risk represented the level of threat of the risk to the farmer. The data collection was conducted by the researcher and a research assistant, who interchangeably facilitated the focus group discussions and participatory activities, and who observed the data collection.
A mix of qualitative and quantitative methods were employed to analyse the collected data from focus groups, which included: descriptive analysis, thematic analysis, and network analysis (Table 2). The descriptive analysis was conducted on farmers’ scores of levels of threats from risks to assess the proportion of change in perceptions of risk as a result of the analysis of the cause–effect relationship between risks. The descriptive analysis was also applied to comparing and providing a summary of the risks identified before and after analysing the interrelations between risks.
Thematic analysis was conducted on the transcripts generated from audio recordings of the focus group discussions, where the reasons for farmers’ changes in scores and farmers’ testimonials of what they learnt from the exercise were analysed. The thematic analysis was conducted as follows. Firstly, the transcripts were reviewed for familiarity and to understand the structure of the data. This was then followed by an identification of common patterns in the data, which was termed as a first coding of the data. The themes were then reviewed for a second time to determine similarities and to confirm their distinctiveness. This involved re-coding and de-coding of themes. The purpose of this analysis was to get insight into the factors that influenced the change in perceptions of risk from the exercise and identify relationships between the factors [52].
A network analysis was applied to understand farmers’ perceptions of the interdependence between risks. This analysis was aimed at answering the following questions: (i) what risks are considered as important in the SCDs? (ii) are farmers’ perceptions of the interdependence between risks the same among the farmers? and (iii) what are the strongest links between risks as determined by farmers?
The network analysis began by organising and transferring the data in the eight SCDs into an Excel file in preparation for analysis. A descriptive analysis was then conducted to calculate the weighted scores of each risk and risk-causing factor (also referred to as nodes in a SCD), and the weighted scores of the links between risks in the SCDs as described by Burn [53]. The nodes and links from each SCD were then merged to form a combined SCD representing the analysis of the 46 farmers.
Field notes were synthesised as described by Corwin and Clemens [54]. Apart from acting as reference points for improving the data collection process in the field, field notes were documented to provide a methodological insight into the process of understanding the interdependence between risks, specifically through expert beliefs.

3.5. Defining Boundaries of Analysis of the Interdependence between Risks

Before beginning the analysis of the interdependence of risks, boundaries to the risk-analysis process were set. Maize and sunflower were selected for analysis because they are crops mostly grown in the region for food and income, respectively [55]. Farmers’ objectives for growing maize and sunflower were then identified to aid the process of risk analysis. Farmers identified the main objectives as (i) to get enough food for the family and (ii) to get income from the sale of sunflower and maize surplus. To facilitate the analysis of the interdependence between risks, these two objectives were phrased as problems [45] such as ‘not getting enough food for the family’ and ‘loss of income from sale of sunflower and maize’, respectively. These two phrased problems in maize and sunflower farming were referred to as ‘end-problems’.

4. Results

4.1. Perceptions of the Interdependence between Risks

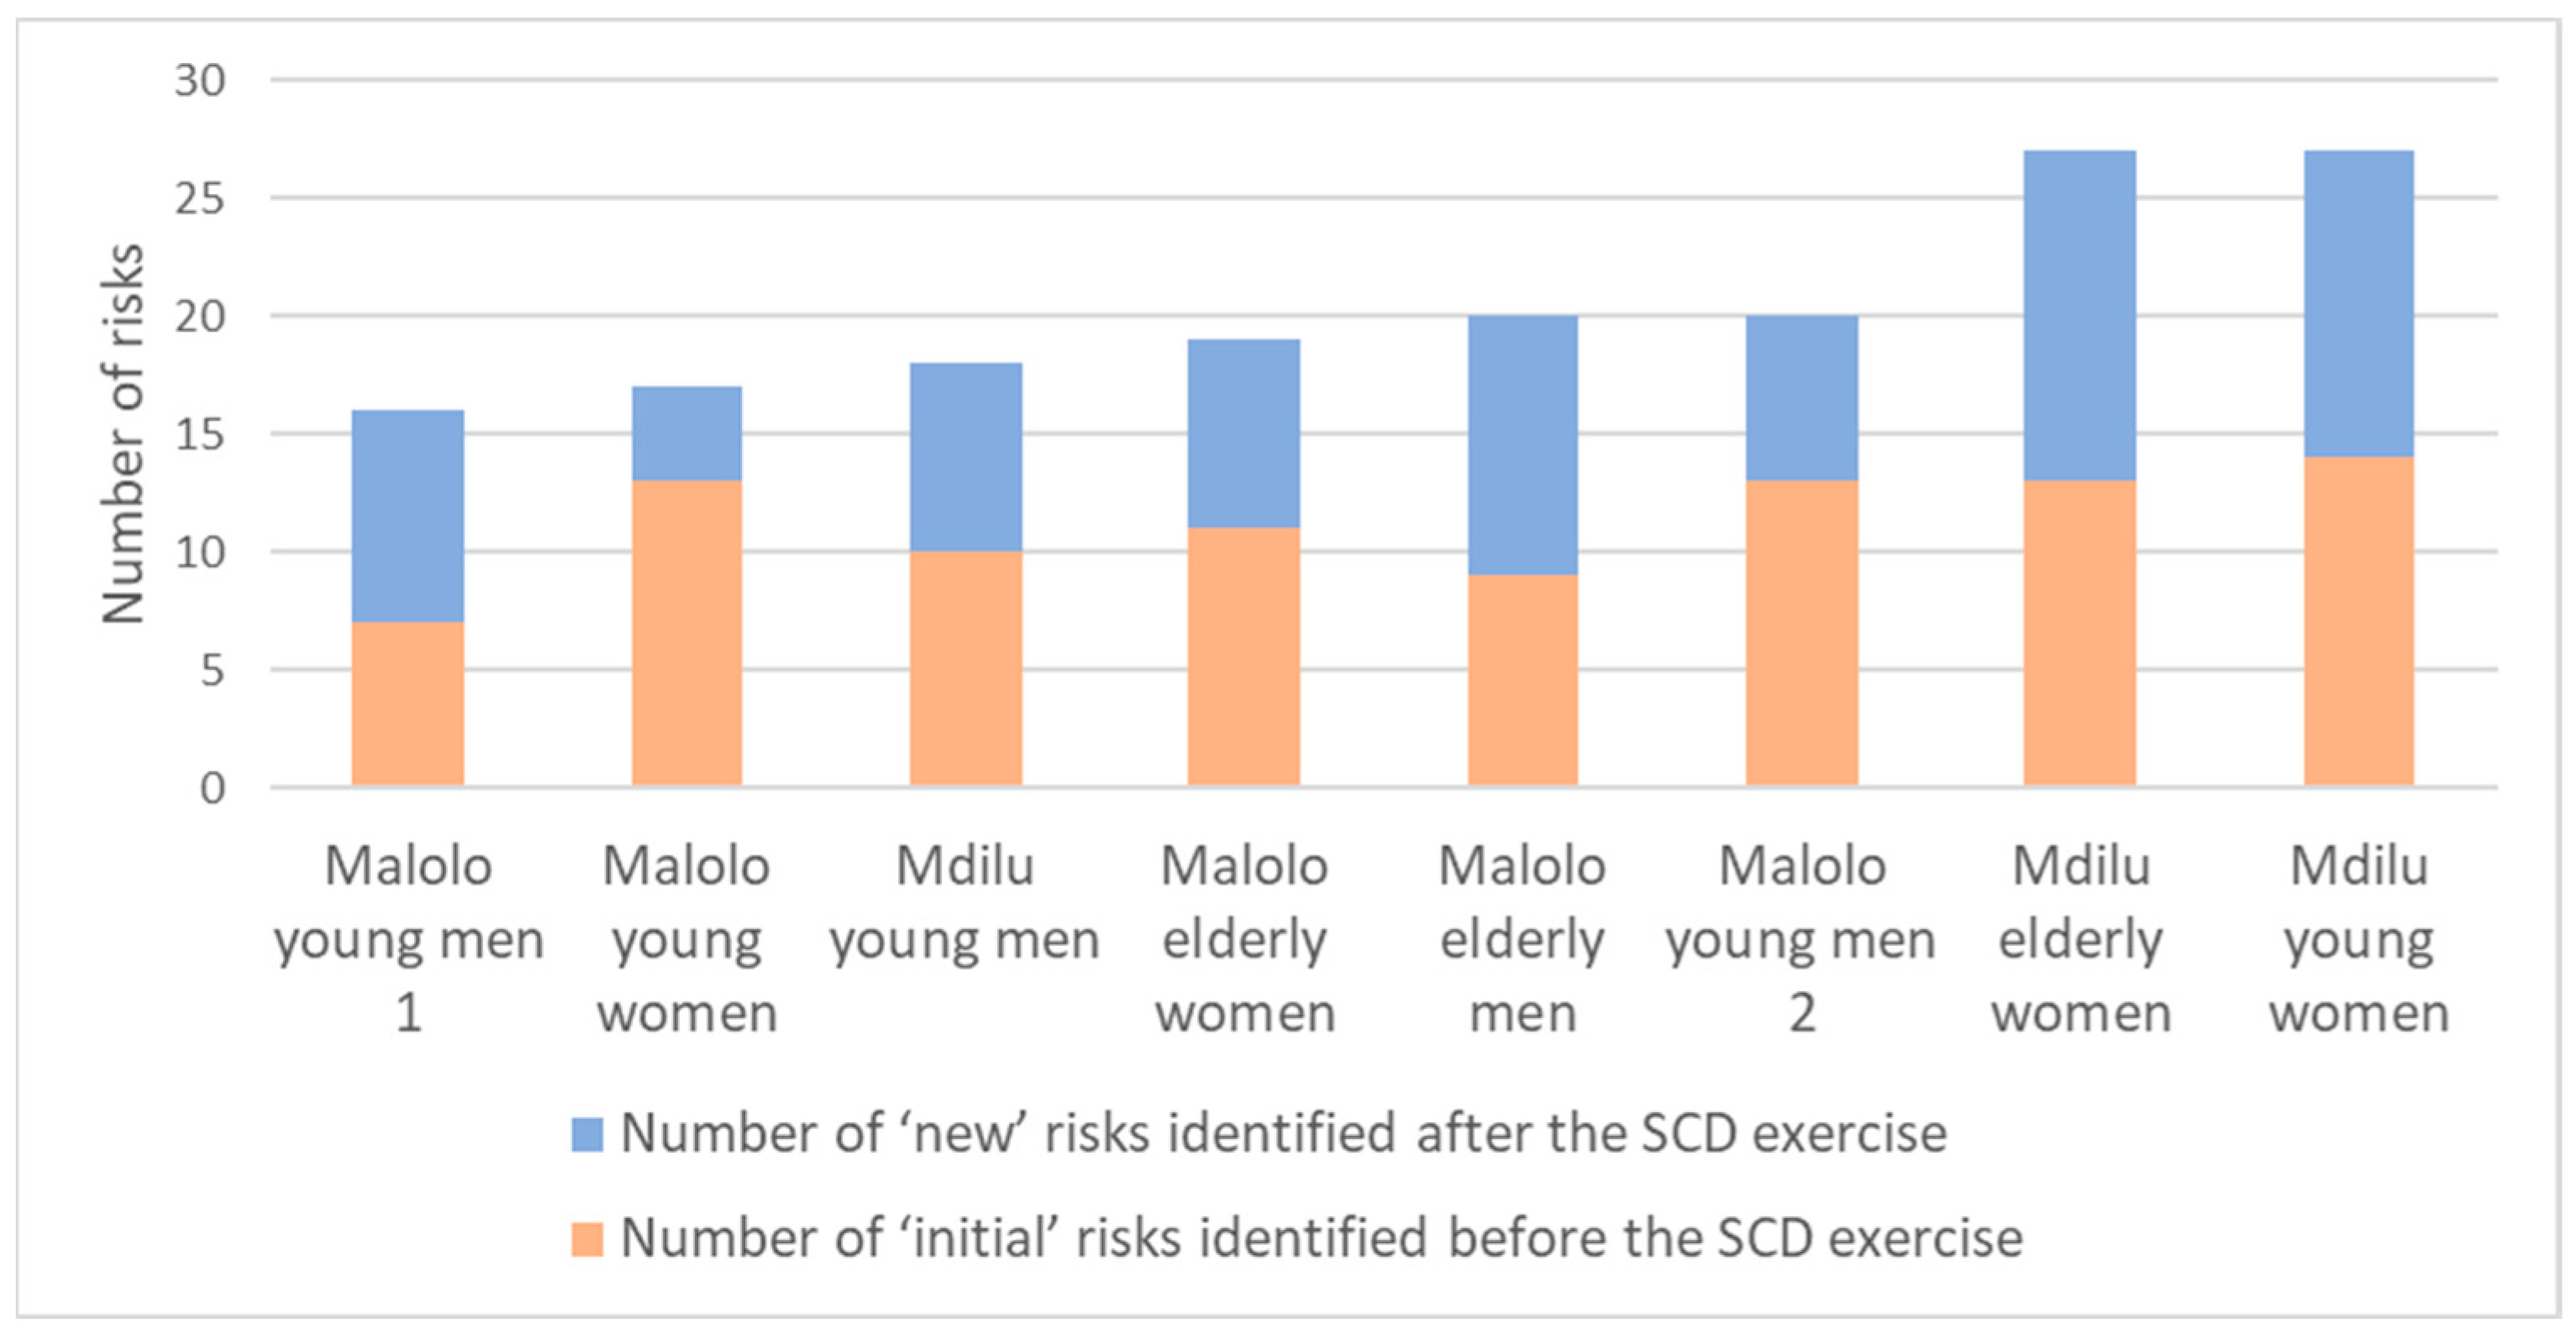
4.1.1. Risk Identification

Farmers identified several risks in maize and sunflower farming during the analysis of the interdependence of risks (Figure 1 and Figure 2). During the analysis of the interdependence of risks, there were factors that were perceived to cause risks, but which cannot be categorised as risks. For example, ‘infertile soils’, which was identified by farmers as a constant feature in the farmers’ context, would not be referred to as a risk in the context of this study since it is constant throughout the seasons and its outcomes are certain. Farmers in the group noted that, without applying appropriate strategies to improve soil fertility, the end outcome will be crop failure and low production. This lack of the uncertainty component in this factor [1,2], nullifies it as a risk. In this study, we categorised this factor as a ‘non-risky’ factor. In contrast, however, as an example, late planting (whose occurrence and possible adverse effects change from one season to another) is referred to here as a risk because of the uncertainty component associated with it.
The steps involving the analysis of the interdependence between risks included identifying risks before and during the SCD development. In all of the eight focus groups, the number of risks identified increased during the analysis with the addition of new risks and non-risky factors. Not a single risk from the list of risks identified before the SCD development was omitted.
In addition, four types of risks were identified in the network analysis, which are: production risks, market risks, financial risks, and personal risks (Figure 3). Production and market risks were the most dominant risks in terms of their frequency (number of risk types in the network) and relative importance (size of nodes) in the SCD. These were followed by financial risks, while personal risks were the least dominant in the network.

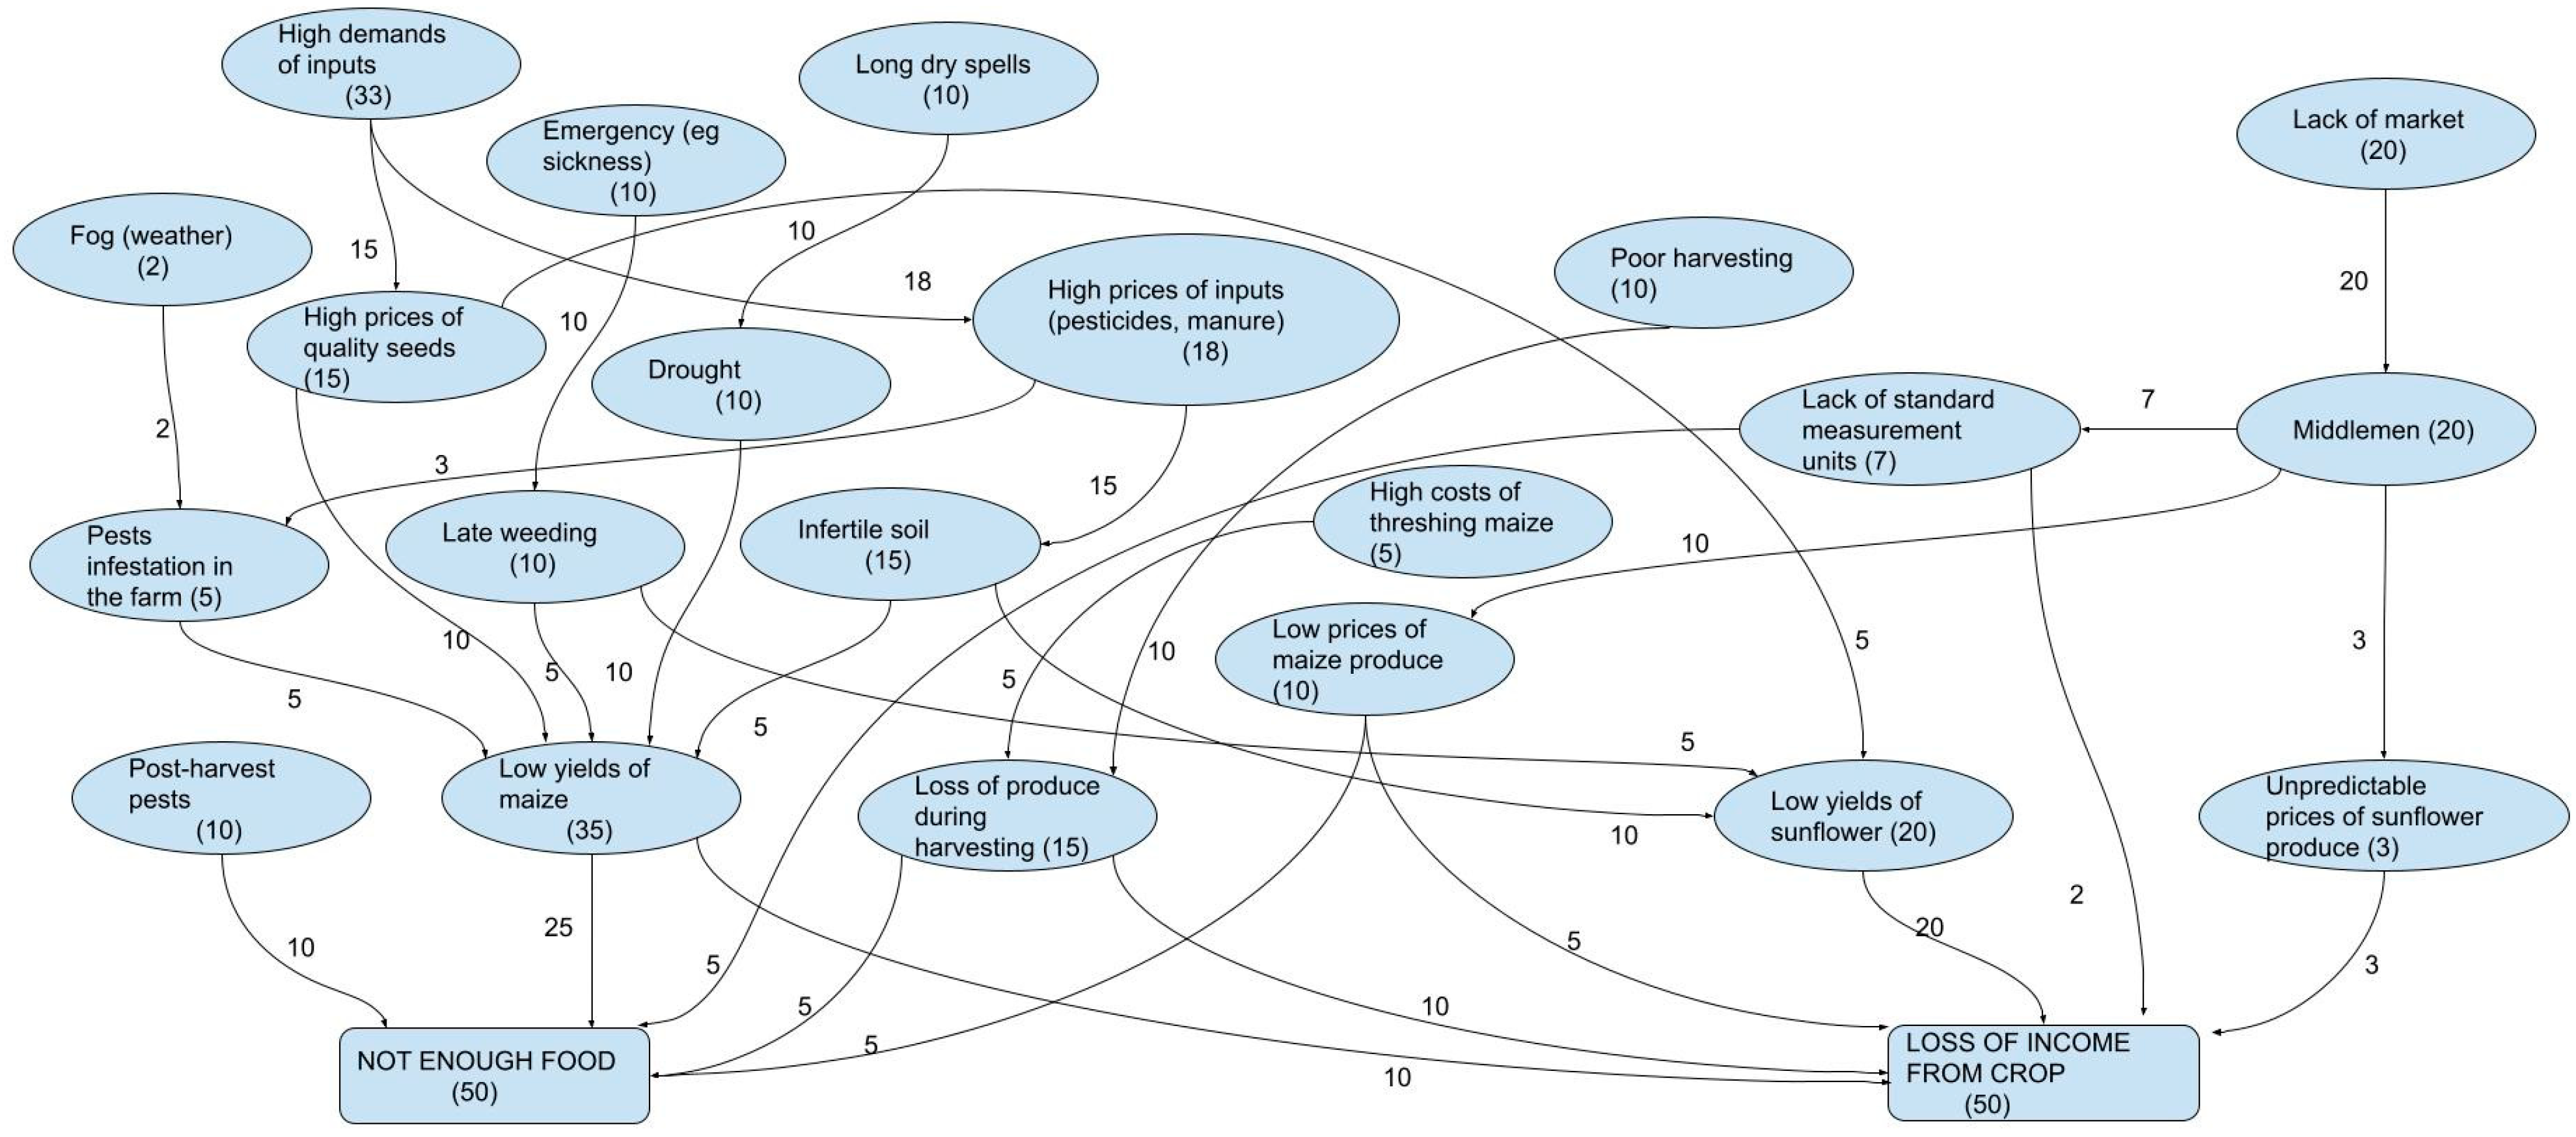
4.1.2. How do Risks Relate?

The network analysis revealed an interdependence relationship between the four risk types identified in the study (Figure 3). For example, there were links between production and market risks, where it was shown that the risk of high prices of inputs contributed to the risk of late planting, which consequently contributed to the risk of low yields of maize. There were also links between financial and market risks, where limited sources of income contributed to the risk of low prices for sunflower produce. Links were also observed between financial and production risks such that high threshing costs were shown to result in the risk of loss of crop produce after harvest, while limited labour access contributed to the risk of late weeding. The network analysis also revealed a relationship between personal risks and production risks such as the risk of sickness contributing to the risk of late weeding, which contributed to the risk of low yields in maize and sunflower. The weight of the links between risks (displayed by the size of an arrow in Figure 3), which represents the strength of the relationships, differed, where some links had more weight than others.

4.1.3. Which Are the Important Root Causes of Risks?

The network analysis showed that the important root causes of risks in farming maize and sunflower (Figure 3), see the nodes on the edges without arrows directed to it) are: distance to market, poor post-harvest management, high demand of inputs during the farming season, limited agro-input shops, counterfeit inputs, heavy rains, limited sources of income, long distance to the farm, and a lack of a market place to sell crops produce. These root causes of risks directly affect the occurrence and effect of the risks directly linked to them. However, through the cause-and-effect relationship between risks represented in the network (Figure 3), the root causes become the source of many other risks in maize and sunflower farming.

4.1.4. Which Are the Important Risks Hindering Farming Goals?

The weighted scores of risks and non-risky factors from the network analysis of eight SCDs found that risks had varying levels of contribution in causing farmers to not attain their farming goals (Figure 4), which are (i) to get enough food for the family and (ii) to get income from the sale of sunflower and maize surplus. The range of the weighted scores of the risks was between 0.1 and 40.5 (out of 100), while the average weighted score of the risks was 4.6. Considering the average weighted score (4.6) as the benchmark of identifying risks with a relatively high contribution in causing farmers to not attain their farming goals, 19 risks (including non-risky factors) were identified. In order of importance, the risks include: the risks of low yields of maize, low yields of sunflower, postharvest pests, high prices of inputs, low prices for sunflower produce and low prices for maize produce. Other risks include: the risks of limited access to seeds, long dry-spells, loss of crop produce after harvesting, pest infestation in maize, stunted growth, the risk of counterfeit inputs and the risk of late weeding (Figure 4). The full list and weighted scores of risks and non-risky factors are provided in Table A1 in Appendix A.

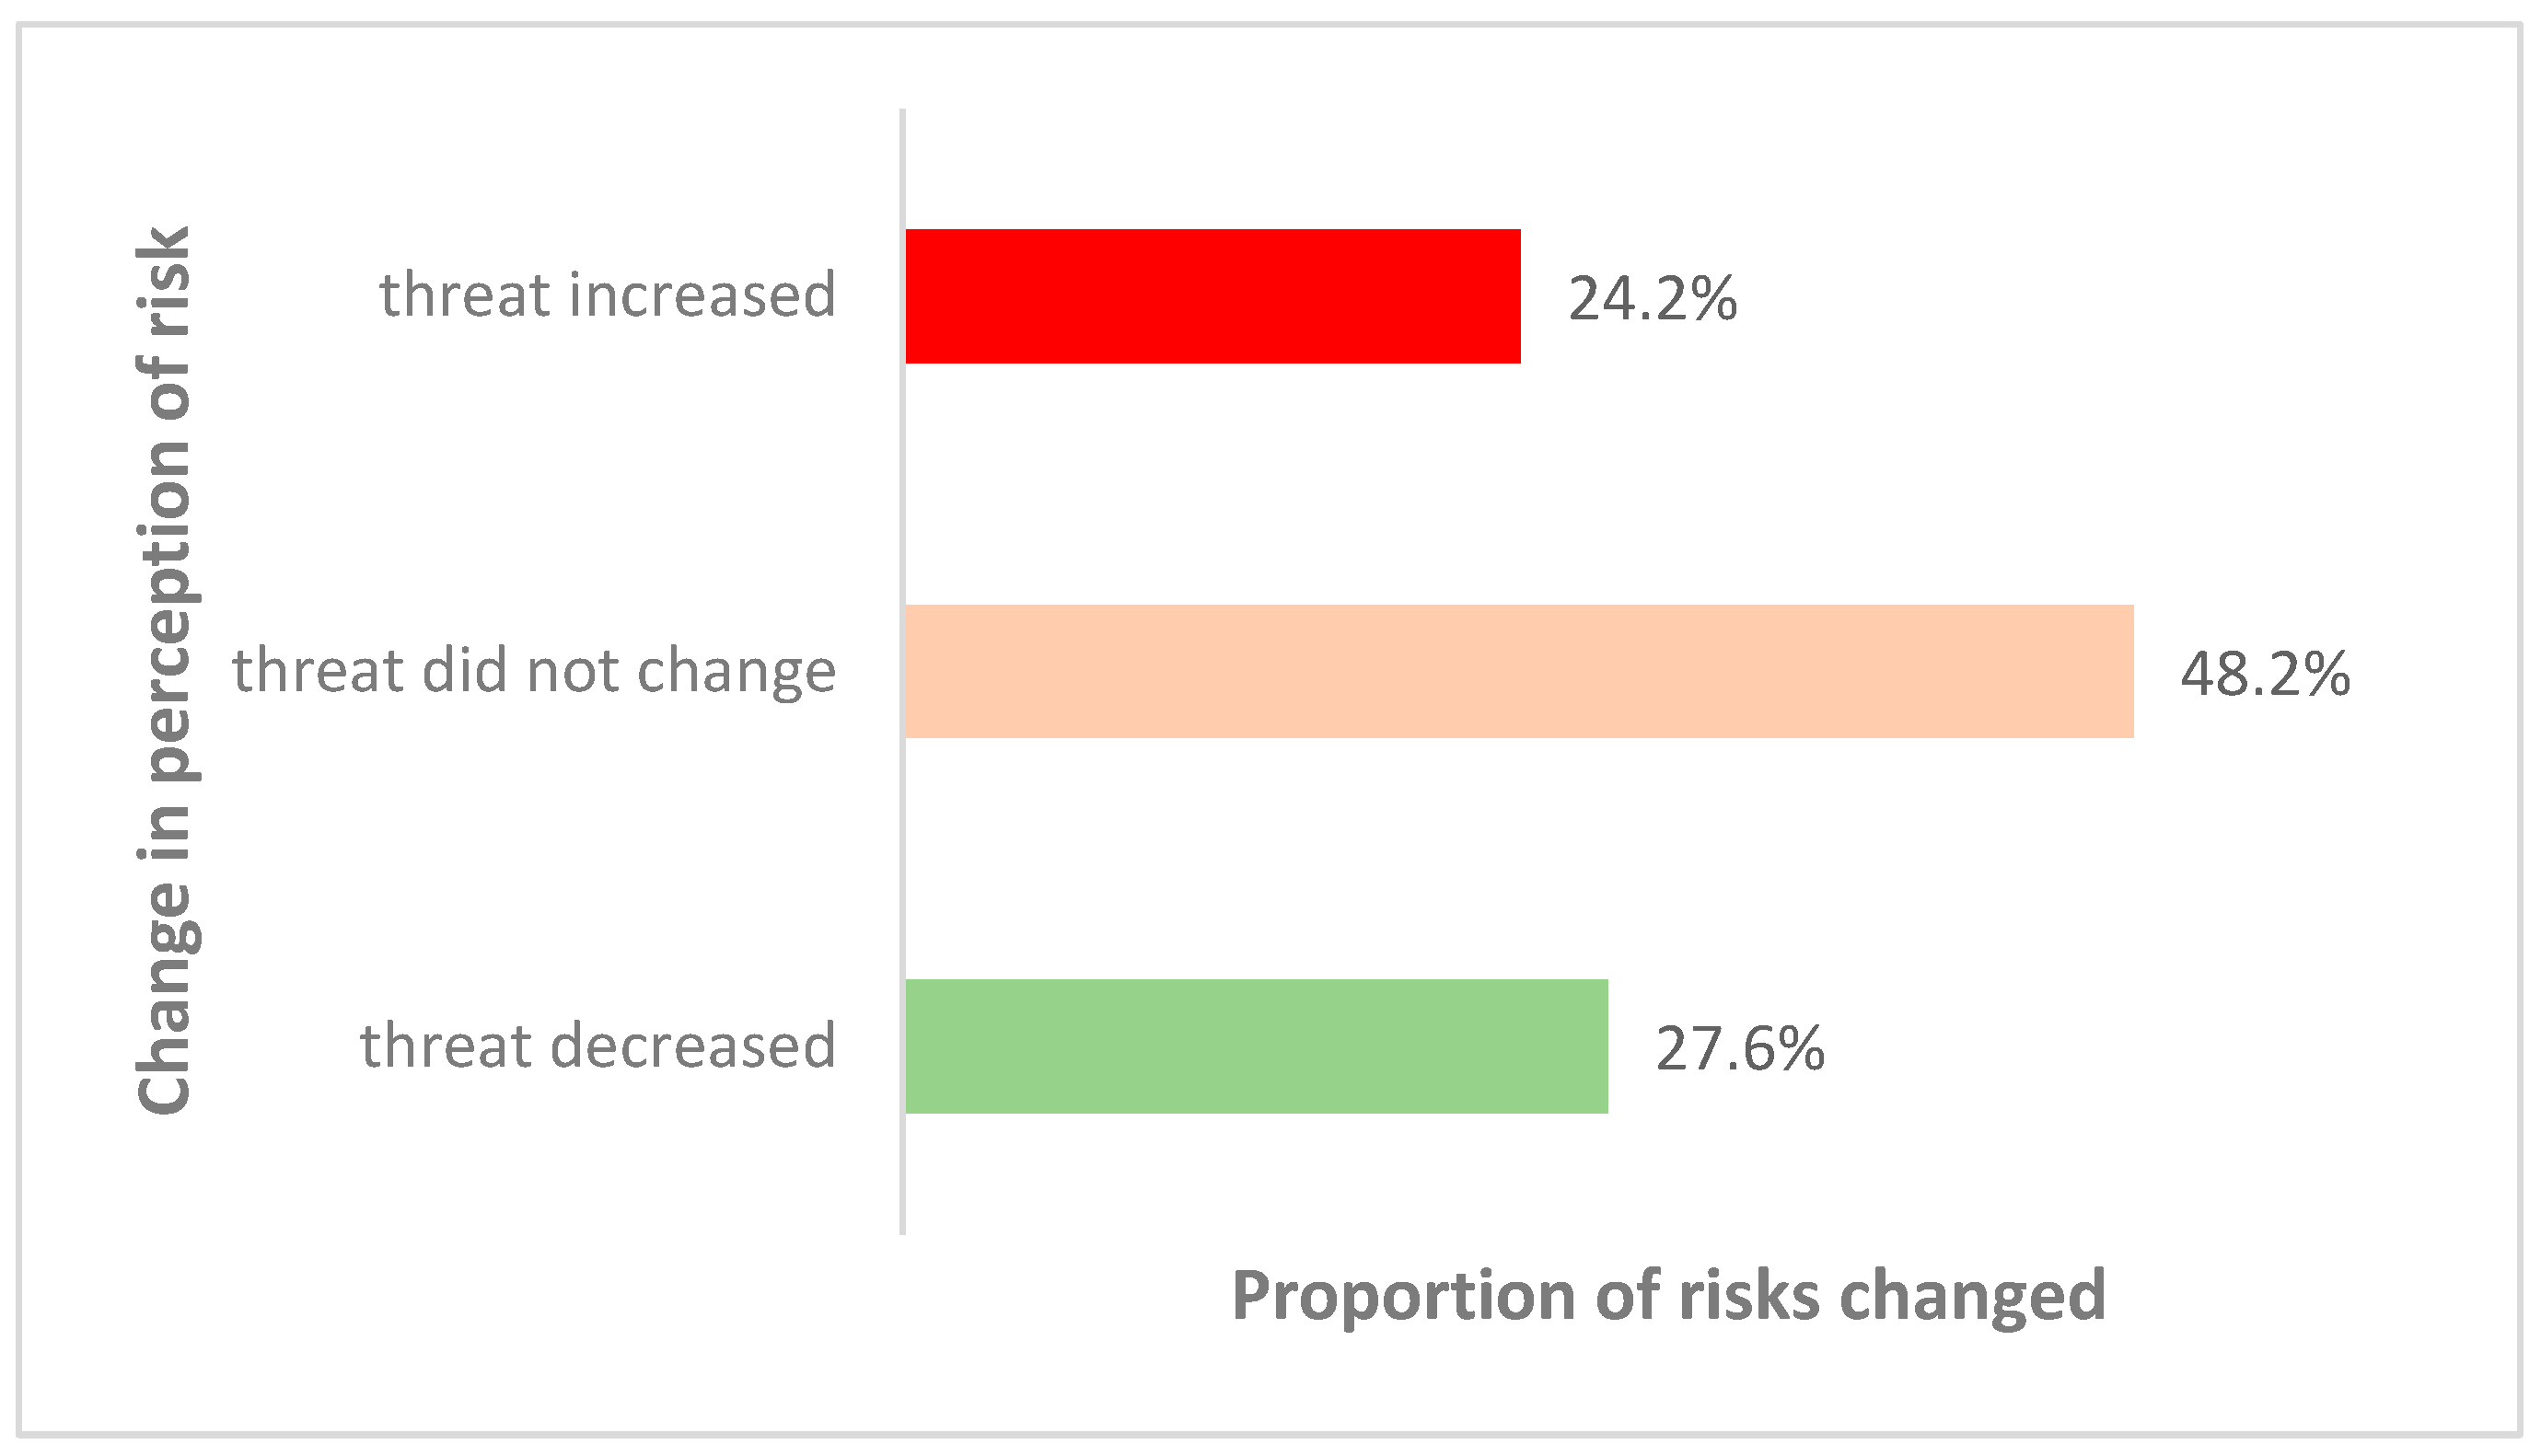
4.2. Change in Risk Perceptions

4.2.1. What Change Happened?

The analysis of the interdependence between risks led to farmers changing some of the individual scores for risks. This change in farmers’ individual scores of risks implied a change in how they perceived the threat of the risk to them [33].
A descriptive analysis conducted on individual scores collected before and after the exercise revealed that, in each group, at least one farmer changed one risk following the analysis, except for one men’s group in Malolo village, who did not change the score for any risk identified before the analysis (Table 3). The reason given by the Malolo elderly men’s group for not changing scores for initial risks was that risks were unpredictable (that is, the effects of risks are different every time). This reason was initiated by one farmer in the group who loudly commented, “You can change a score today and tomorrow the problem comes back or gets worse…therefore there is no need to change the scores, let them (the scores) stay as they are now”. Hearing this comment, the rest of the farmers in the group agreed with it and followed suit by not changing their scores. There are three possible interpretations for this group’s decision. One is that the decision by the group could be a result of the comment by that single farmer, who observably had an influence on the others, hence illustrating a common but unintentional limitation of working in focus groups [56]. The second possible interpretation is that farmers followed suit to shorten the focus group discussion time since the discussion had lasted three hours and had started just past noon. A third interpretation is that, before a risk occurs, farmers would have a general perception of its threat based on their own criteria for assessing risks, and that a reassessment of the threat of the risk would only make sense to farmers when the risk occurs and becomes an event. It is likely that all or some of these interpretations could have influenced farmers in this Malolo group not to change their scores.
Results show that overall, 48.2% of the risks as identified by farmers were perceived the same even after the analysis of the interdependence between risks, while 51.8% of the risks were perceived differently after the analysis. Among the risks that were perceived differently, 28% of the risks were perceived as being of lower threat than initially perceived, and 24% of the risks were perceived to be of higher threat than initially perceived (Figure 5).

4.2.2. What Influenced the Change in Perceptions of Risks?

One major reason for changes in perception of risks by farmers was the understanding of the relationship between risks displayed on a SCD (Table 4). It is evident that the SCD was useful in highlighting the causes and effects of risks. This understanding enabled farmers to observe the multiple effects a risk could have. One man in Malolo village changed the score of the risk of low prices of sunflower from two (low threat) to five (very high threat) because he realized that the sales of sunflower enable him to get enough income, which could enable him to buy a diversity of food.
The second common reason for a change in perception of risks was a farmer’s perceived ability to manage a risk. Results show that farmers claimed to change their initial scores for some risks after self-assessing their ability to manage the risks during the analysis of the interdependence between risks. A risk which was perceived as difficult to manage by a farmer was given a higher score than its initial score, regardless of its score on the SCD. A risk perceived as easy to manage by a farmer was likely to be given a lower score than it was initially. The farmer self-assessment of the ability to manage a risk was achieved through two approaches, unplanned by the researchers. One approach was through a farmer examining the relationship of the risks and self-assessing how they could intervene on some of the causes of the risks. An example is shown through a quote from a young woman in Malolo who described “For low yields of maize, in the beginning I assigned it a score of four, now I have given it a score of two because it is caused by lack of fertilizer, this issue I can solve.” The second approach a farmer used to assess their ability to manage a risk was through an awareness of possible strategies during the focus group discussions from other farmers and self-assessing their ability to implement those strategies. This was well described by a young woman in Malolo village, who became aware of some strategies for managing risks through the discussion and hence reduced the threat of some risks “…lack of fertilizer in the beginning I put a score of five now I have put a score of two because of the training we received on putting fertilizer to increase soil fertility”.
The group discussion was also attributed with enhancing a better understanding of the relationship between risks, which led to a change in perceptions of risks for some farmers. For example, one man in Mdilu stated, “I have also changed the score after realizing the importance of the challenge because when you are alone you cannot realize it, but through my colleagues I have learned more”. This evidence shows that the discussion among farmers enhanced the understanding of the relationship between risks, and helped farmers identify possible strategies for managing risks which they had not thought of before.
Another reason for the change of perceptions of risks was the scores of risks indicated on a SCD. The scores on a SCD represented the relative importance of a risk in contributing to other risks in the diagramme. By observing the risks that had high scores, the farmers’ perception of that risk changed and consequently changed the score for that risk. This was explained by a young woman in Mdilu who commented, “Heavy rain…at first, I put a score of two but now I have given it five. At first, I thought it was a normal problem but now I see it is big. I have seen on the diagram that it has a big importance (score)”.
A farmer’s experience also influenced a change in perception of risks, as was described by an elderly woman in Malolo, “I left birds’ attack with a score of three because even if they are very destructive, to my experience it is better to leave them with a score of three”. The unpredictability of risks (due to the changing nature of risk) also influenced some farmers to maintain their initial perception of the risks, as was indicated by farmers in the Malolo elderly men’s group who commented, “…also you can change the score today, and tomorrow the challenge returns the same”.

5. Discussion

5.1. The Interdependence between Risks: Perceptions and Implications

The network in Figure 3, representing the interdependence between risks and types of risk, highlights the complexity of risks in farming. The network revealed an interdependent relationship between production risks, market risks, financial risks, and personal risks. This interdependence between risks implies that managing one risk within the network would be trivial unless other risks are considered in the management process. From the network, for example, facilitating the use of strategies to reduce only drought risk for farmers in the region would mean little when there are other risks that could hinder farming goals. Consequently, focusing on reducing one type of risk, such as production risks alone, would prove inefficient unless the market, financial, and personal risks are managed simultaneously. This is because market, financial and personal risks have been shown to contribute to causing production risks.
In addition, the analysis of the interdependence between risks revealed important risks, according to their relative contributions in causing other risks in the network. These include: low yield of maize, low yield of sunflower, post-harvest pests, distance to market, high prices of inputs, low prices for sunflower, middlemen, infertile soil, and low prices for maize. These results highlight the importance of the diverse risks faced by farmers which hinder their business goals. These results are consistent with observations made by Campbell and colleagues [15], who observed that climate risk-modelling should not only focus on crop yields but on other risks such as pests and diseases which also cause severe adverse effects to farmers, and with the need for integrative approaches to manage risks beyond low crop yields [17].
Furthermore, the identification of important root causes of risks helps to provide entry points in managing multiple risks. By managing the root causes of risk, the occurrence of other risks linked to the root are likely to be reduced [9,57]. In this study, the important root causes of risks were distance to market, poor post-harvest management, high demand of inputs during the farming season, limited agro-input shops, counterfeit inputs, heavy rains, limited sources of income, long distance to the farm, and a lack of a marketplace to sell crop produce.
The analysis of the interdependence between risks provides insight into the designing of holistic approaches for the management of risks [4,58,59]. It enables farmers to identify the cause-and-effect relationships between risks, identify risks with the highest contribution to hindering their farming goals, and identify entry points for managing multiple interdependent risks. Caution should be exercised, however, regarding only focusing on prioritisation of risks with high contributions (that is, high weighted scores). This is because the severity of the effect of a risk varies from time to time, and a risk perceived as having a low contribution in affecting a smallholder farmer’s business goals could cause tremendous effects to the farmer [60]. For example, in this study, the contribution of the risk of technology failure such as seed failure in causing the risk of low yields in sunflower was perceived to be negligible (had a weighted score of 0.1 out of 100) (see Table A1 in Appendix A) compared to other risks and non-risky factors in the network. However, in spite of the occurrence or non-occurrence of other risks, a seed failure can result in a devastating loss of produce for the farmer when the seed is planted in a substantial amount of land by the farmer.
This study highlights farmers’ perceptions of the interdependence between risks. These perceptions, derived from farmer groups, are a result of individual farmers’ perceptions of the interdependence between risks. The group perceptions are therefore a result of a consensus drawn from the farmers’ individual characteristics such as age, gender, income levels, cultural beliefs and values, levels of optimism, and from the farmers’ knowledge about the risks, and subjective assessments of the interdependence between risks, such as how frequently the risks occur to them, how frequent one risk causes another risk, and the observed effect between the risks [38]. This study did not investigate which of these factors influenced farmers’ perceptions of the interdependence between risks. Consequently, the perceptions do not present an objective analysis of the interdependence between the risks, though this study provides a basis for such an analysis, given the limitations in obtaining objective data on multiple risks [61], and the context-specific nature of the risks [62]. The objective analysis of the interdependence between risks should be conducted in conjunction with farmers from a given context and expertise, who can provide objective estimates of the strength of the links between risks, as was conducted by Freeman and colleagues [63]. This objective analysis of the interdependence between risks could be compared to the analysis conducted by farmers, and similarities and discrepancies identified between the analyses. This comparison would provide a robust basis for understanding the interdependence between risks and inform the design of holistic approaches for the management of multiple risks in smallholder farmers’ farming businesses.

5.2. Role of Analysis of the Interdependence between Risks in Changing Perceptions

The findings show that the analysis of the interdependence between risks enabled a change in the perceptions of risks by 51.8% (Figure 5). This change in perceptions of risks was caused by several factors that were facilitated by the analysis of the interdependence between risks. These factors include: the understanding of the cause-and-effect relationships between risks, a change in the farmers’ perceived ability to manage a risk, the awareness of risks obtained through group discussion, the awareness of the contribution of risks by observing the scores of a risk shown in a SCD, a farmer’s experience, and the unpredictability of a risk. This change in perceptions as a result of analysing the interdependence between risks implies that the analysis of the interdependence between risks has potential to change the risk-management behaviour of farmers. This is because of the link between risk perceptions and risk-management behaviour [12,13,31,42,64], and also because the analysis facilitated a change in farmers’ perceived ability to manage the risks, which is critical in influencing risk-management behaviour [34,65,66]. To facilitate farmers’ management of risks towards a more holistic approach of managing the multiple risks, it is important that policy and development initiatives prioritise the analysis of the interdependence between risks with farmers so as to influence their risk perceptions. However, though risk perception is an important determinant, it is not the only factor influencing risk-management behaviour. An individual’s intention in using a risk-management strategy is influenced by social norms, one’s attitude towards using a management strategy [13,65], one’s resources base [34], access to capital and enabling institutional structures [10], an individual’s aspirations [67], and the way risk information is communicated to farmers [68,69]. Future research could examine the extent to which a change in perception leads to actual change in risk-management behaviour, considering the aforementioned factors that also influence risk-management behaviour.
In addition, this study raises some implications of using focus groups for co-learning as a strategy to influence perceptions, to improve the assessment and management of risks. This paper provides evidence that discussion and knowledge exchange between farmers can increase the awareness of the interdependence between risks, and sometimes increase farmers’ confidence in their ability to self-manage risks. These findings support observations by other scholars on co-learning, enhanced through focus group discussions [49,70]. On the other hand, comments by a single farmer can influence the group’s perspective of a risk [71], while at the same time, there can be other factors playing a role in determining the common perception expressed by a group. For example, participants might express a common perception to shorten the meeting.
Risk perceptions change over time [12,42]. Given the important role of risk perception in influencing management behaviour, it is important to examine the duration for which the observed change in perceptions of risks, following the analysis of the interdependence between risks, persists among farmers. This study examined the immediate change in perception, but further research through longitudinal studies can examine how long this change persists. This examination would be informative about appropriate measures for enhancing and sustaining the change in the long term towards holistic management of multiple risks among smallholder farmers and stakeholders.

5.3. Limitations

In addition to the addressed considerations in the analysis of the interdependence of risks, the understanding of change in risk perception, and implications for smallholder farmers’ risk management, the participant selection process and design of the study pose a limitation to the study. The participant selection process does not make our findings readily generalisable to smallholder farmers’ communities in other contexts. This limitation, however, is common in qualitative research and not unique to this study [72]. Adding to this, this paper did not discuss the strategies that farmers could use to manage the interdependent risks following the analysis of the risks. This can be explored in future research to examine how the understanding of the interdependence between risks facilitates the selection of risk-management strategies towards an holistic management of risks.
A unique contribution of this study is its ability to describe a process for eliciting and analysing farmers’ perceptions of the interdependence between risks and to highlight how this analysis contributes to a change in farmers’ perceptions of individual risks. This change in the perception of individual risks ultimately shapes farmers’ decisions as to whether to change their risk-management behaviour.

6. Conclusions

This paper highlights the complex nature of risks in farming and how different types of risks such as production, market, financial and personal risks are interdependent. The evidence presented supports the need for holistic approaches of risk management in smallholder farming businesses and the paper provides both a methodology for investigating farmers’ perceptions of the interdependence between risks and a tool that farmers can use themselves to identify and systematically analyse multiple and interdependent risks in a production system. Use of this tool by farmers led to important changes in perceptions regarding several key risks, the relationships between risks and their impacts within production and livelihood systems. The approaches presented in this paper can be used by farmers in diverse and complex farming systems to analyse risks and develop improved risk management strategies, and by researchers and development organisations to better understand and support a holistic management of risks.

Supplementary Materials

The following supporting information can be downloaded at: https://www.mdpi.com/article/10.3390/su151914467/s1, FGD Protocol: Protocol for investigating the role of the analysis of interdependence of risks in changing perceptions of farmers.

Author Contributions

Conceptualisation, N.K., P.D. and G.C.; methodology, N.K.; validation, N.K., P.D. and G.C.; formal analysis, N.K.; investigation, N.K.; data curation, N.K.; writing—original draft preparation, N.K.; writing—review and editing, N.K., P.D. and G.C.; visualisation, N.K.; supervision, P.D. and G.C.; project administration, N.K., P.D. and G.C.; funding acquisition, N.K. All authors have read and agreed to the published version of the manuscript.

Funding

This research was funded by the Global Collaboration for Resilient Food Systems programme of the McKnight Foundation (CRFS) (Grant number: 22-159), and Statistics for Sustainable Development (Stats4SD).

Institutional Review Board Statement

The study was conducted in accordance with the Declaration of Helsinki and approved by the Ethical Review Board of the University of Reading.

Informed Consent Statement

Informed consent was obtained from all subjects involved in the study.

Data Availability Statement

The data presented in this study are available on request from the corresponding author. The data are not publicly available due to privacy reasons.

Acknowledgments

The authors are grateful for the support of farmers who willingly and actively participated in the study, and the technical support of the field staff at RECODA. The authors also acknowledge the technical and advisory support from Richard Coe and Carlos Barahona, and Romina De Angelis for her initial review on the paper. The authors are grateful to Ciara Hughs for her support in the network analysis, and to the two anonymous reviewers who provided useful feedback on the paper.

Conflicts of Interest

The authors declare no conflict of interest.

Appendix A

Table A1. Weighted scores of risks and non-risky factors identified by farmers.
Risk of…Number of Focus GroupsWeighted Score
Low_yields_maize840.5
Low_yields_sunflower818.0
Postharvest_pests615.3
Distance_to_market512.4
High_prices_inputs613.9
Low_prices_sunflower612.4
Middlemen711.8
Infertile_soil712.5
Low_prices_maize69.8
Limited_access_seeds48.3
Long_dryspells68.0
Loss_after_harvesting47.7
Pests_maize86.7
Poor_post-harvest_management46.3
Limited_agroinput_shops14.7
Counterfeit_inputs24.2
Stunted_growth24.5
Distance_to_farm12.8
Late_weeding54.1
High_demands_input14.3
High_transport_costs13.4
Lack_inputs 13.0
Late_harvesting12.2
Arbitrary_cultivation32.9
Limited_income_sources33.4
Heavy_rains13.5
Lack_of_market22.8
Late_planting32.5
Changes_start_rains21.7
Poor_agric_knowledge21.9
Soil_erosion32.2
Limited_market_information11.8
Reduction_usable land11.8
High_prices_seeds12.0
Early_sale_of_sunflower12.3
Invasion_livestock41.7
Drought21.8
Birds_attack_sunflower41.1
Cutting_down_trees31.1
Emergency11.3
Poor_harvesting11.3
Lack_standard_units21.2
Pests_sunflower20.8
Weeds10.8
Crop_rottening11.1
Limited_labour11.1
Communal_planting11.1
Climate_change10.7
High_threshing_costs10.7
Birds_attack_maize10.5
Fog20.5
Maize_diseases10.4
Unpredictable_prices_sunflower10.4
Theft_of_crops10.2
New_seed_failure10.1
Sunflower_disease10.1

References

  1. Harwood, J.; Heifner, R.; Coble, K.; Perry, J.; Somwaru, A. Managing Risk in Farming: Concepts, Research, and Analysis; U.S. Department of Agriculture: Washington, DC, USA, 1999.
  2. Hardaker, J.B.; Huirne, R.B.M.; Anderson, J.R.; Lien, G. Coping with Risk in Agriculture, 2nd ed.; CABI: Wallingford, UK, 2004. [Google Scholar]
  3. Boehlje, M.D.; Trede, L.D. Risk Management in Agriculture. Am. Soc. Farm Manag. Rural Apprais. 1977, 41, 20–29. Available online: https://www.jstor.org/stable/43757796 (accessed on 7 July 2023).
  4. OECD. Managing Risk in Agriculture: A Holistic Approach; OECD Publishing: Paris, France, 2009. [Google Scholar]
  5. Komarek, A.M.; De Pinto, A.; Smith, V.H. A review of types of risks in agriculture: What we know and what we need to know. Agric. Syst. 2020, 178, 102738. [Google Scholar] [CrossRef]
  6. van Winsen, F.; de Mey, Y.; Lauwers, L.; van Passel, S.; Vancauteren, M.; Wauters, E. Cognitive mapping: A method to elucidate and present farmers’ risk perception. Agric. Syst. 2013, 122, 42–52. [Google Scholar] [CrossRef]
  7. Diabat, A.; Govindan, K.; Panicker, V.V. Supply chain risk management and its mitigation in a food industry. Int. J. Prod. Res. 2012, 50, 3039–3050. [Google Scholar] [CrossRef]
  8. Ho, W.; Zheng, T.; Yildiz, H.; Talluri, S. Supply chain risk management: A literature review. Int. J. Prod. Res. 2015, 53, 5031–5069. [Google Scholar] [CrossRef]
  9. Zhao, G.; Liu, S.; Lopez, C.; Chen, H.; Lu, H.; Mangla, S.K.; Elgueta, S. Risk analysis of the agri-food supply chain: A multi-method approach. Int. J. Prod. Res. 2020, 58, 4851–4876. [Google Scholar] [CrossRef]
  10. Duong, T.T.; Brewer, T.; Luck, J.; Zander, K. A global review of farmers’ perceptions of agricultural risks and risk management strategies. Agriculture 2019, 9, 10. [Google Scholar] [CrossRef]
  11. Saqib, S.E.; Ahmad, M.M.; Panezai, S.; Ali, U. Factors influencing farmers’ adoption of agricultural credit as a risk management strategy: The case of Pakistan. Int. J. Disaster Risk Reduct. 2016, 17, 67–76. [Google Scholar] [CrossRef]
  12. Wise, T.; Zbozinek, T.D.; Michelini, G.; Hagan, C.C.; Mobbs, D. Changes in risk perception and self-reported protective behaviour during the first week of the COVID-19 pandemic in the United States: COVID-19 risk perception and behavior. R. Soc. Open Sci. 2020, 7, 200742. [Google Scholar] [CrossRef] [PubMed]
  13. Savadori, L.; Lauriola, M. Risk Perception and Protective Behaviors During the Rise of the COVID-19 Outbreak in Italy. Front. Psychol. 2021, 11, 577331. [Google Scholar] [CrossRef]
  14. Asravor, R.K. Farmers’ risk preference and the adoption of risk management strategies in Northern Ghana. J. Environ. Plan. Manag. 2019, 62, 881–900. [Google Scholar] [CrossRef]
  15. Campbell, B.M.; Vermeulen, S.J.; Aggarwal, P.K.; Corner-Dolloff, C.; Girvetz, E.; Loboguerrero, A.M.; Ramirez-Villegas, J.; Rosenstock, T.; Sebastian, L.; Thornton, P.K.; et al. Reducing risks to food security from climate change. Glob. Food Secur. 2016, 11, 34–43. [Google Scholar] [CrossRef]
  16. Kahan, D. Managing Risk in Farming: Farm Management Extension Guide; Food and Agriculture Organization of the United Nations: Rome, Italy, 2013. [Google Scholar]
  17. Singla, S.; Sagar, M. Integrated risk management in agriculture: An inductive research. J. Risk Financ. 2012, 13, 199–214. [Google Scholar] [CrossRef]
  18. Greatrex, H.; Hansen, J.; Garvin, S.; Diro, R.; Blakeley, S.; Le Guen, M.; Rao, K.; Osgood, D. Scaling up Index Insurance for Smallholder Farmers: Recent Evidence and Insights; CGIAR Research Program on Climate Change, Agriculture and Food Security (CCAFS): Copenhagen, Denmark, 2015; Available online: https://hdl.handle.net/10568/53101 (accessed on 16 September 2023).
  19. Cavatassi, R.; Lipper, L.; Narloch, U. Modern variety adoption and risk management in drought prone areas: Insights from the sorghum farmers of eastern Ethiopia. Agric. Econ. 2011, 42, 279–292. [Google Scholar] [CrossRef]
  20. Raza, A.; Razzaq, A.; Mehmood, S.S.; Zou, X.; Zhang, X.; Lv, Y.; Xu, J. Impact of Climate Change on Crops Adaptation and Strategies to Tackle Its Outcome: A Review. Plants 2019, 8, 34. [Google Scholar] [CrossRef] [PubMed]
  21. Arora, N.K. Impact of climate change on agriculture production and its sustainable solutions. Environ. Sustain. 2019, 2, 95–96. [Google Scholar] [CrossRef]
  22. Arbuckle, J.G.; Morton, L.W.; Hobbs, J. Understanding Farmer Perspectives on Climate Change Adaptation and Mitigation: The Roles of Trust in Sources of Climate Information, Climate Change Beliefs, and Perceived Risk. Environ. Behav. 2015, 47, 205–234. [Google Scholar] [CrossRef]
  23. Lin, B.-X.; Zhang, Y.Y. Impact of the COVID-19 pandemic on agricultural exports. J. Integr. Agric. 2020, 19, 2937–2945. [Google Scholar] [CrossRef]
  24. Workie, E.; Mackolil, J.; Nyika, J.; Ramadas, S. Deciphering the impact of COVID-19 pandemic on food security, agriculture, and livelihoods: A review of the evidence from developing countries. Curr. Res. Environ. Sustain. 2020, 2, 100014. [Google Scholar] [CrossRef]
  25. Ben Hassen, T.; El Bilali, H. Impacts of the Russia-Ukraine War on Global Food Security: Towards More Sustainable and Resilient Food Systems? Foods 2022, 11, 2301. [Google Scholar] [CrossRef] [PubMed]
  26. Mottaleb, K.A.; Kruseman, G.; Snapp, S. Potential impacts of Ukraine-Russia armed conflict on global wheat food security: A quantitative exploration. Glob. Food Secur. 2022, 35, 100659. [Google Scholar] [CrossRef]
  27. Adelaja, A.; George, J. Effects of conflict on agriculture: Evidence from the Boko Haram insurgency. World Dev. 2019, 117, 184–195. [Google Scholar] [CrossRef]
  28. PARM. A Holistic Approach to Agricultural Risk Management for Improving Resilience. 5. 2018. Available online: https://www.p4arm.org/document/a-holistic-approach-to-agricultural-risk-management-for-resilience/ (accessed on 1 December 2022).
  29. World Economic Forum. Global Risks 2020: An Unsettled World; World Economic Forum: Cologny, Switzerland, 2020. [Google Scholar]
  30. Dryhurst, S.; Schneider, C.R.; Kerr, J.; Freeman, A.L.J.; Recchia, G.; van der Bles, A.M.; Spiegelhalter, D.; van der Linden, S. Risk perceptions of COVID-19 around the world. J. Risk Res. 2020, 23, 994–1006. [Google Scholar] [CrossRef]
  31. Brewer, N.T.; Weinstein, N.D.; Cuite, C.L.; Herrington, J.E., Jr. Risk perceptions and their relation to risk behavior. Ann. Behav. Med. 2004, 27, 125–130. [Google Scholar] [CrossRef] [PubMed]
  32. Sjöberg, L.; Moen, B.-E.; Rundmo, T. Explaining Risk Perception. An Evaluation of the Psychometric Paradigm in Risk Perception Research. 2004. Available online: http://66.102.9.104/search?q=cache:x8G44WOi3ssJ:www.svt.ntnu.no/psy/Torbjorn.Rundmo/Psychometric_paradigm.pdf+Explaining+risk+perception.&hl=en&ct=clnk&cd=3&gl=uk (accessed on 30 June 2023).
  33. Conradie, B.; Piesse, J. Ranking perceived risk to farmers: How important is the environment? Afr. J. Agric. Resour. Econ. 2016, 11, 263–276. [Google Scholar] [CrossRef]
  34. Singh, C.; Dorward, P.; Osbahr, H. Developing a holistic approach to the analysis of farmer decision-making: Implications for adaptation policy and practice in developing countries. Land Use Policy 2016, 59, 329–343. [Google Scholar] [CrossRef]
  35. Flaten, O.; Lien, G.; Koesling, M.; Valle, P.; Ebbesvik, M. Comparing risk perceptions and risk management in organic and conventional dairy farming: Empirical results from Norway. Livest. Prod. Sci. 2005, 95, 11–25. [Google Scholar] [CrossRef]
  36. Garforth, C.J.; Bailey, A.P.; Tranter, R.B. Farmers’ attitudes to disease risk management in England: A comparative analysis of sheep and pig farmers. Prev. Vet. Med. 2013, 110, 456–466. [Google Scholar] [CrossRef] [PubMed]
  37. Meuwissen, M.; Huirne, R.; Hardaker, J. Risk and risk management: An empirical analysis of Dutch livestock farmers. Livest. Prod. Sci. 2001, 69, 43–53. [Google Scholar] [CrossRef]
  38. Siegrist, M.; Árvai, J. Risk Perception: Reflections on 40 Years of Research. Risk Anal. 2020, 40, 2191–2206. [Google Scholar] [CrossRef]
  39. Weinstein, N.D. Optimistic Biases About Personal Risks. Science 1989, 246, 1232–1234. [Google Scholar] [CrossRef] [PubMed]
  40. Hanoch, Y.; Rolison, J.; Freund, A.M. Reaping the Benefits and Avoiding the Risks: Unrealistic Optimism in the Health Domain. Risk Anal. 2019, 39, 792–804. [Google Scholar] [CrossRef] [PubMed]
  41. Shepperd, J.A.; Waters, E.A.; Weinstein, N.D.; Klein, W.M.P. A Primer on Unrealistic Optimism. Curr. Dir. Psychol. Sci. 2015, 24, 232–237. [Google Scholar] [CrossRef] [PubMed]
  42. Qin, H.; Sanders, C.; Prasetyo, Y.; Syukron, M.; Prentice, E. Exploring the dynamic relationships between risk perception and behavior in response to the Coronavirus Disease 2019 (COVID-19) outbreak. Soc. Sci. Med. 2021, 285, 114267. [Google Scholar] [CrossRef] [PubMed]
  43. Singida RALG. Singida Region Investment Guide; Singida RALG: Singida, Tanzania, 2020. [Google Scholar]
  44. NBS. National Sample Census of Agriculture 2019/20. 2021. Available online: https://www.nbs.go.tz/nbs/takwimu/Agriculture/2019-20_Agri_Census_Main_Report.pdf (accessed on 13 June 2022).
  45. Galpin, M.; Dorward, P.; Shepherd, D. Participatory Farm Management Methods for Agricultural Research and Extension: A Training Manual; University of Reading: Reading, UK, 2000. [Google Scholar]
  46. Henke, R.M.; Chou, A.F.; Chanin, J.C.; Zides, A.B.; Scholle, S.H. Physician attitude toward depression care interventions: Implications for implementation of quality improvement initiatives. Implement. Sci. 2008, 3, 40. [Google Scholar] [CrossRef] [PubMed]
  47. Proctor, E.K.; Knudsen, K.J.; Fedoravicius, N.; Hovmand, P.; Rosen, A.; Perron, B. Implementation of Evidence-Based Practice in Community Behavioral Health: Agency Director Perspectives. Adm. Policy Ment. Health Ment. Health Serv. Res. 2007, 34, 479–488. [Google Scholar] [CrossRef]
  48. Etikan, I.; Musa, S.A.; Alkassim, R.S. Comparison of Convenience Sampling and Purposive Sampling. Am. J. Theor. Appl. Stat. 2016, 5, 1–4. [Google Scholar] [CrossRef]
  49. Nyumba, T.O.; Wilson, K.; Derrick, C.J.; Mukherjee, N. The use of focus group discussion methodology: Insights from two decades of application in conservation. Methods Ecol. Evol. 2018, 9, 20–32. [Google Scholar] [CrossRef]
  50. Guest, G.; Namey, E.; McKenna, K. How Many Focus Groups Are Enough? Building an Evidence Base for Nonprobability Sample Sizes. Field Methods 2017, 29, 3–22. [Google Scholar] [CrossRef]
  51. Hennink, M.M.; Kaiser, B.N.; Weber, M.B. What Influences Saturation? Estimating Sample Sizes in Focus Group Research. Qual. Health Res. 2019, 29, 1483–1496. [Google Scholar] [CrossRef]
  52. Braun, V.; Clarke, V. Using thematic analysis in psychology. Qual. Res. Psychol. 2006, 3, 77–101. [Google Scholar] [CrossRef]
  53. Burn, R.W. Quantifying and Combining Causal Diagrams; University of Reading: Reading, UK, 2000; Volume 5. [Google Scholar]
  54. Corwin, Z.B.; Clemens, R.F. Chapter 36: Analyzing fieldnotes: A practical guide. In Handbook of Qualitative Research in Education; Edward Elgar Publishing: Cheltenham, UK, 2020. [Google Scholar]
  55. Singida Regional Administration. Taarifa ya Sehemu ya Uchumi na Uzalishaji. 2022. Available online: https://singida.go.tz/economic-activity/taarifa-ya-sehemu-ya-uchumi-na-uzalishaji (accessed on 11 July 2023).
  56. Smithson, J. Using and analysing focus groups: Limitations and possibilities. Int. J. Soc. Res. Methodol. 2000, 3, 103–119. [Google Scholar] [CrossRef]
  57. Savory, A.; Butterfield, J. Holistic Management: A New Framework for Decision Making; Island Press: Washington, DC, USA, 1999. [Google Scholar]
  58. Savory, A.; Butterfield, J. Holistic Management: A Commonsense Revolution to Restore Our Environment; Island Press: Washington, DC, USA, 2016. [Google Scholar]
  59. PARM. Feasibility Study for Investment: Information Systems for Agricultural Risk Management in Liberia (by NITIDAE). 2019. Available online: http://p4arm.org/document/feasibility-study-for-investment-information-systems-for-arm-in-liberia (accessed on 5 August 2022).
  60. Smith, D.; Fischbacher, M. The changing nature of risk and risk management: The challenge of borders, uncertainty and resilience. Risk Manag. 2009, 11, 1–12. [Google Scholar] [CrossRef]
  61. Hansen, J.W.; Vaughan, C.; Kagabo, D.M.; Dinku, T.; Carr, E.R.; Körner, J.; Zougmoré, R.B. Climate Services Can Support African Farmers’ Context-Specific Adaptation Needs at Scale. Front. Sustain. Food Syst. 2019, 3, 21. [Google Scholar] [CrossRef]
  62. Mwongera, C.; Shikuku, K.M.; Twyman, J.; Läderach, P.; Ampaire, E.; Van Asten, P.; Twomlow, S.; Winowiecki, L.A. Climate smart agriculture rapid appraisal (CSA-RA): A tool for prioritizing context-specific climate smart agriculture technologies. Agric. Syst. 2017, 151, 192–203. [Google Scholar] [CrossRef]
  63. Freeman, A.L.; Parker, S.; Noakes, C.; Fitzgerald, S.; Smyth, A.; Macbeth, R.; Spiegelhalter, D.; Rutter, H. Expert elicitation on the relative importance of possible SARS-CoV-2 transmission routes and the effectiveness of mitigations. BMJ Open 2021, 11, e050869. [Google Scholar] [CrossRef]
  64. Williams, D.J.; Noyes, J.M. How does our perception of risk influence decision-making? Implications for the design of risk information. Theor. Issues Ergon. Sci. 2007, 8, 1–35. [Google Scholar] [CrossRef]
  65. Ajzen, I. Martin fishbein’s legacy: The reasoned action approach. Ann. Am. Acad. Politi-Soc. Sci. 2012, 640, 11–27. [Google Scholar] [CrossRef]
  66. Ajzen, I. Theory of Planned Behaviour Diagram. 2019. Available online: https://people.umass.edu/aizen/tpb.diag.html (accessed on 4 September 2023).
  67. Mishra, S. Decision-Making Under Risk: Integrating Perspectives From Biology, Economics, and Psychology. Pers. Soc. Psychol. Rev. 2014, 18, 280–307. [Google Scholar] [CrossRef]
  68. Serfilippi, E.; Carter, M.; Guirkinger, C. Insurance contracts when individuals “greatly value” certainty: Results from a field experiment in Burkina Faso. J. Econ. Behav. Organ. 2019, 180, 731–743. [Google Scholar] [CrossRef]
  69. Clarkson, G.; Dorward, P.; Osbahr, H.; Torgbor, F.; Kankam-Boadu, I. An investigation of the effects of PICSA on smallholder farmers’ decision-making and livelihoods when implemented at large scale—The case of Northern Ghana. Clim. Serv. 2019, 14, 1–14. [Google Scholar] [CrossRef]
  70. Gibbs, A. “Focus Groups”, Social Research Update, No. 19. 1997. Available online: https://sru.soc.surrey.ac.uk/SRU19.html (accessed on 21 September 2023).
  71. Leung, F.-H.; Savithiri, R. Spotlight on focus groups. Can. Fam. Physician 2009, 55, 218–219. [Google Scholar] [PubMed]
  72. Williams, S.N.; Armitage, C.J.; Tampe, T.; Dienes, K. Public attitudes towards COVID-19 contact tracing apps: A UK-based focus group study. Health Expect. 2021, 24, 377–385. [Google Scholar] [CrossRef] [PubMed]
Figure 1. A SCD developed by a group of men in Malolo village representing the interdependence between risks in maize and sunflower farming. When two risks are linked by an arrow, the risk at the beginning of the arrow is the “causal risk” and the risk at the pointed end of the arrow is the “effect risk”. The number on an arrow represents the relative weight of the causal risk to another risk, whereas the numbers within the shapes represent the relative weight of a risk in causing the overall end-problems.
Sustainability 15 14467 g001
Figure 2. Risks identified by farmers before and after analysis of the interdependence between risks through SCDs.
Sustainability 15 14467 g002
Figure 3. A network showing the interdependence between risks as perceived by 46 farmers in Malolo and Mdilu villages. (The size of a node represents the relative contribution of a risk in causing the end-problems in maize and sunflower farming, while the size of an arrow represents the relative contribution of a ‘causal’ risk in causing the ‘effect’ risk.)
Sustainability 15 14467 g003
Figure 4. Risks with high contributions in hindering maize and sunflower farming goals.
Sustainability 15 14467 g004
Figure 5. Proportion of risks that were changed.
Sustainability 15 14467 g005
Table 1. Farmer groups in Mdilu and Malolo villages.
Group No.Group NameNumber of Participants
1Malolo elderly men6
2Malolo elderly women5
3Malolo young men 16
4Malolo young men 26
5Malolo young women6
6Mdilu elderly women5
7Mdilu young women7
8Mdilu young men5
Table 2. Data collection and analysis plan.
Data CollectedFormat of RecordingUnit of MeasurementData Analysis Method
A list of risks identified before the process and after the processPhotographNoneDescriptive statistics: comparison risk before and after SCD
Farmers’ individual scores of risks before and after the SCDScore cards1 (low threat) to 5 (high threat)Descriptive statistics: percentage change in risk perception
Farmers’ reasons for their individual scores for risksTranscripts from audio recordingsNoneThematic analysis
8 Scored Causal Diagrams drawn by farmersPhotographScores are assigned 0 to 100Network Analysis: identification of important root causes of risks, identification of important risk interrelationships identified
Observations of group exercise of SCD of risksFieldnotesNoneSystematic synthesis of observations
Table 3. Number of farmers who changed their scores per focus group.
Group NameNumber of FarmersFarmers Who Changed Their Initial Scores
Malolo elderly men60
Malolo young men 166
Malolo elderly women55
Mdilu young men54
Malolo young men 266
Mdilu young women77
Malolo young women66
Mdilu elderly women55
Table 4. Factors influencing change in perceptions of risks, obtained by asking farmers “Why did you change the initial score of risk A?”.
ThemeReason for/against Change in Scores of RisksNumber of ExcerptsExample Excerpt
1. Understanding (or representation) of the relationship between risks on the SCDfor10Long distance to markets had a score of 1 initially but now is 5 because I thought selling to middlemen was not a problem but now I see it is a cause of low prices of produce—A young man in Malolo
against2I left a score of 4 on harmful pests because they destroy our crops even if we get quality seeds we will still face the issue of not having enough food and low income—An elderly man in Malolo
2. Perceived ability to manage a riskfor9I have changed the score against ‘middlemen’ from 5 to 3 because I have realized I can manage the problem by not selling my produce when the prices are low—A young man in Malolo
against3I have left drought at the score of 5 because it is beyond my ability to manage it—An elderly woman in Mdilu
3. Awareness through group discussionfor5Low yield of maize in the beginning I put a score of 4, now I have put 2 because it is caused by lack of fertilizer. I can solve this problem—A young woman in Malolo
against4I have left a score of 3 on ‘weed infestation’ which means it is a medium threat because of what I have learnt in this discussion—An elderly woman in Malolo
4. Scores of the risk as displayed on the SCDfor4I have changed ‘high input prices’ from a score of 1 to 5 because it has a big score—A young man in Malolo
5. Personal experienceagainst2I have left the issue of ‘birds attack’ at a score of 3 because even if they are very destructive, according to my understanding I would leave the score of 3 for them—An elderly woman in Malolo
6. Unpredictability of risksagainst6You can change a score today and tomorrow the problem comes back as it were before or worse—Men in Malolo
Disclaimer/Publisher’s Note: The statements, opinions and data contained in all publications are solely those of the individual author(s) and contributor(s) and not of MDPI and/or the editor(s). MDPI and/or the editor(s) disclaim responsibility for any injury to people or property resulting from any ideas, methods, instructions or products referred to in the content.

