Article

Environmental Vertical Management and Enterprises’ Performance: Evidence from Water Pollution Reduction in China

1
Regional Economy Research Institute, Sichuan Academy of Social Sciences, Chengdu 610072, China
2
Institute of Regional and Urban Development, Sichuan Academy of Social Sciences, Chengdu 610072, China
3
School of Economics, Sichuan Agricultural University, Chengdu 611130, China
*
Author to whom correspondence should be addressed.
Sustainability 2023, 15(19), 14409; https://doi.org/10.3390/su151914409
Submission received: 21 August 2023 / Revised: 25 September 2023 / Accepted: 28 September 2023 / Published: 30 September 2023
(This article belongs to the Section Sustainable Water Management)

Abstract

:
Firm-level evidence for the impact of environmental vertical management on enterprise environmental performance is limited, especially on the performance of water pollution reduction (WPR). Taking the environmental vertical management reform (EVMR) as a quasi-natural experiment, this study constructs a time-varying difference-in-differences model to investigate the effects of EVMR on the WPR performance of enterprises. Using the latest data from the China Industrial Enterprise Database and China Enterprise Pollution Emission Database (1998–2014), we find that EVMR promotes enterprises to improve the performance of WPR. Moreover, heterogeneity analysis shows that the effects vary with regions, industry pollution intensities, and sizes of enterprises. Further mechanism analysis indicates that EVMR reduces water pollution by stimulating production pattern transformation and decreasing fresh water consumption rather than by increasing wastewater treatment facilities. Our empirical findings support the rationality of EVMR in China and provide beneficial insights for enhancing environmental management systems in other developing economies.

1. Introduction

Water pollution has become a serious issue due to the lack of water resource protection concepts, and the consequent degradation of the water environment has adversely affected economic and social development [1]. The negative externalities of water pollution imply the need to accelerate the process of water resource protection, and the long regeneration process of water resources implies the necessity of accelerating the process of protection [2,3]. Governments have also made many efforts to this end; for example, Europe, the United States, and China have optimized authority allocation across levels of environmental management departments to strengthen protection [4,5]. However, in practice, the problem of water pollution has not been effectively solved, and the effectiveness of the policy has not been fully realized [6].
The management mode of the environmental sector is a key factor for the effective implementation of policy outcomes [7,8]. Currently, most countries have adopted environmental decentralization as their preferred mode [9,10]. Such a mode of environmental management has achieved good environmental performance in some countries [11,12], but for others, it does not seem to work [13,14]. For these countries, environmental decentralization may cause some typical problems such as a “race to the bottom” and “interjurisdictional pollution spillover”. In pursuit of economic growth, local governments often face a compelling incentive to relax environmental regulations and undermine local environmental governance practices, ultimately leading to a phenomenon known as the “race to the bottom” effect among locals [15,16]. In scenarios involving transboundary pollution, the fallout is exacerbated as one jurisdiction fails to fully account for the broader environmental consequences of its actions, as a portion of associated costs—usually linked to increased air or water pollution—falls outside one’s jurisdiction [5,13,17]. These problems may be manifested as water pollution externality across adjacent areas and are frequent in countries such as the United States, Indonesia, Brazil, and China [14,18,19,20]. In order to solve these problems, it is necessary to explore an effective department management mode.
Environmental centralization has proved to be an effective way of avoiding a “race to the bottom” and “interjurisdictional pollution spillover” [5,21]. The improvement of environmental governance depends on environmental centralization to correct government failures caused by pollution externality and to overcome local protectionism [22,23]. There is a long history of research on an environment centralization management mode, and some of them find environmental centralization improves environmental performance [16,24,25]; some papers suggest that environmental centralization is not conducive to controlling local environmental pollution [26,27], and a few find that a negative correlation exists between environmental centralization and environmental performance [28]. These studies enrich the research on environmental management modes. However, such macro-level research on overall performance fails to capture the micro-level characteristics of enterprises and does not address the specific issue of WPR.
To fill this gap, this study investigates the impact of environmental centralization on the WPR performance of enterprises by taking EVMR in China as a quasi-natural experiment. EVMR is a representative policy of environmental centralization, transferring environmental regulatory and monitoring powers upward in environmental protection departments from below the prefecture level to the prefecture level. Nearly thirty years of practical experience in China with the EVMR pilot offers a precious opportunity to evaluate the effects of environmental centralization. Such empirical studies can provide empirical evidence for the debate on environmental centralization versus decentralization and offer clues for the design of environmental management systems. Specifically, we use the difference-in-differences (DID) model to evaluate the effects of EVMR on WPR and to explore its heterogeneous effects and influencing mechanisms based on firm-level data.
Compared to the existing literature, the contribution of this study includes the following three aspects. First, to the best of our knowledge, this study is the first to investigate the influence of EVMR on WPR from the perspective of micro-enterprises. Specifically, this paper estimates the effects of EVMR on firm-level WPR using two firm-level databases, namely the China Industrial Enterprise Database (CIED) and China Enterprise Pollution Emission Database (CEPED), from 1998 to 2014. Different from studies using region-level data [16,24,25], a study using firm-level data can explore the change in within-sector water pollution [29]. Moreover, manufacturing is the ‘‘main force’’ of water pollution [30], and enterprises are the basic units of industrial wastewater discharge. Thus, a study using firm-level data can clarify whether EVMR has a reduction effect on an enterprise’s water pollution discharge and provide more accurate clues for the improvement of environmental management systems.
Second, this study initially systematically examined the effect of EVMR on the WPR of enterprises. Although some literature has theoretically analyzed the rationality and necessity of EVMR [31,32], only limited empirical studies investigate its impact on pollution reduction. For instance, the authors of [33] empirically examine the effects of EVMR on firm-level SO2 emissions and industrial soot. To date, the effect on WPR is overlooked in the context of EVMR, and our paper fills this gap by providing policymakers with deeper insights into the actual mechanisms through which EVMR reduces water pollution discharge.
Third, taking China as an example can provide dual inspiration for other developing countries in terms of pollution control and policy direction. As the largest developing country, China is facing severe water pollution, and the Chinese government has committed to reducing such pollution. During the 11th Five-Year Plan period (2006–2010) alone, more than 82 billion CNY was invested nationwide to control industrial water pollution. The data come from the China Industrial Statistics Yearbook (2011). In addition, the Chinese government continuously attempts to optimize authority allocation across different levels of environmental departments, such as EVMR, to assist in reducing pollution. Thirty years of experience with EVMR in China could provide fresh insight for other developing countries in reducing pollution, especially water pollution.
The rest of this study is organized as follows. Section 2 outlines the institutional background and theoretical analysis. Section 3 describes the methodology, data, and variables. Section 4 presents and discusses empirical results. Section 5 and Section 6 present a set of heterogeneity analyses and the influencing mechanism analyses, respectively. Finally, Section 7 summarizes the main conclusions and policy implications.

2. Institutional Background and Theoretical Analysis

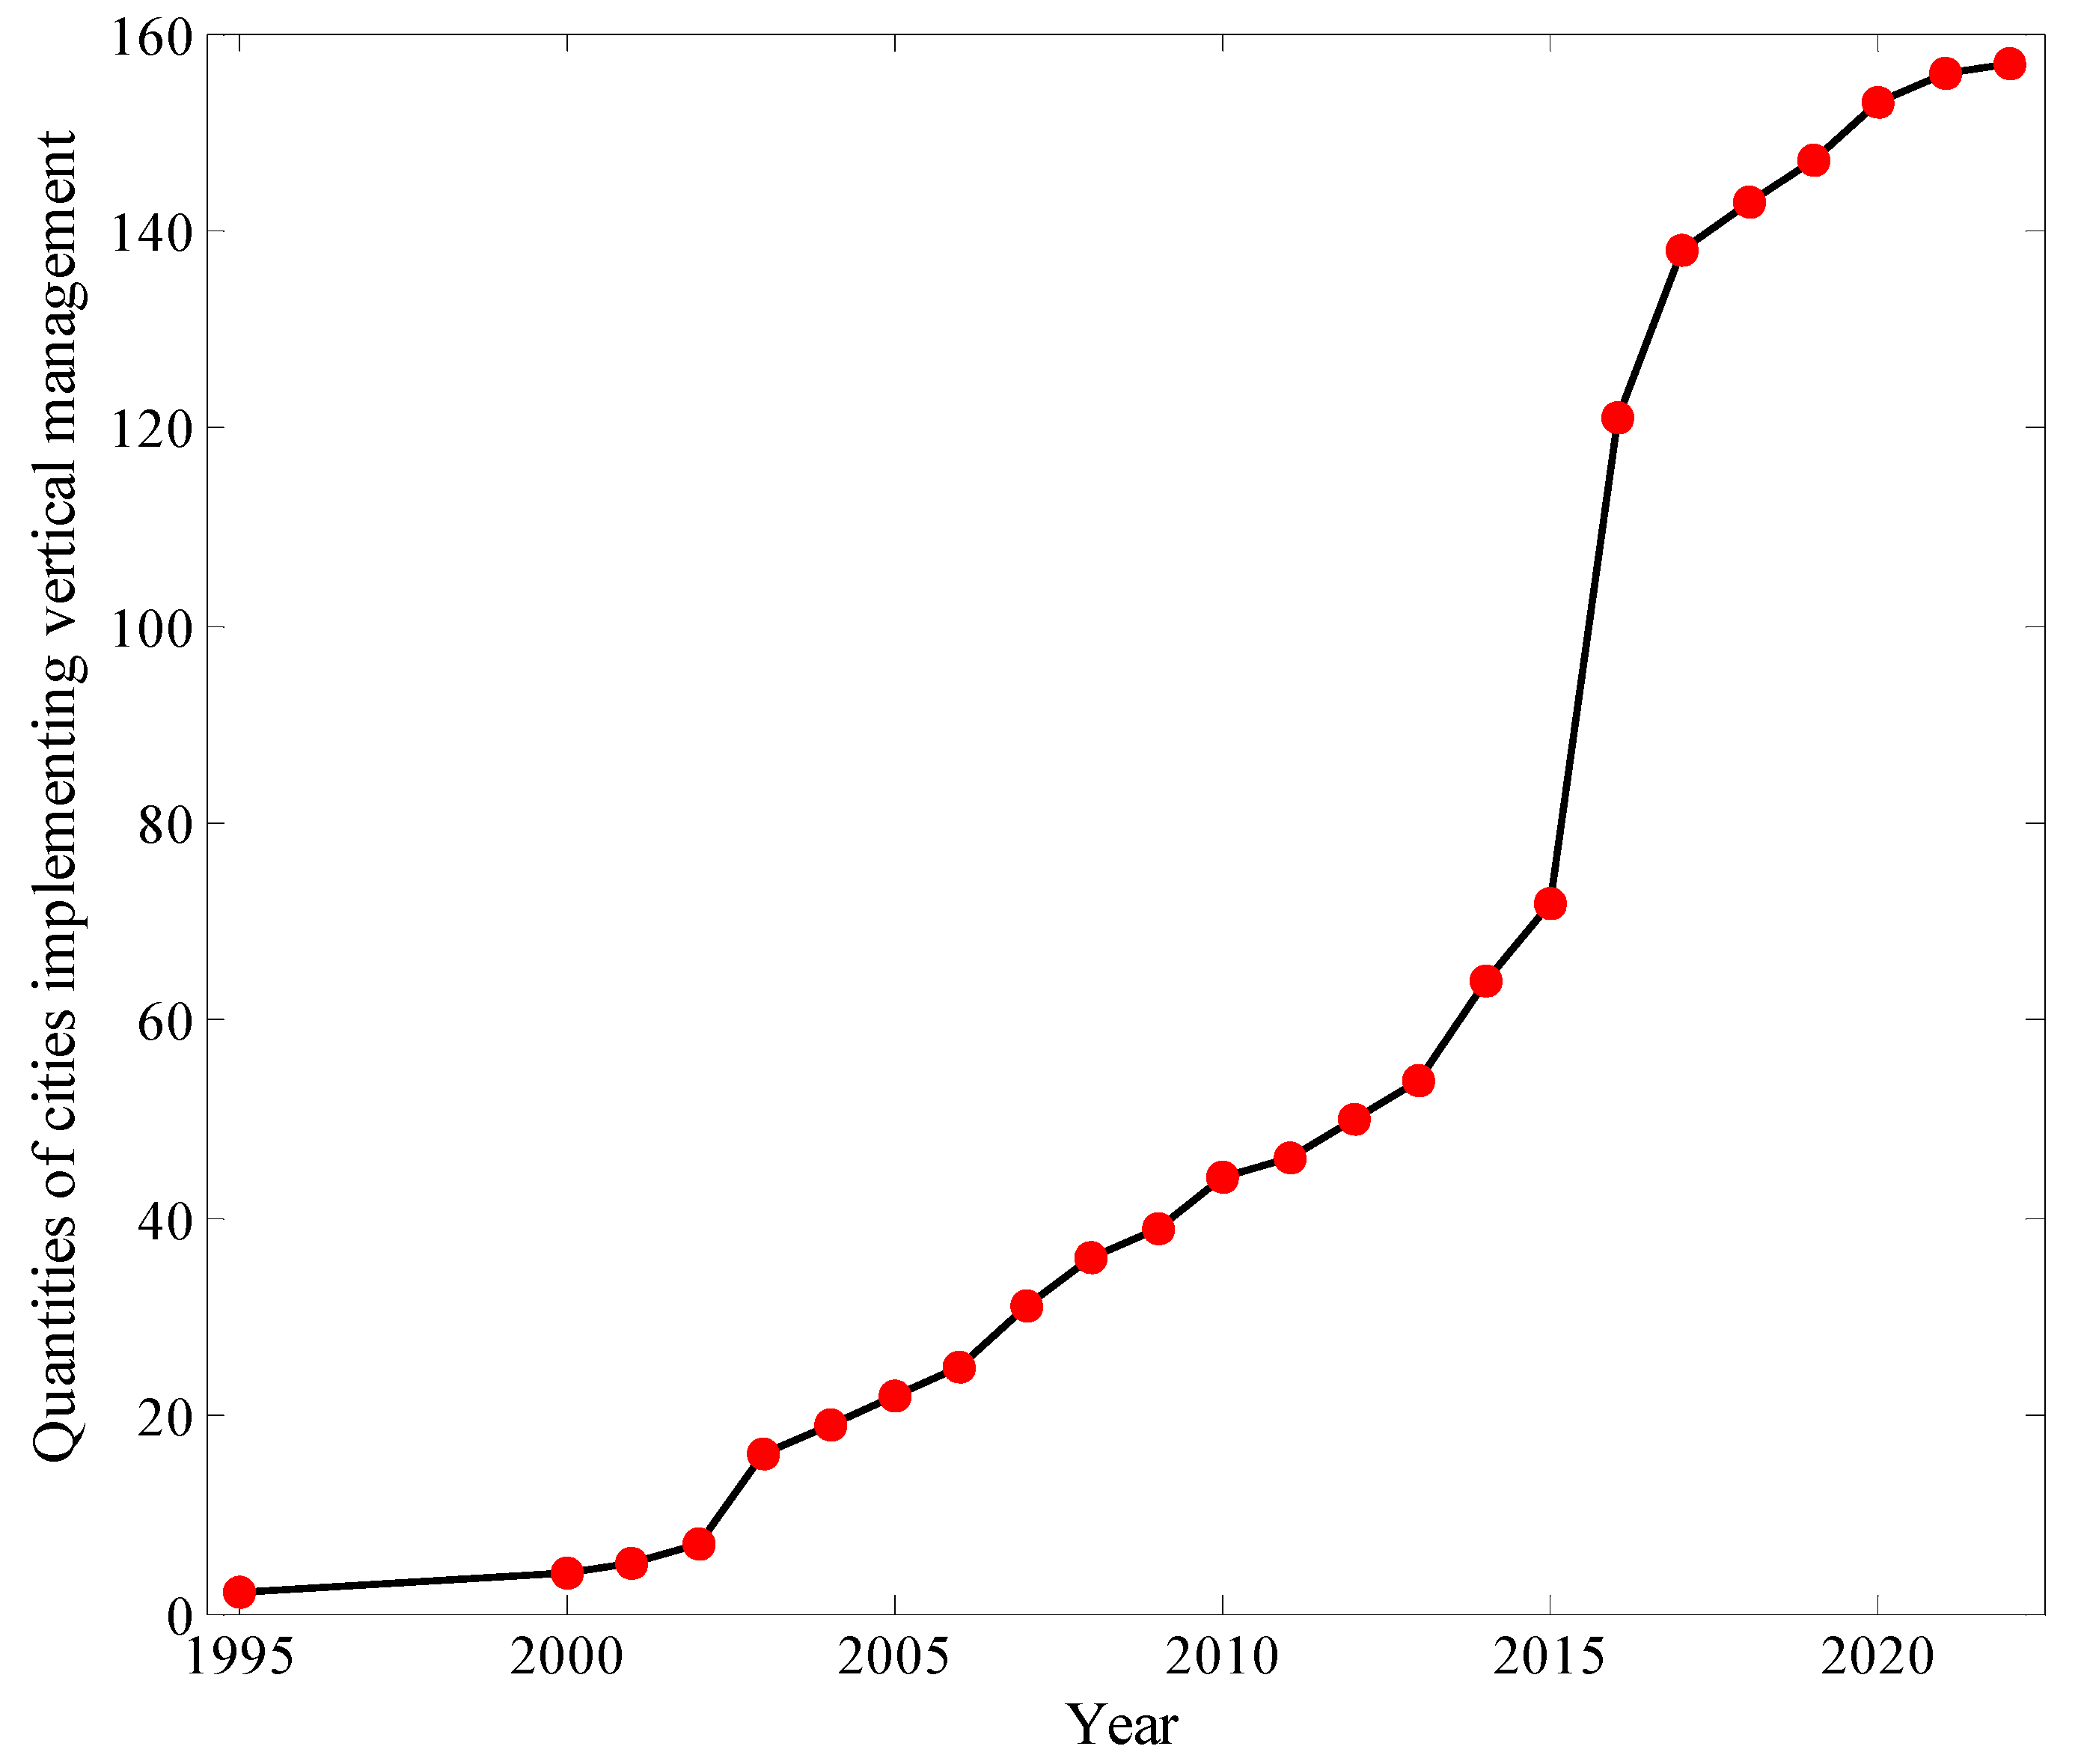
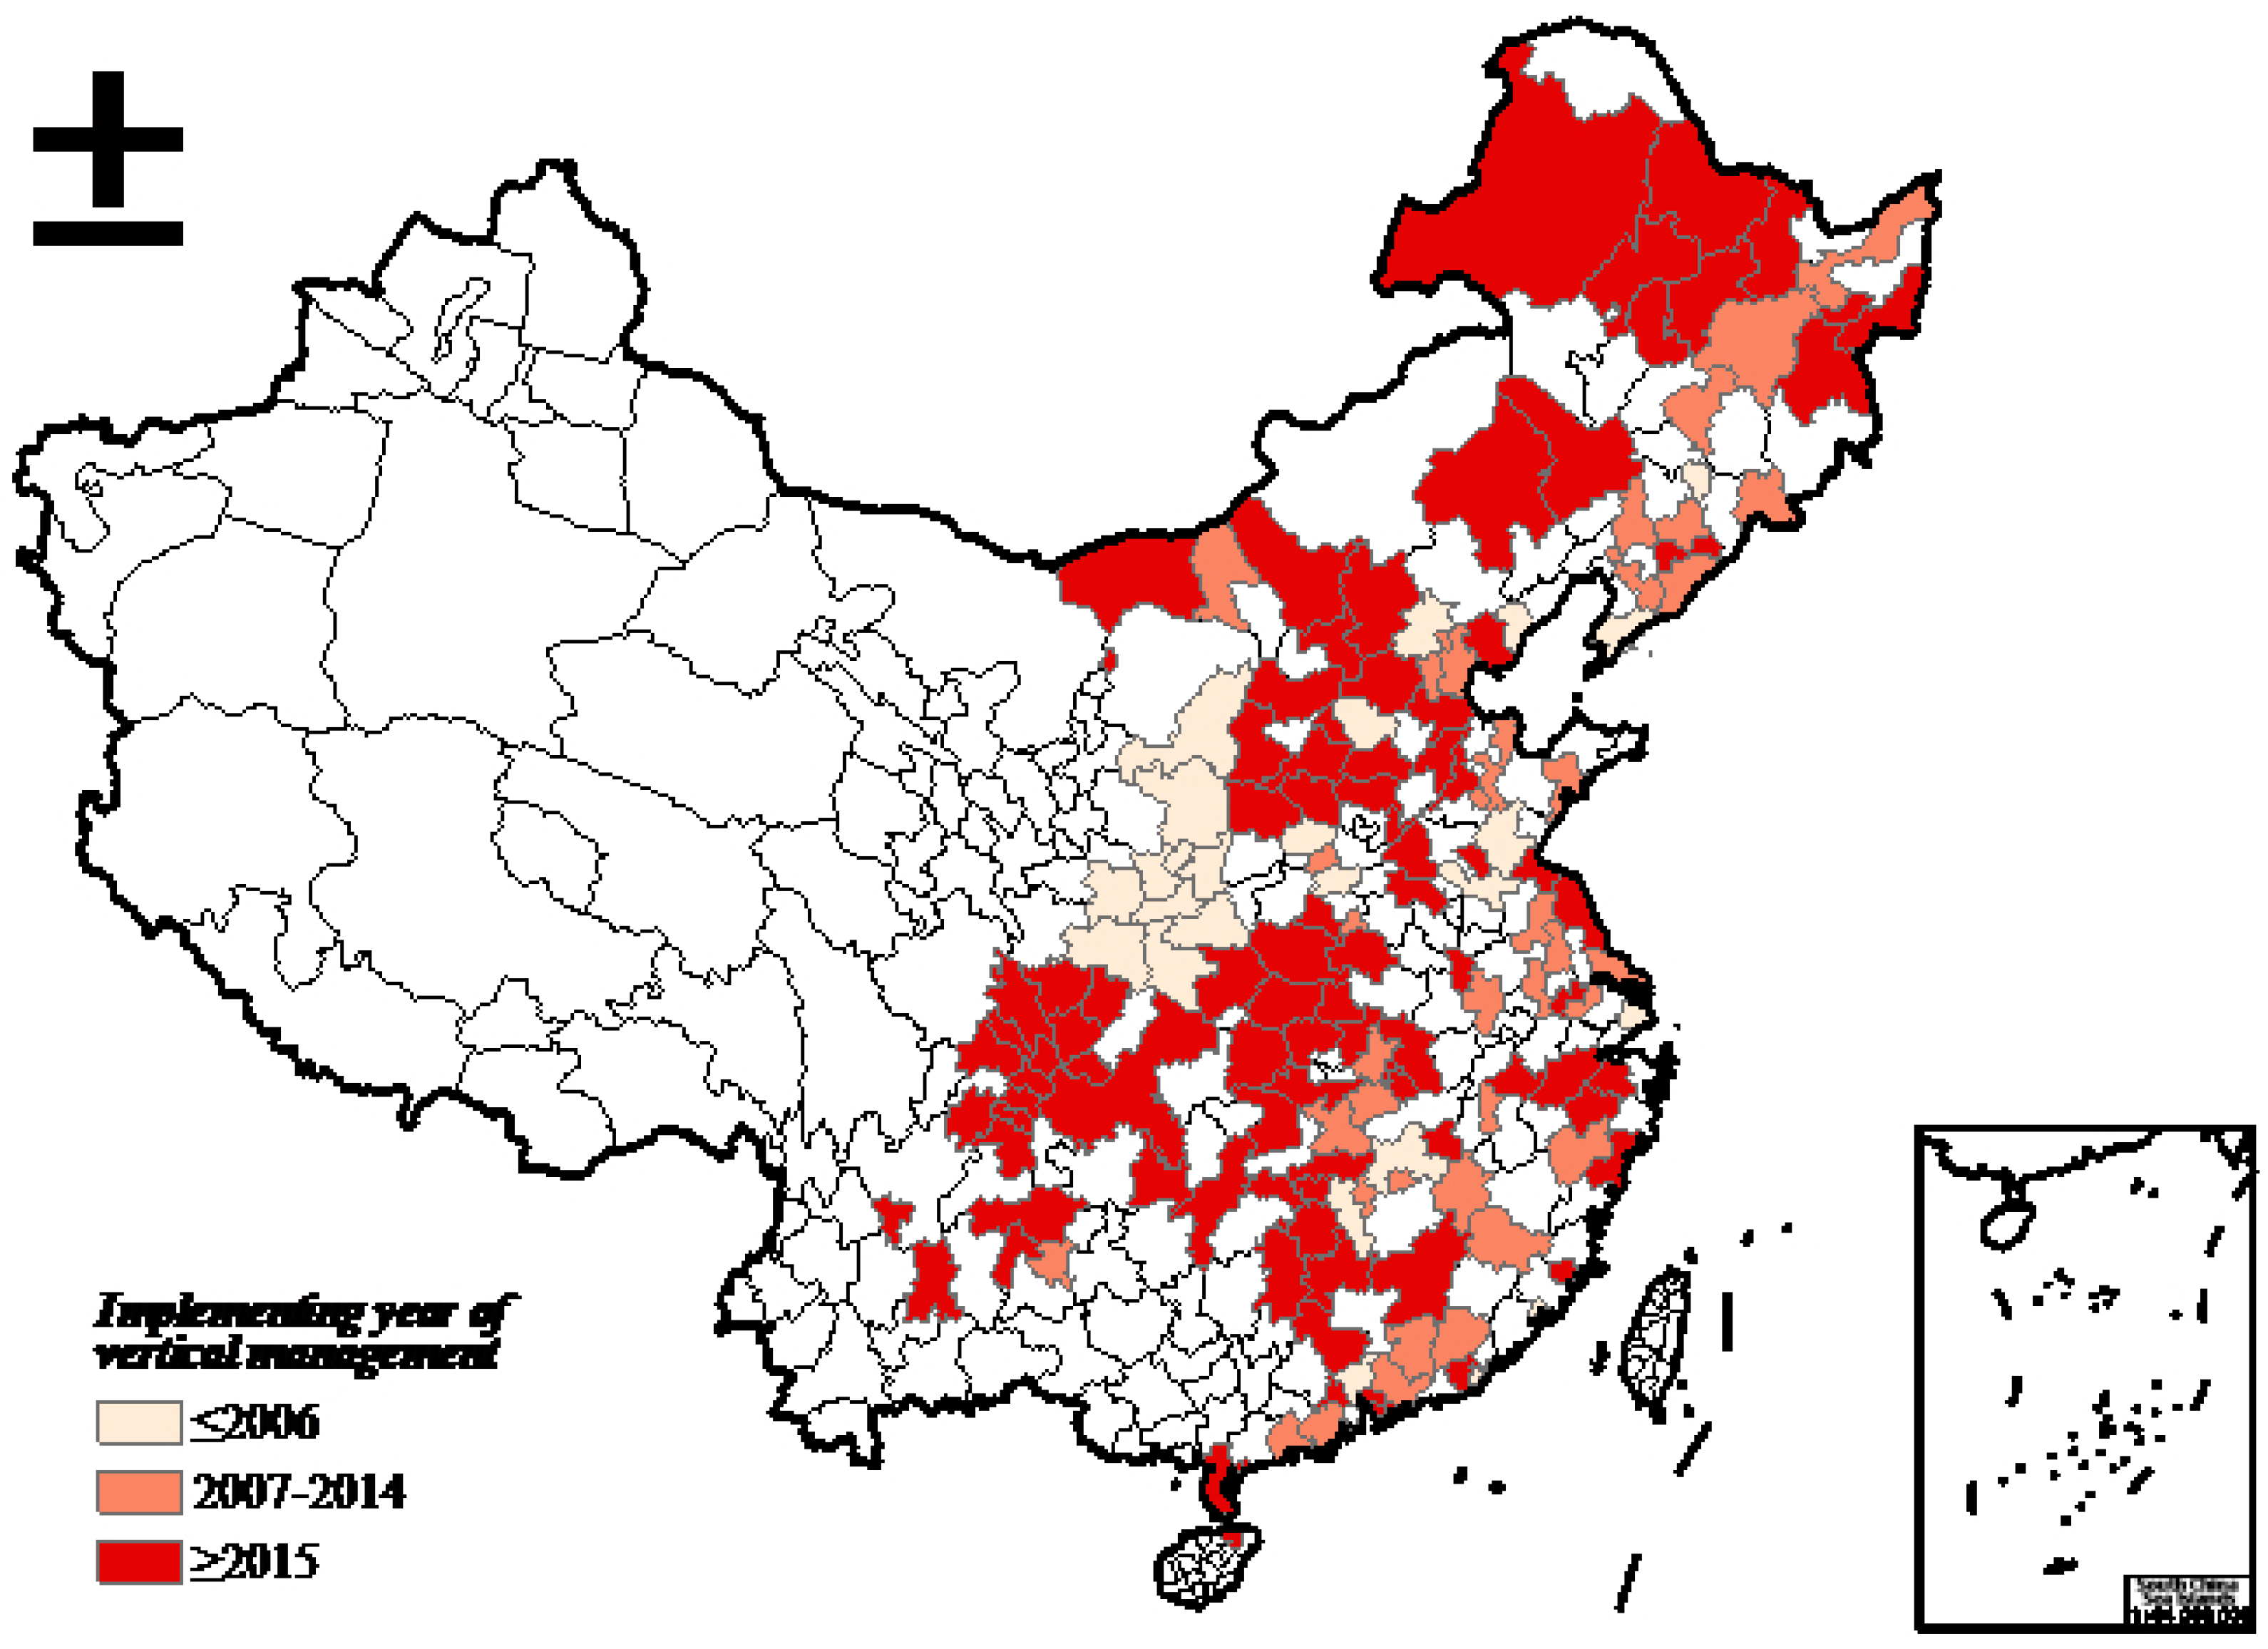
2.1. Environment Vertical Management Reform in China

Due to the rapid advancement of industrialization and urbanization, numerous Chinese enterprises have been discharging substantial volumes of wastewater, leading to a grave predicament of water pollution that poses significant threats to both the environment and human health [20]. To effectively control corporate water pollution discharge, the Chinese government has devised and implemented EVMR. Through these EVMRs, personnel authority, financial power, and environmental regulatory authority of environmental protection departments below the prefecture level were uniformly transferred to the prefecture-level environmental protection department, and this department assumes the responsibility for environmental supervision on the whole prefecture-level city [31,33]. Compared with the previous environmental territorial management system mainly led by the local governments, this policy leverages the compelling enforcement authority of both the central and local governmental bodies to compel enterprises into compliance with environmental regulations and standards, thereby ensuring the containment of their water pollution discharges within reasonable limits. Consequently, EVMR engenders a unified regulatory framework that consolidates resources and efforts for the supervision and governance of these concerns.
Since the inception of the first EVMR in 1994, these reforms have been implemented in 333 Chinese cities by 2022 (refer to Figure 1). Following the work of [31,33], this study divides the policy process of EVMR into the following three stages.
Initial phrase in prefecture-level cities (1994–2006). China’s environmental management system began taking shape in the 1970s [31]. However, from 1978, the central government progressively decentralized administrative and economic powers in environmental management to local governments [34], resulting in a decentralized framework. Notably, the implementation of the 1989 Environmental Protection Law of People’s Republic of China emphasized this decentralized approach. However, local governments focused on economic growth have relaxed environmental regulations within the decentralized context, leading to a “local race to the bottom” or local protectionism [5,16]. To address localized interference in environmental management, the central government advocated EVMRs within local environmental protection departments. Starting in 1994, the EVMR pilot was initiated at the prefecture-level Dalian, Liaoning Province. From 1994 to 2006, EVMRs in prefecture-level cities predominantly covered the pink area of Figure 2, and the number of these pilot cities is small, less than 30 cities (Figure 1).
Further development phrase (2007–2014). In the 21st century, the Chinese government prioritized addressing environmental pollution and strengthening centralized environmental management. An illustrative manifestation of this shift was the 2007 Special Environmental Protection Supervision undertaken by the Central Committee and the State Environmental Protection Administration, involving nationwide supervision of local environmental governance [25,34]. This indicated an era of heightened centralization in China’s environmental management since 2007, reflected by an upsurge in cities engaging in EVMR implementation. By 2014, the number of pilot cities was up to 80 (Figure 1), mainly distributed in the orange area of Figure 2.
Phrase of in-depth promotion below the province level (2015–present). Recognizing deficiencies in the traditional environmental management structure, China introduced the Guidelines for the Pilot Program for the Vertical Management Reform of Environmental Monitoring, Inspection and Law Enforcement below the Provincial Level in 2016 [25,31]. By 2022, the EVMRs below the province level have been conducted in 157 cities of 12 provinces (municipalities) such as Chongqing, Hebei, Shanghai, Jiangsu, Shandong, Hubei, Shanxi (Figure 1), mainly distributed in the red area of Figure 2. The core of EVMR at the provincial level is to transfer the personnel power, financial power, and environmental monitoring power of the prefecture-level environmental protection department to the province level so that the hierarchy of environmental protection agencies tends to be flattened [35]. This is a breakthrough of China’s environmental protection agencies from decentralization to a higher degree of centralization.

2.2. Theoretical Analysis and Research Hypothesis

Due to the inherent characteristics of non-excludability and non-rivalry, public goods necessitate governmental intervention to ensure effective governance and sustainable utilization. Among these, the water environment holds paramount significance, as its pollution or inadequate management can exert adverse impacts on public health, ecological system stability, and economic productivity. Scholars and policymakers have extensively investigated the “optimal” authority allocation across levels of environmental departments in the context of corporate pollution reduction, namely the “optimal” degree of environmental decentralization or centralization (see Section 1).
Under the traditional decentralized environmental governance system in China, the central government typically possesses the authority to formulate environmental policies, regulations, and standards, while local governments are responsible for the specific implementation and supervision. However, this decentralization system can give rise to agency problems [36,37]. Agency problems occur when an organization or individual (the agent) is authorized to act on behalf of another organization or individual (the principal), and the agent’s interests may not align entirely with those of the principal, resulting in inconsistent behavior or outcomes that deviate from the principal’s expectations [38,39]. For instance, the Chinese central government may emphasize environmental protection and sustainable development, while local governments might prioritize local economic growth and employment [40]. This could lead to a situation where local authorities lower regulatory standards or enforcement efforts in environmental supervision to meet local economic interests [25]. Additionally, agency issues could involve information asymmetry [41]. In the context of the territorial management system, local governments hold information advantages, whereas the central government faces information disadvantages [42]. Local governments control enterprise pollution through spot checks and penalties, while the central government relies on data monitoring and feedback from local governments. As a result, the central government lacks effective supervision over grassroots environmental agencies and polluting enterprises, while local governments are driven by both political and economic considerations, potentially conspiring with local businesses to relax environmental regulations.
EVMR has changed this phenomenon. By transferring environmental regulatory and monitoring powers upward, the central government now directly supervises local pollution control efforts. This shift changes the role of information asymmetry between central and local governments, making collusion between local governments and enterprises more challenging [43]. In the face of this regulatory power shift, local governments will no longer be able to offer “protection” to local polluting enterprises. Therefore, based on the principle of profit maximization, enterprises should adjust their production strategies to reduce their pollution emissions. Transforming production patterns is considered one effective means to reduce enterprise pollution [44]. Specifically, outsourcing non-core activities to specialized service providers can be a viable strategy. On the one hand, this enables enterprises to concentrate on their core competencies, efficiently managing and optimizing resources to minimize wastage [45]. On the other hand, outsourcing partners often possess expertise in their domains. By entrusting high-pollution activities to specialized service providers, enterprises can leverage their proficient management and skills, adopting advanced environmental technologies and methods to curtail emissions [46]. Based on the above analysis, we proposed the following two hypotheses:
Hypothesis 1.
The implementation of EVMR can effectively promote enterprises to reduce water pollution in pilot cities.
Hypothesis 2.
EVMR may lead to production pattern transformation to achieve WPR.

3. Methodology and Data

3.1. Econometric Model

3.1.1. Difference-in-Differences Method

The DID method is commonly applicable in empirical analysis to obtain the net effects of the policy shock by effectively alleviating the endogeneity problems [47,48]. EVMR, as a typical practice of environmental centralization in China, provides a quasi-natural experiment to establish a DID model. In addition, this study chooses the time-varying DID method to investigate the effects of EVMR on WPR since the traditional DID model is not applicable to evaluate the policy effects due to the inconsistent time point of EVMR implementation [47,49]. The specific model could be set up as follows:
w p a i j c t = β i + β j + β c + β t + β 1 V M R i j c t + β 2 Γ X i + ε i j c t
where w p a i j c t represents total amount of water pollution by enterprise i in industry j located in city c in year t . V M R i j c t , the interaction term r e f o r m × d t , is the core independent variable of this model. Specifically, r e f o r m is a policy dummy variable. If the enterprise is located in the pilot city, r e f o r m takes a value of 1 and otherwise is 0. d t represents time dummy variable, d t equals 1 during the pilot period and otherwise equals 0. If β 1 is significantly negative, it means EVMR effectively promotes WPR of enterprises. If β 1 is significantly positive, it means EVMR inhibits WPR, and if β 1 is not significant, it indicates EVMR is not directly related to WPR. Based on the analysis in the background, the implementation of EVMR can promote enterprises to improve WPR; thus, we expect a negative β 1 .
In addition, a vector of control variables X i is added into Equation (1) to control for the impact of firm- and region-level characteristics. β i , β j , β c , and β t respectively representing the fixed effects of individual enterprises, industry, city, and time are also added to control for time-invariant firm characteristics and individual-invariant time-varying characteristics.

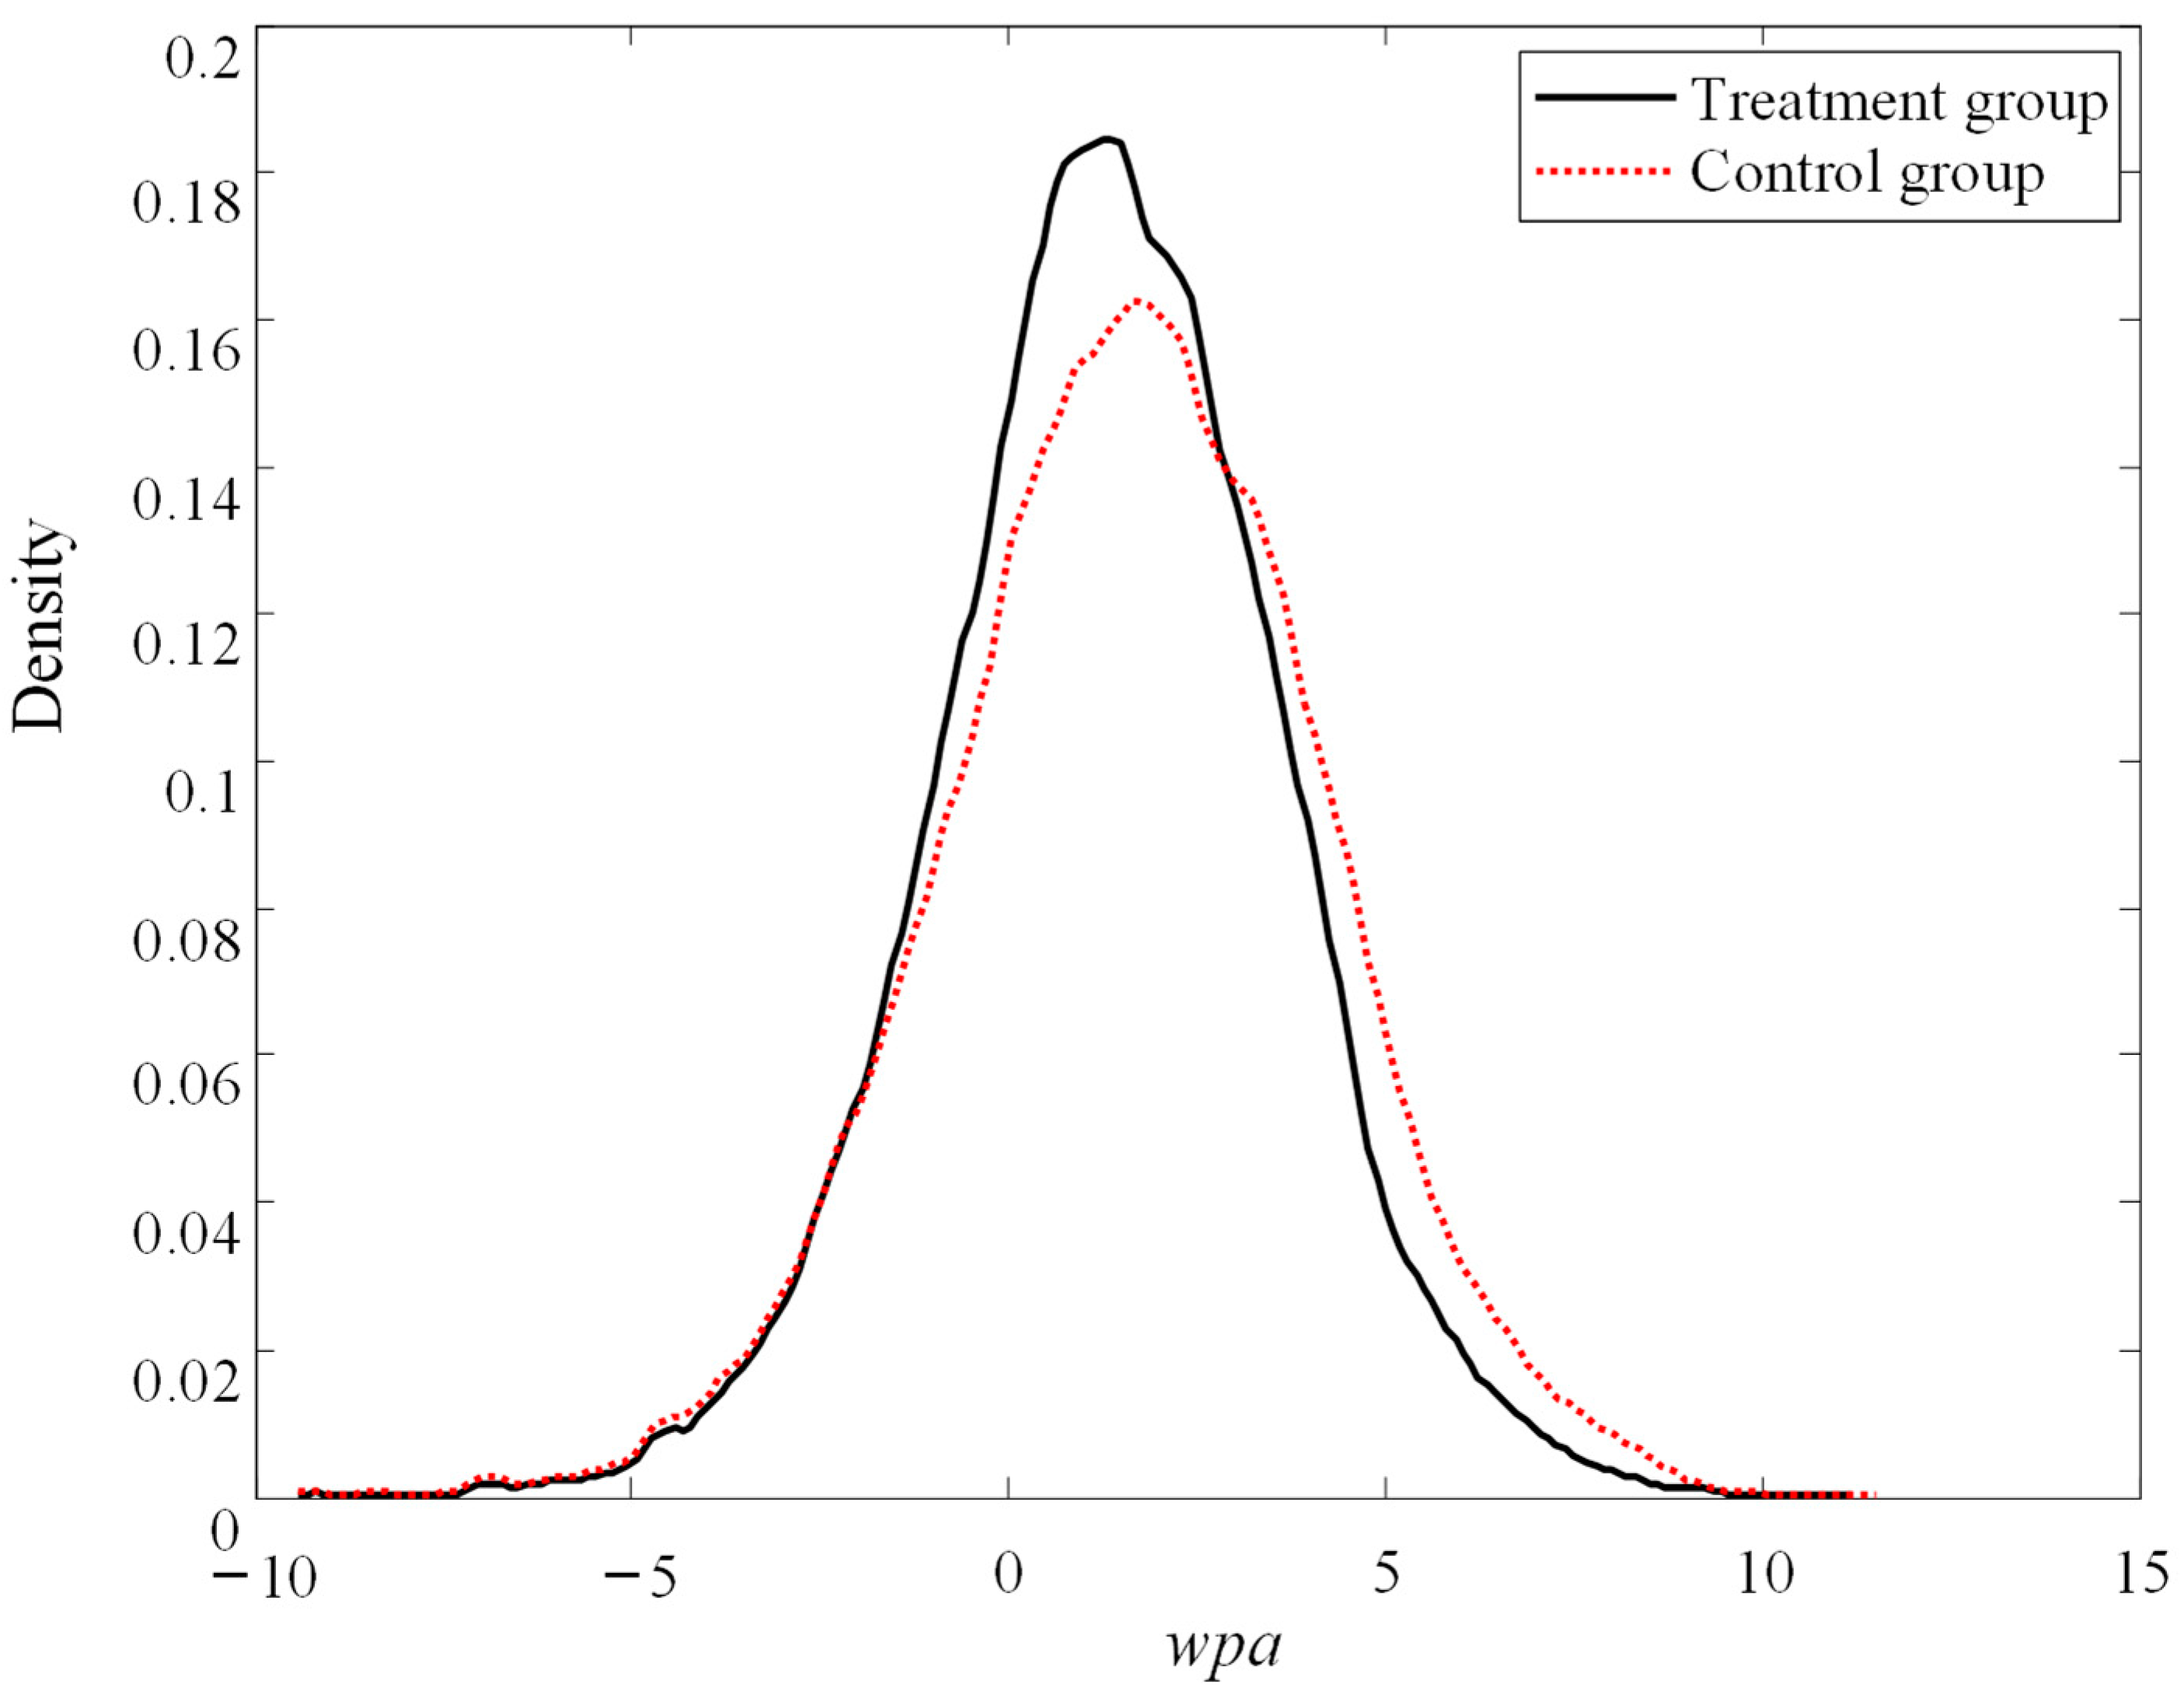
3.1.2. PSM-DID Approach

Another important prerequisite for the DID model is that the selection of the treatment group is random [50]. If non-random events interfere with EVMR implementation, such self-selection can lead to “confounding bias” and “selection bias” [47,50]. Following the work of [51] and [52], this study uses PSM to find a new control group that is as similar in characteristic change over time to the treatment group as possible and uses DID to obtain the new treatment effect. Specifically, the PSM-DID method consists of the following three steps:
First, estimate the following equation using the Probit model:
P i = P r o b i t D i = 1 | X i = Φ X i
where D i is a dummy variable representing whether city i is a pilot city. A city is a pilot city if at least one EVMR was conducted in this city. The value of D i is 1 if city i is a pilot city, otherwise the value of D i is 0. X i represents a battery of firm- and region-level characteristic variables, including logarithm of GDP, urbanization level, logarithm of road intensity and industrial upgrading. The data were obtained from China City Statistical Yearbook or the statistical yearbook of every province, autonomous region, or municipality in the relevant years. Φ represents the cumulative distribution function of the standard normal distribution. Given the characteristic variables of city i , the estimated value of propensity score, namely P ^ i , is obtained using Equation (3).
Second, employ the nearest neighbor matching. Specifically, for each city i in the region-level treatment group, select a city j i from the region-level control group as one of the samples in the new region-level control group. The region-level treatment group consists of cities where at least one EVMR was conducted and the region-level control group consists of cities where no EVMR was conducted. The estimated value of propensity score of X j , namely P ^ j , should be as close as possible to that of X i . That is, the following criteria must be met:
j i = arg min j P ^ j P ^ i , j
These selected samples comprise the new control group, which provides a more comparable reference for the treatment group, and the treatment group remain unchanged.
Third, conduct DID by re-estimating Equation (1) with these matched samples, and the new treatment effect is obtained. If the new effect is similar to the treatment effect, the benchmark results is robust even after avoiding the possible “confounding biases” and “selection biases” problems.

3.2. Data and Summary Statistics

3.2.1. Variable Selection

This study aims to examine the effect of EVMR on WPR. The dependent variable is water pollution amount (WPA), and the independent variable is the dummy variable V M R . As the information on when and where EVMRs were conducted has not been documented in detail, we manually collect and sort this information through the official websites of China’s environmental protection authorities and the People’s Government of China at all levels, as well as the China Environment Yearbook. Given a firm’s location, we can determine whether a firm is subject to EVMR policy or not in a year based on these data.
Referring to the existing literature [25,52], this study adds a vector of control variables to control for the impacts of firm- and region-level characteristics. Specifically, firm-level variables include enterprise growth ( g r o w t h ), fixed capital stock ( K ), and profit margin ( p r o f i t ), and region-level variables include degree of industrial agglomeration ( a g g l o ), industrial upgrading ( i n d u ), infrastructure ( r o a d ), and foreign direct investment ( F D I ). The specific variables and definitions are shown in Table 1.

3.2.2. Data Sources and Descriptive Statistics

The data for enterprise sample are obtained from CIED and CEPED from 1998 to 2014. CEPED is rich in enterprise information, including a range of indicators such as enterprise name, administrative division, total industrial water consumption, and industrial wastewater discharge. Meanwhile, we use the enterprise names and legal representatives to match these data with the enterprise data provided by CIED. CIED is also a firm-level database with comprehensive information, including over 100 financial indicators. After matching, we obtain 227,693 enterprise samples, of which the large sample size can greatly improve the validity of the sample data.
To avoid the influence of samples with accounting statistical error, referring to [53], we delete the samples conforming to the following accounting standards: (1) sales revenue is below the export value; (2) fixed assets or current assets are greater than total assets; (3) total output value is zero; (4) total output value (fixed assets) is less than zero; (5) the start year is later than the current year or the start month is later than December. Moreover, this study takes the GDP deflator as an inflation indicator to eliminate the impact of price factors. The descriptive statistics of data are shown in Table 2.

3.2.3. Preliminary Observation of Data

To visualize the distributional stability of some important characteristics of the treatment (pilot cities of EMVR) and control groups (other cities), we draw the distribution density of the average WPR after EVMR implementation. As shown in Figure 3, the red and the black curves, respectively, represent the distribution of control and treatment groups. It is observed that the two probability density curves are very similar in shape, indicating the distribution characteristics of two groups are relatively the same (Lyu et al., 2023) [52]. Moreover, the curve for treatment group shifts toward the left direction compared with the curve for control group. Thus, we preliminarily speculate that it may be the knock-on effects of EVMR on WPR, though the effects need further accurate estimation.

4. Empirical Results and Analysis

4.1. Baseline Results

Presented in Table 2 are the baseline results of the time-varying DID model. The result in column (1) of Table 3 shows that the coefficient of V M R is significantly negative at 5%, which means that EVMR effectively promotes enterprises to reduce their water pollution discharge. This is consistent with the research of [25,29], who find that EVMR improves enterprises’ performance in pollution reduction. The result also indicates that improvement in management efficiency has a positive impact on a firm’s environmental performance and its importance in achieving sustainable development goals (SDGs).
Considering the geographical distribution of the cities implementing EVMR, this paper controls city-level characteristics. Different from studies using region-level data [16,24,25], this paper uses data from CIED and CEPED, so the characteristics at the firm level should also be controlled. Specifically, we control enterprises’ growth rates of gross output values, firms’ fixed capital stocks, and enterprises’ profit margins. Further regression results are shown in column (2) in Table 3. After controlling other characteristics and variables, the impact of EVMR on firm WPR is still significantly negative at 5%, further confirming that the reform in the environment management system can improve the environmental performance of enterprises. In addition, the increase in a firm’s growth rate of gross output value, fixed capital stock, foreign direct investment, industrial upgrading, and agglomeration will aggravate its water pollution discharge.
In addition, we use different pollution indicators to investigate the effects of EVMR on WPR. Chemical oxygen demand (COD) and ammonia nitrogen (NH3-N), the main pollutants in wastewater, provide alternative measures to investigate the effect of EVMR on WPR. As shown in columns (3) of Table 3, the coefficient of V M R is −0.0364 (p < 0.05), indicating that the implementation of EVMR promotes enterprises to diminish COD discharge by 3.64%, further ensuring the robustness of the baseline results. However, column (4) shows that the effect of EVMR on the NH3-N discharge is positive at the 10% level, implying that EVMR does not inhibit NH3-N discharge. As the NH3-N in wastewater is difficult to treat [54,55], enterprises tend to make more efforts in COD reduction instead of NH3-N reduction for cost and complexity reasons when faced with stricter environmental regulations. In addition, the relevant national standards emphasize COD reduction rather than NH3-N reduction. For national standards such as China’s 12th Five-Year-Plan, see http://www.gov.cn/2011lh/content_1825838.htm (accessed on 10 March 2023), which may raise enterprises’ efforts in COD reduction and reduce their efforts in NH3-N reduction. Thus, a COD discharge reduction effect accompanied by a positive effect on COD emission is observed after policy implementation.

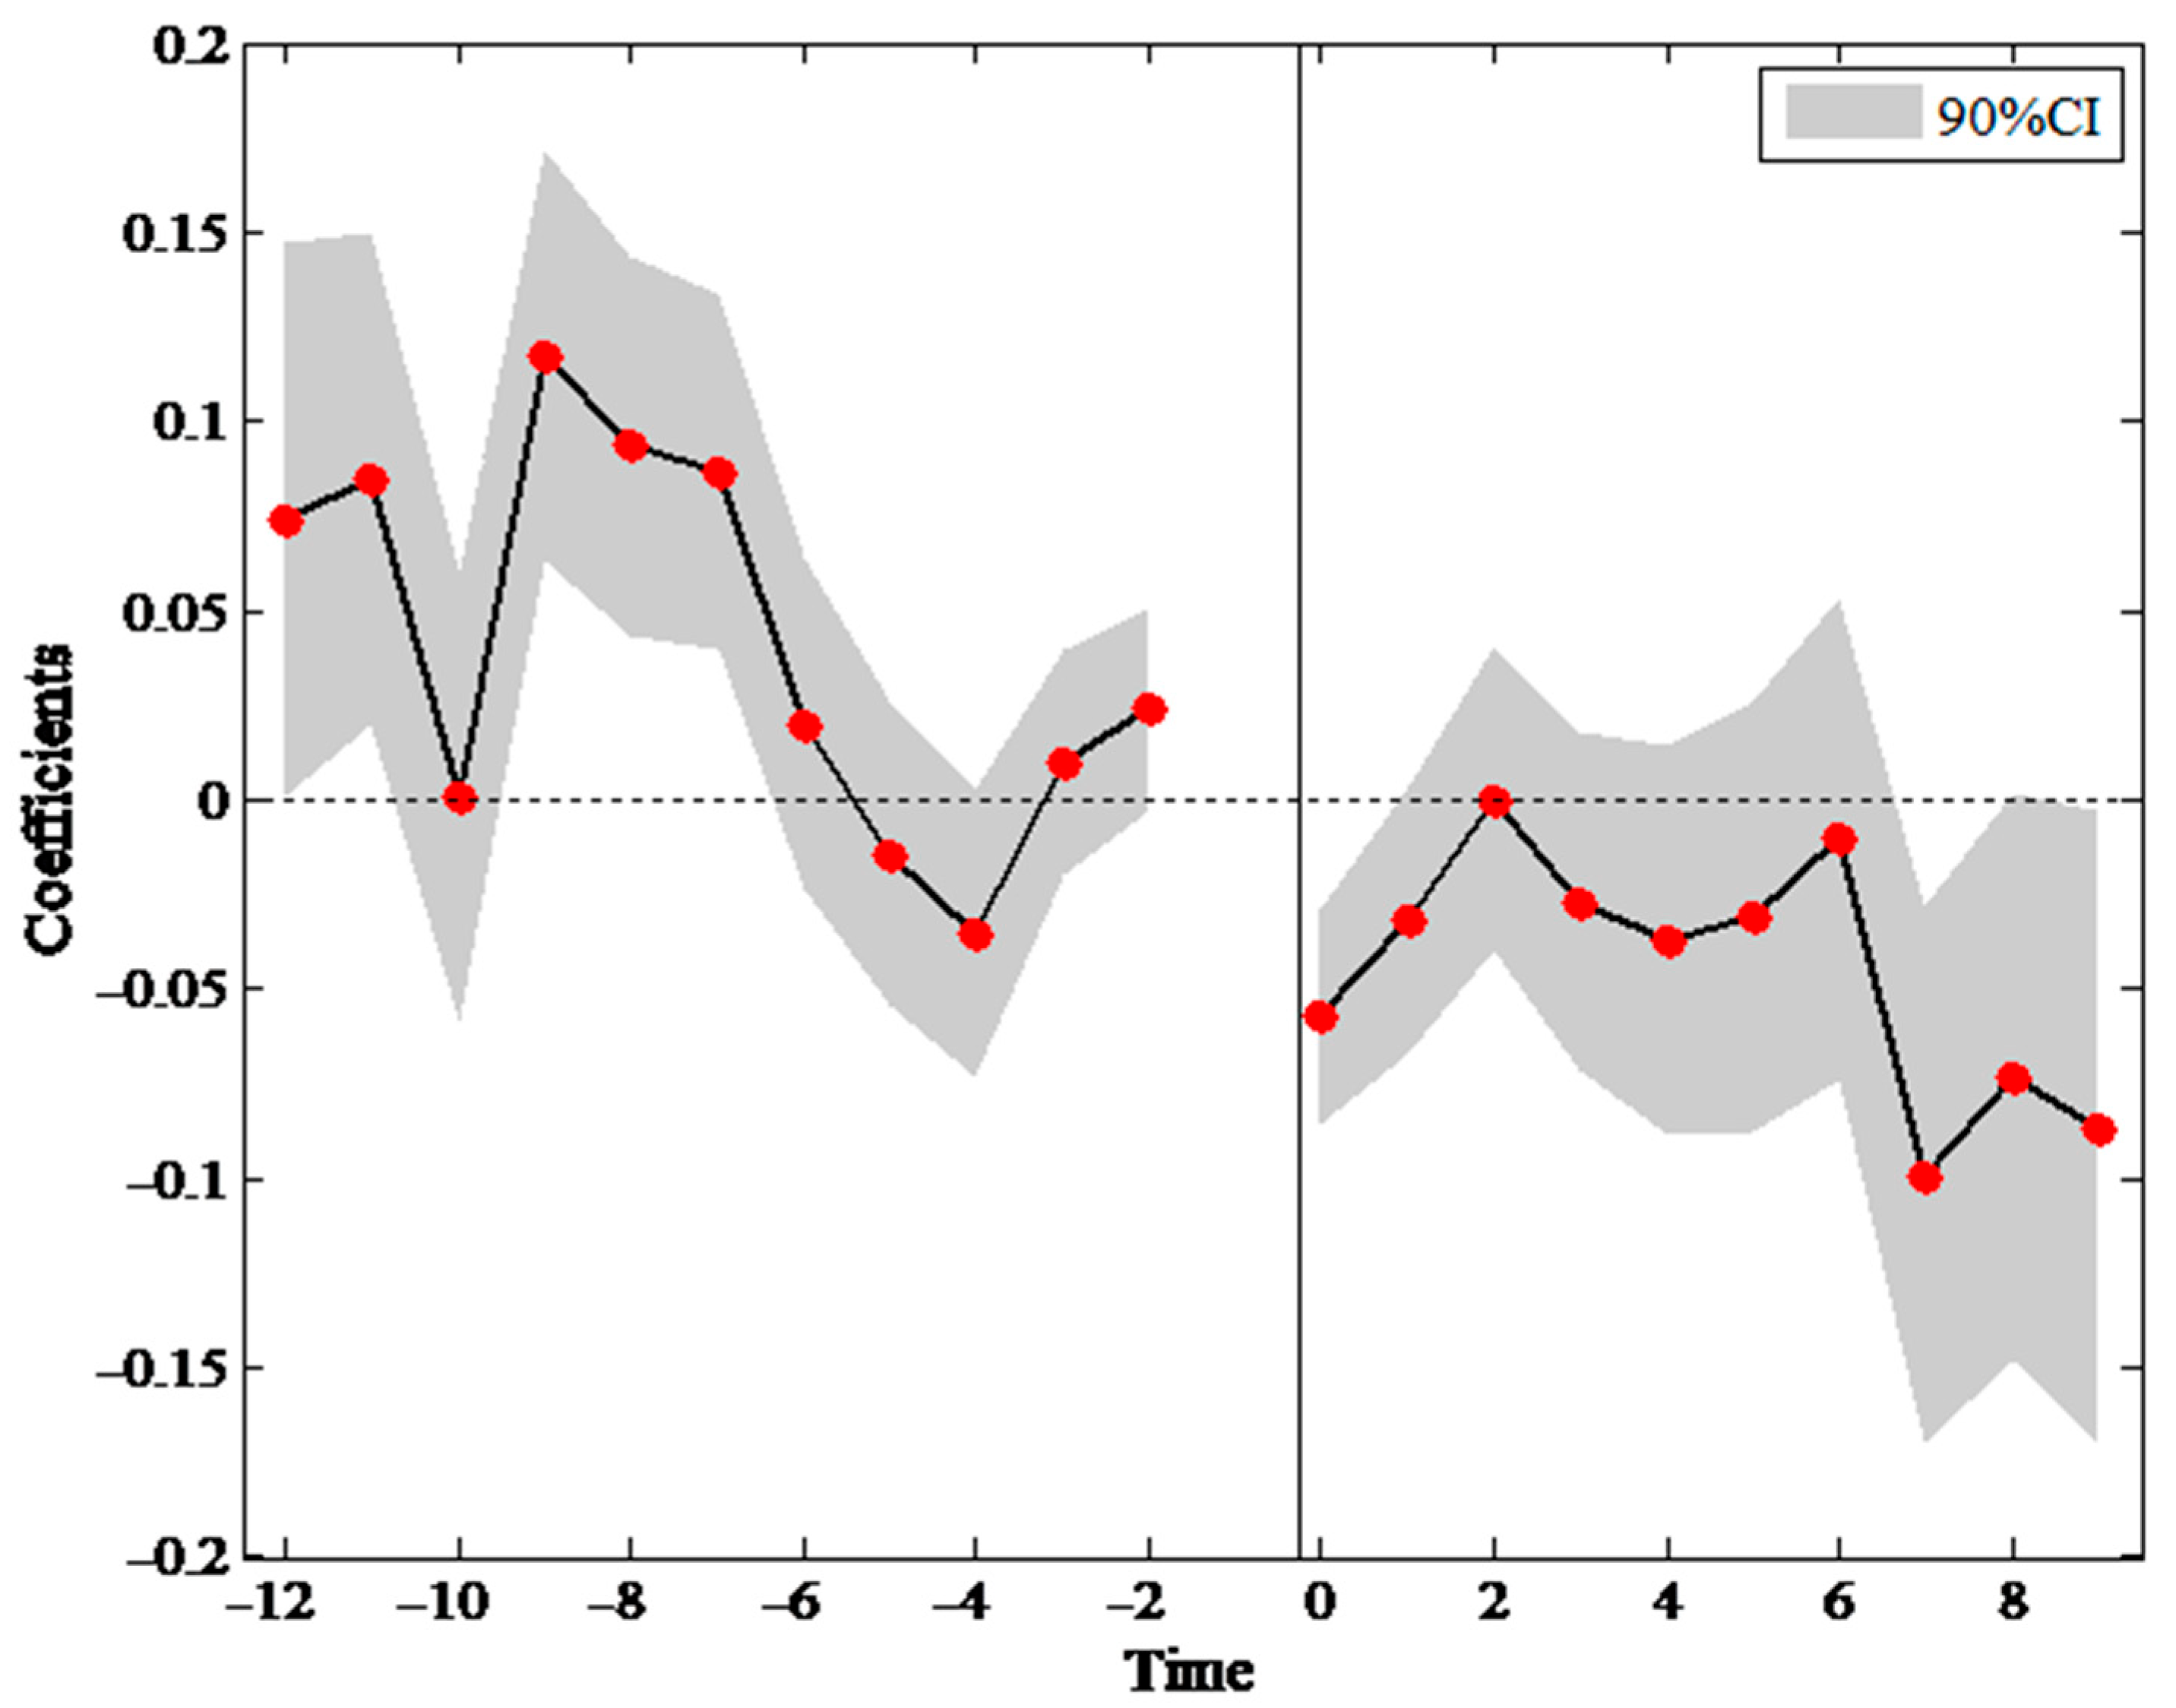
4.2. Results of Parallel Trend Test

This study uses the 12 years prior to and 8 years after EVMR implementation as observation points to construct a PTT model. The estimated coefficients with their 90% confidence intervals are shown in Figure 4. We find that the estimated coefficients, before the implementation of EVMR, are significantly positive or not significant, indicating that the difference between the mean values of water pollution of the treatment and control groups is fixed or not significant [56]. In contrast, the estimated coefficients, after EVMR implementation, become negative immediately, indicating the negative effects of EVMR on water pollution. These findings show that the parallel trend assumption holds [52], and it is rational to use the DID model to investigate the effects of EVMR on WPR.

4.3. Results of PSM-DID

To control for “confounding bias” and “selection bias”, we combine PSM and DID to investigate the effect of EVMR on WPR using Equation (3), and the PSM-DID results are shown in Table 4. As shown in columns (1) and (2) of Table 4, the coefficients of V M R are negative at the 1% level whether Equation (1) has control variables or not. It indicates that the impact of EVMR remains significant even after overcoming the selection and confounding bias. That is to say, the negative effects of EVMR remain unchanged when the pilot cities are randomly designated [57]. Our estimation results of PSM-DID further verify the robustness of baseline results.

5. Heterogeneity Analysis

Referring to existing literature [52,58], the effects of environmental regulations on enterprises’ WPR can be affected by region- and firm-level characteristics. Thus, we further investigate whether the effects of EVMR on WPR vary with enterprise sizes, regions, and industry pollution intensities.
According to the Methods for the Classification of Statistically Large, Small, and Micro Enterprises (2017) and the Industry Classification of National Economy (GB/T4754-2017), we divide enterprises into large-, medium-, small- and micro-sized enterprises, Large-sized enterprises are enterprises with GDP of more than 400 million CNY, medium-sized enterprises are enterprises with GDP of more than 20 million and less than 400 million CNY, small-sized enterprises are enterprises with GDP of more than 3 million and less than 20 million CNY, and micro-sized enterprises are enterprises with GDP of less than 3 million CNY and investigate the impacts of EVMR on enterprises of different sizes. As shown in Table 5, the estimated coefficients of V M R for large- and medium-sized enterprises (LMEs) are significantly negative at the 1% level, indicating that EVMR can effectively promote LMEs to reduce water pollution. Since LMEs can reduce or offset the cost of pollution control caused by environmental regulations through achieving “scale effects” [59], they are more capable or willing to deal with environmental problems by reducing pollution emissions [60]. Conversely, the estimated coefficients of V M R for small- and micro-sized enterprises are not statistically significant, indicating that EVMR does not affect enterprises’ WPR. Since they are unwilling to or cannot afford the high costs of pollutant treatment because of their small scale and lack of matched pollutant treatment equipment, the effects of EVMR on the WPR of small- and micro-sized enterprises are fairly limited [58].
Different provinces and cities in China have great differences in the socioeconomic development level and environmental problems [61]. In terms of environmental government, the implementation efficiency of local governments is uneven, and thus, the effects of EVMR may have regional heterogeneity. Following the classification standard of three economic zones by the National Bureau of Statistics of China, we divide the samples into enterprises in the eastern, central, and western regions of China. As shown in Table 6, the coefficients of V M R , except for the western region, are significantly negative at the 1% level. It indicates that EVMR can effectively promote enterprises in the central and western regions to improve water pollution treatment, whereas EVMR has nothing to do with water pollution treatment in the eastern region. Compared with the eastern region, the other regions prioritize economic growth and tax revenue over environmental pollution reduction due to their lower development and industrialization levels [25,61]. When EVMRs were conducted, local governments of the pilot cities in the central and western regions had no choice but to deal with environmental problems. As a result, the stricter regulation leads to significant effects on enterprises’ WPR in these regions and an insignificant effect on enterprises’ WPR in the east [33].
With reference to the classification of [62], we divide the samples into enterprises operating in industries with high pollution intensity and those in industries with low pollution intensity by estimating the amount of pollution emitted per unit of output. As shown in columns (1) and (2) of Table 7, there is no direct relationship between EVMR implementation and WPR of the enterprises in industries with high pollution intensity, while EVMR can effectively promote those in industries with low pollution intensity to reduce water pollution. The possible reason is that the industries with high pollution intensity have always been the focus of monitoring under China’s environmental protection authorities, thus having tighter environmental regulation, and EVMR has an extremely limited impact on WPR reduction in these industries [25]. Conversely, enterprises in industries with low pollution intensity are often faced with more lax environmental regulations; thus, they are forced to strengthen pollution emission reduction in the face of stricter environmental regulation.

6. Influencing Mechanism Analysis

The results above confirm that EVMR effectively promotes enterprises to reduce water pollution. What are the influencing mechanisms of this effect? After EVMR implementation, enterprises usually adopt two approaches to reduce water pollution. One is to purchase wastewater treatment facilities for the sewage treatment terminal, which is one of the most direct ways to treat wastewater [63]. The other is to transform production patterns toward clean production or pollution treatment outsourcing, thereby reducing fresh water consumption and raising water pollutant removal rates accordingly [52]. Thus, we examine the mechanisms from the perspective of wastewater treatment facilities, production mode, fresh water consumption, and removal rates of water pollutants. The regression results are shown in Table 8.
First, we investigate the impact of EVMR on the number of wastewater treatment facilities, and the results are shown in column (1) of Table 8. The coefficient of V M R is not significant, implying that EVMR has no impact on the number of wastewater treatment facilities. The possible reason is that wastewater treatment facilities are classified as high-investment fixed assets, and enterprises tend to carry out technical transformation of the original treatment facilities rather than new equipment purchases; this finding is consistent with the fact that enterprises are unwilling to equip pollution treatment facilities to incur high costs [58].
According to transaction cost theory, when the marginal cost of internal transactions is smaller than the marginal cost of market transactions, enterprises tend to raise the degree of vertical integration by internalizing some external market activities to reduce total costs [45]. To examine the impact of EVMR on the degree of vertical integration of enterprises, we discuss the impact of EVMR on the vertical integration index and the amount of fresh water consumption. As shown in columns (2) and (3) of Table 8, EVMR has a negative impact on the vertical integration index and fresh water consumption. It implies that EVMR prompts more enterprises to outsource some production activities, such as pollution treatment, and thus, fresh water consumption is reduced.
Furthermore, most enterprises often outsource the difficult-to-treat part of the wastewater, which not only saves costs but also greatly improves the efficiency of water pollution treatment of enterprises. Then, using the removal rates of COD and NH3-N, we further explore the influencing mechanism based on this idea. As shown in columns (4) and (5) of Table 8, the removal rates of COD and NH3-N are significantly negative at the 1% level, indicating that EVMR effectively promotes enterprises to improve the removal rates of COD and NH3-N. Specifically, the removal rates of COD and NH3-N in wastewater respectively increase by 3.64% and 2.84%, demonstrating that the efficiency of water pollution treatment is improved. Based on the above analysis, we find that transforming the production mode toward clean production or pollution treatment outsourcing is the crucial channel through which an EVMR policy affects the WPR of enterprises.

7. Conclusions and Implications

Enterprises, being the primary economic contributors and major polluters, play a pivotal role in achieving the SDGs. Enterprises’ production patterns and pollutant discharge will be influenced by the efficiency of a local government’s environmental management. Taking EVMR, a quasi-natural experiment implemented in China, this article constructs a time-varying DID to evaluate the effect of the centralization of the environmental management of WPR by using a novel large-scale micro-dataset, and the benchmark results have passed a series of robustness tests such as PSM-DID.
The main conclusions of this study are the following. First, EVMR can significantly promote the firm-level WPR, indicating the improvement in management efficiency has a positive impact on the firm’s environmental performance. Second, the policy effects are heterogeneous in terms of enterprise regions, industry pollution intensities, and sizes. The positive effects are more pronounced for enterprises in the western region, enterprises in low-polluting industries, and large enterprises. Third, the influencing mechanism analysis reveals that EVMR promotes WPR by stimulating production pattern transformation and decreasing fresh water consumption rather than by increasing wastewater treatment facilities.
Based on the findings presented above, the following policy recommendations are proposed. First, governments could consider expanding the implementation of EVMR across various regions and industries. This can be achieved by introducing EVMRs into the areas where they have not yet been adopted or by further enhancing their scope in implemented regions. A wider adoption of EVMR policies might lead to greater reductions in water pollution discharge. Second, the government could formulate policies that consider the variations in the impact of EVMR across different regions, industry sectors, and enterprise sizes. For instance, enhanced support and incentive measures can be offered to enterprises that exhibit a less significant response to EVMR. Third, the government can incentivize enterprises to transform their production patterns. For instance, they can promote outsourcing specific production activities, particularly the challenging aspects of wastewater treatment. This approach not only has the potential to yield cost savings for businesses but also enhance the efficiency of water pollution abatement. Furthermore, governmental support for technological upgrades can be instrumental in assisting enterprises in enhancing their wastewater treatment and emissions reduction capabilities.
There are several limitations to the work presented in our study. One is that due to the implementation scope of EMVR and data availability, this paper fails to analyze the effect of EVMR implementation in a wider range of countries. Another limitation is that the effects of EMVR on WPR performance in agriculture and services sectors are not discussed in this paper due to data availability. Despite these limitations, the DID model used in this paper offers a promising approach to investigating the net effect of policy implementation. In future research, given that the current research is confined to specific nations or regions, subsequent investigations could broaden their scope by comparing the effects of EVMR policy implementation across various countries or regions. In addition, future research can delve deeper into the impacts of EVMR implementation on WPR performance in distinct sectors, such as agriculture and services, to comprehensively comprehend the policy’s effects.

Author Contributions

M.J. contributes to conceptualization, funding acquisition, formal analysis, and writing-reviewing and editing. Z.W. contributes to formal analysis, methodology, writing-original draft, and writing-reviewing and editing. D.Z. contributes to data curation, formal analysis, methodology, software, and writing-reviewing and editing. All authors have read and agreed to the published version of the manuscript.

Funding

This research is supported by the National Social Science Foundation of China: 23BGJ077 (the funder is Mengxue Ji).

Institutional Review Board Statement

Not applicable.

Informed Consent Statement

Not applicable.

Data Availability Statement

The data are available from the first author upon request.

Conflicts of Interest

The authors declare no conflict of interest.

References

  1. World Meteorological Organization—WMO. Europa Directory of International Organizations 2021; Canton, H., Ed.; Routledge: London, UK, 2021; pp. 388–393. [Google Scholar]
  2. Choi, J.; Hearne, R.; Lee, K.; Roberts, D. The relation between water pollution and economic growth using the environmental Kuznets curve: A case study in South Korea. Water Int. 2015, 40, 499–512. [Google Scholar] [CrossRef]
  3. Madhav, S.; Ahamad, A.; Singh, A.K.; Kushawaha, J.; Chauhan, J.S.; Sharma, S.; Singh, P. Water Pollutants: Sources and Impact on the Environment and Human Health. In Sensors in Water Pollutants Monitoring: Role of Material; Springer Nature: Singapore, 2019; pp. 43–62. [Google Scholar] [CrossRef]
  4. Delmas, M.A. The diffusion of environmental management standards in Europe and in the United States: An institutional perspective. Policy Sci. 2002, 35, 91–119. [Google Scholar] [CrossRef]
  5. Lin, B.; Xu, C. Does environmental decentralization aggravate pollution emissions? Microscopic evidence from Chinese industrial enterprises. Sci. Total. Environ. 2022, 829, 154640. [Google Scholar] [CrossRef] [PubMed]
  6. Chu, Y.J.; Jue, W. The Dilemma and solution of Water pollution Control from the Perspective of Environmental Regulation. In E3S Web of Conferences; EDP Sciences: Les Ulis, France, 2019; Volume 136. [Google Scholar]
  7. Medema, W.; McIntosh, B.S.; Jeffrey, P.J. From premise to practice: A critical assessment of integrated water re-sources management and adaptive management approaches in the water sector. Ecol. Soc. 2008, 13, 29. [Google Scholar] [CrossRef]
  8. Ren, S.; Du, M.; Bu, W.; Lin, T. Assessing the impact of economic growth target constraints on environmental pollution: Does environmental decentralization matter? J. Environ. Manag. 2023, 336, 117618. [Google Scholar] [CrossRef]
  9. Oates, W.E. A reconsideration of environmental federalism. In Environmental Policy and Fiscal Federalism; Edward Elgar Publishing: London, UK, 2004; pp. 125–156. [Google Scholar]
  10. Ponce-Rodríguez, R.A.; Hankla, C.R.; Martinez-Vazquez, J.; Heredia-Ortiz, E. Rethinking the Political Economy of Decentralization: How Elections and Parties Shape the Provision of Local Public Goods. Publius 2018, 48, 523–558. [Google Scholar] [CrossRef]
  11. Da Silva, B.E.B.; Azevedo-Ramos, C.; Farias, H.A.B. The impact of decentralization policies: The environmental performance applied to municipalities of the Amazon. Desenvolv. Meio Ambient. 2019, 51, 202–223. [Google Scholar] [CrossRef]
  12. Lin, B.; Zhou, Y. Does fiscal decentralization improve energy and environmental performance? New perspective on vertical fiscal imbalance. Appl. Energy 2021, 302, 117495. [Google Scholar] [CrossRef]
  13. Holzinger, K.; Sommerer, T. ‘Race to the bottom’ or ‘race to Brussels’? Environmental Competition in Europe. J. Common Mark. Stud. 2011, 49, 315–339. [Google Scholar] [CrossRef]
  14. Lipscomb, M.; Mobarak, A.M. Decentralization and Pollution Spillovers: Evidence from the Re-drawing of County Borders in Brazil. Rev. Econ. Stud. 2016, 84, 464–502. [Google Scholar] [CrossRef]
  15. Konisky, D.M. Regulatory Competition and Environmental Enforcement: Is There a Race to the Bottom? Am. J. Political Sci. 2007, 51, 853–872. [Google Scholar] [CrossRef]
  16. Li, W.; Yang, Y. Can environmental centralization help reduce pollution? Evidence from an administrative reform in China. J. Clean. Prod. 2021, 314, 127972. [Google Scholar] [CrossRef]
  17. Millimet, D.L. Environmental federalism: A survey of the empirical literature. Case W. Res. L. Rev. 2013, 64, 1669. [Google Scholar] [CrossRef]
  18. Sigman, H. Transboundary spillovers and decentralization of environmental policies. J. Environ. Econ. Manag. 2005, 50, 82–101. [Google Scholar] [CrossRef]
  19. Bedner, A. Consequences of decentralization: Environmental impact assessment and water pollution control in Indonesia. Law Policy 2010, 32, 38–60. [Google Scholar] [CrossRef]
  20. Chen, Z.; Kahn, M.E.; Liu, Y.; Wang, Z. The consequences of spatially differentiated water pollution regulation in China. J. Environ. Econ. Manag. 2018, 88, 468–485. [Google Scholar] [CrossRef]
  21. Du, X.; Guo, H.; Zhang, H.; Peng, W.; Urpelainen, J. Cross-state air pollution transport calls for more centralization in India’s environmental federalism. Atmos. Pollut. Res. 2020, 11, 1797–1804. [Google Scholar] [CrossRef]
  22. Helland, E.; Whitford, A.B. Pollution incidence and political jurisdiction: Evidence from the TRI. J. Environ. Econ. Manag. 2003, 46, 403–424. [Google Scholar] [CrossRef]
  23. Hong, T.; Yu, N.; Mao, Z. Does environment centralization prevent local governments from racing to the bot-tom?—Evidence from China. J. Clean. Prod. 2019, 231, 649–659. [Google Scholar] [CrossRef]
  24. Fredriksson, P.G.; Wollscheid, J.R. Environmental decentralization and political centralization. Ecol. Econ. 2014, 107, 402–410. [Google Scholar] [CrossRef]
  25. Han, C.; Sun, X.; Li, J. Emission reduction effect of vertical management reform in environmental regulation—Evidence from environmental system reform in cities. China Econ. Q. 2021, 21, 335–360. (In Chinese) [Google Scholar]
  26. Revesz, R.L. Federalism and Environmental Regulation: A Public Choice Analysis. Harv. Law Rev. 2001, 115, 553. [Google Scholar] [CrossRef]
  27. Besley, T.; Ghatak, M. Incentives, Choice, and Accountability in the Provision of Public Services. Oxf. Rev. Econ. Policy 2003, 19, 235–249. [Google Scholar] [CrossRef]
  28. Luo, Z.; Hu, X.; Li, M.; Yang, J.; Wen, C. Centralization or Decentralization of Environmental Governance—Evidence from China. Sustainability 2019, 11, 6938. [Google Scholar] [CrossRef]
  29. Zhou, Q.; Cui, X.; Ni, H.; Gong, L. The impact of environmental regulation policy on firms’ energy-saving behavior: A quasi-natural experiment based on China’s low-carbon pilot city policy. Resour. Policy 2022, 76, 102538. [Google Scholar] [CrossRef]
  30. Ranade, V.V.; Bhandari, V.M. Industrial Wastewater Treatment, Recycling and Reuse; Butterworth-Heinemann: Oxford, UK, 2014. [Google Scholar]
  31. Zhou, D. China’s Environmental Vertical Management Reform: An Effective and Sustainable Way Forward or Trouble in Itself? Laws 2020, 9, 25. [Google Scholar] [CrossRef]
  32. Xu, T. The selective centralization in decentralization: China’s environmental vertical management reform with a case study in Hebei province. Int. J. Water Resour. Dev. 2022, 38, 634–657. [Google Scholar] [CrossRef]
  33. Han, C.; Tian, X.L. Less pollution under a more centralized environmental system: Evidence from vertical environmental reforms in China. Energy Econ. 2022, 112, 106121. [Google Scholar] [CrossRef]
  34. Cai, F.; Li, X.; Shen, X.Y. Performing the Broad-Based Strengthening of the Environmental Management System through Authoritative Actions. China Environment News. 3 April 2015. Available online: http://www.chinanews.com/ny/2015/04-02/7179336.shtml (accessed on 17 June 2020). (In Chinese).
  35. Patacconi, A. Coordination and delay in hierarchies. RAND J. Econ. 2009, 40, 190–208. [Google Scholar] [CrossRef]
  36. Epple, D.; Nechyba, T. Fiscal decentralization. In Handbook of Regional and Urban Economics; Elsevier: Amsterdam, The Netherlands, 2004; Volume 4, pp. 2423–2480. [Google Scholar]
  37. Gorbachuk, V.; Dunaievskyi, M.; Suleimanov, S.B. Modeling of agency problems in complex decentralized systems under information asymmetry. In Proceedings of the 2019 IEEE International Conference on Advanced Trends in Information Theory (ATIT), Kyiv, Ukraine, 18–20 December 2019; IEEE: New York, NY, USA, 2019; pp. 449–454. [Google Scholar]
  38. Jensen, M.C.; Meckling, W.H. Theory of the firm: Managerial behavior, agency costs and ownership structure. J. Financ. Econ. 1976, 3, 305–360. [Google Scholar] [CrossRef]
  39. Eisenhardt, K.M. Agency theory: An assessment and review. Acad. Manag. Rev. 1989, 14, 57–74. [Google Scholar] [CrossRef]
  40. Wu, J.; Deng, Y.; Huang, J.; Morck, R.; Yeung, B. Incentives and Outcomes: China’s Environmental Policy (No. w18754); NBER: Cambridge, MA, USA, 2013. [Google Scholar]
  41. Chod, J.; Lyandres, E. A Theory of ICOs: Diversification, Agency, and Information Asymmetry. Manag. Sci. 2021, 67, 5969–5989. [Google Scholar] [CrossRef]
  42. Zhang, M.; Sun, J. Outsourcing in municipal governments: Experiences from the United States and China. Public Perform. Manag. Rev. 2012, 35, 696–726. [Google Scholar] [CrossRef]
  43. Gao, X.; Teets, J. Civil society organizations in China: Navigating the local government for more inclusive environ-mental governance. China Inf. 2021, 35, 46–66. [Google Scholar] [CrossRef]
  44. Li, G.; Fang, C.; He, S. The influence of environmental efficiency on PM2.5 pollution: Evidence from 283 Chinese prefecture-level cities. Sci. Total. Environ. 2020, 748, 141549. [Google Scholar] [CrossRef]
  45. Rindfleisch, A. Transaction cost theory: Past, present and future. AMS Rev. 2020, 10, 85–97. [Google Scholar] [CrossRef]
  46. Zhang, J.; Li, H.; Xia, B.; Skitmore, M. Impact of environment regulation on the efficiency of regional construction industry: A 3-stage Data Envelopment Analysis (DEA). J. Clean. Prod. 2018, 200, 770–780. [Google Scholar] [CrossRef]
  47. Yang, X.; Wang, W.; Wu, H.; Wang, J.; Ran, Q.; Ren, S. The impact of the new energy demonstration city policy on the green total factor productivity of resource-based cities: Empirical evidence from a quasi-natural experiment in China. J. Environ. Plan. Manag. 2022, 66, 293–326. [Google Scholar] [CrossRef]
  48. Xue, M.; Razzaq, A.; Afshan, S.; Yang, X. Fiscal pressure and carbon intensity: A quasi-natural experiment based on education authority reform. Energy Econ. 2023, 126, 106919. [Google Scholar] [CrossRef]
  49. Razzaq, A.; Sharif, A.; Ozturk, I.; Yang, X. Central inspections of environmental protection and transition for low-carbon Chinese cities: Policy intervention and mechanism analysis. Energy Econ. 2023, 124, 106859. [Google Scholar] [CrossRef]
  50. Sant’anna, P.H.; Song, X. Specification tests for the propensity score. J. Econ. 2019, 210, 379–404. [Google Scholar] [CrossRef]
  51. Heckman, J.J.; Lalonde, R.J.; Smith, J.A. The Economics and Econometrics of Active Labor Market Programs. In Handbook of Labor Economics; Elsevier: Amsterdam, The Netherlands, 1999; pp. 1865–2097. [Google Scholar] [CrossRef]
  52. Lyu, C.; Deng, S.; Dai, Z. Emissions Trading Systems, Structure Adjustment and Air Pollution Reduction: Evidence from Enterprises in China. Sustainability 2023, 15, 6158. [Google Scholar] [CrossRef]
  53. Feenstra, R.C.; Li, Z.; Yu, M.J. Exports and Credit Constraints under Incomplete Information: Theory and Evidence from China. Rev. Econ. Stat. 2014, 96, 729–744. [Google Scholar] [CrossRef]
  54. Zhou, G.; Yao, Q.; Xu, S.; Liu, J.; Zhang, D. Mechanism and Performance of Ammonia Removal with Novel Micro Electrolysis Filler in Wastewater. In Proceedings of the 2016 5th International Conference on Energy and Environmental Protection (ICEEP 2016), Shenzhen, China, 17–18 September 2016; Atlantis Press: Amsterdam, The Netherlands, 2016; pp. 327–331. [Google Scholar] [CrossRef]
  55. Karri, R.R.; Sahu, J.N.; Chimmiri, V. Critical review of abatement of ammonia from wastewater. J. Mol. Liq. 2018, 261, 21–31. [Google Scholar] [CrossRef]
  56. Zhang, H.; Xu, T.; Feng, C. Does public participation promote environmental efficiency? Evidence from a quasi-natural experiment of environmental information disclosure in China. Energy Econ. 2022, 108, 105871. [Google Scholar] [CrossRef]
  57. Yang, Z.; Shao, S.; Yang, L. Unintended consequences of carbon regulation on the performance of SOEs in China: The role of technical efficiency. Energy Econ. 2021, 94, 105072. [Google Scholar] [CrossRef]
  58. Zhu, D.; Tao, X.; Huang, M. Law Reinforcement, Production Pattern and Enterprise Environmental Performance: Evidence from Environmental Courts in China. Sustainability 2023, 15, 4440. [Google Scholar] [CrossRef]
  59. Kuosmanen, T.; Bijsterbosch, N.; Dellink, R. Environmental cost–benefit analysis of alternative timing strategies in greenhouse gas abatement: A data envelopment analysis approach. Ecol. Econ. 2009, 68, 1633–1642. [Google Scholar] [CrossRef]
  60. Clarkson, P.M.; Li, Y.; Richardson, G.D.; Vasvari, F.P. Revisiting the relation between environmental performance and environmental disclosure: An empirical analysis. Account. Organ. Soc. 2008, 33, 303–327. [Google Scholar] [CrossRef]
  61. Choi, Y.; Yang, F.; Lee, H. On the Unbalanced Atmospheric Environmental Performance of Major Cities in China. Sustainability 2020, 12, 5391. [Google Scholar] [CrossRef]
  62. Petroni, G.; Bigliardi, B.; Galati, F. Rethinking the Porter Hypothesis: The Underappreciated Importance of Value Appropriation and Pollution Intensity. Rev. Policy Res. 2019, 36, 121–140. [Google Scholar] [CrossRef]
  63. Xing, L.; Li, A.; Sun, J.; Kong, F.; Kong, M.; Li, J.; Zhang, R. Insights into the occurrence, elimination efficiency and ecological risk of antibiotics in rural domestic wastewater treatment facilities along the Yangtze River Basin, China. Sci. Total Environ. 2022, 837, 155824. [Google Scholar] [CrossRef] [PubMed]
Figure 1. Quantities of cities implementing EVMR in China (1994–2022). Data source: the websites of China’s environmental protection departments at all levels, the websites of China’s people’s governments at all levels, the China Environmental Yearbook and environmental protection records at all levels, Baidu Encyclopedia, News Network, etc.
Sustainability 15 14409 g001
Figure 2. Geographic distribution of EVMR (1994–2022). Source: China Standard Map System (Revision number: GS(2016) 1569), see http://bzdt.ch.mnr.gov.cn/index.html (accessed on 8 July 2022).
Sustainability 15 14409 g002
Figure 3. Probability distribution of the mean value of WPA after EVMR implementation.
Sustainability 15 14409 g003
Figure 4. Estimated coefficients of parallel trend test using Equation (2).
Sustainability 15 14409 g004
Table 1. Definitions of variables.
VariableEconomic MeaningDefinition
w p a Water pollution amountLogarithm of water pollution amount
V M R Policy dummy variable V M R takes a value of 1 if the enterprise’s located city has already implemented EVMR, and 0 if otherwise
g r o w t h Enterprise growthGrowth rate of total industrial output value
K Enterprise sizeLogarithm of fixed capital stock
p r o f i t Enterprise profit marginRatio of profit to gross industrial output ∗ 1000
a g g l o Industrial agglomerationThe logarithm of location entropy
i n d u Industrial upgradingRatio of secondary and tertiary industry GDP to GDP
r o a d InfrastructureLogarithm of the mileages of city roads
F D I Foreign direct investmentLogarithm of foreign capital amount actually utilized
Table 2. Descriptive statistics of variables.
VariableObservationMeanStandard DeviationMinMax
w p a 397,8921.53932.4707−9.210311.3281
V M R 534,9720.16430.370601
g r o w t h 534,9720.02910.2881−13.14936.9265
K 534,9720.03540.2976048.6610
p r o f i t 534,972−0.00010.0298−21.57400.7164
a g g l o 534,972−9.81353.2992−38.85386.9995
i n d u 534,97283.548923.2082099.9700
r o a d 534,9728.12482.7375011.7550
F D I 534,9729.11583.0783013.3167
Table 3. Effects of EVMR on WPR of enterprises.
VariablesBaseline ModelDifferent Pollution Indicators
Without Control VariablesWith Control VariablesCODNH3-N
(1)(2)(3)(4)
V M R −0.0356 **
(0.0144)
−0.0323 **
(0.0144)
−0.0364 **
(0.0145)
0.1040 *
(0.0231)
g r o w t h 0.0781 ***
(0.0081)
0.0781 ***
(0.0081)
0.0514 ***
(0.0121)
K 0.0385 **
(0.0161)
0.0384 **
(0.0158)
0.0076
(0.0190)
p r o f i t −0.0415
(0.0346)
−0.0387
(0.0349)
−0.0661 **
(0.0292)
a g g l o 0.0048 ***
(0.0013)
0.0048 ***
(0.0013)
0.0100 ***
(0.0020)
i n d u 0.0015 ***
(0.0005)
0.0015 ***
(0.0005)
0.0013
(0.0012)
r o a d 0.0093
(0.0069)
0.0103
(0.0069)
−0.0523
(0.0376)
F D I 0.0159 ***
(0.0056)
0.0162 ***
(0.0056)
−0.0012
(0.0100)
Year FEYesYesYesYes
Industry FEYesYesYesYes
City FEYesYesYesYes
Individual FEYesYesYesYes
R 2 0.77370.77390.77250.7500
N 396,869396,869395,926212,507
Note: White robust standard error in parentheses, *** p < 0.01 , ** p < 0.05 , * p < 0.1 . Hereinafter.
Table 4. Regression results of PSM-DID.
Variables(1)(2)
V M R −0.1367 ***
(0.0210)
−0.1176 ***
(0.0211)
Control variablesNoYes
Year FEYesYes
Industry FEYesYes
City FEYesYes
Individual FEYesYes
R 2 0.74330.7438
N 300,857300,857
Notes: T-value adjusted by the White covariance matrix in parentheses. *** p < 0.01.
Table 5. Heterogeneity analysis of different enterprise sizes.
VariablesSmall- and Micro-SizedMedium-SizedLarge-Sized
(1)(2)(3)
V M R 0.0384
(0.0492)
−0.0305 ***
(0.0174)
−0.1123 ***
(0.0388)
Control variablesYesYesYes
Year FEYesYesYes
Industry FEYesYesYes
City FEYesYesYes
Individual FEYesYesYes
R 2 0.77160.76780.8044
N 72,274284,69039,905
Notes: *** p < 0.01.
Table 6. Heterogeneity analysis of different regions.
VariablesEasternCentralWestern
(1)(2)(3)
V M R 0.0340
(0.0265)
−0.0754 ***
(0.0207)
−0.1018 ***
(0.0394)
Control variablesYesYesYes
Year FEYesYesYes
Industry FEYesYesYes
City FEYesYesYes
Individual FEYesYesYes
R 2 0.79280.75840.7692
N 142,888188,07765,005
Notes: *** p < 0.01.
Table 7. Heterogeneity analysis of different industry pollution intensity.
VariablesHighLow
(1)(2)
V M R −0.0026
(0.0142)
−0.0455 **
(0.0228)
Control variablesYesYes
Year FEYesYes
Industry FEYesYes
City FEYesYes
Individual FEYesYes
R 2 0.80380.7599
N 265,620129,852
Notes: ** p < 0.05.
Table 8. Influencing mechanism analysis.
VariablesWastewater Treatment FacilitiesVertical IntegrationFresh Water ConsumptionCOD Removal RateNH3-N Removal Rate
(1)(2)(3)(4)(5)
V M R −0.0040
(0.0043)
−0.0213 ***
(0.0071)
−0.0276 ***
(0.0105)
0.0364 ***
(0.0032)
0.0284 ***
(0.0042)
Control variablesYesYesYesYesYes
Year FEYesYesYesYesYes
Industry FEYesYesYesYesYes
City FEYesYesYesYesYes
Individual FEYesYesYesYesYes
R 2 0.71500.13520.00620.59800.4846
N 313,432298,438497,005374,977194,931
Notes: *** p < 0.01.
Disclaimer/Publisher’s Note: The statements, opinions and data contained in all publications are solely those of the individual author(s) and contributor(s) and not of MDPI and/or the editor(s). MDPI and/or the editor(s) disclaim responsibility for any injury to people or property resulting from any ideas, methods, instructions or products referred to in the content.

