Article

Slums Evolution and Sustainable Urban Growth: A Comparative Study of Makoko and Badia-East Areas in Lagos City

by
Katabarwa Murenzi Gilbert
and
Yishao Shi
*
College of Surveying and Geo-Informatics, Tongji University, Shanghai 200092, China
*
Author to whom correspondence should be addressed.
Sustainability 2023, 15(19), 14353; https://doi.org/10.3390/su151914353
Submission received: 25 August 2023 / Revised: 25 September 2023 / Accepted: 27 September 2023 / Published: 28 September 2023

Abstract

:
This research addresses the evolution of slums in two specific areas of Lagos City, a consequence of rapid urbanization in developing economies. The study aims to analyze the key characteristics of slums’ evolution while analyzing mathematical spatial changes within the Badia-East and Makoko slum areas in two decades, focusing on promoting sustainable urban growth. The integration of Remote Sensing (RS) technology and Geographic Information System (GIS) tools has dramatically facilitated the monitoring of Land Use Land Cover (LULC) changes over two decades. This research used Landsat imagery acquired in 2000, 2010, and 2020 to meet our research aims. The research applied supervised classification and the Normalized Difference Built-up Index (NDBI) for image mapping and mathematical-based analysis. Research created a spatial framework using grid-cell maps, performed change detection, and generated detailed maps to support our analysis. A comparative analysis was also performed in the selected areas with a different history in slum management systems. The findings reveal that both Makoko and Badia-East exhibit slum-like characteristics. Makoko witnessed a significant increase in informal built-up expansion of 27.6% and 7.7% between 2000 and 2010 and between 2010 and 2020, respectively. These changes converted 34.65 hectares of non-built-up land in Makoko into built-up areas. Conversely, Badia-East reported an increase in built-up areas only between 2000 and 2010, which amounted to 8.5%. However, the government’s intervention caused a decrease of 12.7% in built-up areas of Badia-East between 2010 and 2020. The study underscores the urgent need for slum clearance and upgrading initiatives in Makoko, like those implemented in Badia-East between 2013 and 2017. The conclusion drawn from the study of Makoko’s informal built-up areas is that it is causing adverse effects on human life and the environment. The expansion has resulted in an increase in air and water pollution, which is having adverse effects. Therefore, the study recommends upgrading and clearing out Makoko and suggests taking lessons from the successful experience in Badia-East. The study also highlights the importance of prioritizing community needs and voices to ensure efficient resource utilization while safeguarding the well-being of future generations.

1. Introduction

The rapid urbanization witnessed in various regions of the Global South has resulted in a significant and widespread outcome: The proliferation of slums [1,2]. More than 1 billion people live in informal settlements globally, mainly in the Global South. Projections suggest that by 2030, this number will reach 2 billion; by 2050, it will reach 3 billion if current trends continue. The growth of informal settlements in the Global South is due to the inability to meet the needs of this growing population [3]. Inadequate infrastructure and essential services make urbanization a challenge for these countries. A slum, as defined, is a residential area formed by residents without government oversight. These areas are commonly characterized by substandard housing, a lack of essential services, and frequent overcrowding [4,5]. According to UN-Habitat’s definition, a slum is an urban residential area with a dense population marked by deteriorated or inadequate infrastructure and poor close housing units. These settlements primarily accommodate lower-income individuals who do not have access to necessary facilities and fundamental infrastructure [5,6]. UN-Habitat further elaborates on the distinctive features of slum settlements, including their location in unauthorized areas with uncertain land status, inadequacy of housing structures, high population density, placement in unhealthy environments, and vulnerability to disasters. These slums serve as minimal living spaces for marginalized communities grappling with inadequate living conditions and limited resources [5]. As urban centers in these regions experience significant population growth, surpassing the capacity for comprehensive development, a consequence arises in the spontaneous emergence and expansion of informal settlements on the outskirts of cities [7,8,9]. The formation and growth of slums in Lagos are substantially influenced by population pressure [1] due to rapid urban expansion and an influx of rural migrants seeking better prospects [10]. The limited housing supply and infrastructure strains due to uncontrolled population growth led to the growth of unplanned slums on the city’s periphery [11,12]. Due to the population’s increasing need for affordable housing, informal settlements are becoming more common. These informal settlements present substantial challenges in cities worldwide due to socio-economic disparities and complexities associated with urbanization [2,13].
Lagos is a prime example of a city struggling with abundant slums, resulting in significant social, economic, and environmental repercussions [14]. Slums in Lagos are attributed to rapid population growth during the 19th and 20th centuries, driven by natural growth and immigration. This expansion increased demand for housing that exceeded supply, pushing many to live in slums [15]. Poverty was a significant factor as most of the population could not afford proper housing and sought shelter in slum areas with more affordable rents. The absence of effective urban planning also contributed, as early colonial governance needed to have organized development efforts [16]. Despite attempts to clear slums, they became well-established, making clearance difficult due to the need for resources to provide alternative housing. Since gaining independence, the Nigerian government has tried to improve slum conditions, often facing resistance [17]. In more than 100 slums [1] and informal settlements across the city, the challenges are evident [16]. Clean water scarcity is a pressing issue within these areas due to inadequate infrastructure and limited access to safe water sources. This issue is especially burdensome for students, notably young girls responsible for water collection.
Consequently, this responsibility leads to missed school hours and reduced educational opportunities [18]. Additionally, females, including both women and young girls, frequently face the danger of experiencing harassment or sexual assault while gathering water in isolated areas or during nighttime hours [19]. The lack of sanitation facilities in these slums contributes to severe health implications for their residents. In a detailed manner, inadequate access to proper toilets and waste management systems results in open defecation and improper disposal, facilitating the rapid spread of diseases such as cholera, diarrhea, and other waterborne illnesses [20]. Consequently, slum dwellers are burdened with high medical expenses, as they must pay more for disease treatments, impacting their financial capacity and perpetuating the cycle of poverty [21]. In addition, inadequate infrastructure in slums leads to scarcity of electricity, which poses challenges to meeting basic needs, studying effectively, and using information and communication technologies [14]. Accessing digital resources and online platforms that support economic activities requires a reliable source of electric energy, often lacking in slum areas due to poor housing conditions caused by low-quality construction materials [22], congested living spaces, and a deficiency of fundamental amenities [23]. Addressing these challenges requires comprehensive and sustained efforts to improve living conditions, education, and economic prospects for those residing in these marginalized areas.
Firstly, different reviewed research papers [2,24,25,26,27] have delved into the practical potential of Remote Sensing (RS) and Geographic Information Systems (GIS) in addressing issues related to slums by generating maps from satellite images. These papers all share a common idea: It is essential to create accurate maps, study how people are settled in a particular place, highlight spatial changes, guide specific actions, make intelligent decisions, and involve the community. Therefore, the use of recent technologies relates to the goals set by the United Nations for sustainable development, which highlights how important it is to have information about urban environments. Also, these papers intend to classify and map different urban structures and help to understand the unique features and spatial changes happening in cities. This process of classifying and mapping is an essential guide that helps understand how regions change over time and where they are changing [28]. For that reason, it is crucial beyond just academia, as it has practical applications in improving the living conditions of those in urban slums by developing strategies. This recent spatial understanding improves when researchers connect how cities are shaped with how they work in real life. Therefore, using different complementary ideas from theory with practical experience in slum problem-solving helps to understand how cities change [29].
Secondly, the literature on slums in Lagos explains the reasons why slums continue to grow and evolve. The factors include urban poverty, failed government policies, and capitalist forces [30,31]. The rapid growth of Lagos has led to more people living in poverty in urban areas, which has caused poor living conditions and infrastructure and led to the growth of slums [32,33]. Policies declined to reduce poverty and improve living conditions are worsening the problem [34]. Globalization has enlarged income inequality and made it harder for low-income people to afford decent housing [35]. The review also shows how land tenure insecurity leads to slums. Many people living in slums do not have secure rights to the land they live on. Land tenure insecurity makes it hard for them to improve their homes and communities and causes poverty to concentrate in specific areas [1]. The existing literature falls short of comprehensively examining the nuanced interplay between Housing Conditions and Inadequate Infrastructure within urban slum environments. Specifically, it fails to thoroughly analyze the substandard construction prevalent in dwellings within these areas.
Furthermore, the insufficient state of roads and other fundamental infrastructure elements in urban slums remains a critical area requiring in-depth investigation. It has also been found by different studies [1,14,26,36,37,38] that people who live without proper planning can sustainably enjoy the environment if they can manage poor urban slum living conditions. Hence, sustainable planning can be achieved by improving their abilities and resources. Clearing and upgrading slums are well-known ways to help people living in these areas and have been specifically taken to address the challenges faced by slum dwellers in some slums of Lagos [39]. These provide better living conditions, infrastructure, services, and economic opportunities. The successful implementation, therefore, involves efforts to enhance housing, infrastructure, services, livelihoods, and the official recognition of residents [17].
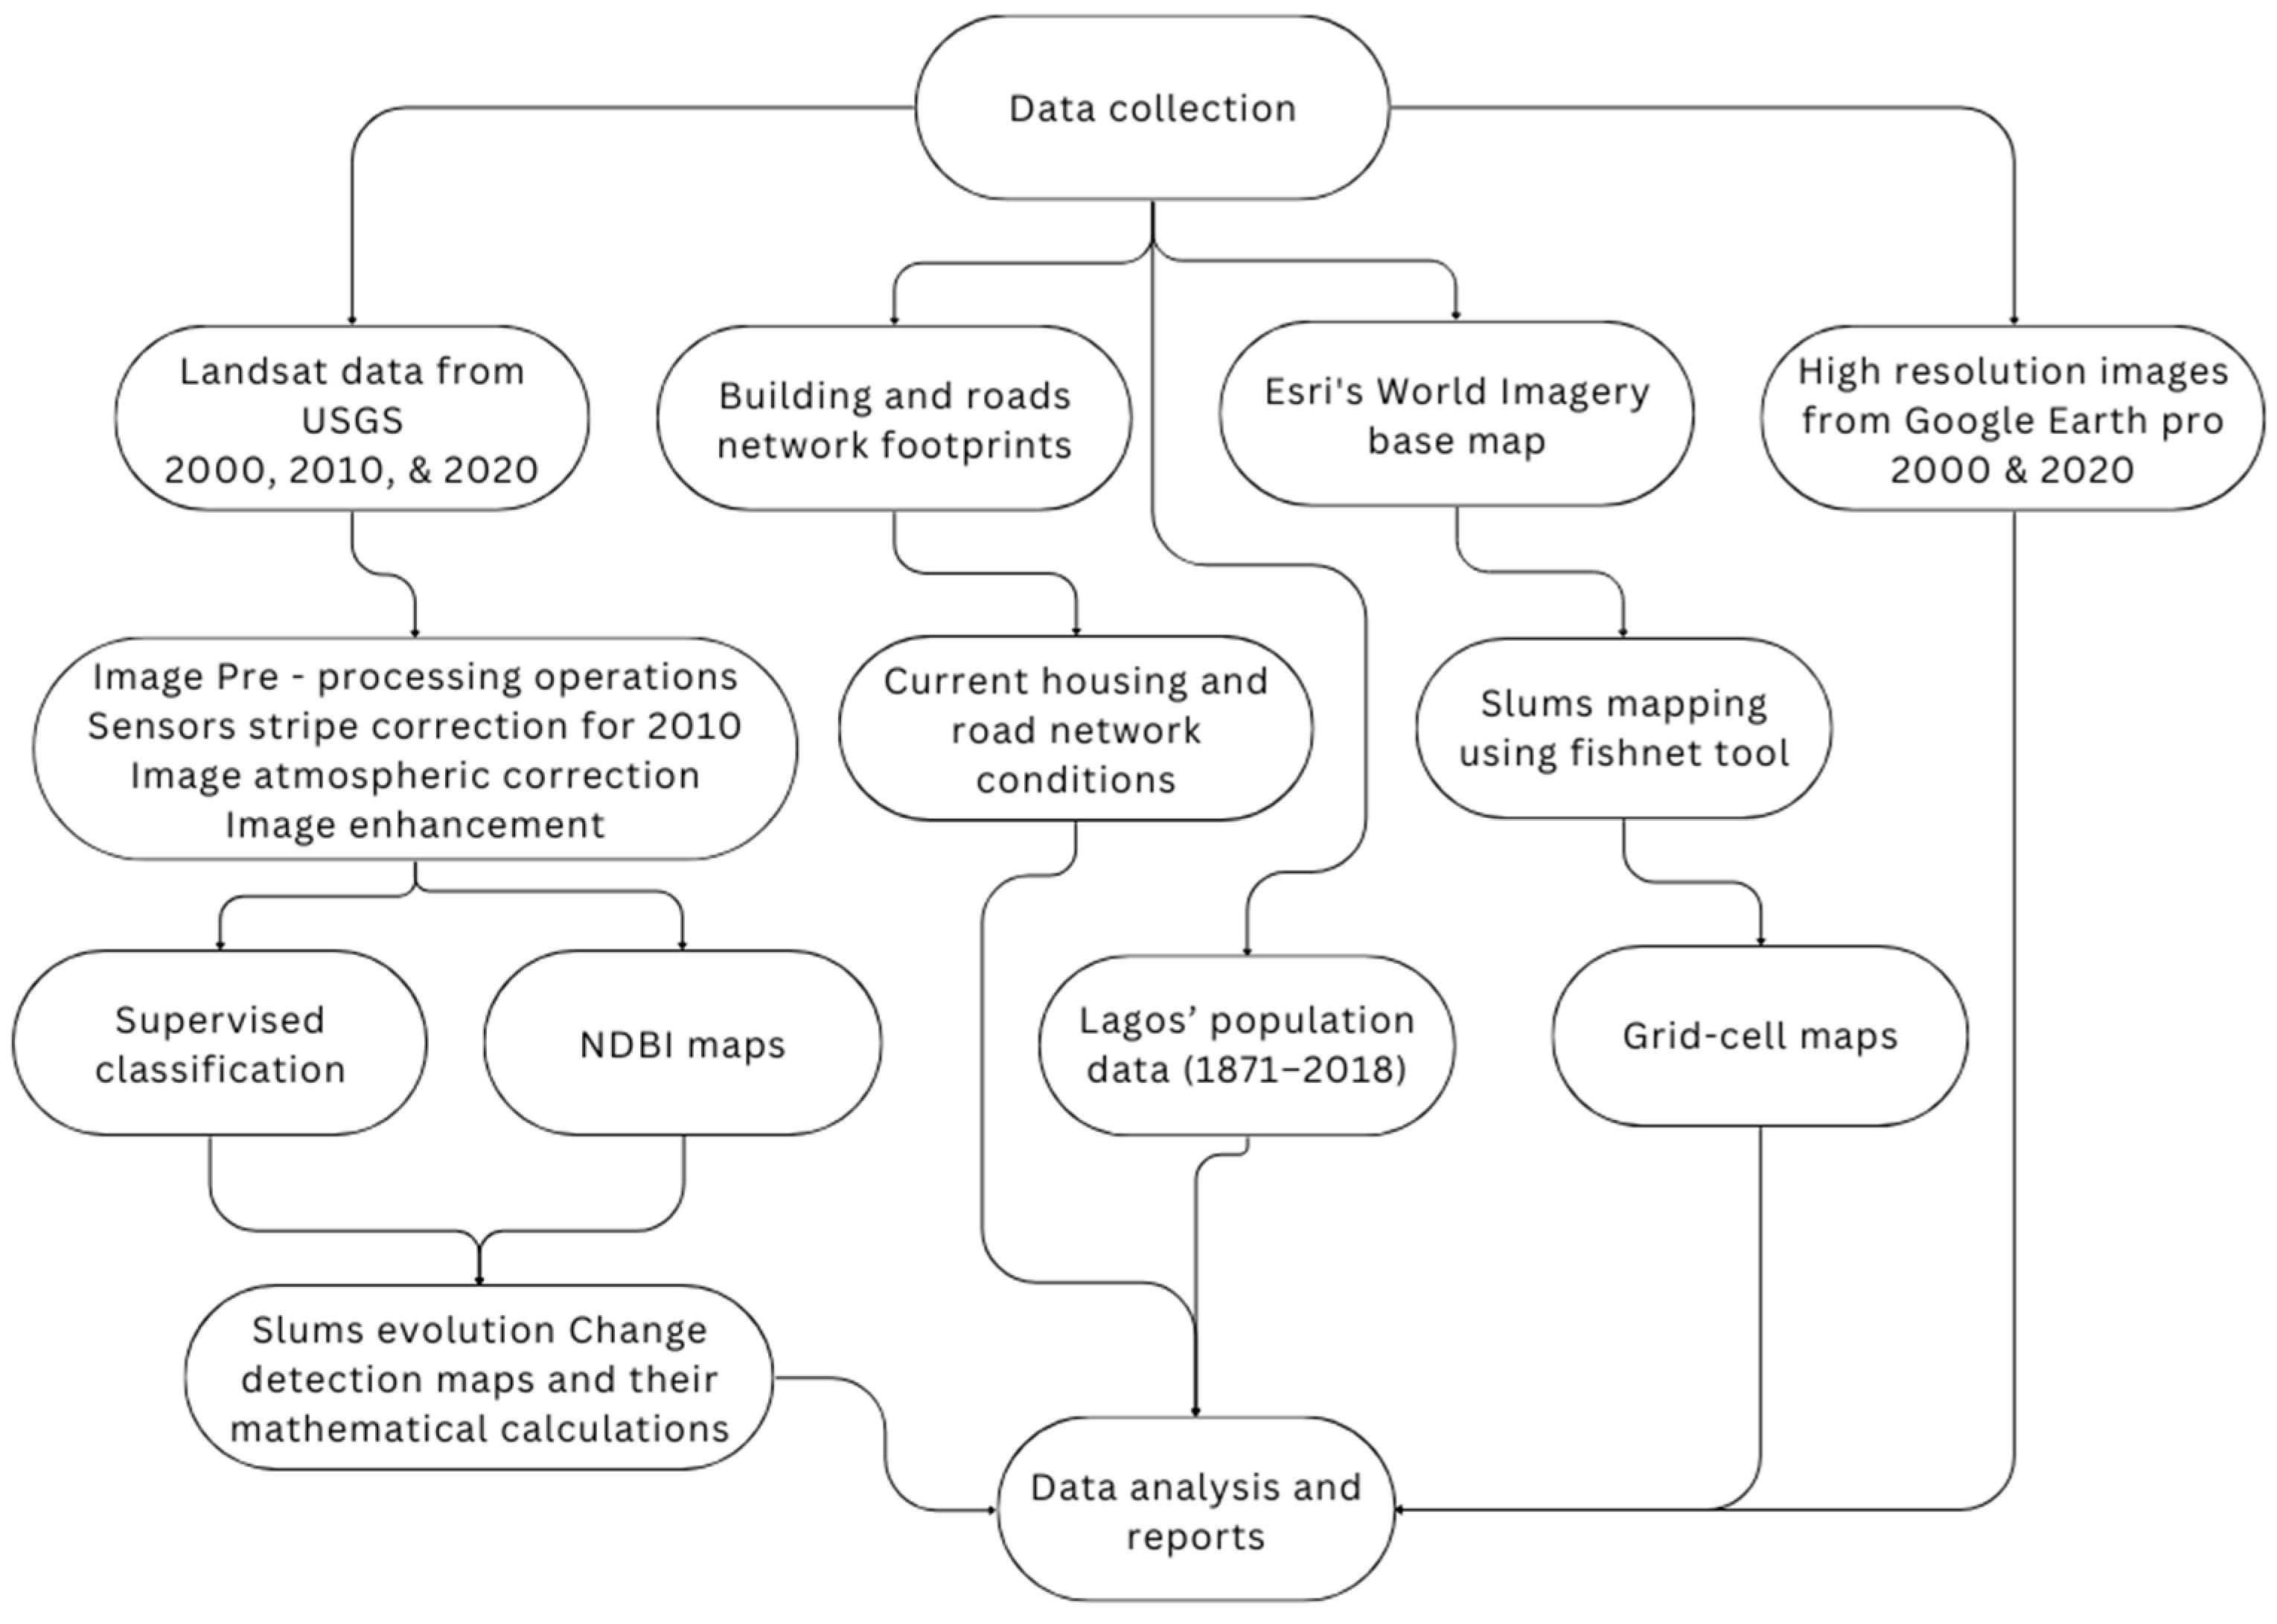
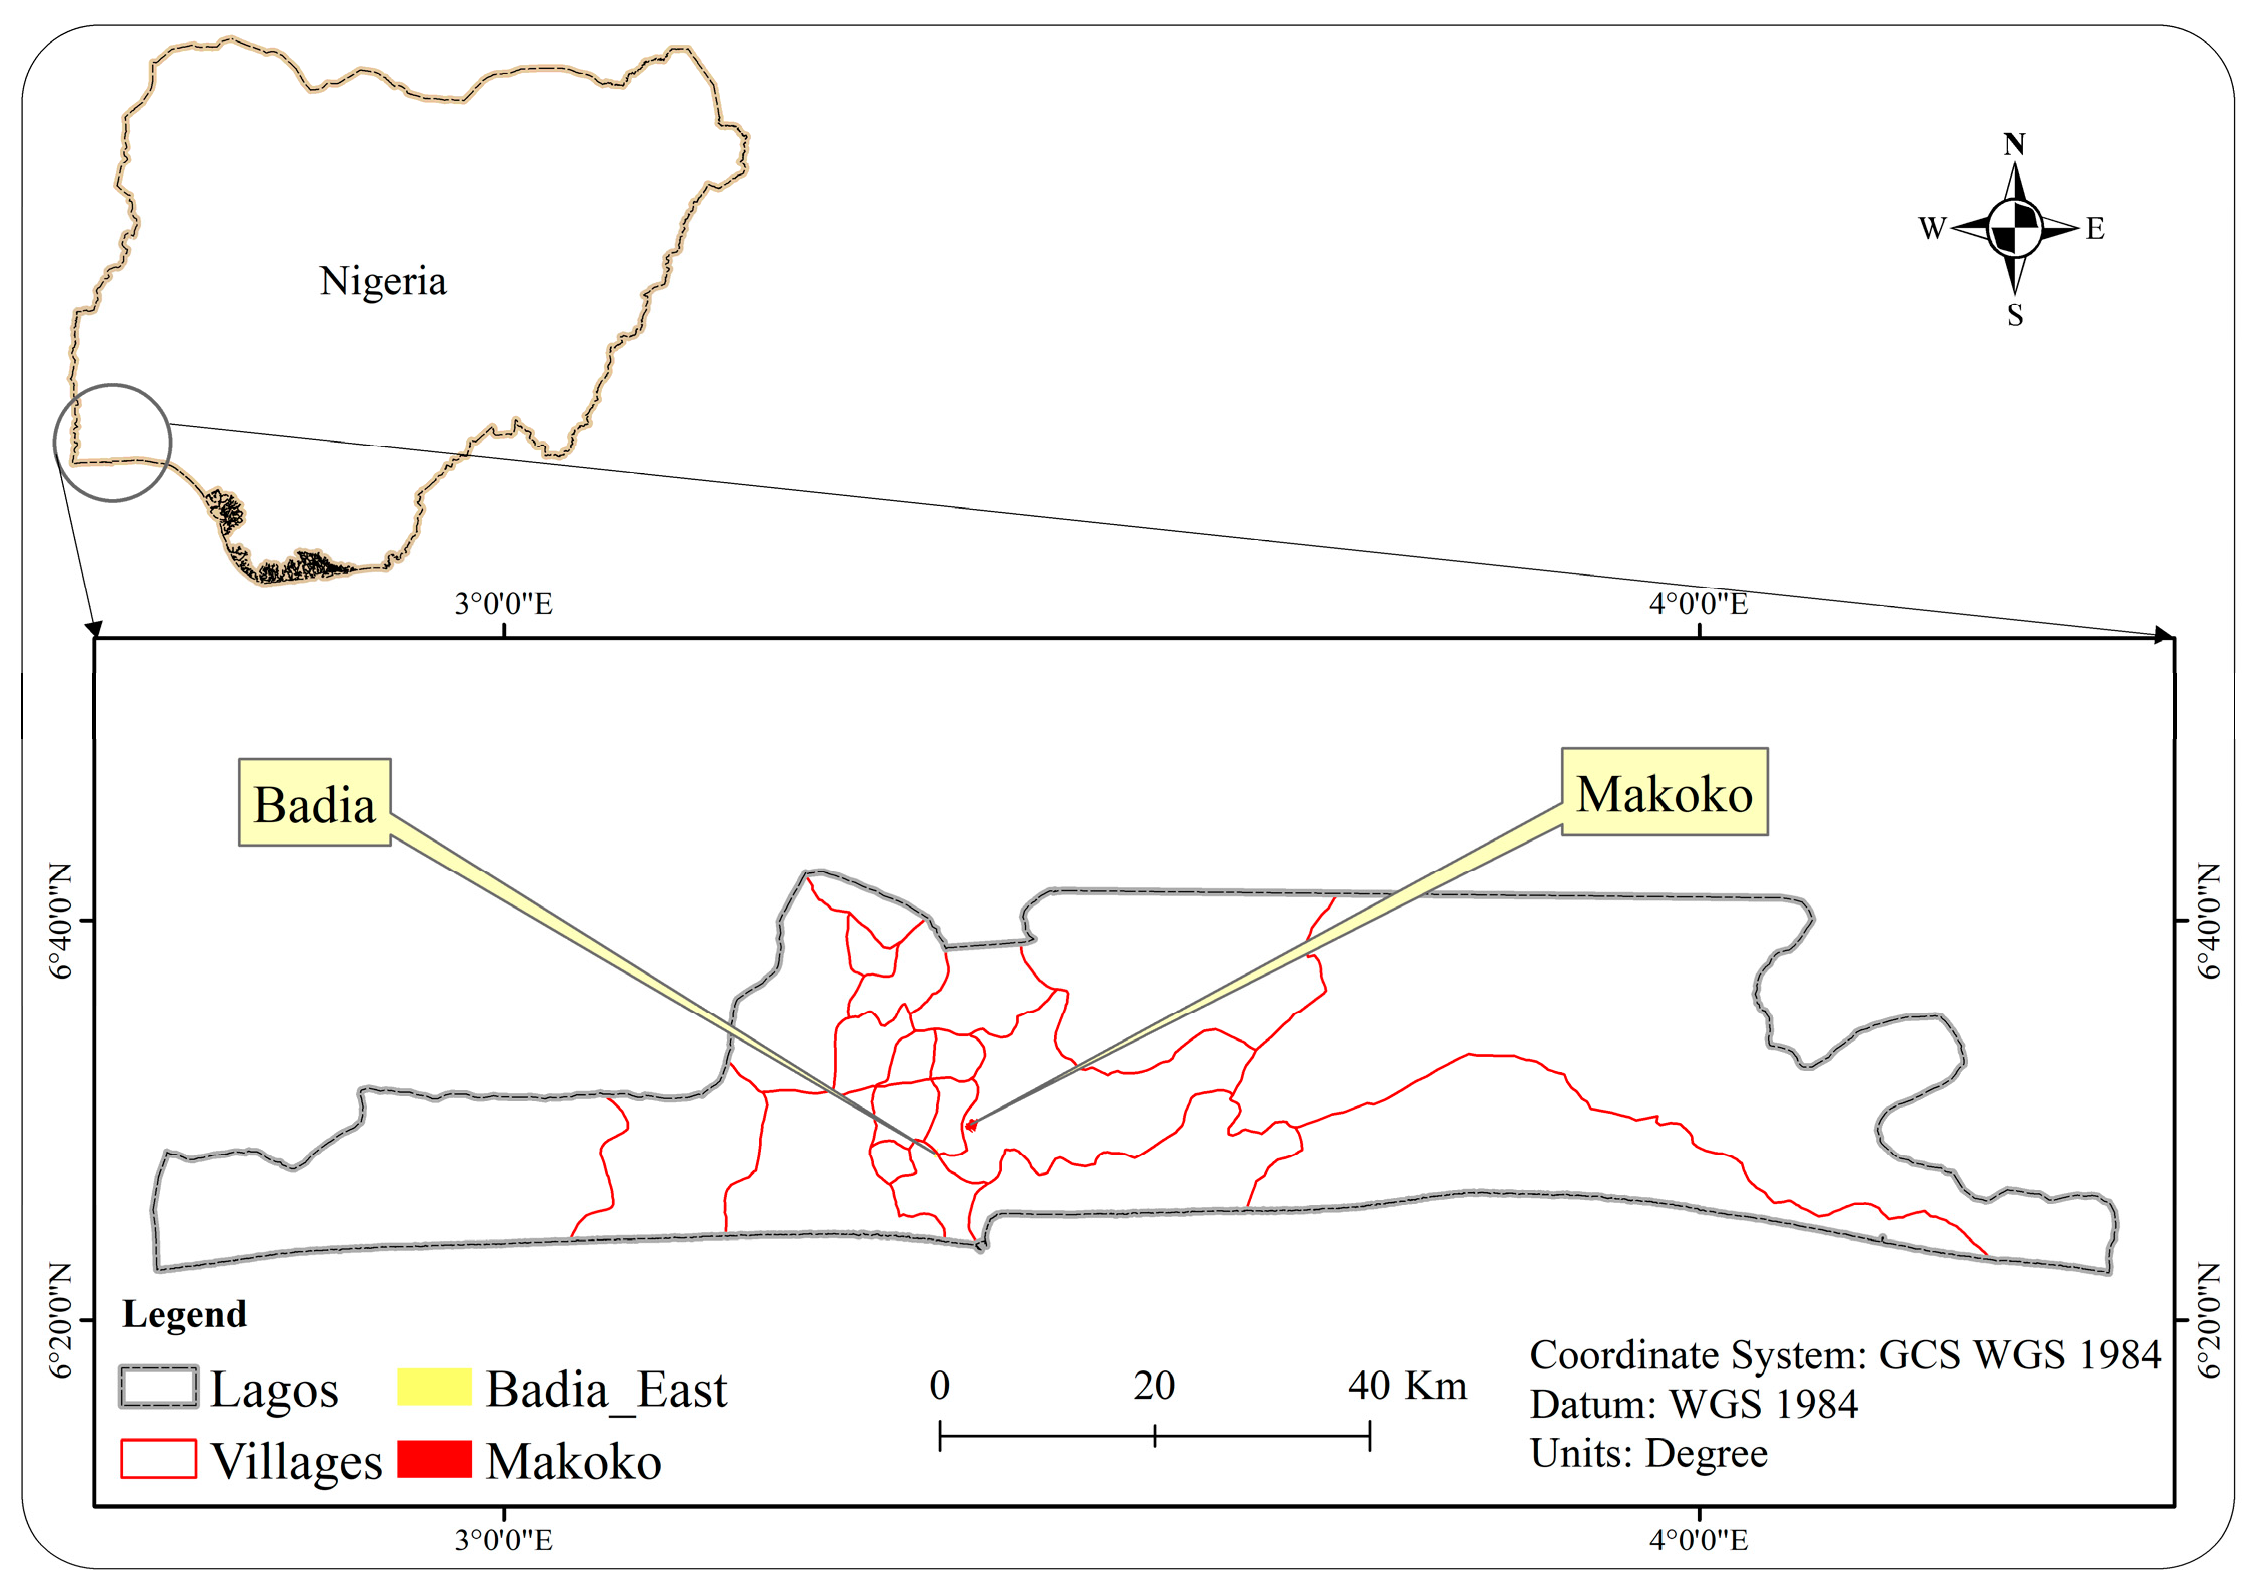
This study has the following main objectives: Firstly, the research aims to determine the spatial characteristics of the selected slums—Badia-East and Makoko. The analysis is limited to mapping and analyzing the structure of current buildings and road network footprint data to ascertain whether they meet the criteria of a slum or not. Secondly, a grid cell-based approach will be utilized to estimate the size of Badia-East and Makoko. This technique will involve dividing the area into smaller units, which are then surveyed to determine the number of occupied units. Divided cells will enable us to quantify the size of the slums accurately. Thirdly, the research aims to monitor the spatial transformations in slums for two decades using the Normalized Difference Built-up Index (NDBI) and supervised classification for image mapping and mathematical-based analysis. To achieve this, “RS & GIS” will be used. The integration of “RS & GIS” enables the identification of spatial changes in slum areas over time, particularly the spatial expansion of slums. Finally, the research will suggest solutions and recommend that relevant departments collaborate to address the persistent challenges faced by residents of urban slums in Lagos.
This study addresses the knowledge gaps related to the evolution of slums from 2000 to 2020 and their impact on human livelihoods [40]. Previous research mainly focused on discussing the adverse social effects of slums from 2013 to 2020 [1]. However, this study introduces spatial configuration mapping and mathematical analysis of two areas to understand how slums evolve. The study used various tools and methods to analyze the evolution of slums in two different decades (2000 to 2010 and 2010 to 2020). Additionally, the study analyzed previous research results presented as Google Earth Pro images. The research also examines how the evolution of slums perpetuates a cycle of disadvantage for their inhabitants. It further investigates how Makoko’s slums’ problems could be solved by reflecting on Mexico’s experience and the slum clearance in Badia-East between 2013 and 2017 [1].

2. Materials and Methods

This remote sensing-based research systematically examined the spatial mathematical dynamics and underlying drivers influencing the spatial changes in slums within Lagos, Nigeria, over the last two decades, from 2000 to 2020. Three software, namely QGIS 2.16.3, can be downloaded via (https://www.qgis.org/en/site/, accessed on 3 May 2023), licensed ArcMap 10.8.2 (https://desktop.arcgis.com/en/arcmap/latest/get-started/installation-guide/installing-on-your-computer.htm, accessed on 5 May 2023) by Esri, and Google Earth Pro 7.3.6.9345, which can be accessed using (https://www.google.com/earth/versions/#download-pro, accessed on 6 May 2023), were used. Different software allowed the integration of various data layers, resulting in informative and visually appealing maps that aided in understanding the spatial patterns, characteristics, and mathematical change of the slum areas. Figure 1 below outlines the conceptual framework of the study.

2.1. Study Area Description

Lagos is a city in southwestern Nigeria located on a collection of islands and peninsulas within the Lagos Lagoon. It is a crucial transportation hub and a significant port city with one of Africa’s busiest ports, the Lagos Harbor. The city is diverse, with a population exceeding 20 million, and serves as an economic center for various industries such as manufacturing, finance, and services. Lagos experiences a wet season from March to October and a dry season from November to February. The official language is English, although Yoruba is widely spoken.
This investigation focuses on two popular areas, Badia-East and Makoko, to unravel the intricate spatial relationship between patterns in these marginalized communities in Lagos. Situated on Nigeria’s Atlantic coast, Lagos has become a destination for those searching for better economic prospects. Being the biggest city in Nigeria and a significant financial center, Lagos has seen quick urbanization and a rise in population. However, owing to this rapid expansion, the city’s infrastructure and housing development have failed to keep up, resulting in informal settlements and slums [1,26]. This situation disproportionately affects low-income people compelled to reside in substandard housing due to the limited availability of affordable options. Figure 2 is a map that displays the relative and absolute locations of Makoko and Badia within the larger map of Lagos City.

2.2. The Population Growth in Lagos

The slums in Lagos originated in the early 19th century when the city was a small fishing village. The primary reason for their development was the rapid population increase. The city’s population grew significantly during the 19th and 20th centuries due to natural growth and immigration. As a result, there was a housing shortage, and many people had to resort to living in slums [1,15]. Poverty was also a significant contributing factor. Table 1 illustrates the significant growth of Lagos’ population from the 19th century to the 21st century.

2.3. Data Source and Preprocessing

2.3.1. Sources and Interpretation of Remote Sensing Image Data

For this study, we utilized various data sources and software applications to enhance data accuracy and ensure the dependability of the research findings. We chose the United States Geological Survey (USGS)-produced Landsat images as the primary spatial data source (https://earthexplorer.usgs.gov/, accessed on 17 July 2023). This source acquired three remote-sensing images: 2000, 2010, and 2020 (30-m resolution). Furthermore, for common approaches to classify Land Use and Land Cover (LULC), we used supervised classification of Landsat images, which were classified into two classes, built-up and non-built-up, and for the additional analysis, we used the Normalized Difference Built-up Index (NDBI). Additionally, the arrangement of buildings and road networks was tracked by downloading footprints from Street Map using the QuickOSM plugin in QGIS 2.16.3. Furthermore, Esri’s “World Imagery base map” was used to make accurate maps of the current footprints, and visual changes in Land Use/Land Cover (LULC) were shown using high-resolution images from Google Earth Pro.
Table 2 displays the relevant parameters for each satellite, providing a detailed overview of the Landsat 7 and 8 downloads.

2.3.2. Sensor Stripes Correction for Landsat 7 for 2010

We used satellite images to determine the evolution of slums. Then, the task was completed by carrying out image preprocessing. The Landsat 7 image 2010 has sensor stripes, so we tackled this issue in QGIS using the Raster analysis tool. We corrected the satellite image bands “one by one” and utilized the “fill no-data” function to correct and fill the missing gaps. A correction was achieved by interpolating values from other pixels [41].

2.3.3. Fishnets and Footprints Data Processing

In this study, we used the ArcGIS fishnet tool and overlayed the grids over the base map in ArcMap 10.8.2 to measure the size of each box according to its shape. This technique facilitated accurate calculations of the impacted zones. This tool is commonly used to locate and measure areas of both the slums and formal settlements within the cell [42,43]. These maps were created using Esri’s “World Imagery base map” in ArcGIS 10.8.2 and tracing grids lines entire the polygon of the areas. The credit for the map goes to Esri, Maxar, Earthstar Geographics, and the GIS User Community. The building footprints were obtained using the QuickOSM plugin in QGIS 2.16.3 to better understand the characteristics of slums in the area, specifically the irregular housing construction [44,45]. These were then overlapped on the “World Street Base Map” using ArcGIS software. Within QGIS, queries such as “building” = “yes” were utilized to retrieve building footprints and “highway” to extract road network data in the designated slum areas. The presence of canals and natural water sources within the slums was also observed to identify potential transportation or livelihood sources. The width and layout of road networks and buildings were crucial in identifying the characteristics of these slum areas.

2.3.4. Normalized Difference Built-Up Index (NDBI)

NDBI—a widely used index for analyzing built-up areas—was used to make maps and increase the visual accuracy of supervised image classification. The formula for calculating NDBI is as follows in Table 3 [46]:
NDBI = (SWIR − NIR)/(SWIR + NIR).
The NDBI values have a range of −1 to +1. If the value is negative, it indicates the presence of water bodies. On the other hand, higher values suggest the existence of significant built-up infrastructure in the area. Vegetation and water have low NDBI values, meaning their distinct spectral characteristics concerning built-up areas. When analyzing built-up areas, several indexes can be used. One of these is the NDBI, commonly used for evaluation purposes. In this case, NDBI was utilized. When it comes to satellite image classification, Landsat data are commonly used. Landsat data comprise multiple bands, each corresponding to a specific range of wavelengths. These bands include the blue, green, red, infrared, thermal, and panchromatic bands. The panchromatic band is especially useful for enhancing the data’s resolution and providing greater detail. Landsat 7 data include “eight bands”, while Landsat 8 data include “eleven bands” (Appendix A Table A1 and Table A2). However, for analyzing the Normal Difference Built-Up Index (NDBI), only four bands are commonly used: The green, red, near-infrared (NIR), and shortwave infrared (SWIR) bands [47].

2.3.5. Sources of Non-Spatial Data

The demographic data were acquired from the cited studies and provided in tabular format to present population growth in Lagos from 1871 to 2018 (Table 1).

3. Results

Lagos, frequently called the leader of the economy and industries, is experiencing rapid growth and has earned the title of a mushrooming megacity. However, this metropolis has an inconsistent nature [48]. Also, its location along the coast is advantageous for economic prospects and provides opportunities for its citizens. Lagos, in an opposing manner, is facing significant issues due to urbanization that must be dealt with. These issues include deteriorating infrastructure, inadequate housing resulting in the growth of slums, urban poverty, intense traffic congestion, and significant environmental problems [49]. Consequently, the mere act of living within the metropolis becomes an arduous task. This chapter aims to comprehensively understand the evolution of selected slums, namely Badia-East and Makoko, in a spatial context. The analysis involved using “RS & GIS” and other spatial techniques to calculate and examine the spatial changes within these slum areas. Furthermore, the chapter presents the outcomes from the spatial data analysis and compares the selected slums. Through applying advanced spatial methodologies, this study delves into the dynamic transformations occurring within the slums of Badia-East and Makoko.

3.1. Makoko and Badia-East Current Situation Using Fishnet and Footprints

3.1.1. Makoko Mapping Using Fishnet and Footprints

In Makoko, grids with dimensions of 10 columns and 10 rows were created and produced a total of 78 cells with different sizes and shapes (Figure 3). Out of these cells, 36 are complete square grids, while the remaining 42 are partially square due to being intersected by the Makoko polygon, resulting in irregular shapes. The entire area of each complete cell is calculated to be 16,993.5 square meters, with a corresponding perimeter of 521.5 m. Each side of these “full cells” measures approximately 130.4 m. The calculation was performed in the attribute table of the grid shapefiles to increase the accuracy of the results. Also, on the right side, the map displays the poor layout and configuration of roads and waterways, marked in red, along with building footprints in black.

3.1.2. Badia-East Mapping Using Fishnet and Footprints

Here, to properly evaluate the terrain and pinpoint regions with substandard housing and uneven roads, we also utilized a grid system [42,43]. On the side of Badia-East, there is a grid system comprising 56 individual cells. Among these, 20 grid cells form complete rectangles, each measuring 42.3 m in width and 86.9 m in length (Figure 4). Each of these whole grid cells’ total area is 3675.7 square meters, with a corresponding perimeter of 259 m. The poor housing encompasses seven complete grid cells and nine partial grid cells. Considering this cluster of inadequate housing, the estimated total area is 48,283.9 square meters, and the perimeter surrounding this area measures approximately 1201.8 m. The map on the right side displays the structure of Badia-East using footprints.

3.1.3. NDBI Results of Both Makoko and Badia-East Slums in 2000 and 2020

The Landsat 7 satellite image 2000 and Landsat 8 satellite image 2020 were calculated according to the formula of NDBI. The results are the NDBI values for Makoko and Badia slums. The range was determined based on the built-up level shown on the Esri base map. We then made some modifications to improve the accuracy of the maps. The result of these calculations is displayed in Figure 5. The red-colored areas indicate built-up areas, while the gray-colored areas indicate non-built-up areas.

3.2. Satellite Image Classification and Change Detection

This study used supervised classification to track the development of slums. The researchers divided the slums into two categories: Non-built-up and built-up. Like the maps of NDBI, the red-colored area was classified as built-up and the colored gray area as non-built-up; therefore, this was applied to the classified images. Makoko showed a consistent increase in built-up areas in two decades, while Badia-East faced an increase in the first decade but a decrease in the second decade of the study.

3.2.1. Supervised Classification for 2000, 2010, and 2020

For this part, supervised classification was performed to improve the accuracy of our results in conjunction with the maps generated from NDBI. We classified satellite images from 2000, 2010, and 2020 and limited the land cover classes to two categories, Built-up and Non-built-up, to align with the NDBI findings. This methodology allowed for a more precise correlation between the satellite imagery and the NDBI maps. The following graph summarizes the extracted results in percentages after supervised classification. The results from 2000, 2010, and 2020 were grouped in one graph with one line for each site and type of land cover with time series (Figure 6).
In a detailed manner, the supervised classification results for Makoko show that in 2000, the Makoko slum occupied approximately 61.02 hectares (62.1%) of built-up structures, while the non-built-up area spanned 37.17 hectares (37.9%). In 2010, the Makoko slum encompassed a built-up area of approximately 88.11 hectares (89.7%), whereas the non-built-up area was only 10.08 hectares (10.3%). Finally, in 2020, the results indicated that the Makoko slum encompassed a built-up area of approximately 95.67 hectares (97.4%), whereas the non-built-up area was only 2.52 hectares (2.6%). Conversely, Badia-East in 2000 exhibited a built-up area measuring 10.98 hectares (73.9%), contrasting with a relatively minor non-built-up area of only 3.87 hectares (26.1%). In 2010, the built-up area was measured at 12.24 hectares (82.4%), while the non-built-up area covered a mere 2.61 hectares (17.6%). Therefore, in 2020, the built-up area was measured at 10.35 hectares (69.7%), while the non-built-up area covered a mere 4.50 hectares (30.3%). In addition to the detailed method, spatial changes were mapped into two categories: Built-up and non-built-up. The three maps are in the Appendix A: 2000, 2010, and 2020.

3.2.2. Change Detection in 2000, 2010, and 2010

The researchers analyzed the results from each year to assess the change in built-up areas in 2000, 2010, and 2010 in Makoko and Badia-East (Table 4 and Table 5). Between 2000 and 2010, the built-up area (non-built-up converted to built-up) in Makoko increased to approximately 29.25 hectares, which equals 29.8% of the total land; then, between 2010 and 2020, non-built-up converted to built-up with approximately 8.10 hectares, which equals 8.2% of the entire land. This indicates a persistent increase in Makoko’s built-up area over the past two decades. On the other hand, between 2000 and 2010, the built-up area (non-built-up converted to built-up) in Badia-East increased to approximately 1.98 hectares, which equals 13.3% of the total land; then, conversely, between 2010 and 2020, built-up converted to non-built-up with approximately 2.25 hectares, which equals 15.2% of the entire land. This indicates a significant slum clearance in Badia-East’s built-up area over the past decade. Highlighting the change, it becomes evident that Badia-East experienced only a minor increase between 2000 and 2010, but between 2010 and 2020, the built-up area was reduced to a high level. This shift implies notable variations in urbanization patterns and government plans within the two areas.
Figure 7 highlights the Badia-East change detection observed in color after classifying three different satellite images of 2000, 2010, and 2020.
Figure 8 highlights the Makoko change detection observed in color after classifying three different satellite images of 2000, 2010, and 2020.

4. Limitations, Recommendations, and Prospect

4.1. Limitations

The research utilized advanced techniques such as supervised classification and NDBI to assess the evolution of slum areas accurately. It also employed a combination of techniques, including building and road network footprints, grid-cell mapping, and change detection, providing a comprehensive analysis of slum characteristics and evolution. The study was conducted longitudinally over two decades and compared two slum areas, Badia-East and Makoko, to offer insights into the differences in their evolution and the effectiveness of government interventions. The research concludes with clear policy recommendations, emphasizing the need for urgent slum clearance, upgrading initiatives, and prioritizing community involvement and needs.
The limitations of the data used for the research include the accuracy and reliability of the results that depend on the quality and availability of the data. The study focuses on specific areas, which may limit the generalizability of the findings to other urban areas. The study primarily relies on quantitative and spatial analysis techniques and may not capture all aspects of slum characteristics, such as social, economic, or cultural factors. Finally, the study does not project future trends; the findings are based on historical data up to 2020. Uncertainties in future urban planning or unforeseen events could influence slum evolution beyond the scope of the study.

4.2. Recommendations

This research recommends effectively addressing the issue of slums in Makoko using targeted initiatives and policies that have been successful in other areas, such as Badia-East. This includes sustainable slum clearance. Engaging the affected communities in planning and implementation is crucial to ensure the initiatives are tailored to their needs. By learning from successful experiences and investing in capacity-building initiatives, we can develop adaptable strategies for future changes and ensure the continued success of slum clearance and upgrading initiatives. Additionally, exploring alternative methodologies such as deep learning or neural network models can further our understanding of slum growth patterns and inform future interventions. A robust monitoring and evaluation framework is also necessary to track progress and make necessary adjustments. By incorporating measures for efficient resource utilization and environmental conservation, we can ensure that the initiatives are sustainable and positively impact the community’s overall well-being.

4.3. Prospect

The prospect highlighted in this research is that with spatial configuration mapping and mathematically based analysis, it was possible to determine the spatial characteristics of selected slums in Lagos using building and road network footprints, estimate their size by using grid cells of fishnets, and monitor their spatial transformations over two decades through supervised classification and NDBI results. The study’s findings provide insight into how slums evolve and suggest potential solutions to address the persistent challenges faced by residents of urban slums in the area. This prospect offers hope for a more inclusive and resilient urban environment in Lagos and other developing economies facing similar challenges. We plan to conduct further comparative studies on other areas of Lagos City using deep learning or neural network models to detect slum growth patterns.

5. Discussion

5.1. The Importance of Government Intervention in Clearing Slums: Reflections from Mexico City

This research has discovered that urban slums are a pervasive problem in many cities worldwide, and addressing this issue requires effective government intervention. Lagos, one of the world’s fastest-growing urban areas and Africa’s most populous megacity, has experienced significant changes in its LULC classes over recent decades due to rapid population growth and various human and anthropogenic activities. The successful implementation of the UN 2030 Agenda for Sustainable Development is crucial to maintaining Lagos’ current land cover classes [50]. An outstanding example of this phenomenon is also observed in cities like Mexico City, where the growth can be attributed to squatter settlements [51]. The rapid urbanization and economic difficulties experienced by Mexico City and Lagos City have led to the emergence of slums in both locations. Rural-to-urban migration, insufficient access to formal housing, and inadequate urban planning are some of the primary contributing factors to the proliferation of slums.
Furthermore, the scarcity of basic infrastructure, including access to clean water and sanitation, exacerbates these areas’ already poor living conditions [52,53,54,55]. Lagos is situated along the coastline and surrounded by a network of rivers, lagoons, and wetlands. However, rapid urbanization has resulted in the filling and deterioration of these water bodies [56]. The absence of effective, sustainable planning has contributed to the expansion of these slums, exacerbating the urban challenges [16,21]. Within slum areas, waste management systems are often lacking, resulting in water pollution and environmental degradation [1,26]. The findings provide evidence for the situation in Lagos, illustrated by Makoko as an example. The data for Makoko indicate a notable surge in informal built-up expansion, with an increase of 27.6% observed between 2000 and 2010, followed by a further 7.7% increase between 2010 and 2020. This substantial growth has led to converting approximately 34.65 hectares of previously non-built-up land in Makoko into urbanized areas. This trend highlights the rapid urbanization and the pressing need for strategic urban planning interventions in Makoko to address housing, infrastructure, and overall urban development issues. It also underscores the imperative to implement sustainable solutions to accommodate this population growth while ensuring residents’ well-being and quality of life. Mexico City’s approach to addressing slums provides a good shape for urban planners and policymakers. Through holistic interventions, the government has successfully improved slum conditions by implementing housing, infrastructure, and community development initiatives. Efforts to formalize land tenure and provide essential services have yielded positive outcomes [57,58]. Collaborative efforts involving government agencies, non-governmental organizations, and local communities have been instrumental in achieving these results, highlighting the importance of engaging multiple stakeholders in developing sustainable solutions [59]. Overall, Mexico City’s experience demonstrates the critical role of comprehensive planning and policy interventions in improving the living conditions of slum residents.

5.2. Does Adequate Slum Clearance Reduce Slum Growth and Its Effects?

The study’s findings demonstrate the crucial role of adequate slum clearance and upgrading initiatives in addressing the growth and adverse effects of slums [21]. The visual evidence from the classified images indicates that from 2000 to 2010, regarding the structure of building and road network footprints, both regions were predominantly comprised of informal settlements with no sustainable sanitation, poorly planned road networks, and irregularly arranged houses. During the initial decade (2000–2010), both regions experienced an increase in built-up areas, as indicated by the upward trendlines in Figure 3. Makoko has experienced a significant increase in informal built-up expansion over the analyzed 20 years, indicating a trend of rapid urbanization and informal housing development. The data show that the government’s intervention in Badia-East led to a 12.7% decrease in built-up areas between 2010 and 2020, suggesting that targeted government efforts can curb slum growth and improve living conditions. The success story of Badia-East between 2013 and 2017 provides a clear precedent for the positive impact that government intervention can have on slum areas [1]. The study underscores the urgency of slum clearance and upgrading initiatives in Makoko, given its significant increase in informal built-up expansion. Government policies should be designed to address the specific challenges Makoko faces, considering factors such as high population density, poorly designed infrastructure, and access to essential services. In addition to slum clearance, there should be a focus on sustainable urban planning, which entails providing adequate housing and ensuring access to essential services like healthcare, education, clean water, and sanitation [60,61]. Integrating slum upgrading initiatives into broader urban development strategies can lead to more inclusive and resilient cities [62]. Community engagement and empowerment are critical in the planning and implementation of slum clearance and upgrading initiatives. Empowering residents with skills, education, and access to economic opportunities can help break the cycle of poverty and informal housing. It is essential to analyze the interventions implemented in Badia-East and their effectiveness to inform similar initiatives in Makoko. Table 6 illustrates in a detailed manner the spatial changes in built-up areas between 2000 and 2020.
The analysis suggests that government efforts can influence the growth or decline of built-up areas [17]. Effective planning by the government can lead to controlled and sustainable urban development, which can prevent the emergence of harsh slums. Korail, in the large megacities of the Global South, became an isolated area with no access to essential services, resulting in “hydrological apartheid” for the urban people [63].

6. Conclusions

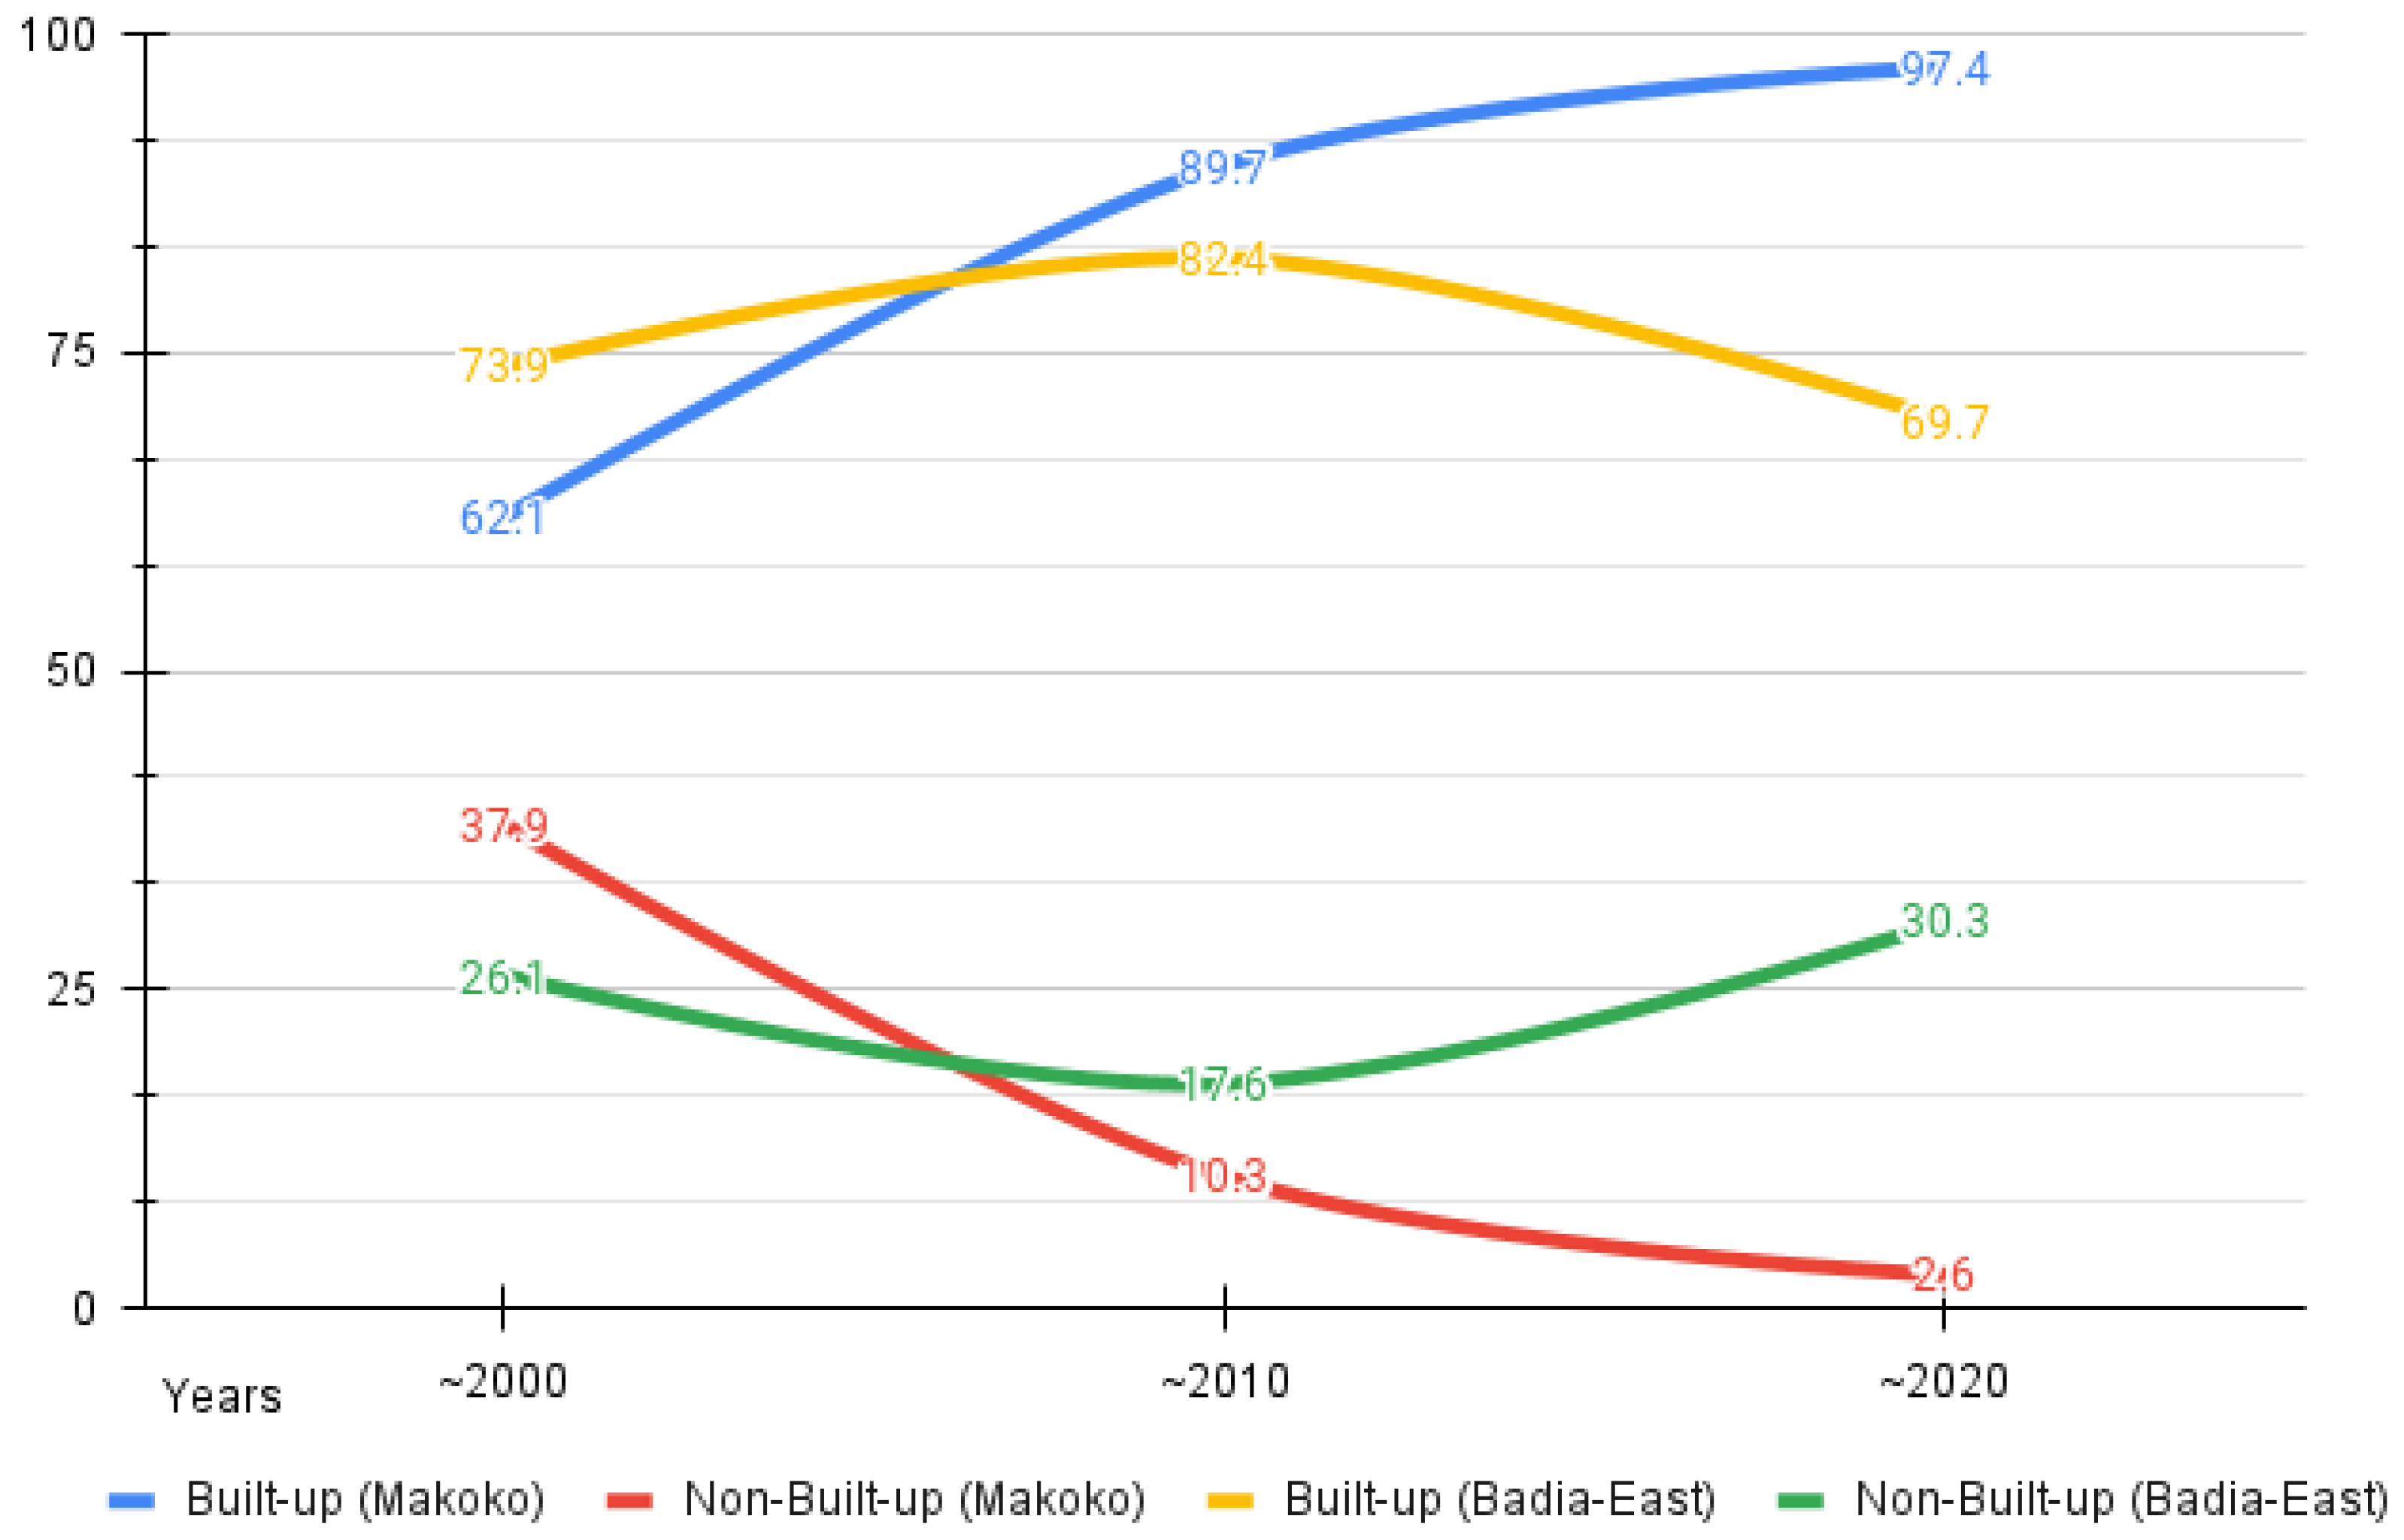
We believe the steady rise in the number of slums in the global south is being hastened by population growth. However, we also recognized that the lack of government intervention is a significant factor that allows this trend to persist. By studying the characteristics and mechanisms that influence the spatial evolution of slums in Lagos, Nigeria, specifically in Makoko and Badia, over the past two decades, we gained a better understanding of the causes, levels, and effects of these slums. According to the analysis of satellite images from 2000, 2010, and 2020 using “RS & GIS” techniques, the current land usage appears unsustainable. This conclusion is supported by additional methods, such as the Normalized Difference Built-up Index (NDBI) used to map changes in built-up areas over decades, fishnets used to measure the areas with inadequate roads and buildings, and footprints indicating irregular structures in Makoko due to clearance activities. From a time-series perspective, spatial changes were calculated, and in brief, studying slums in Lagos, specifically Makoko and Badia-East, revealed opposing results. The mathematical expressions showed how urban areas have changed over time, reflecting the urbanization process in these regions. Makoko experienced continuous growth, expanding by 7.56 hectares (7.7%) between 2010 and 2020 and 27.09 hectares (27.6%) between 2010 and 2000. Overall, 34.65 hectares of non-built-up land in Makoko were converted to built-up areas.
On the other hand, Badia-East saw an increase in built-up areas only between 2000 and 2010, amounting to 1.26 hectares (8.5%). However, 1.89 hectares (12.7%) decreased in built-up areas in Badia-East between 2010 and 2020. After conducting a time series analysis, it has become apparent that implementing adequate slum clearance and upgrading initiatives in Makoko is crucial. This is like the successful approach taken in Badia-East from 2013 to 2017.

Author Contributions

K.M.G.: Methodology, formal analysis, visualization, and draft writing. Y.S.: Conceptualization, supervision, and draft review and editing. All authors have read and agreed to the published version of the manuscript.

Funding

This study was funded by Shenzhen Planning and Land Development Research Center “Case Analysis of Urban Planning and Construction of Global Cities” (2021FY0001-2588).

Institutional Review Board Statement

Not applicable.

Informed Consent Statement

Not applicable.

Data Availability Statement

Apart from the spatial data accessible for download on the USGS website, the authors can provide other data and materials through the corresponding email upon request.

Acknowledgments

Authors express gratitude to all referenced authors and the USGS for providing open access to the spatial data utilized in this study.

Conflicts of Interest

The authors declare no conflict of interest.

Appendix A

Table A1. Details for Landsat 7.
BandsBand NameWavelength (Micrometer)Resolution
Band 1Blue(0.45–0.52 μm)30-m
Band 2Green(0.52–0.60 μm)30-m
Band 3Red(0.63–0.69 μm)30-m
Band 4Near-Infrared (NIR)(0.77–0.90 μm)30-m
Band 5Mid-Infrared (MIR)(1.55–1.75 μm)30-m
Band 6Thermal Infrared (TIR)(10.40–12.50 μm)60-m
Band 7Mid-Infrared (MIR)(2.09–2.35 μm)30-m
Band 8Panchromatic(0.52–0.90 μm)15-m
Table A2. Details for Landsat 8.
BandsBand NameWavelength (Micrometer)Resolution
Band 1Ultra Blue (0.435–0.451 μm)30-m
Band 2Blue (0.452–0.512 μm)30-m
Band 3Green (0.533–0.590 μm)30-m
Band 4Red(0.636–0.673 μm)30-m
Band 5Near-Infrared (NIR)(0.851–0.879 μm)30-m
Band 6Shortwave Infrared 1 (SWIR-1)(1.566–1.651 μm)60-m
Band 7Shortwave Infrared 2 (SWIR-2) (2.107–2.294 μm)30-m
Band 8Panchromatic (0.503–0.676 μm)15-m
Band 9Cirrus (1.363–1.384 μm) 30-m
Band 10Thermal Infrared 1 (TIR-1)(10.60–11.19 μm)100-m
Band 11Thermal Infrared 2 (TIR-2)(11.50–12.51 μm)100-m
2
Supervised classification Images.
Figure A1. Satellite Images of Lagos. (a) Satellite Image 2000. (b) Satellite Image 2010. (c) Satellite Image 2020.
Sustainability 15 14353 g0a1

References

  1. Obaitor, O.; Lawanson, T.O.; Stellmes, M.; Lakes, T. Social Capital: Higher Resilience in Slums in the Lagos Metropolis. Sustainability 2021, 13, 3879. [Google Scholar] [CrossRef]
  2. Thoms, A.; Köster, S. Potentials for Sponge City Implementation in Sub-Saharan Africa. Sustainability 2022, 14, 11726. [Google Scholar] [CrossRef]
  3. Agyabeng, A.N.; Peprah, A.A.; Mensah, J.K.; Mensah, E.A. Informal settlement and urban development discourse in the Global South: Evidence from Ghana. Nor. Geogr. Tidsskr. 2022, 76, 242–253. [Google Scholar] [CrossRef]
  4. Ragheb, R.A.; Barakat, P.N. New Sustainable Agenda for Slums Future Expansion, Case-Study: Ezbiit El-Matabea, Alexandria, Egypt. Int. J. Sustain. Dev. Plan. 2022, 17, 385–397. [Google Scholar] [CrossRef]
  5. Endah, K.; Rusli, B.; Kartini, D.S.; Utami, S.B. Management of slum settlements in urban areas is related to the principle of sustainable development goals in Indonesia. J. Int. Funer. 2021, 22. [Google Scholar]
  6. Sharma, D.; Kafle, R. Exclusive Breastfeeding and Complementary Feeding Practices among Children in Slum of Pokhara. J. Coll. Med. Sci.-Nepal 2020, 16, 93–98. [Google Scholar] [CrossRef]
  7. Weimann, A.; Oni, T. A systematized review of the health impact of urban informal settlements and implications for up-grading interventions in South Africa, a rapidly urbanizing middle-income country. Int. J. Environ. Res. Public Health. 2019, 16, 3608. [Google Scholar] [CrossRef] [PubMed]
  8. Hawa, N.I.; Antriyandarti, E.; Martono, D.N.; Maulana, R.A. Improvement of Environmental, Social, and Cultural Attributes in the Slum Settlements on the Riverbanks of Yogyakarta City under the Sultan’s Rule. Sustainability 2023, 15, 8974. [Google Scholar] [CrossRef]
  9. Peng, Q.; Ge, S.; Li, W.; Xiao, L.; Fu, J.; Yu, Q.; Zhao, Z.; Gao, J. Identification of densely populated-informal settlements and their role in Chi-nese urban sustainability assessment. GIsci. Remote Sens. 2023, 60. [Google Scholar] [CrossRef]
  10. Adeoye Olugbenga Adewolu. Infrastructure growth and sustainable development: Review of Lagos City profile. International J. Eng. Invent. 2023, 12, 253–276. [Google Scholar]
  11. Soyinka, O.; Siu, K.W.M.; Lawanson, T.; Adeniji, O. Assessing smart infrastructure for sustainable urban development in the Lagos metropolis. J. Urban Manag. 2016, 5, 52–64. [Google Scholar] [CrossRef]
  12. Olubodun, T.; Balogun, M.R.; Odeyemi, A.K.; Odukoya, O.O.; Ogunyemi, A.O.; Kanma-Okafor, O.J.; Okafor, I.P.; Olubodun, A.B.; Ogundele, O.O.; Ogunnowo, B.; et al. Barriers and Recommendations for a Cervical Cancer Screening Program among Women in Low-resource Settings in Lagos Nigeria: A Qualitative Study. BMC Public Health 2022, 22, 19062022. [Google Scholar] [CrossRef] [PubMed]
  13. Kshetrimayum, B.; Bardhan, R.; Kubota, T. Factors Affecting Residential Satisfaction in Slum Rehabilitation Housing in Mumbai. Sustainability 2020, 12, 2344. [Google Scholar] [CrossRef]
  14. Abdulmalik, A.; Kanori, E.; Marei, R. The Beauty of Slums. Civ. Eng. Archit. 2022, 10, 126–131. [Google Scholar] [CrossRef]
  15. Adegoke, A.K.; Adewale, B.A. Slum Settlements Regeneration in Lagos Megacity: An Overview of a Waterfront Makoko Community. Int. J. Educ. Res. 2013, 1, 1–16. [Google Scholar]
  16. Olatunde, M.; Agbola, B.; Popoola, A.; Adeleye, B.; Medayese, S. Urban eviction in Badia, Lagos: A look at evictees well-being and environmental burden. Zb. Rad. Departmana Za Geogr. Turiz. I Hotel. 2021, 50, 33–51. [Google Scholar] [CrossRef]
  17. Adama, O. Slum upgrading in the era of World-Class city construction: The case of Lagos, Nigeria. Int. J. Urban Sustain. Dev. 2020, 12, 219–235. [Google Scholar] [CrossRef]
  18. Agarwal, S.; Kothiwal, K.; Verma, S.; Verma, N.; Vishvakarma, K. Perseverance in the Face of Water Scarcity in Hot Summer Seasons: A Case Study of Slum Communities in Indore, India. In Urban Transformational Landscapes in the City-Hinterlands of Asia: Challenges and Approaches; Springer Nature Singapore: Singapore, 2023; pp. 177–199. [Google Scholar] [CrossRef]
  19. Sarkar, A. Everyday practices of poor urban women to access water: Lived realities from a Nairobi slum. Afr. Stud. 2020, 79, 212–231. [Google Scholar] [CrossRef]
  20. Oluremi Aminu, F.; Udeze, E. Relationship Between Water, Sanitation, Hygiene Practices and The Incidence of Water Borne Diseases Among Urban Slum Households in Lagos State, Nigeria. J. Agric. Food Environ. Anim. Sci. 2023, 4, 1–20. [Google Scholar]
  21. Oloko, A.; Fakoya, K.; Ferse, S.; Breckwoldt, A.; Harper, S. The Challenges and Prospects of Women Fisherfolk in Makoko, Lagos State, Nigeria. Coast. Manag. 2022, 50, 124–141. [Google Scholar] [CrossRef]
  22. Del Rio, D.D.F.; Sovacool, B.K. Of cooks, crooks and slum-dwellers: Exploring the lived experience of energy and mobility poverty in Mexico’s informal settlements. World Dev. 2023, 161, 106093. [Google Scholar] [CrossRef]
  23. Omidiji, J.; Samuel, U.; Busayo, F.; Ayeni, A. Investigating the impacts of COVID-19 safety measures and related uncertainties among socially vulnerable groups in Lagos megacity. Heliyon 2022, 8, e10090. [Google Scholar] [CrossRef]
  24. Matarira, D.; Mutanga, O.; Naidu, M. Google Earth Engine for Informal Settlement Mapping: A Random Forest Classification Using Spectral and Textural Information. Remote Sens. 2022, 14, 5130. [Google Scholar] [CrossRef]
  25. Anwana, E.O.; Owojori, O.M. Analysis of Flooding Vulnerability in Informal Settlements Literature: Mapping and Research Agenda. Soc Sci. 2023, 12, 40. [Google Scholar] [CrossRef]
  26. Mudau, N.; Mhangara, P. Mapping and Assessment of Housing Informality Using Object-Based Image Analysis: A Review. Urban Sci. 2023, 7, 98. [Google Scholar] [CrossRef]
  27. Soman, S.; Beukes, A.; Nederhood, C.; Marchio, N.; Bettencourt, L.M.A. Worldwide detection of informal settlements via topolog-ical analysis of crowdsourced digital maps. ISPRS Int. J. Geoinf. 2020, 9, 685. [Google Scholar] [CrossRef]
  28. Najmi, A.; Gevaert, C.M.; Kohli, D.; Kuffer, M.; Pratomo, J. Integrating Remote Sensing and Street View Imagery for Mapping Slums. ISPRS Int. J. Geo-Inf. 2022, 11, 631. [Google Scholar] [CrossRef]
  29. Aliani, H.; Malmir, M.; Sourodi, M.; Kafaky, S.B. Change detection and prediction of urban land use changes by CA–Markov model (case study: Talesh County). Environ. Earth Sci. 2019, 78, 546. [Google Scholar] [CrossRef]
  30. Ajibade, I. The Resilience Fix to Climate Disasters: Recursive and Contested Relations with Equity and Justice-Based Transformations in the Global South. Ann. Am. Assoc. Geogr. 2022, 112, 2230–2247. [Google Scholar] [CrossRef]
  31. Soliman, N. Exploring slum life and urban poverty in Lagos: The politics of everyday resistance in Chris Abani’s Graceland. J. Humanit. Appl. Soc. Sci. 2023. ahead-of-printing. [Google Scholar] [CrossRef]
  32. Reid, A. Closing the Affordable Housing Gap: Identifying the Barriers Hindering the Sustainable Design and Construction of Affordable Homes. Sustainability 2023, 15, 8754. [Google Scholar] [CrossRef]
  33. Echendu, A.J. Flooding, Food Security and the Sustainable Development Goals in Nigeria: An Assemblage and Systems Thinking Approach. Soc. Sci. 2022, 11, 59. [Google Scholar] [CrossRef]
  34. Odoyi, E.J.; Riekkinen, K. Housing Policy: An Analysis of Public Housing Policy Strategies for Low-Income Earners in Nigeria. Sustainability 2022, 14, 2258. [Google Scholar] [CrossRef]
  35. Akokuwebe, M.E.; Idemudia, E.S. A Comparative Cross-Sectional Study of the Prevalence and Determinants of Health In-surance Coverage in Nigeria and South Africa: A Multi-Country Analysis of Demographic Health Surveys. Int. J. Environ. Res. Public Health 2022, 19, 1766. [Google Scholar] [CrossRef] [PubMed]
  36. Onyango, E.O.; Crush, J.S.; Owuor, S. Food Insecurity and Dietary Deprivation: Migrant Households in Nairobi, Kenya. Nutri-ents 2023, 15, 1215. [Google Scholar] [CrossRef] [PubMed]
  37. Proietti, P.; Siragusa, A. Monitoring Slums and Informal Settlements in Europe; European Union: Luxembourg, 2023. [Google Scholar] [CrossRef]
  38. Khan, M.; Reshi, I.; Raja, R. Public Provision in Water and Sanitation: An Inter District Study Of Urban Slums In Jammu And Kashmir. Int. J. Econ. Bus. Account. Agric. Manag. Sharia Adm. 2022, 2, 316–326. [Google Scholar]
  39. Jelili, M.O.; Akinyode, B.F.; Ogunleti, A. Land Pooling and Urban Renewal in Lagos State: A Narrative Inquiry into Isale Gangan Project. Urban Forum 2020, 32, 49–66. [Google Scholar] [CrossRef]
  40. Okimiji, O.P.; Techato, K.; Simon, J.N.; Tope-Ajayi, O.O.; Okafor, A.T.; Aborisade, M.A.; Phoungthong, K. Spatial pattern of air pollutant concentrations and their relationship with meteorological parameters in coastal slum settlements of Lagos, southwestern Nigeria. Atmosphere 2021, 12, 1426. [Google Scholar] [CrossRef]
  41. Hamoud, M.W.; Mátyás, G. Land Use Land Cover (LULC) and Burn Severity (dNBR) Changes Analysis in Latakia, Syria Visu-Alized on Web Maps. 2022. Available online: https://www.researchgate.net/publication/361208079_Land_Use_Land_Cover_LULC_and_Burn_Severity_dNBR_changes_analysis_in_Latakia_Syria_visualized_on_Web_maps (accessed on 7 July 2023).
  42. Akil, A.; Yudono, A.; Osman, W.W.; Ibrahim, R.; Hidayat, A. Suitable Potential Locations for Street Vendors in Makassar City, Indonesia. Int. Rev. Spat. Plan. Sustain. Dev. 2023, 11, 152–171. [Google Scholar] [CrossRef]
  43. Müller, I.; Taubenböck, H.; Kuffer, M.; Wurm, M. Misperceptions of predominant slum locations? Spatial analysis of slum locations in terms of topography based on earth observation data. Remote Sens. 2020, 12, 2474. [Google Scholar] [CrossRef]
  44. Banstola, P.; Raj Bhusal, K.; Adhikari, S. Landfill site selection using GIS and Multicriteria Decision Analysis: A Case Study of Butwal Sub-Metropolitan City. Adv. Res. Publ. J. Adv. Res. Geo Sci. Remote Sens. 2023, 10, 20–28. [Google Scholar]
  45. Charly, A.; Thomas, N.J.; Foley, A.; Caulfield, B. Identifying optimal locations for community electric vehicle charging. Sustain. Cities Soc. 2023, 94, 104573. [Google Scholar] [CrossRef]
  46. Singh, P.; Sarkar Chaudhuri, A.; Verma, P.; Singh, V.K.; Meena, S.R. Earth observation data sets in monitoring of urbanization and urban heat island of Delhi, India. Geomat. Nat. Hazards Risk. 2022, 13, 1762–1779. [Google Scholar] [CrossRef]
  47. Kshetri, T.B. NDVI, NDBI and NDWI calculation using Landsat 7 and 8. GeoWorld. 2022, 2, 32–34. [Google Scholar]
  48. Uleme, C. Slum Upgrading and the Rental Housing Sector: A Study of Landlord-Tenant Relationships in a Lagos (Nigeria) Slum. Ph.D. Thesis, University of Northampton, Northampton, UK, 2021. [Google Scholar]
  49. Dano, U.L.; Balogun, A.-L.; Abubakar, I.R.; Aina, Y.A. Transformative urban governance: Confronting urbanization challenges with geospatial technologies in Lagos, Nigeria. GeoJournal 2019, 85, 1039–1056. [Google Scholar] [CrossRef]
  50. Enoh, M.A.; Njoku, R.E.; Okeke, U.C. Modeling and mapping the spatial–temporal changes in land use and land cover in Lagos: A dynamics for building a sustainable urban city. Adv. Space Res. 2023, 72, 694–710. [Google Scholar] [CrossRef]
  51. Opeyemi, K.; Olabode, M.; Bili Olalekan, K.; Omolola, O. Urban Slums as Spatial Manifestations of Urbanization in Sub-Saharan Africa: A Case Study of Ajegunle Slum Settlement, Lagos, Nigeria. Dev. Ctry. Stud. 2012, 2, 1–10. [Google Scholar]
  52. El Nachar, E.; Abouelmagd, D. The Inter/Transdisciplinary Framework for Urban Governance Intervention in the Egyptian Informal Settlements. Buildings 2023, 13, 265. [Google Scholar] [CrossRef]
  53. Jeremiah, U.O.; Efanga, E.O.; Essiet, U.N.; Jimmy, U.V. Urbanisation and Sustainable Development of Abuja City, Nigeria. Afr. Sch. J. Afr. Sustain. Dev. (JASD-2) 2020, 19, 167–184. [Google Scholar]
  54. Okimiji, O.; Adedeji, O.; Oguntoke, O.; Shittu, O.; Aborisade, M.; Ezennia, O. Analysis of socio-economic and housing char-acteristics in some selected slum area in Lagos State Metropolis, Nigeria using Geographical Information System. AJEPM 2014, 1, 48–55. [Google Scholar]
  55. Nwalusi, D.M.; Okeke, F.O.; Anierobi, C.M.; Nnaemeka-Okeke, R.C.; Nwosu, K.I. A study of the impact of rural-urban mi-gration and urbanization on public housing delivery in Enugu Metropolis, Nigeria. Eur. J. Sustain. Dev. 2022, 11, 59. [Google Scholar] [CrossRef]
  56. Adegun, O.B. Flood-related challenges and impacts within coastal informal settlements: A case from LAGOS, NIGERIA. Int. J. Urban Sustain. Dev. 2023, 15, 1–13. [Google Scholar] [CrossRef]
  57. Davis, D.E.; Fernández, J.C. Collective Property Rights and Social Citizenship: Recent Trends in Urban Latin America. Soc. Policy Soc. 2019, 19, 319–330. [Google Scholar] [CrossRef]
  58. Padmini, S.V. Socio-Economic Conditions of Slum Dwellers in Karnataka-a Case Study in Tumkur District; Archers & Elevators Publishing House: Bengaluru, India, 2022. [Google Scholar]
  59. Santos, E.C.; Kinniburgh, F.; Schmid, S.; Büttner, N.; Pröbstl, F.; Liswanti, N.; Komarudin, H.; Borasino, E.; Ntawuhiganayo, E.; Zinngrebe, Y. Mainstreaming revisited: Experiences from eight countries on the role of National Biodiversity Strategies in practice. Earth Syst. Gov. 2023, 16, 100177. [Google Scholar] [CrossRef]
  60. Reyes Plata, J.A.; Galindo Pérez, M.C. Access to basic services: From public benefit practice to a sustainable development approach. In Sustainable Cities and Communities; Springer: Cham, Switzerland, 2020; pp. 1–10. [Google Scholar]
  61. Obianyo, I.I.; Ihekweme, G.O.; Mahamat, A.A.; Onyelowe, K.C.; Onwualu, A.P.; Soboyejo, A.B. Overcoming the obstacles to sustainable housing and urban development in Nigeria: The role of research and innovation. Clean. Eng. Technol. 2021, 4, 100226. [Google Scholar] [CrossRef]
  62. Jegede, F.; A Adewale, B.; Olaniyan, O.D. Evaluation of Sustainable Urban Renewal Strategies in an evolving Residential District of Lagos Island, Nigeria. IOP Conf. Ser. Earth Environ. Sci. 2019, 331, 012001. [Google Scholar] [CrossRef]
  63. Sultana, F. Embodied Intersectionalities of Urban Citizenship: Water, Infrastructure, and Gender in the Global South. Ann. Assoc. Am. Geogr. 2020, 110, 1407–1424. [Google Scholar] [CrossRef]
Figure 1. Conceptual Framework of Study.
Sustainability 15 14353 g001
Figure 2. Study area location map of Makoko and Badia-East in Lagos city.
Sustainability 15 14353 g002
Figure 3. All these two maps show the slum situation in the Makoko area. (a) Grid cells of the Makoko location. The mapping of grid cells performed to determine the location and size of the informal settlement in Makoko; (b) map of irregular housing and road network conditions in Makoko.The map of Makoko, highlighting the disorderly arrangement of its roads and buildings.
Sustainability 15 14353 g003
Figure 4. These two maps show the slum situation in Badia-East. (a) Grid cells of the Badia-East area, including the part designated as the informal area. The grid cells filled with rose quartz color in a specific area indicate that this area is associated with substandard housing conditions. The remaining unfilled color cells indicate areas that do not have poor housing conditions; (b) map of irregular housing conditions in Badia-East. The map shows the disorderly nature of the housing construction, which presents a challenge for constructing sustainable road networks and other infrastructure.
Sustainability 15 14353 g004
Figure 5. (a) Map of Makoko and Badia-East areas according to NDBI resulting from a satellite image 2000, where the red areas on the above map represent built-up areas, while the gray areas represent non-built-up areas. In the case of non-built-up areas, the NDBI values ranged from −0.10 to 0.17. This range indicates that non-built-up elements, including vegetation and water bodies, primarily characterize these regions. Conversely, the NDBI values for built-up areas in Makoko and Badia slums fell from 0.17 to 0.98. (b) Map of Makoko and Badia-East areas according to NDBI, resulting from a satellite image 2020. The NDBI values for the non-built-up areas ranged between −0.35 and −0.04. These values indicate a relatively low level of built-up infrastructure within these regions. In contrast, the NDBI values for the built-up areas fell between −0.04 and 0.66. Both maps were created using the ArcGIS base map.
Sustainability 15 14353 g005
Figure 6. Graph with one line for each site and type of land cover in 2000, 2010, and 2020.
Sustainability 15 14353 g006
Figure 7. Change in Badia-East from 2000 to 2020 (Accessed via Google Earth Pro, August 2023). (a). Badia-East change detection. (b). Badia-East in December 2000. (c). Badia-East in April 2020.
Sustainability 15 14353 g007
Figure 8. Change in Makoko from 2000 to 2020 (Accessed via Google Earth Pro, August 2023). (a). Makoko change detection. (b). Makoko in December 2000. (c). Makoko in April 2020.
Sustainability 15 14353 g008
Table 1. The population growth in Lagos from the 19th to the 21st century.
YearsPopulation Change
187128,518
1931126,108
19783,800,000
19794,130,000
199711,850,000
200113,000,000
200524,400,000
201825,615,703
Source: These data were extracted from the following articles as cited [1,15].
Table 2. Data description of satellite images downloaded from USGS.
Satellite Image NameResolutionBandsPath/RowLandsatDate
LE07_L1TP_191055_20000206_20200918_02_T130 × 30 m8191/05576 February 2000
LE07_L1TP_191055_20100406_20200911_02_T130 × 30 m8191/05576 April 2010
LC08_L1TP_191055_20200104_20200823_02_T130 × 30 m11191/05584 January 2020
Source: Three satellite images were downloaded from USGS.
Table 3. NDBI formula per the type of Landsat.
LandsatNDBI Formula
7(Band 5 − Band 4)/(Band 5 + Band 4)
8(Band 6 − Band 5)/(Band 6 + Band 5)
Table 4. Change detection for Badia-East in 2000, 2010, and 2020.
Class Name2000–2010 in Hectares2010–2020 in Hectares2000–2010 in %2010–2020 in %
Non-built-up to non-built-up1.892.2512.715.2
Non-built-up to built-up1.980.3613.32.4
Built-up to non-built-up0.722.254.815.2
Built-up to built-up10.269.9969.167.3
Table 5. Change detection for Makoko in 2000, 2010, and 2020.
Class Name2000–2010 in Hectares2010–2020 in Hectares2000–2010 in %2010–2020 in %
Non-built-up to non-built-up7.921.988.12.1
Non-built-up to built-up29.258.1029.88.2
Built-up to non-built-up2.160.542.20.5
Built-up to built-up58.8687.5759.989.2
Table 6. Mathematical time series results from supervised classification for Built-Up and Non-Built-Up classes between Makoko and Badia-East areas.
YearsBuilt-UpNon-Built-Up
MakokoBadia-EastMakokoBadia-East
200062.1%73.9%37.9%26.1%
201089.7%82.4%10.3%17.6%
202097.4%69.7%2.6%30.3%
Disclaimer/Publisher’s Note: The statements, opinions and data contained in all publications are solely those of the individual author(s) and contributor(s) and not of MDPI and/or the editor(s). MDPI and/or the editor(s) disclaim responsibility for any injury to people or property resulting from any ideas, methods, instructions or products referred to in the content.

