


Analysis of Surface Settlement Induced by Shield Tunnelling: Grey Relational Analysis and Numerical Simulation Study on Critical Construction Parameters


Abstract
:1. Introduction
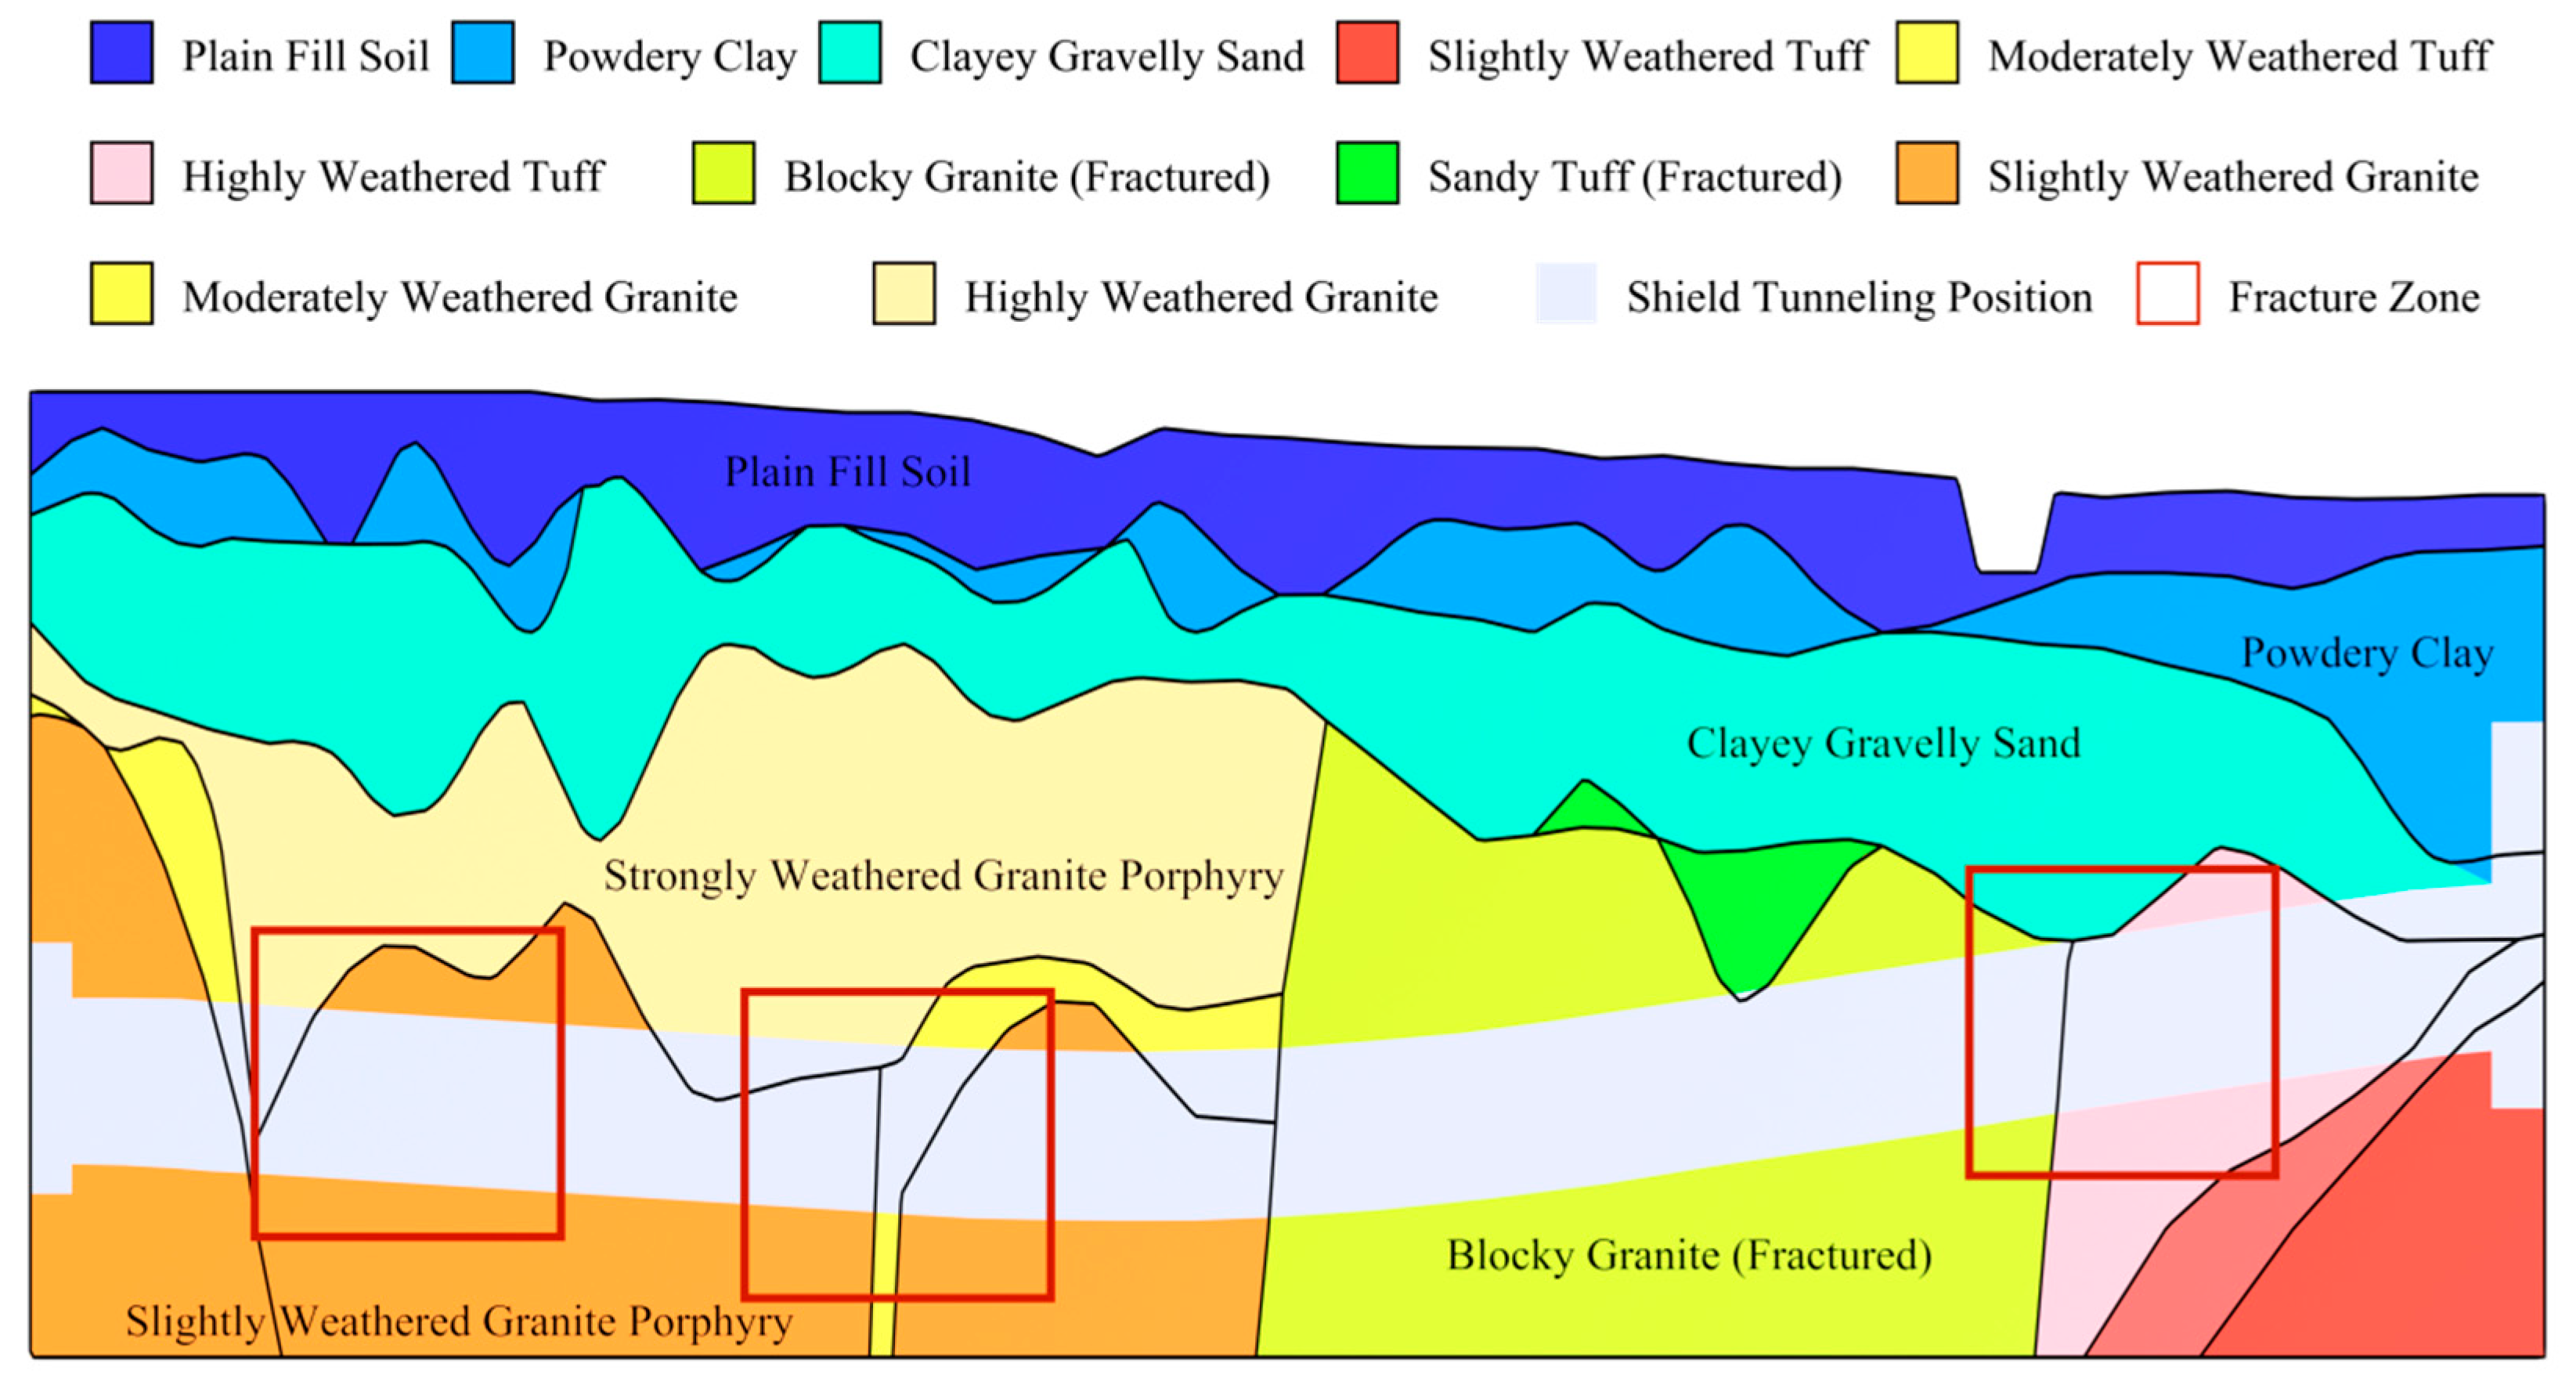
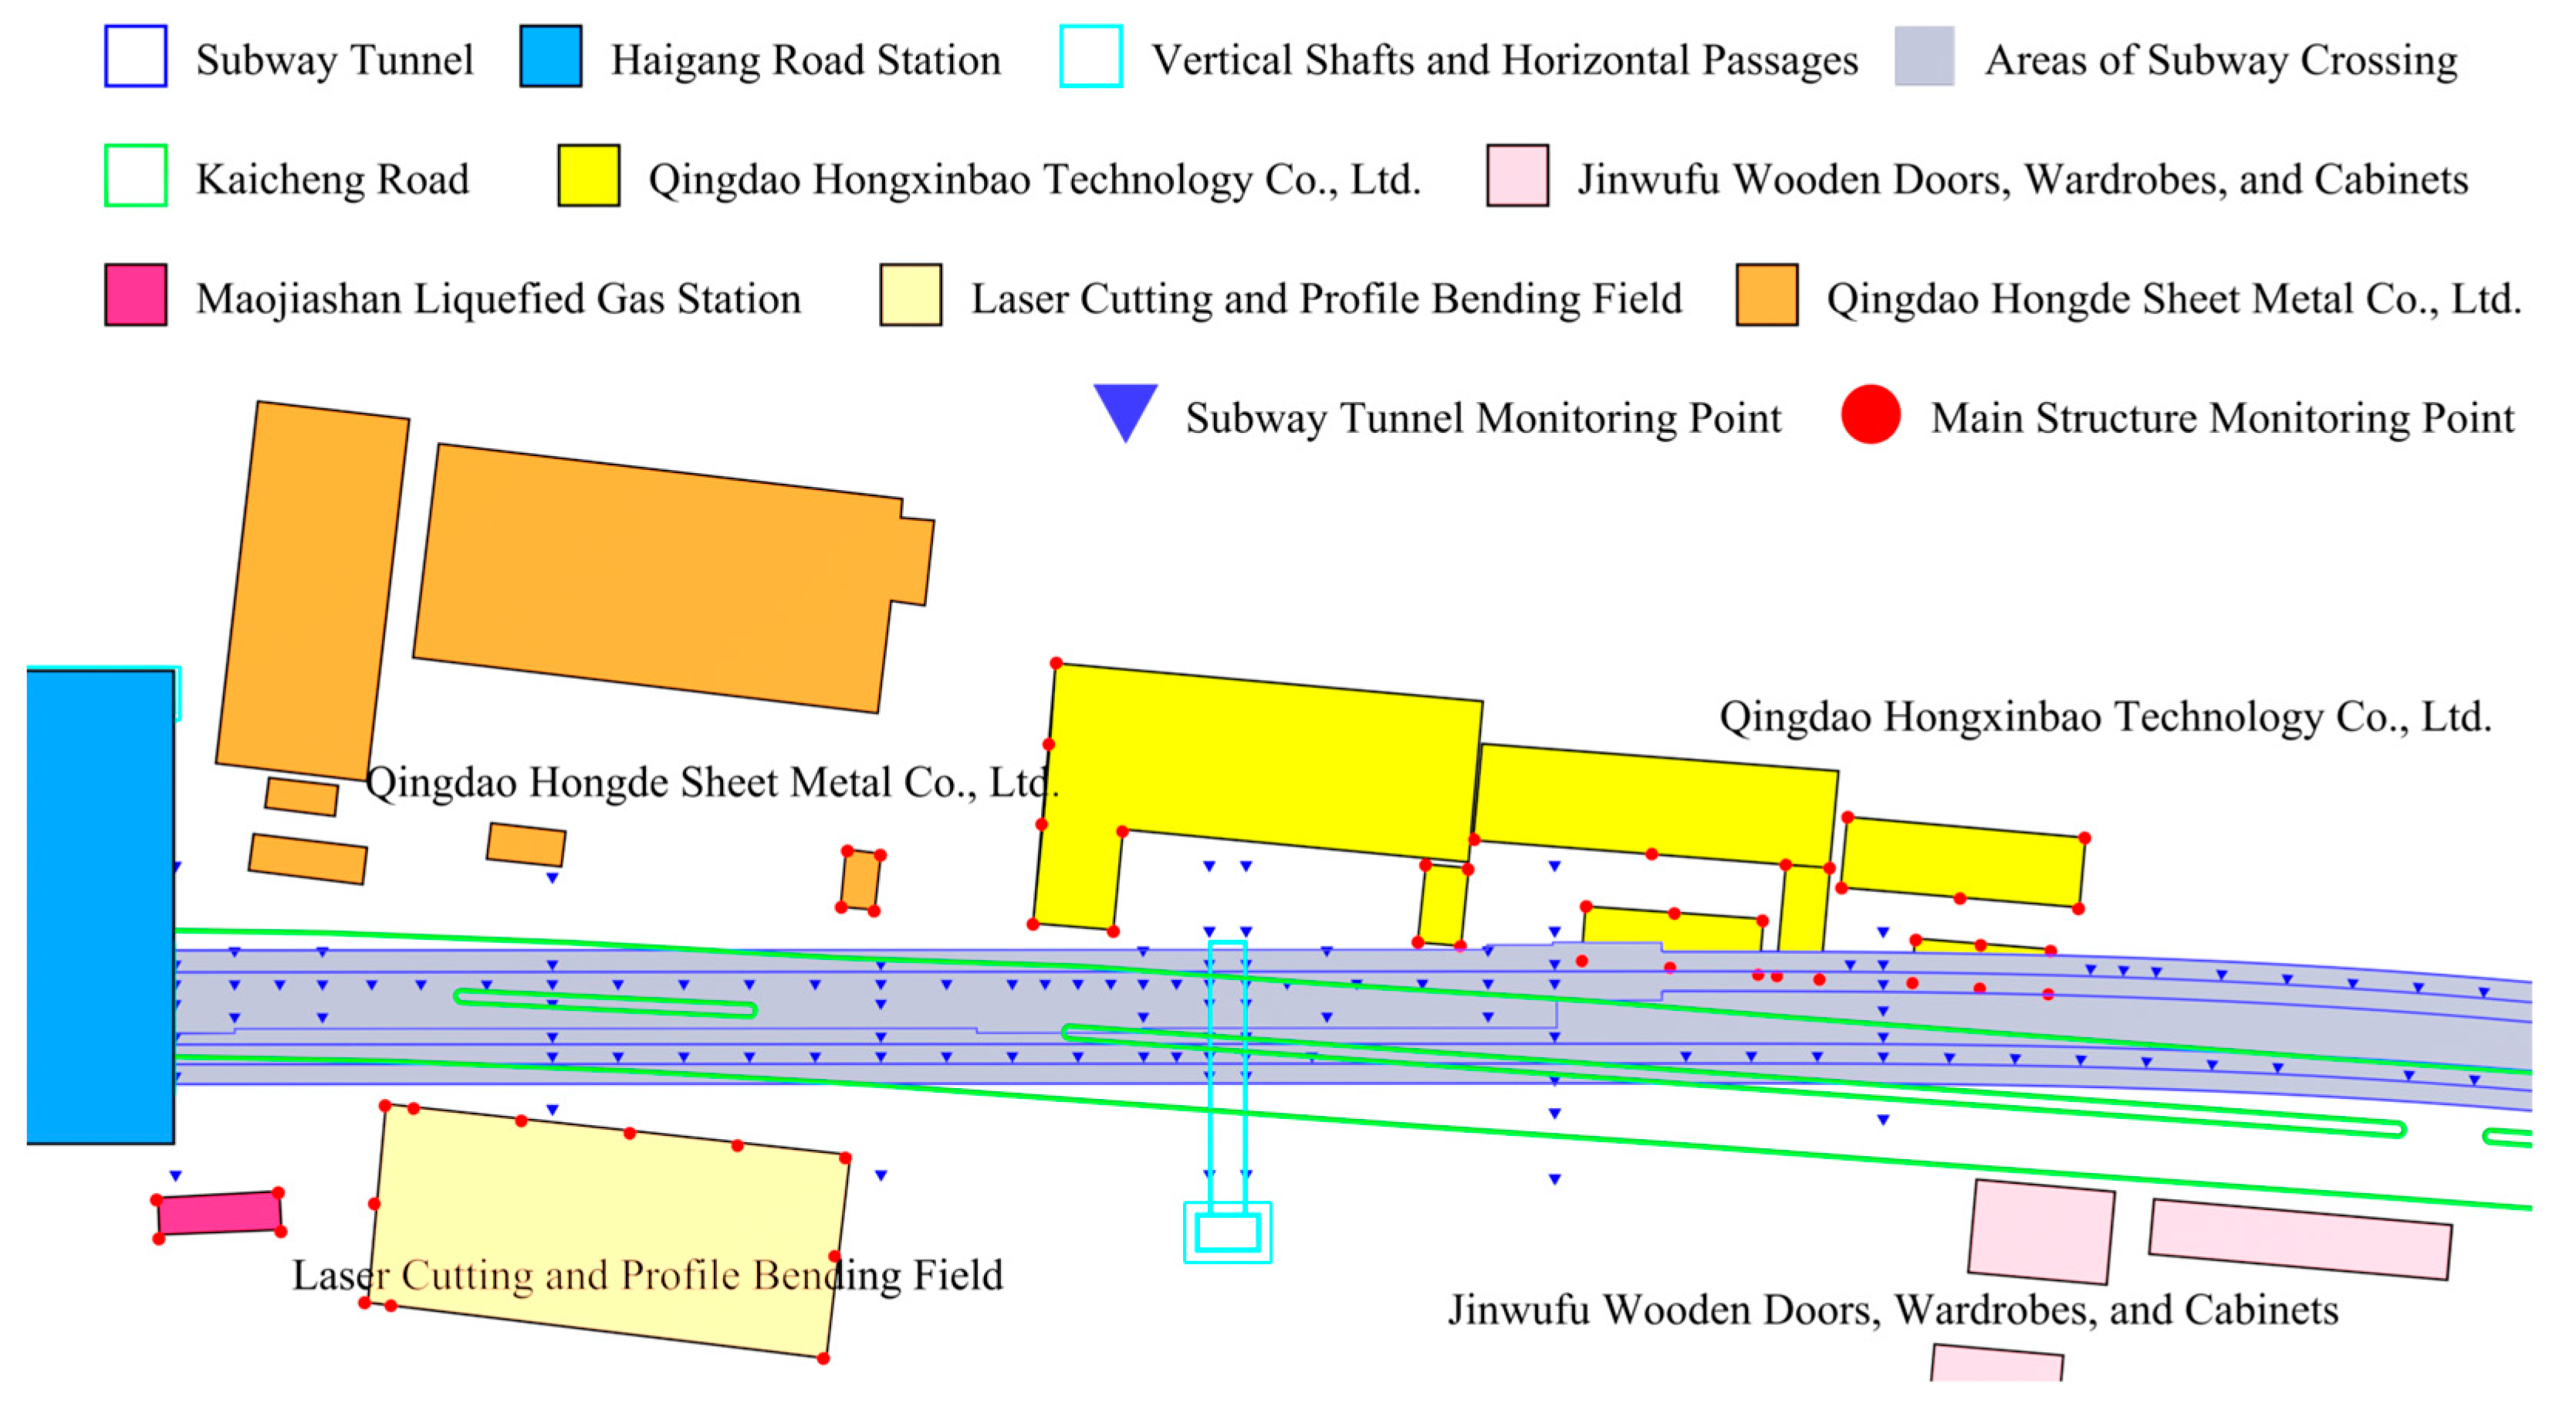
2. Project Overview
3. Grey Relational Analysis
- Determine the evaluation index sequence and the influential parameter sequence.
- Transform the obtained sequences into dimensionless form.
- Calculate the difference sequences and identify the maximum and minimum differences.
- Compute the relational coefficients and determine the grey relational degree.
3.1. Model Index Determination
- Changes in the stress state of the excavated soil.
- Squeezing and forward movement of the soil in front of the excavation face and the surrounding soil in contact with the shield.
- Over-excavation during the tunnelling process.
- Formation of gaps around the shield due to the shield shell radius being smaller than the cutterhead radius, causing the surrounding soil to move towards the void and result in surface settlement.
- Improper grouting at the shield tail leads to soil compression and settlement.
- Interaction between the soil and the lining, as well as between the lining and the segment.
- Creep or secondary consolidation of the soft clay soil following construction disturbance around the shield tunnel, leading to continuous secondary consolidation settlement.
3.2. Grey Relational Degree Calculation
3.3. Results and Analysis
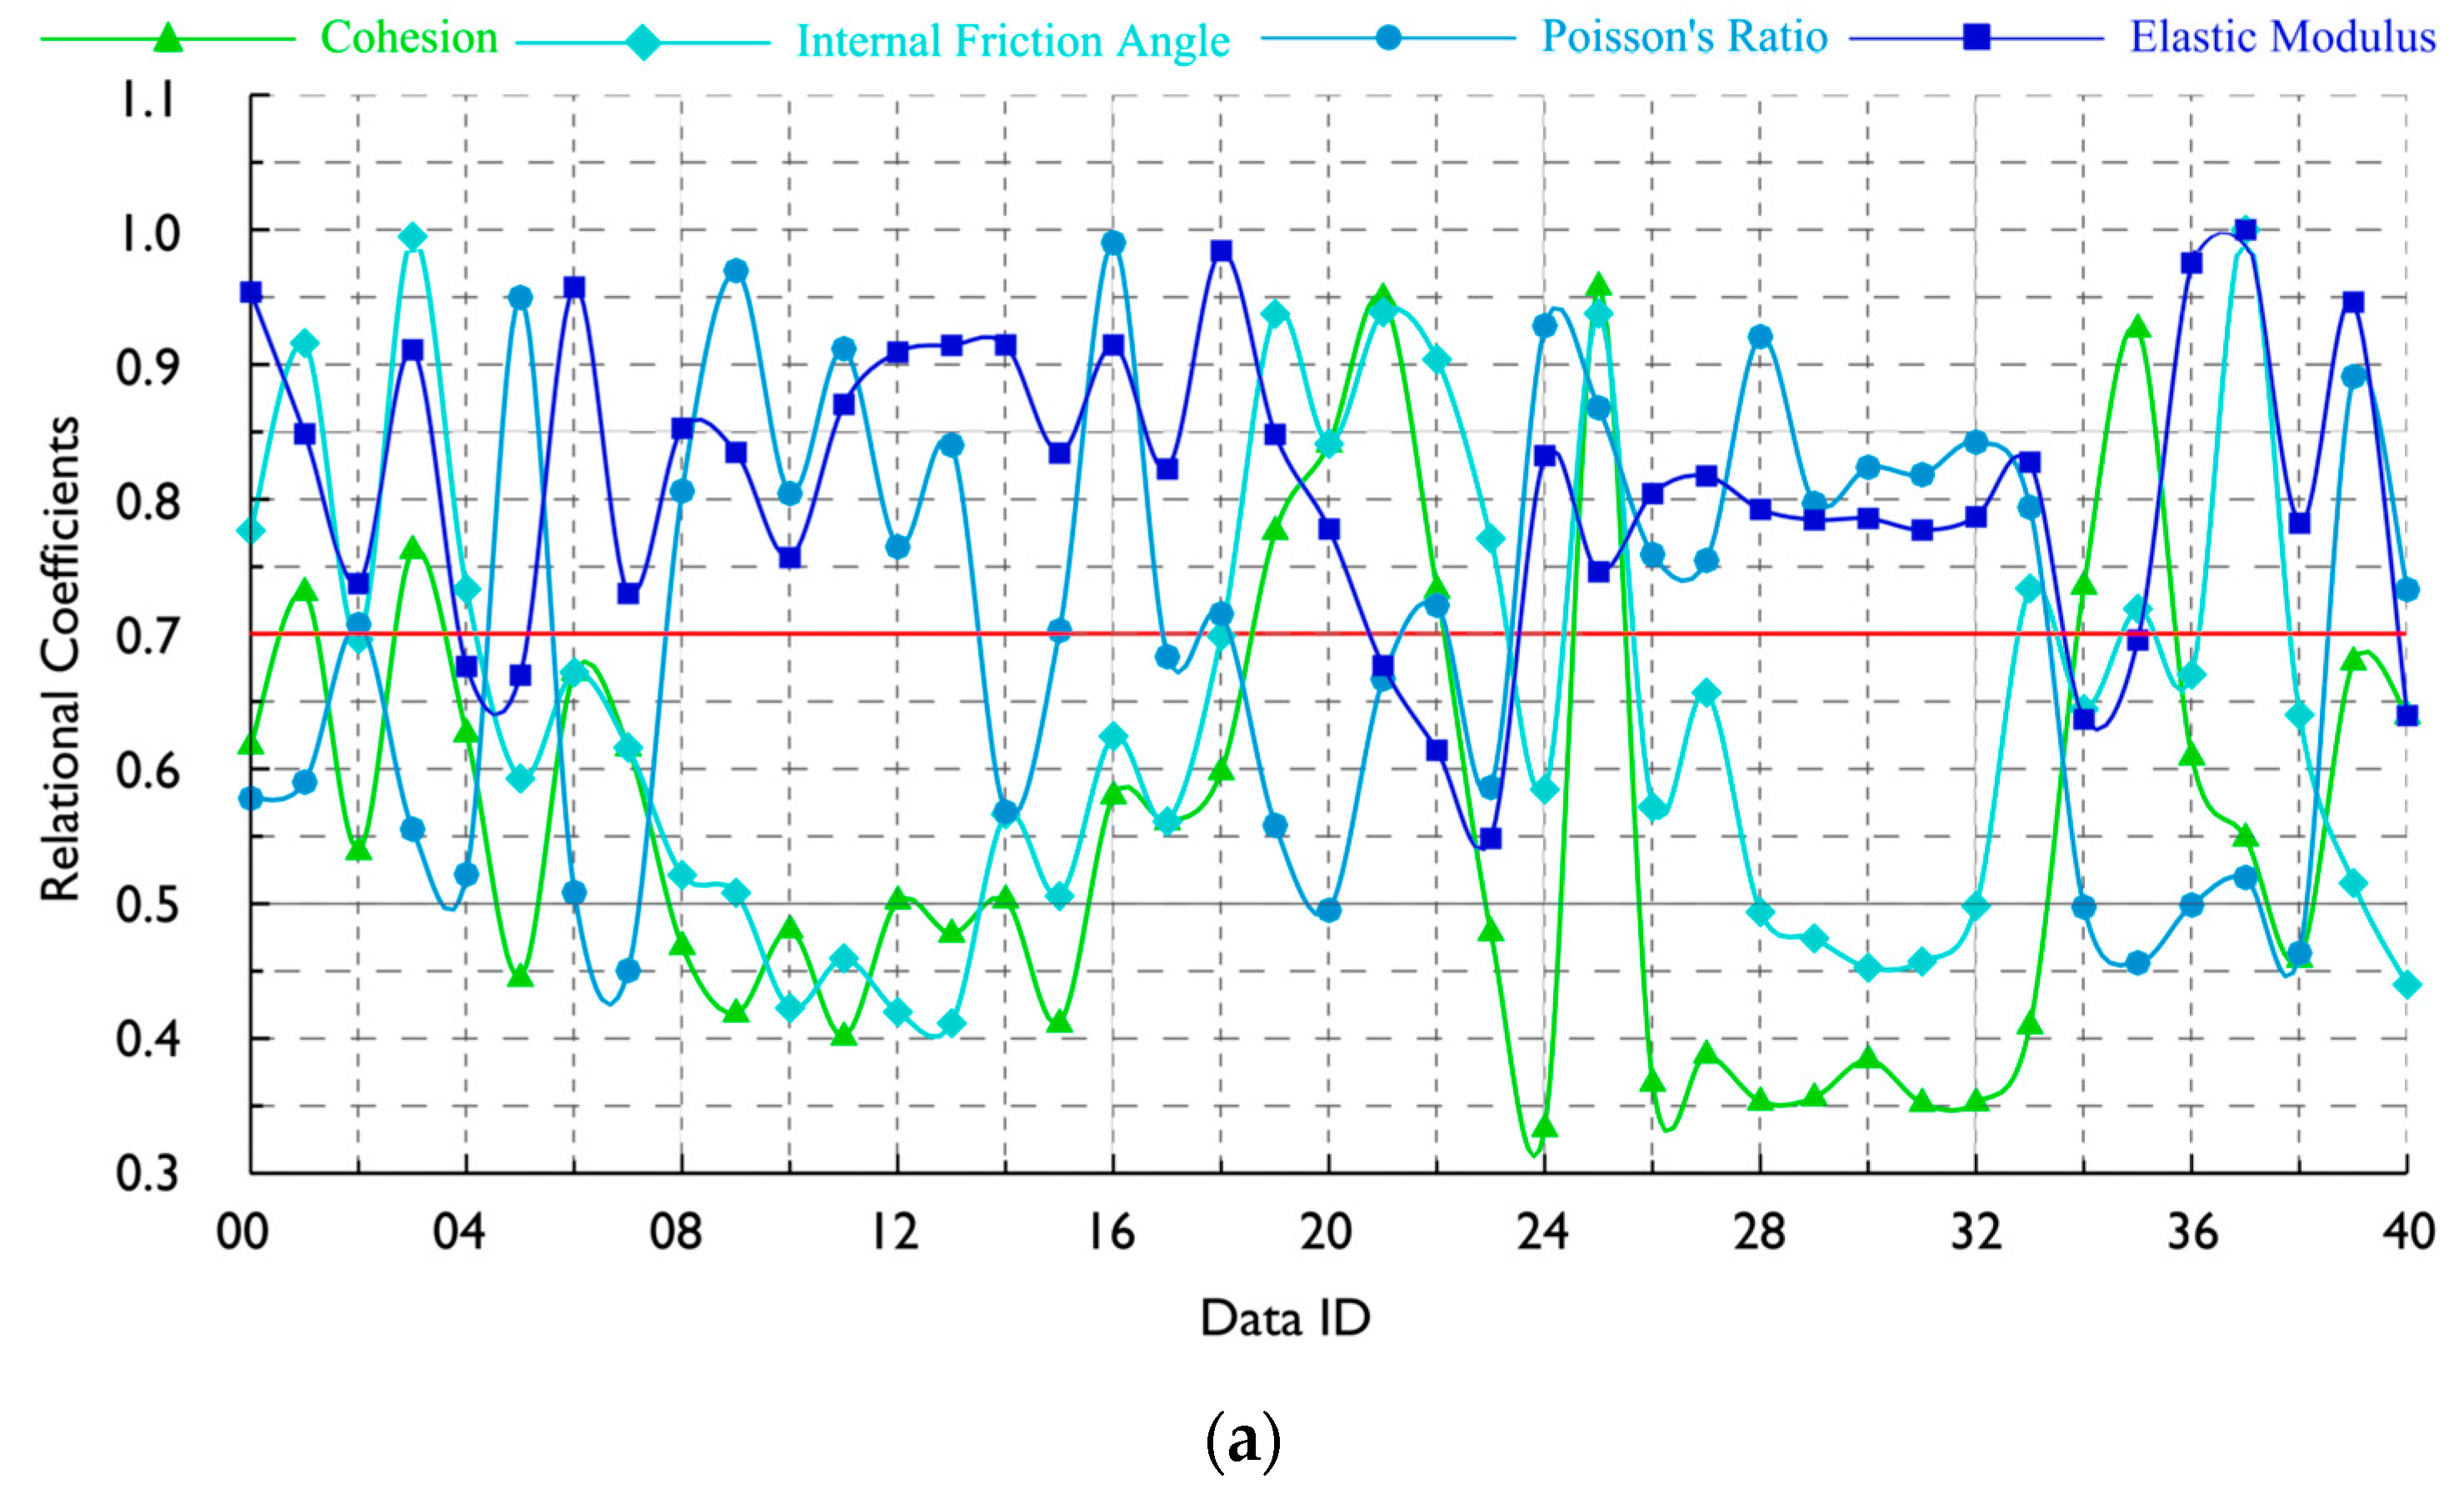
- Grey relational coefficients above 0.7 indicate significant correlations between certain parameters and surface settlement. Figure 4a shows that the relation of cohesion and internal friction angle with the surface settlement is relatively low within the Data ID range of 9–15 (corresponding to tunnelling rings 280–247). Similarly, in the interval of Data ID 34–38 (corresponding to tunnelling rings 65–41), the relation between Poisson’s ratio and surface settlement is also notably low, which corresponds to fractured zone areas. This indicates a weak correlation between stratum parameters (excluding elastic modulus) and surface settlement within the fractured zone region.
- Earth pressure exhibits the highest grey relational degree among the construction parameters. Combined with Table 4 and Table 5, in Data ID 38–34, which exhibits high relational coefficients, surface settlement decreases as earth pressure gradually increases, consistent with previous studies [18]. Notably, slightly different from other findings [20], the grey correlation degree of tunnelling speed does not reach a significant level. Tunnelling speed briefly demonstrates a strong relational coefficient only when maintained near its maximum value (Data ID 25–30, corresponding to tunnelling rings 183–116). Therefore, flexibly adjusting the tunnelling speed based on the coefficients during right-line tunnelling helped mitigate surface settlement.
- While the grouting parameters did not exhibit the highest relational degrees, they still held prominent positions [40]. Notably, grouting pressure contributes slightly more to surface settlement than grouting volume. In addition, as shown in Figure 4c, the relational coefficients between the two are higher in the fractured zone than in other intervals. Therefore, ensuring the stability of grouting pressure and controlling the grouting volume are both critical for achieving the optimal grouting effect.
4. Numerical Simulation
4.1. Simulation Setup
- The tunnel structure and surrounding rock were assumed uniform and isotropic, exhibiting typical elastoplastic behavior.
- The initial stress field was induced only by the self-weight of the surrounding rock, regardless of the potential influence of groundwater on the stress distribution.
- The deformation of the rock and soil zones follows the Mohr–Coulomb strength criterion. Throughout the simulation, no progressive damage, nonlinear bending behavior, or loading–unloading cyclic loading occurred. Therefore, the lining and grouting zones were assumed as elastic material, and the shield shell zone was treated as a rigid material.
- Normal constraints were set on the surroundings and bottom of the model to simulate actual constraints on the surrounding rocks. No constraints were applied on the top.
- A fixed time-step value was implemented in the simulation, ensuring that the parameters of the grouting layer within the simulation varied in sync with the time step (time).
- The simulation considered the standard gravitational acceleration (9.8 m/s2), and the convergence threshold of the computational iterations was set at 10−5 to maintain numerical simulation accuracy.
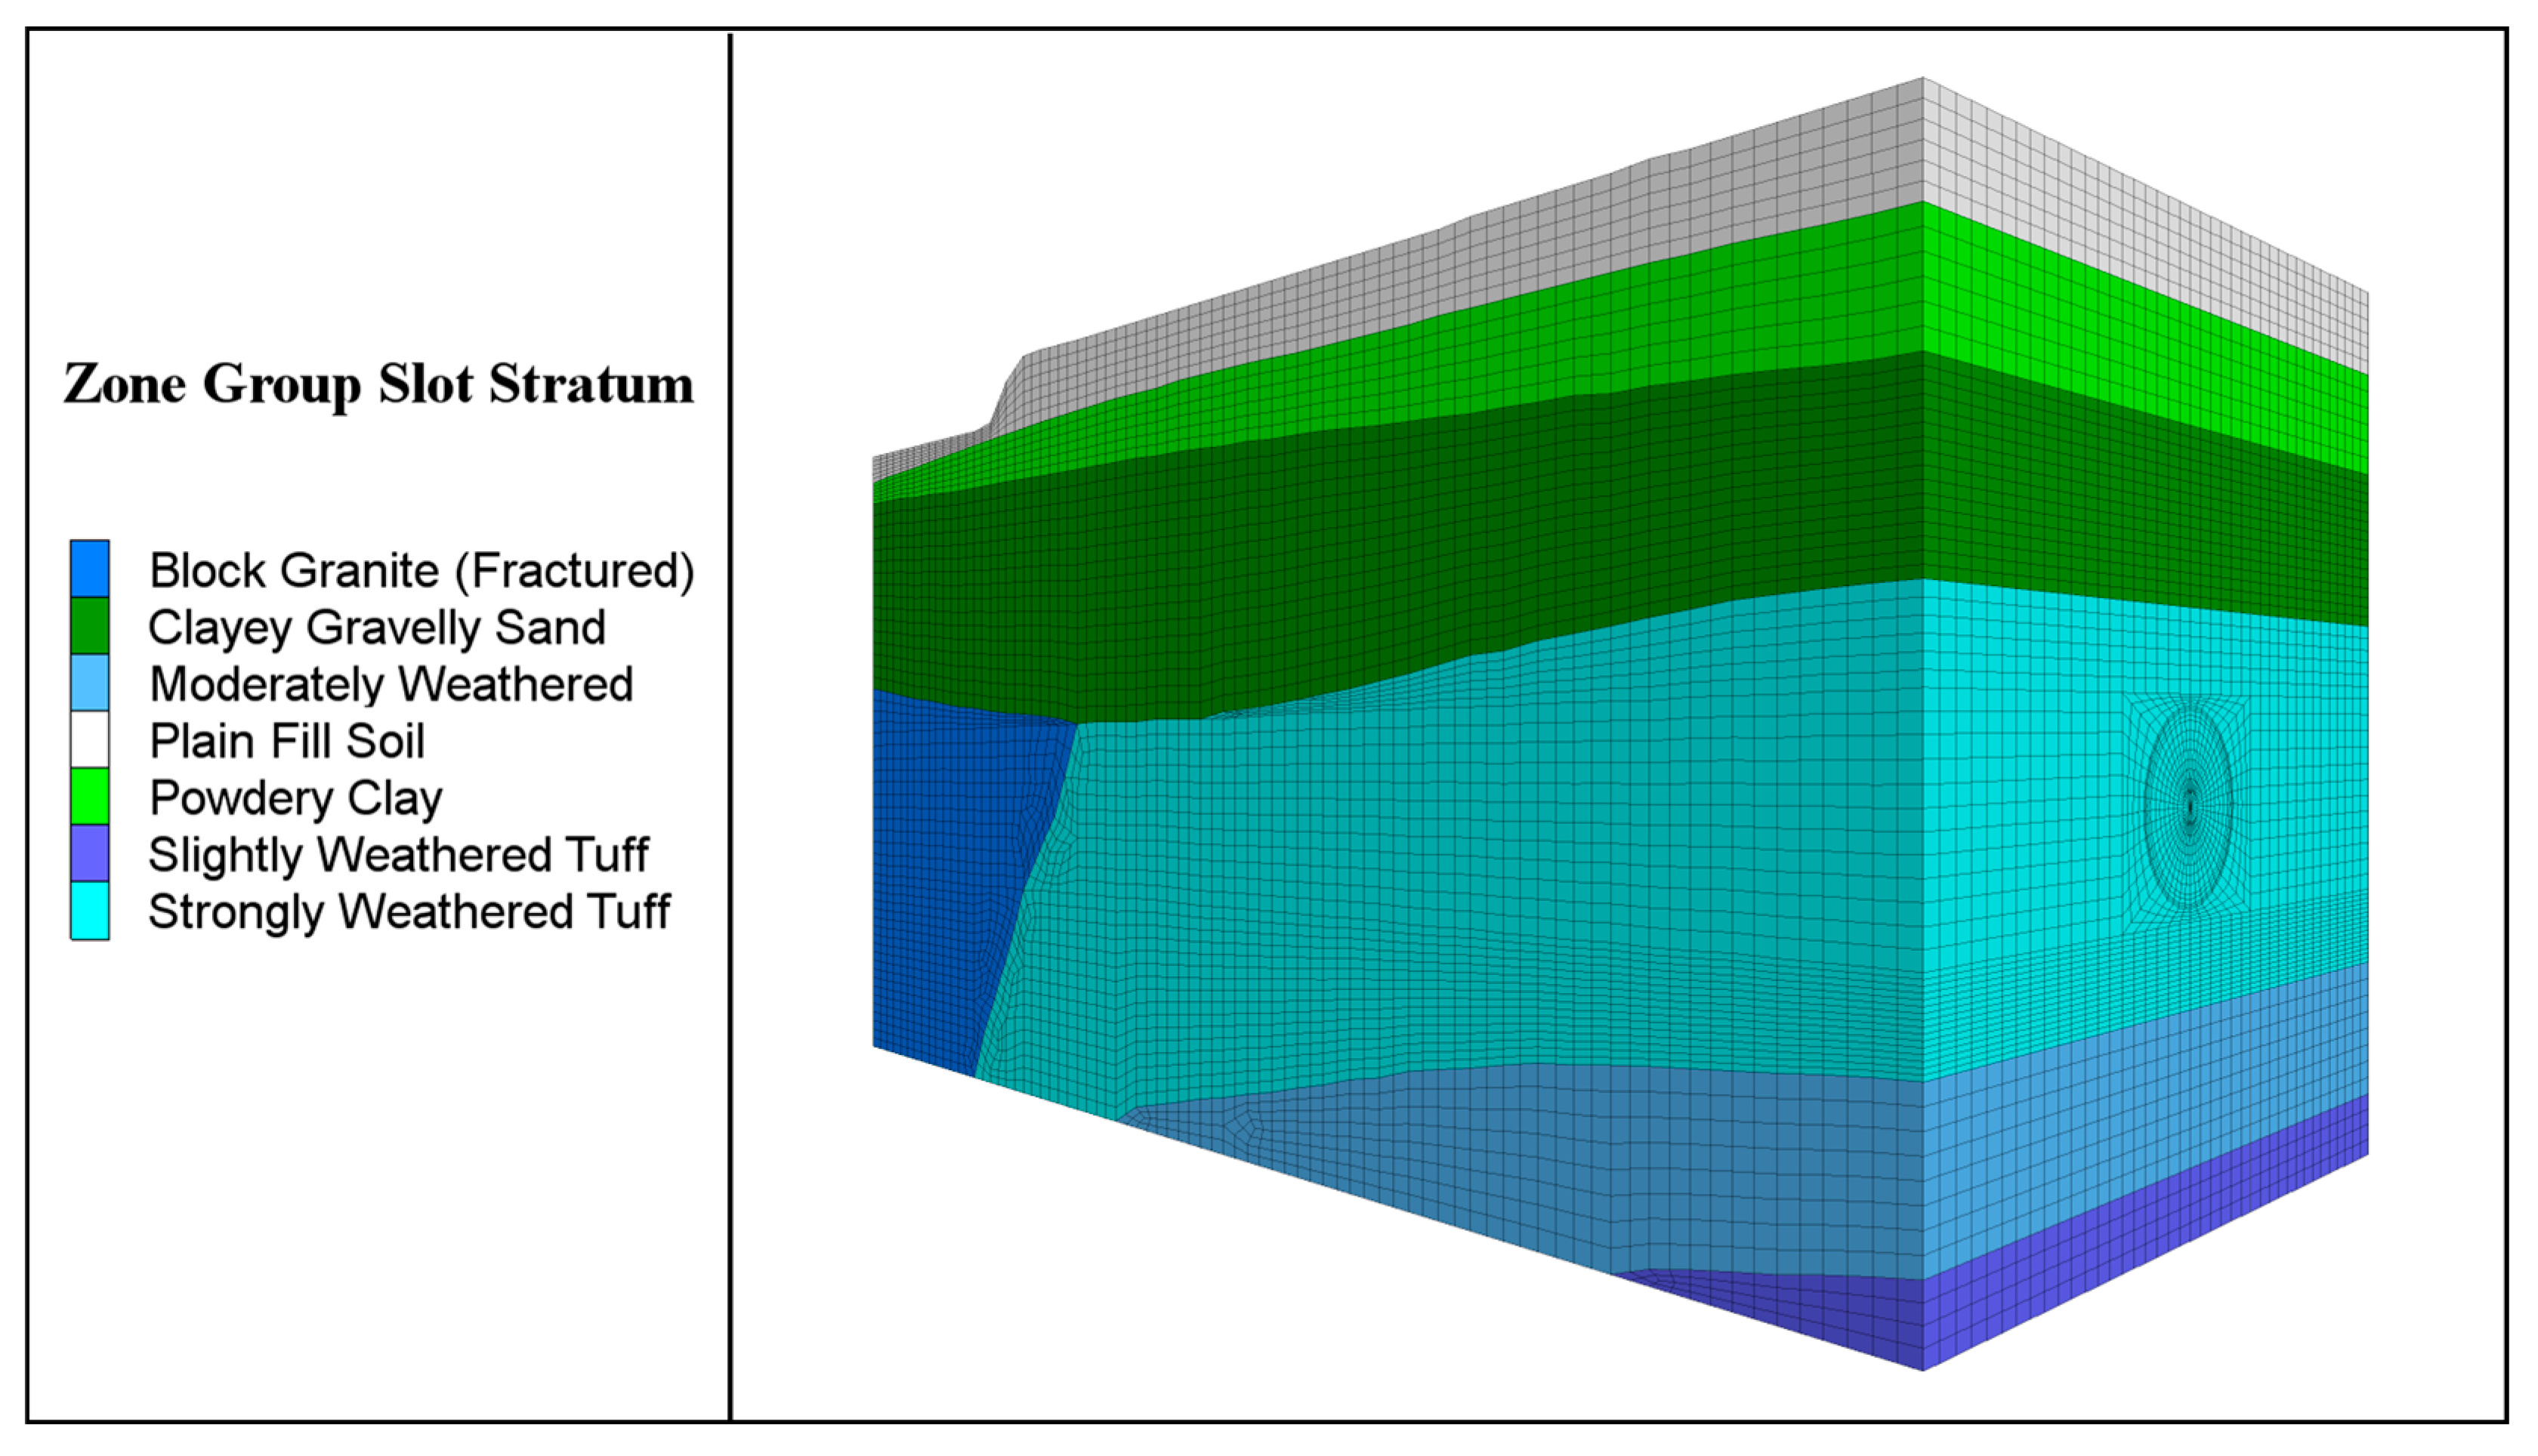
4.2. Simulation Modelling
4.3. Simulation Scheme
- The earth pressure ranges in stress from 20 to 138 kPa.
- The grouting pressure ranges in stress from 134 to 334 kPa.
- The thrust ranges in force from 6886 to 11,460 kN.
- The elastic modulus changes from 50% to 150% (compared with the exploration data).
- Initially, the shield shell zones of the shield machine were advanced by 1.5 m to simulate the initiation of a new shield tunnelling loop.
- Subsequently, the tunnel zones, segment zones, and grouting zones were removed to mimic the excavation process of shield construction.
- After the release of surrounding rock stresses, the earth pressure, the thrust, and the grouting pressure were applied to replicate the grouting process of shield construction.
- Following the grouting process, the grouting pressure was canceled, and material parameters were assigned to grouting and the segment zones to simulate the assembly process of shield construction.
- The parameters of the grouting zones were defined as a function of time, gradually transitioning from pre-solidification parameters to post-solidification parameters with each calculation step.
- The calculation was then allowed to converge, completing one cycle of excavation.
- Subsequently, the shield shell zones of the shield machine were advanced by another 1.5 m, initiating the next tunnelling cycle.
4.4. Model Validation and Analysis
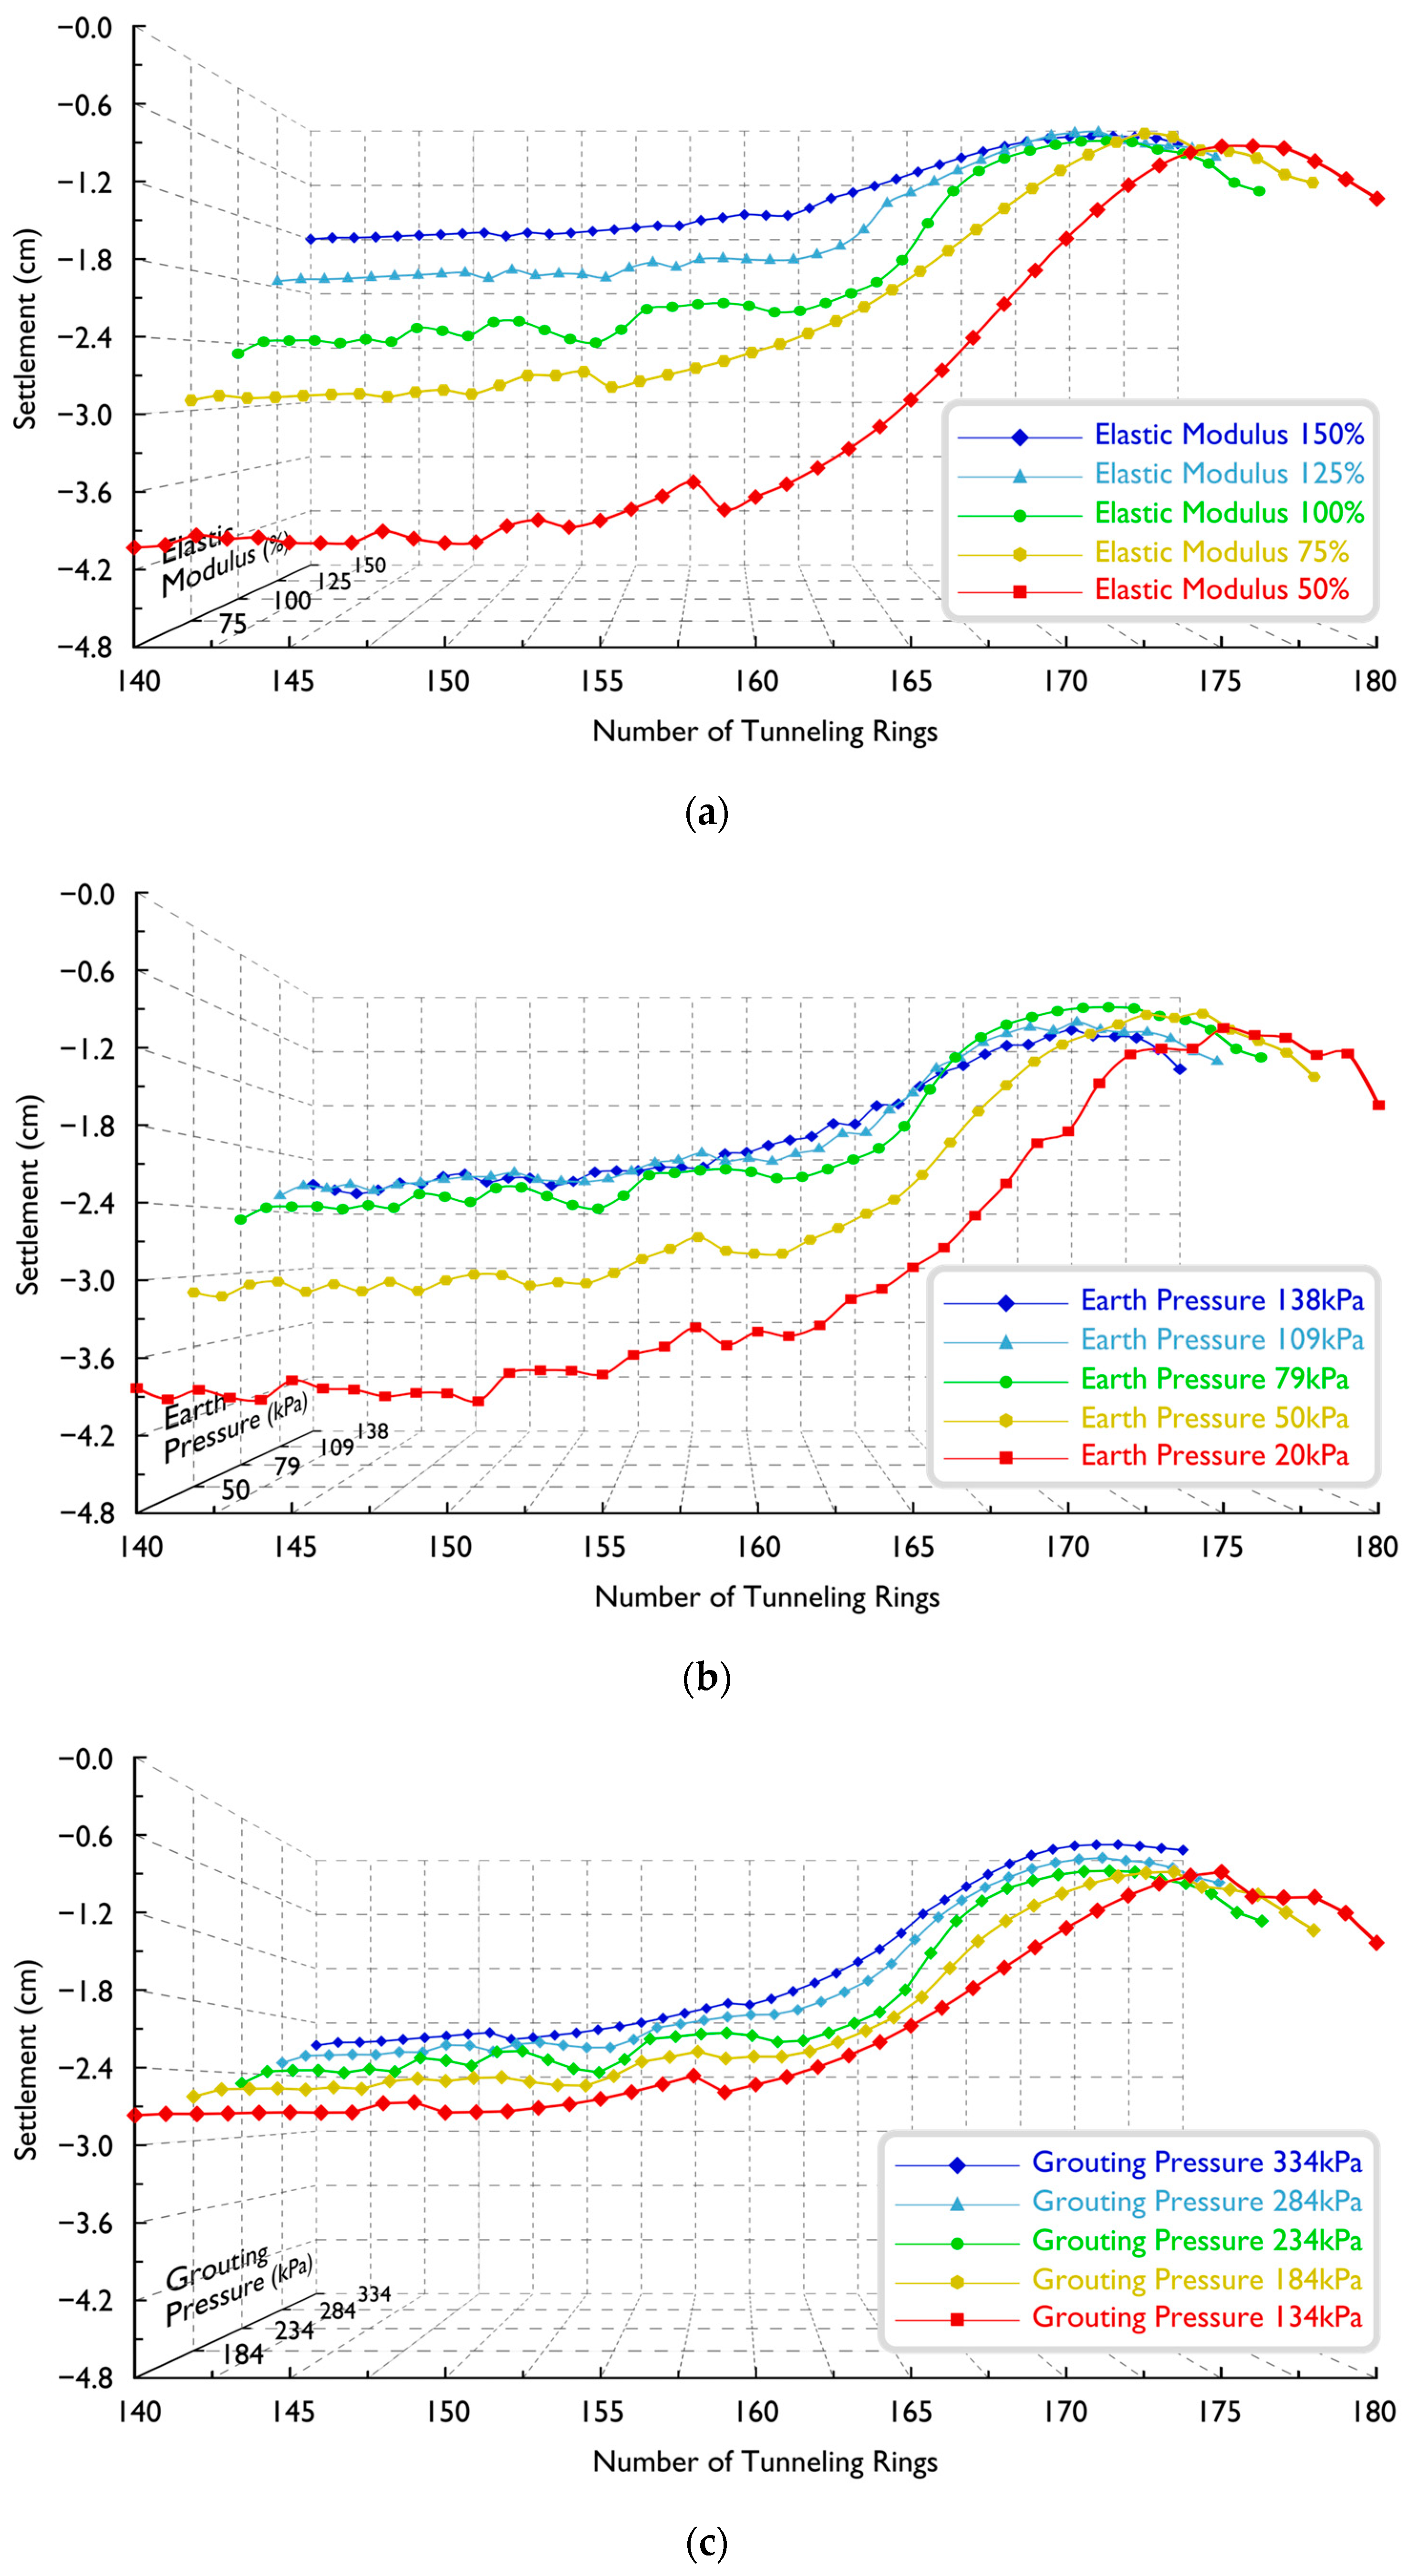
- Lateral settlement varies with strata zones, reaching up to 24.2 mm with a broad trough (approximately 20 m wide) in weak strata (140–170 rings). In more stable strata (170–180 rings), maximum surface settlement decreases to 2.1 mm with a narrower trough (about 12 m).
- Longitudinal settlement peaks at 24 mm in the 140–160 rings, with local minima at 140–145 and 152–155 rings. In stable strata, maximum surface settlement rapidly decreases from 24.2 mm to 10.3 mm.
4.5. Simulation of Influence Patterns
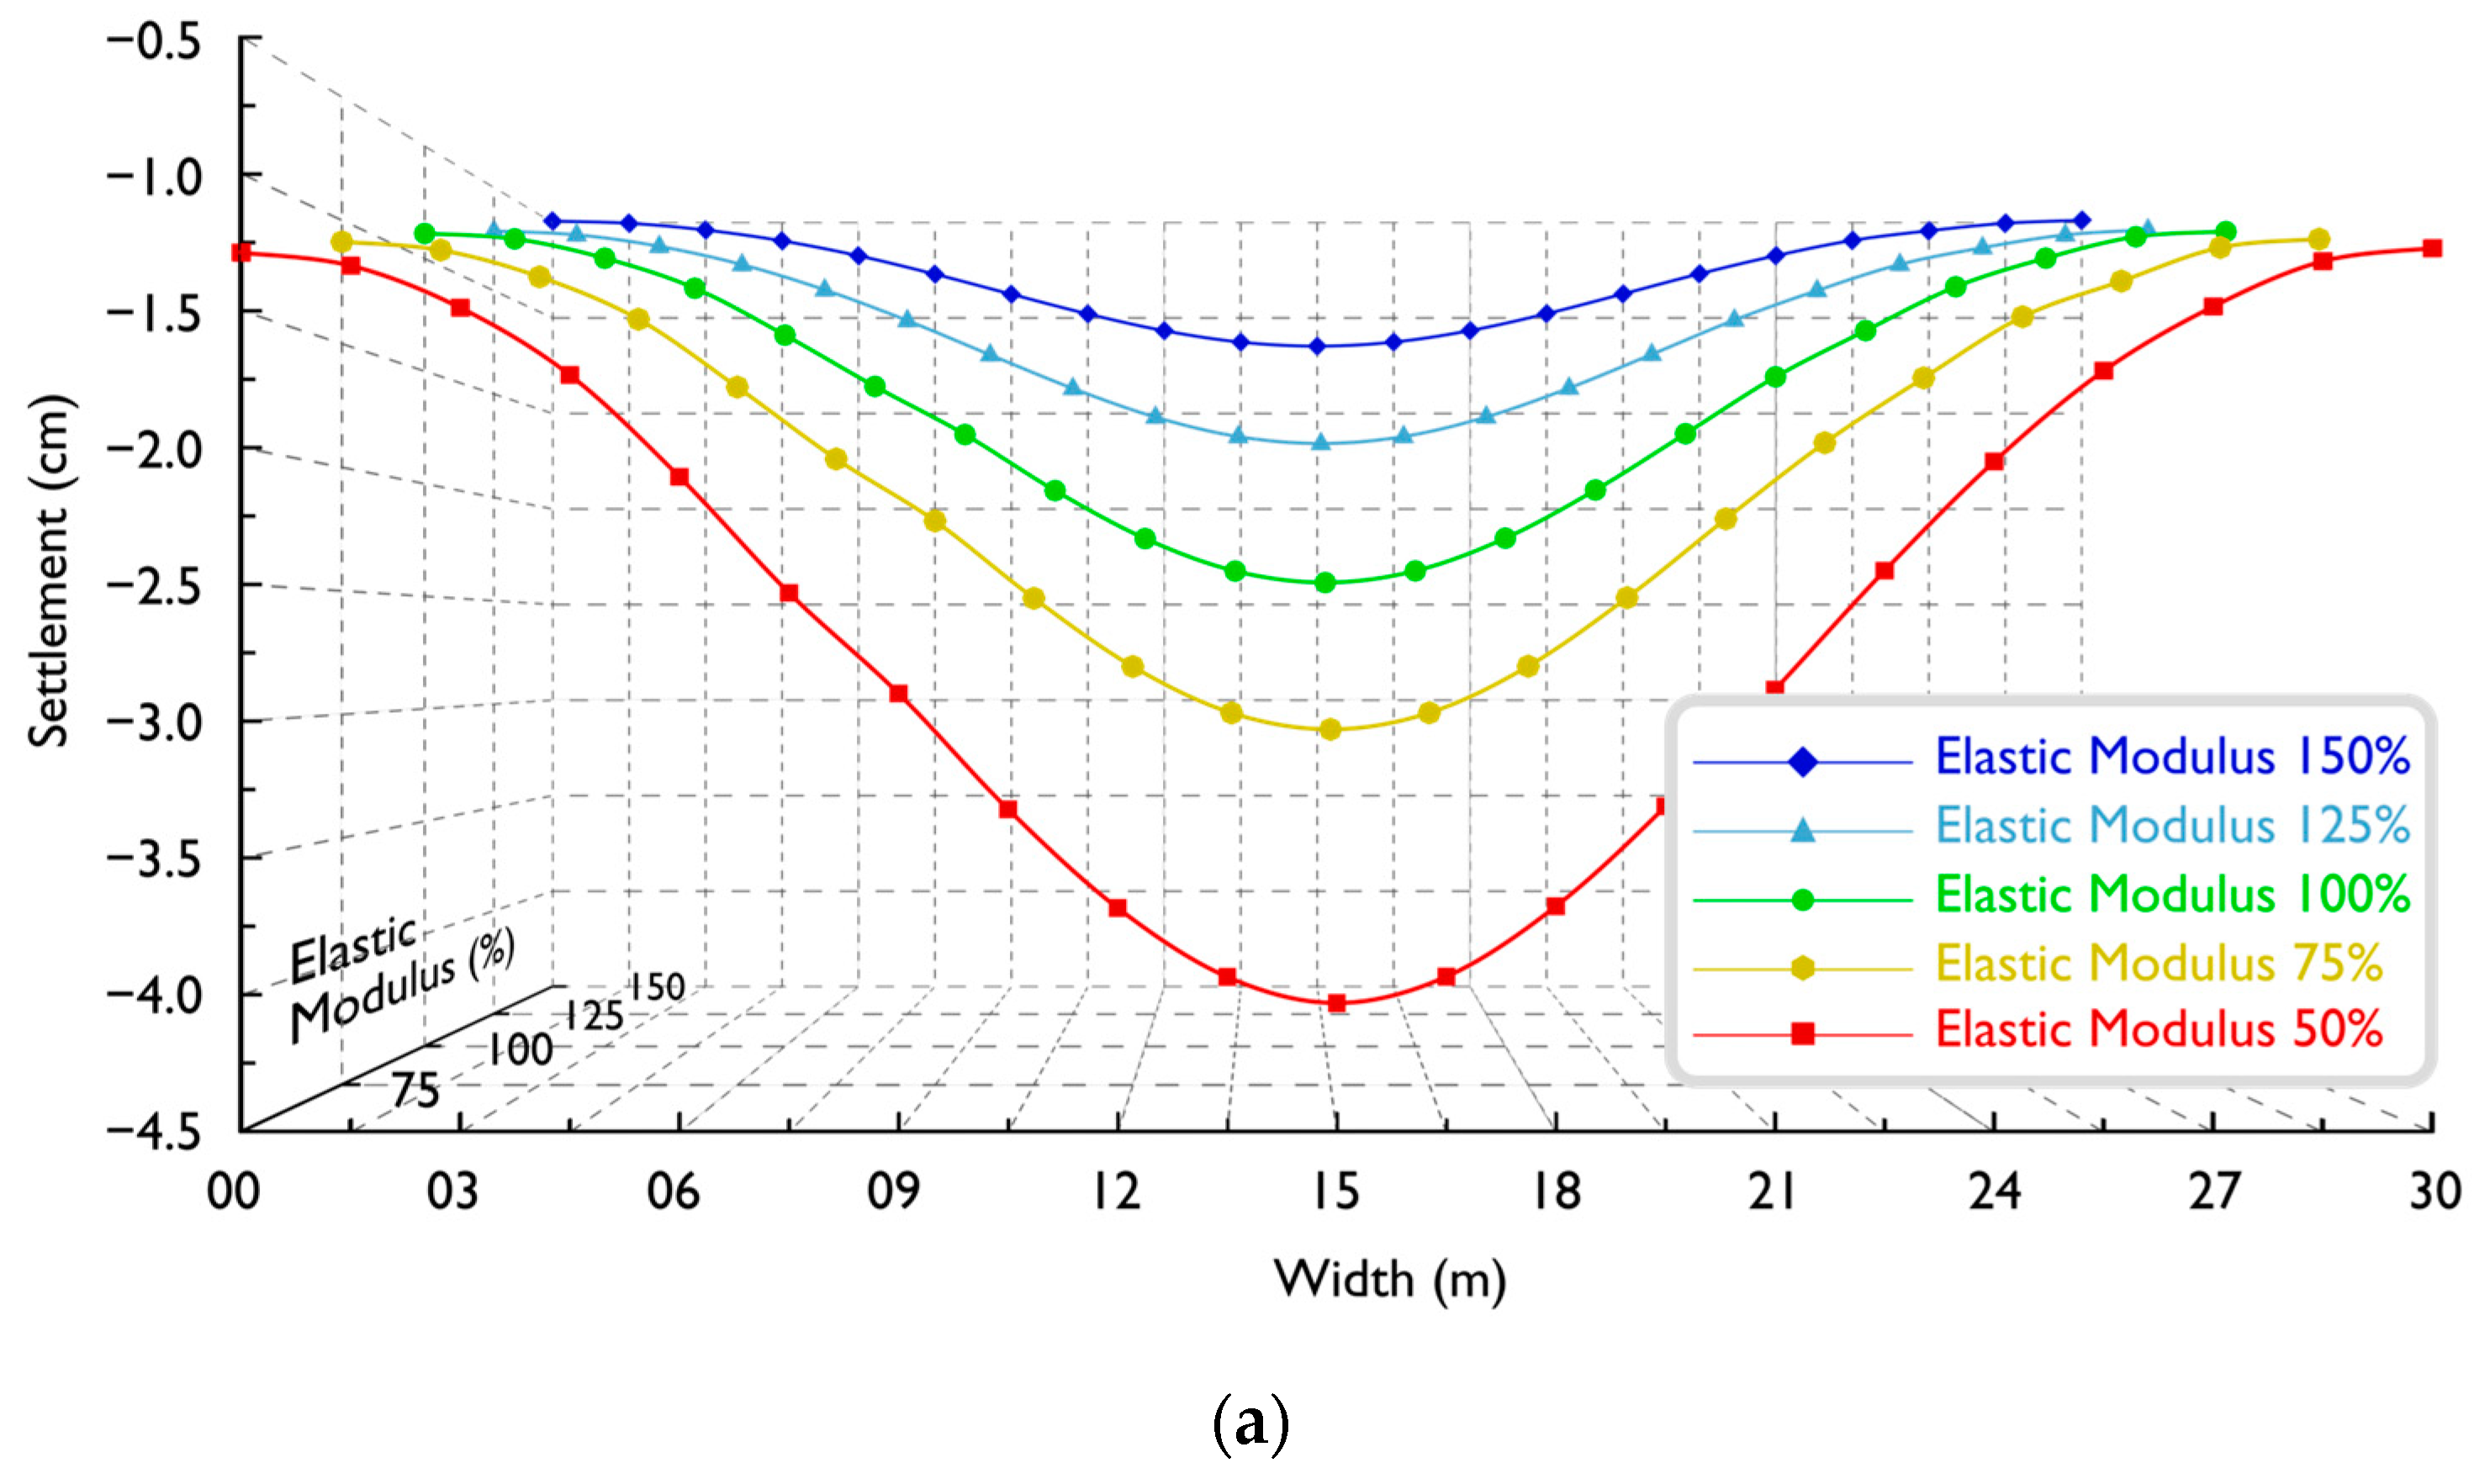
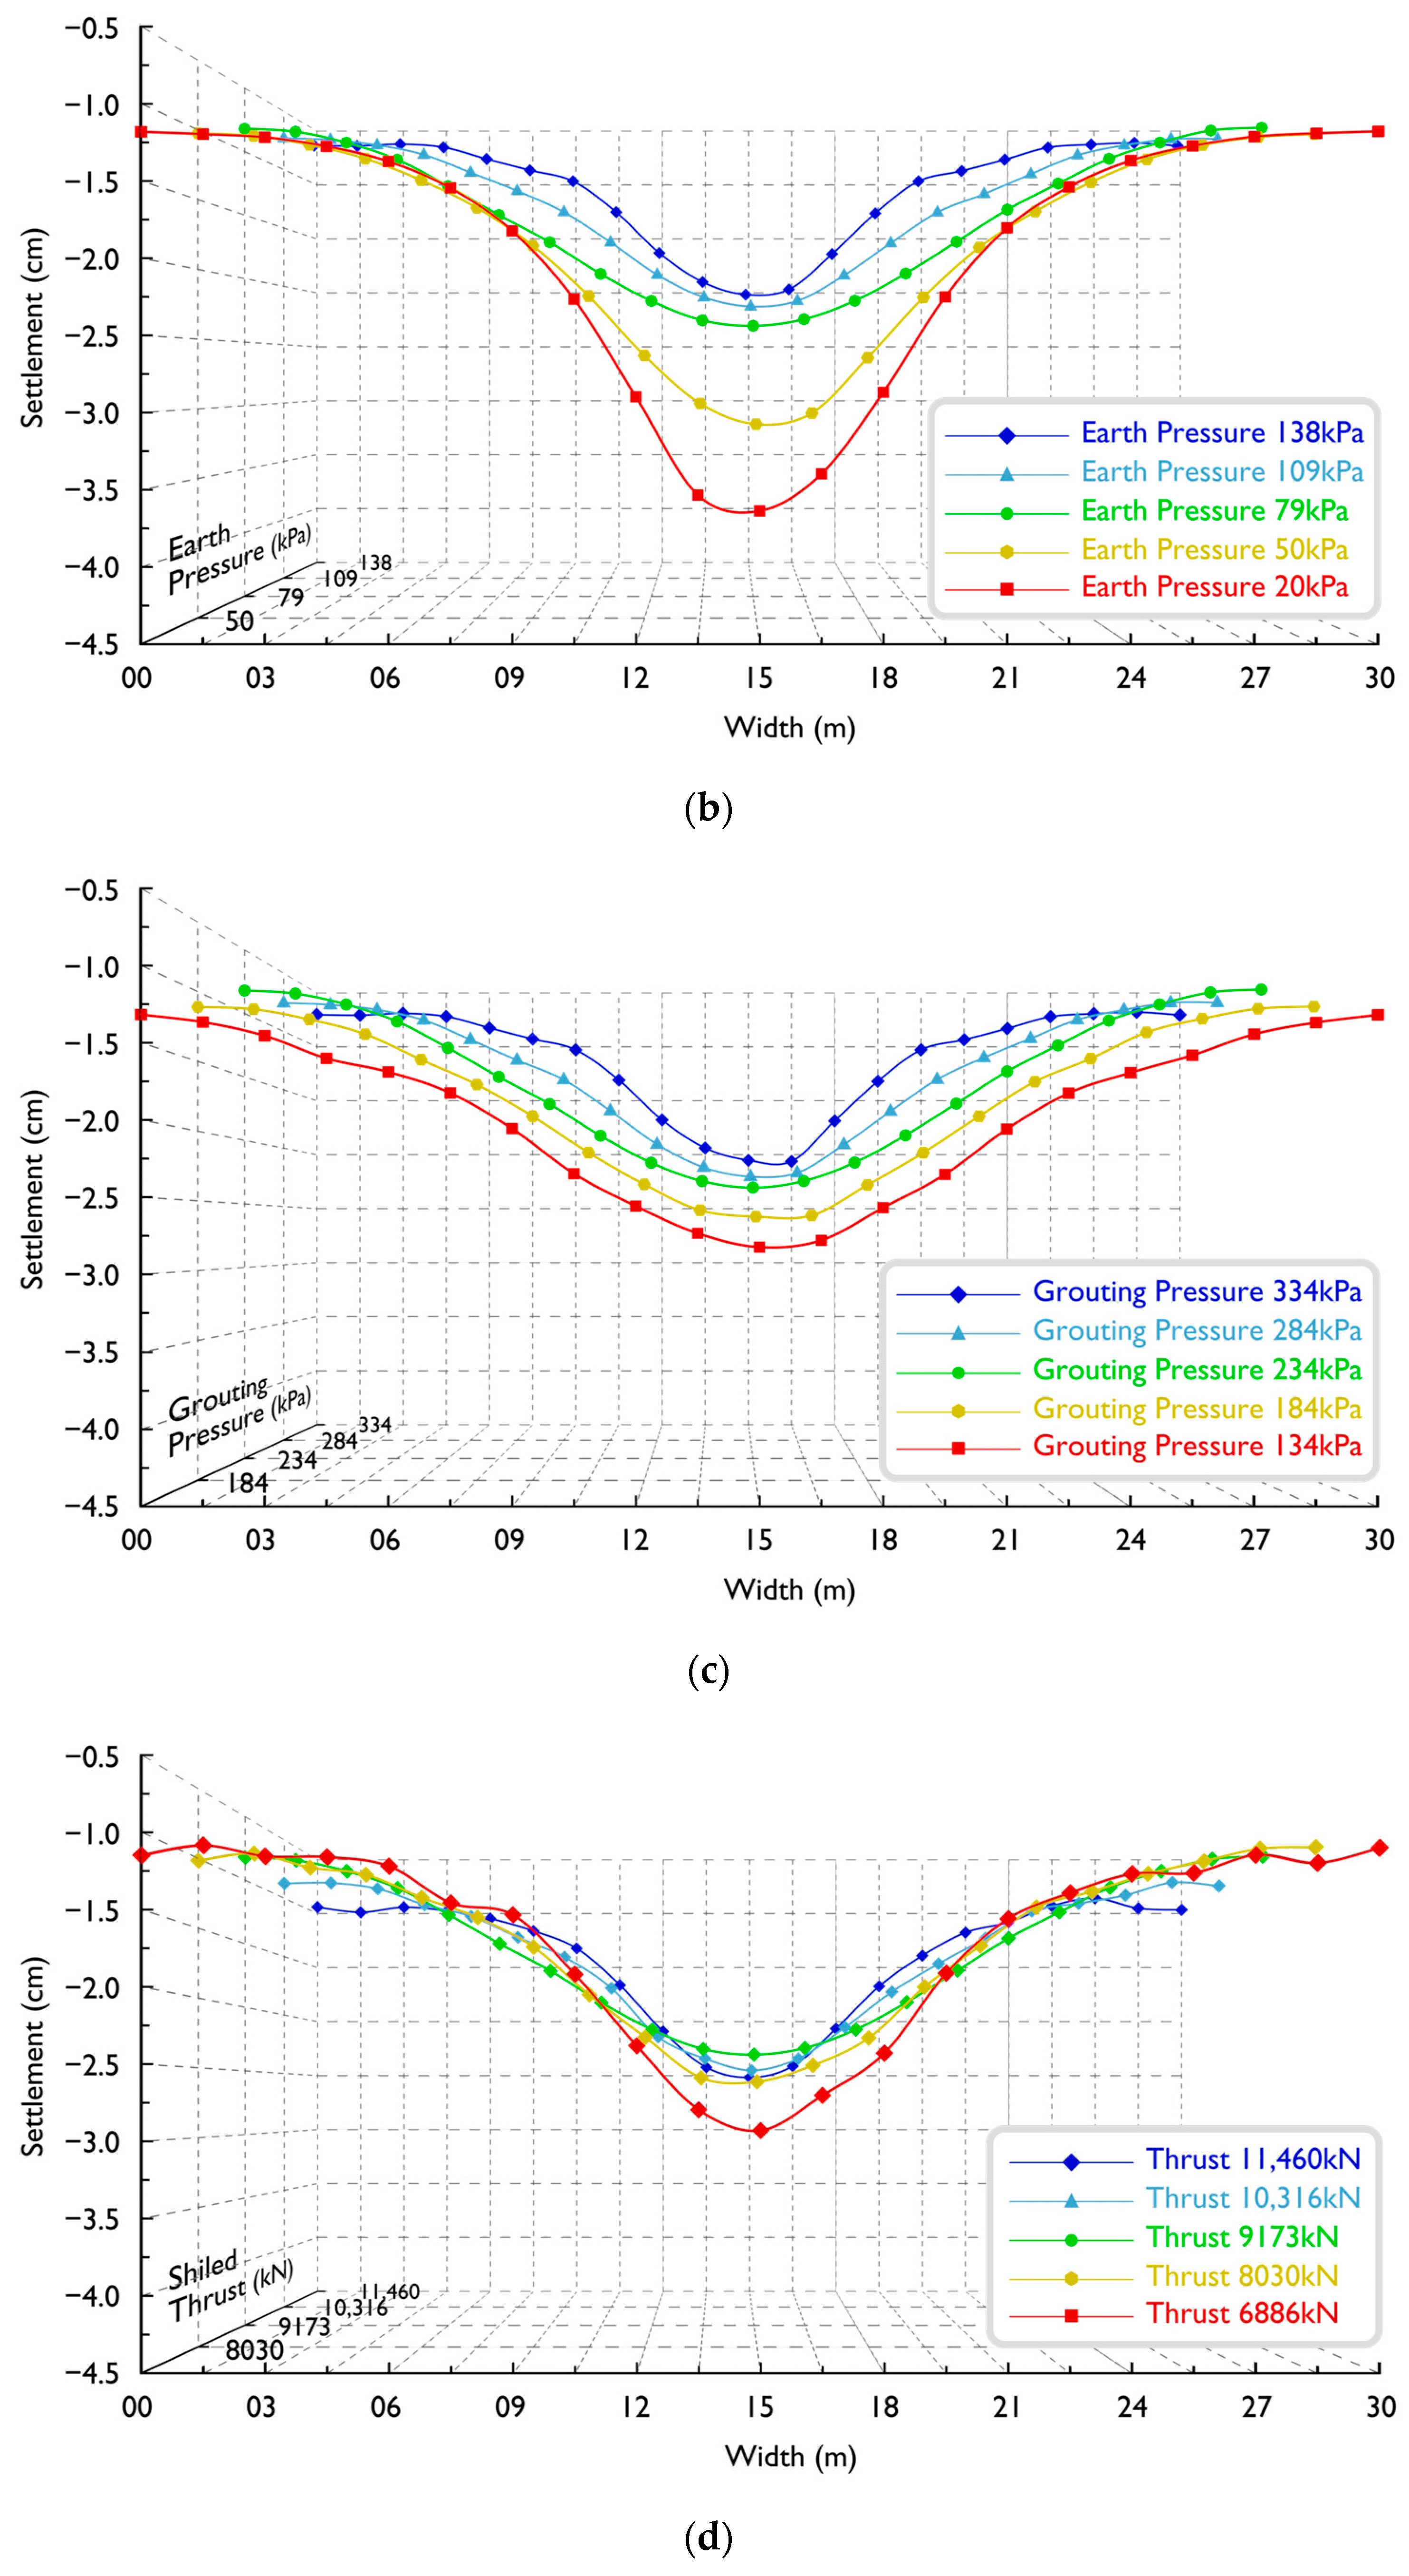
- Elastic modulus significantly impacts surface settlement, showing a nonlinear relationship (Figure 7a). Strata with smaller elastic modulus demonstrate increased sensitivity to shield tunnelling, resulting in larger settlement and wider troughs. In Figure 8a, reducing the elastic modulus from 150% to 50% leads to a 248% increase in maximum settlement (from 6.2 mm to 21.6 mm) in intervals with weak strata. Meanwhile, the impact on stable strata intervals is less than 50%. The actual settlement data across fractured zones (Table 3, Data ID 73–78) also coincide with this observation.
- Earth pressure’s influence on surface settlement parallels elastic modulus trends (Figure 7b and Figure 8b). In stable strata, it has a moderate impact, but in poorer geological conditions, reducing earth pressure from 138 kPa to 20 kPa increases maximum settlement from 8.6 mm to 18.3 mm, consistent with previous findings [41,42].
- As indicated in previous studies [18,36], the influence of grouting pressure on surface settlement is evident. Moreover, it greatly influences the settlement trough width in weak strata (Figure 7c). Increasing grouting pressure from 134 kPa to 334 kPa decreases the settlement trough from 10 m to 6 m. Somewhat differently from a previous study [40], no surface uplift occurs, likely due to reasonable grouting pressure within the soil’s bearing capacity.
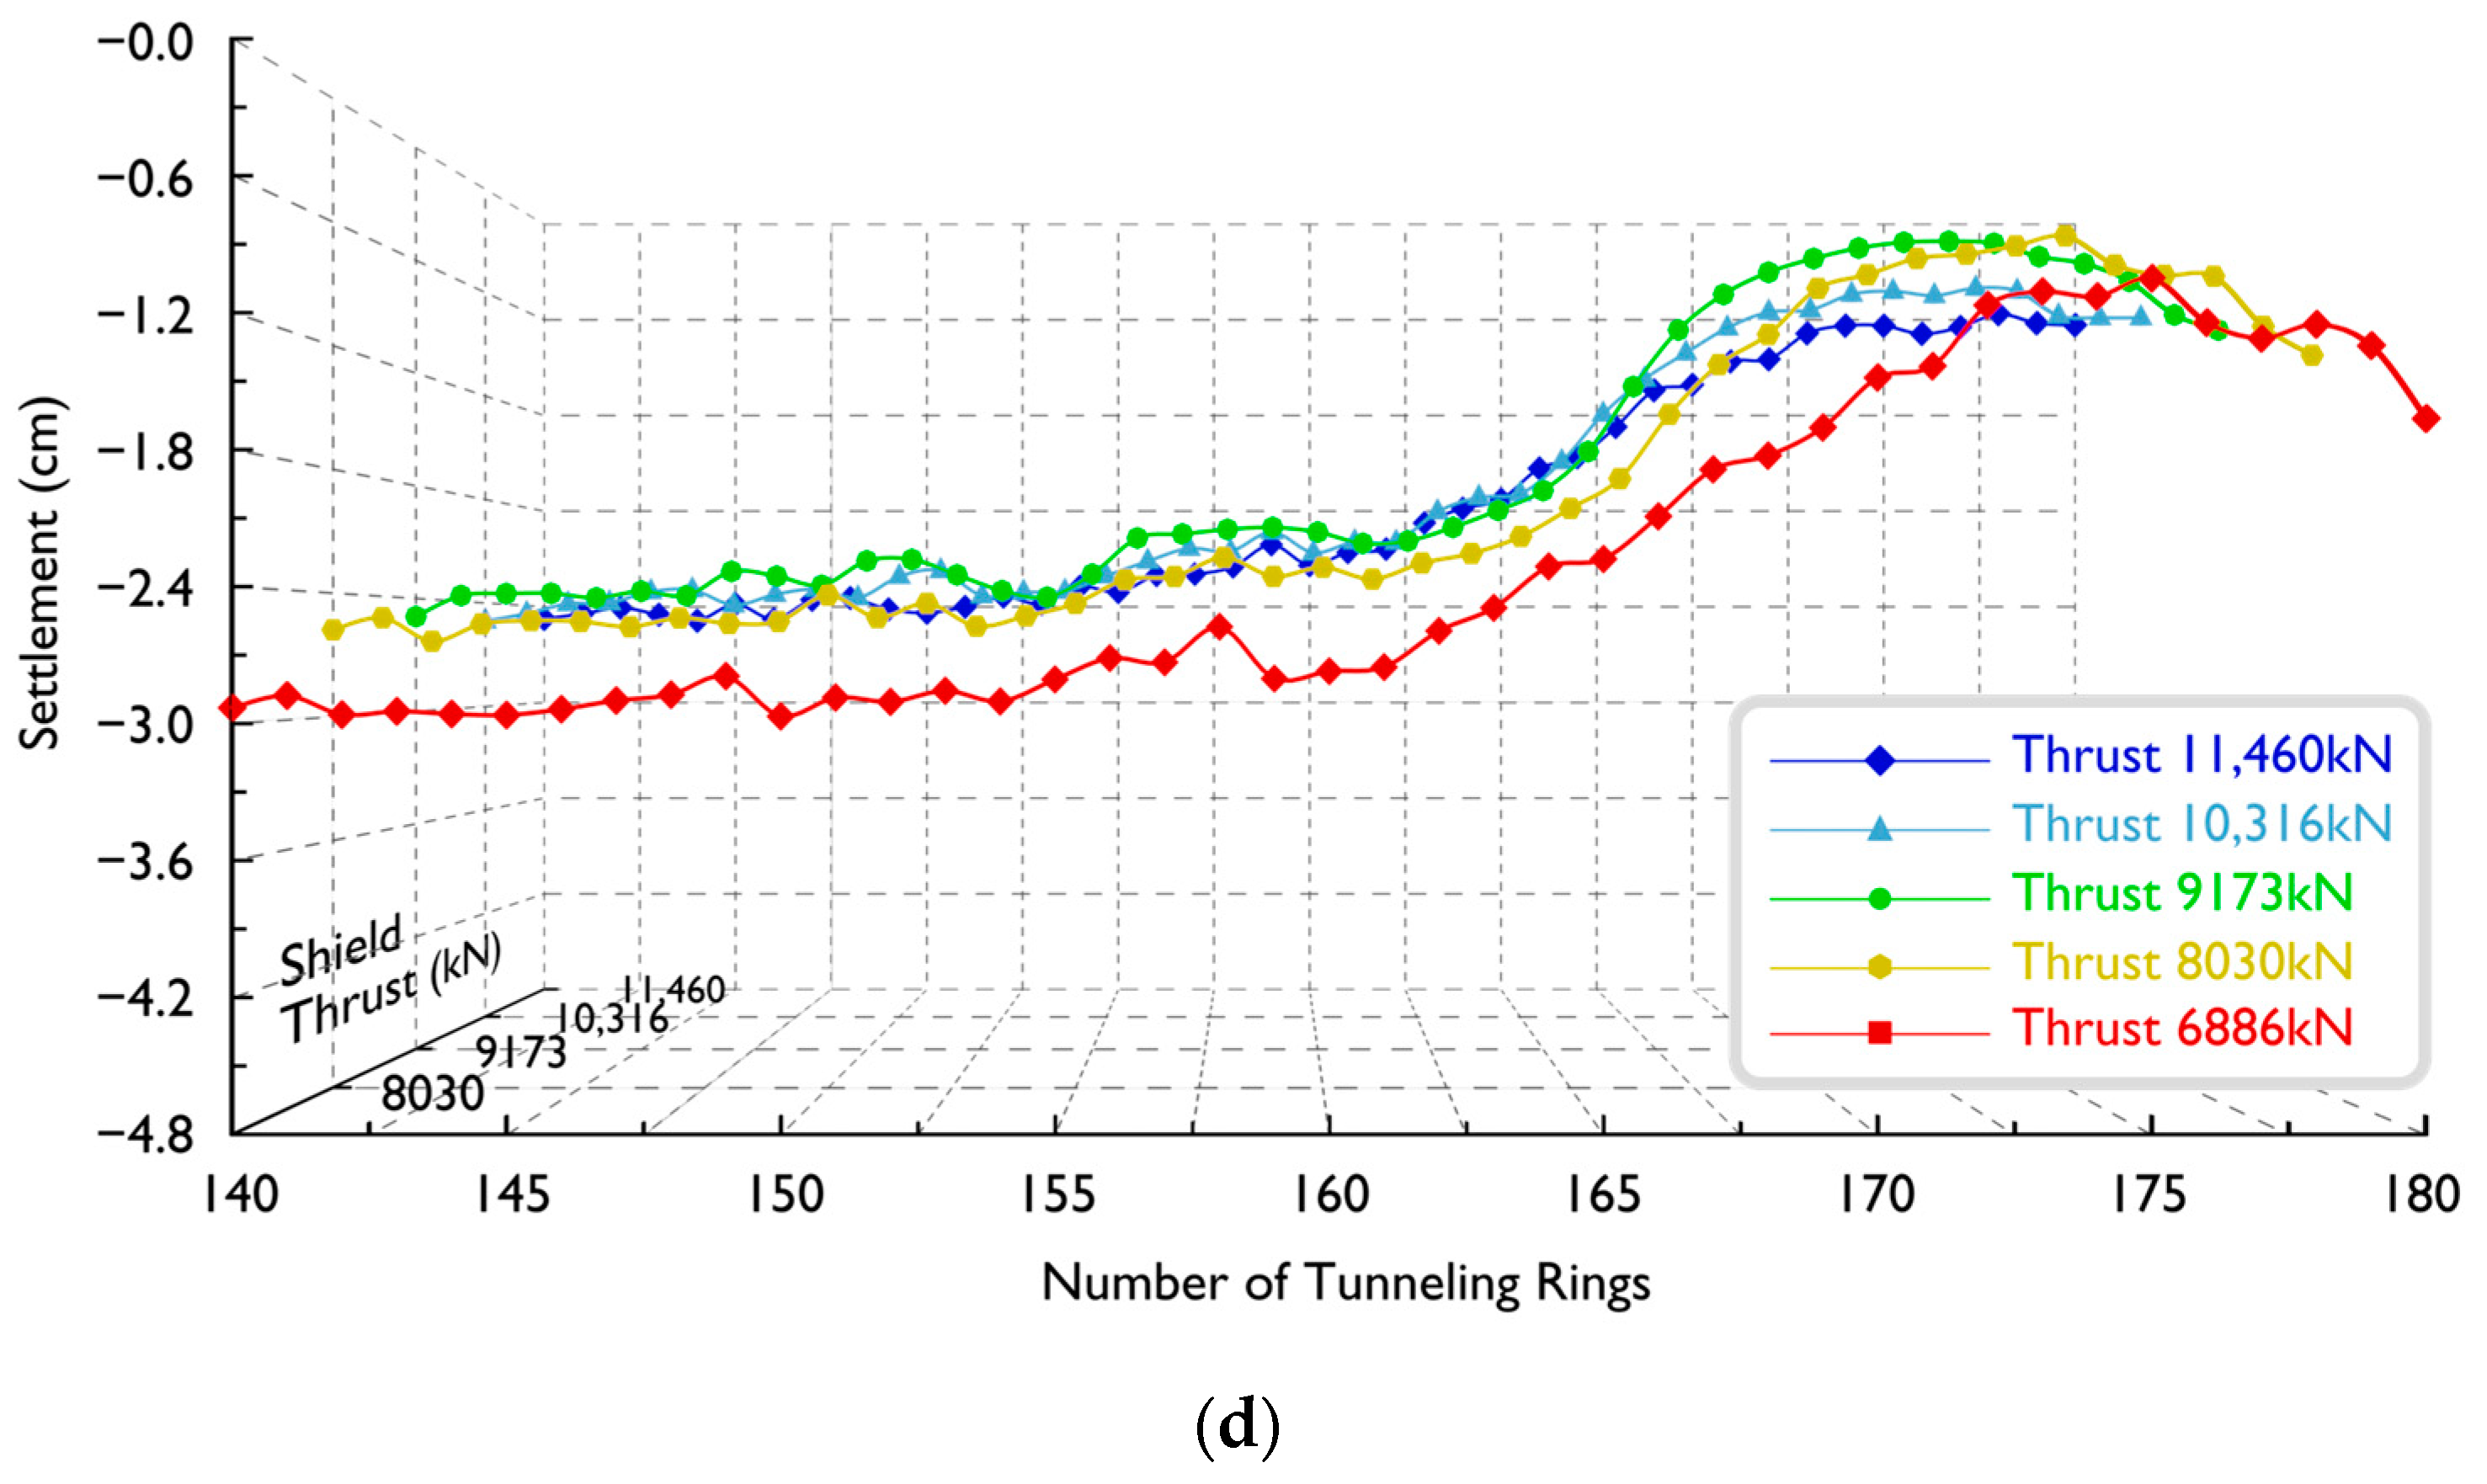
- Thrust magnitude directly affects the final surface settlement [33] (Figure 8d). Excessive thrust that is beyond the strata’s resistance during tunnelling leads to a significant surface settlement with surface uplift and subsequent sinking after shield tunnelling. Similarly, insufficient thrust results in incomplete compensation of strata displacement, leading to an increase in surface settlement.
5. Discussion
6. Conclusions
- Earth pressure emerges as the most influential tunnelling parameter, while tunnelling speed has minimal impact. Grouting pressure has a greater effect on surface settlement than grouting volume, and strata elastic modulus significantly influences settlement.
- Numerical simulations reveal that strata with lower elastic moduli are more sensitive to shield tunnelling, resulting in larger settlement. Earth pressure and grouting pressure show similar trends, with pronounced effects in weak strata.
- For stable strata, it is feasible to consider a judicious increment in tunnelling speed and employ compressed air pressure for excavation. Keeping grouting pressure between 250 and 300 kPa and adjusting thrust with initial earth pressure can mitigate settlement.
Author Contributions
Funding
Institutional Review Board Statement
Informed Consent Statement
Data Availability Statement
Acknowledgments
Conflicts of Interest
References
- Ji, M.; Wang, X.; Luo, M.; Wang, D.; Teng, H.; Du, M. Stability Analysis of Tunnel Surrounding Rock When TBM Passes through Fracture Zones with Different Deterioration Levels and Dip Angles. Sustainability 2023, 15, 5243. [Google Scholar] [CrossRef]
- Tian, Y.; Motalleb Qaytmas, A.; Lu, D.; Du, X. Stress Path of the Surrounding Soil during Tunnel Excavation: An Experimental Study. Transp. Geotech. 2023, 38, 100917. [Google Scholar] [CrossRef]
- Liu, C.; Yang, S.; Liu, W.; Wang, Z.; Jiang, Y.; Yang, Z.; Jiang, H. Three-Dimensional Numerical Simulation of Soil Deformation during Shield Tunnel Construction. Math. Probl. Eng. 2022, 2022, 5029165. [Google Scholar] [CrossRef]
- Peng, S.; Huang, W.; Luo, G.; Cao, H.; Pan, H.; Mo, N. Failure Mechanisms of Ground Collapse Caused by Shield Tunnelling in Water-Rich Composite Sandy Stratum: A Case Study. Eng. Fail. Anal. 2023, 146, 107100. [Google Scholar] [CrossRef]
- Seol, H.; Won, D.; Jang, J.; Kim, K.Y.; Yun, T.S. Ground Collapse in EPB Shield TBM Site: A Case Study of Railway Tunnels in the Deltaic Region near Nak-Dong River in Korea. Tunn. Undergr. Space Technol. 2022, 120, 104274. [Google Scholar] [CrossRef]
- Yao, Q.; Di, H.; Ji, C.; Zhou, S. Ground Collapse Caused by Shield Tunneling in Sandy Cobble Stratum and Its Control Measures. Bull. Eng. Geol. Environ. 2020, 79, 5599–5614. [Google Scholar] [CrossRef]
- Bayati, M.; Hamidi, J.K. A Case Study on TBM Tunnelling in Fault Zones and Lessons Learned from Ground Improvement. Tunn. Undergr. Space Technol. 2017, 63, 162–170. [Google Scholar] [CrossRef]
- Peck, B.B. Deep excavation and tunnelling in soft ground, State of the art volume. In Proceedings of the 7th ICSMFE, Mexico City, Mexico, 25–29 August 1969; pp. 225–290. Available online: https://www.issmge.org/publications/publication/deep-excavations-and-tunneling-in-soft-ground (accessed on 27 August 2023).
- Ren, Y.; Zhang, C.; Zhu, M.; Chen, R.; Wang, J. Significance and Formulation of Ground Loss in Tunneling-Induced Settlement Prediction: A Data-Driven Study. Acta Geotech. 2023, 18, 4941–4956. [Google Scholar] [CrossRef]
- Jin, H.; Yuan, D.; Jin, D.; Wu, J.; Wang, X.; Han, B.; Mao, J. Shield Kinematics and Its Influence on Ground Settlement in Ultra-Soft Soil: A Case Study in Suzhou. Can. Geotech. J. 2022, 59, 1887–1900. [Google Scholar] [CrossRef]
- Lou, P.; Li, Y.; Tang, X.; Lu, S.; Xiao, H.; Zhang, Z. Influence of Double-Line Large-Slope Shield Tunneling on Settlement of Ground Surface and Mechanical Properties of Surrounding Rock and Segment. Alex. Eng. J. 2023, 63, 645–659. [Google Scholar] [CrossRef]
- Sun, F.; Jin, Z.; Wang, C.; Gou, C.; Li, X.; Liu, C.; Yu, Z. Case Study on Tunnel Settlement Calculations during Construction Considering Shield Disturbance. KSCE J. Civ. Eng. 2023, 27, 2202–2216. [Google Scholar] [CrossRef]
- Ahn, C.-Y.; Park, D.; Moon, S.-W. Analysis of Surface Settlement Troughs Induced by Twin Shield Tunnels in Soil: A Case Study. Geomech. Eng. 2022, 30, 325–336. [Google Scholar] [CrossRef]
- Wang, F.; Du, X.; Li, P. Predictions of Ground Surface Settlement for Shield Tunnels in Sandy Cobble Stratum Based on Stochastic Medium Theory and Empirical Formulas. Undergr. Space 2023, 11, 189–203. [Google Scholar] [CrossRef]
- Sohaei, H.; Hajihassani, M.; Namazi, E.; Marto, A. Experimental Study of Surface Failure Induced by Tunnel Construction in Sand. Eng. Fail. Anal. 2020, 118, 104897. [Google Scholar] [CrossRef]
- Bel, J.; Branque, D.; Camus, T. Physical Modelling of EPB TBM in Dry Sand and Greenfield Conditions. Eur. J. Environ. Civ. Eng. 2023, 27, 3236–3259. [Google Scholar] [CrossRef]
- Berthoz, N.; Branque, D.; Wong, H.; Subrin, D. TBM Soft Ground Interaction: Experimental Study on a 1 g Reduced-Scale EPBS Model. Tunn. Undergr. Space Technol. 2018, 72, 189–209. [Google Scholar] [CrossRef]
- Kannangara, K.K.P.M.; Ding, Z.; Zhou, W.-H. Surface Settlements Induced by Twin Tunneling in Silty Sand. Undergr. Space 2022, 7, 58–75. [Google Scholar] [CrossRef]
- Ter-Martirosyan, A.Z.; Cherkesov, R.H.; Isaev, I.O.; Shishkina, V.V. Surface Settlement during Tunneling: Field Observation Analysis. Appl. Sci. 2022, 12, 9963. [Google Scholar] [CrossRef]
- Kim, D.; Pham, K.; Park, S.; Oh, J.Y.; Choi, H. Determination of Effective Parameters on Surface Settlement during Shield TBM. Geomech. Eng. 2020, 21, 153–164. [Google Scholar] [CrossRef]
- Wang, D.; He, M.; Tao, Z.; Guo, A.; Wang, X. Deformation-Softening Behaviors of High-Strength and High-Toughness Steels Used for Rock Bolts. J. Rock Mech. Geotech. Eng. 2022, 14, 1872–1884. [Google Scholar] [CrossRef]
- Wang, D.; He, M.; Jia, L.; Sun, X.; Xia, M.; Wang, X. Energy Absorption Characteristics of Novel High-Strength and High-Toughness Steels Used for Rock Support. J. Rock Mech. Geotech. Eng. 2023, 15, 1441–1456. [Google Scholar] [CrossRef]
- Chen, R.; Meng, F.; Ye, Y.; Liu, Y. Numerical Simulation of the Uplift Behavior of Shield Tunnel during Construction Stage. Soils Found. 2018, 58, 370–381. [Google Scholar] [CrossRef]
- Jia, J.; Gao, R.; Wang, D.; Li, J.; Song, Z.; Tan, J. Settlement Behaviours and Control Measures of Twin-Tube Curved Buildings-Crossing Shield Tunnel. Struct. Eng. Mech. 2022, 84, 699–706. [Google Scholar] [CrossRef]
- Jallow, A.; Ou, C.-Y.; Lim, A. Three-Dimensional Numerical Study of Long-Term Settlement Induced in Shield Tunneling. Tunn. Undergr. Space Technol. 2019, 88, 221–236. [Google Scholar] [CrossRef]
- Eskandari, F.; Goharrizi, K.G.; Hooti, A. The Impact of EPB Pressure on Surface Settlement and Face Displacement in Intersection of Triple Tunnels at Mashhad Metro. Geomech. Eng. 2018, 15, 769–774. [Google Scholar] [CrossRef]
- Miliziano, S.; De Lillis, A. Predicted and Observed Settlements Induced by the Mechanized Tunnel Excavation of Metro Line C near S. Giovanni Station in Rome. Tunn. Undergr. Space Technol. 2019, 86, 236–246. [Google Scholar] [CrossRef]
- Shahin, H.M.; Nakai, T.; Okuno, T. Numerical Study on 3D Effect and Practical Design in Shield Tunneling. Undergr. Space 2019, 4, 201–209. [Google Scholar] [CrossRef]
- Bahri, M.; Mascort-Albea, E.J.; Romero-Hernández, R.; Koopialipoor, M.; Soriano-Cuesta, C.; Jaramillo-Morilla, A. Numerical Model Validation for Detection of Surface Displacements over Twin Tunnels from Metro Line 1 in the Historical Area of Seville (Spain). Symmetry 2022, 14, 1263. [Google Scholar] [CrossRef]
- Anato, N.J.; Chen, J.; Tang, A.; Assogba, O.C. Numerical Investigation of Ground Settlements Induced by the Construction of Nanjing WeiSanLu Tunnel and Parametric Analysis. Arab. J. Sci. Eng. 2021, 46, 11223–11239. [Google Scholar] [CrossRef]
- Wang, Z.; Li, G.; Wang, A.; Pan, K. Numerical Simulation Study of Stratum Subsidence Induced by Sand Leakage in Tunnel Lining Based on Particle Flow Software. Geotech. Geol. Eng. 2020, 38, 3955–3965. [Google Scholar] [CrossRef]
- Alzabeebee, S.; Keawsawasvong, S. Numerical Assessment of Microtunnelling Induced Pavement Settlement. Geotech. Geol. Eng. 2023, 41, 2173–2184. [Google Scholar] [CrossRef]
- Yuan, C.; Zhang, M.; Ji, S.; Li, J.; Jin, L. Analysis of Factors Influencing Surface Settlement during Shield Construction of a Double-Line Tunnel in a Mudstone Area. Sci. Rep. 2022, 12, 22606. [Google Scholar] [CrossRef] [PubMed]
- Wang, Y.; Jiang, W.; Wang, M.; Li, Y. Risk Assessment and Implementation of Deformation Disaster for Operation Tunnel Based on Entropy Weight-Grey Relational Analysis. Geomat. Nat. Hazards Risk 2022, 13, 1831–1848. [Google Scholar] [CrossRef]
- Ma, J.; He, S.; Cui, G.; He, J.; Liu, X. Construction Stability and Reinforcement Technology for the Super-Large Rectangular Pipe-Jacking Tunnel Passing beneath the Operational High-Speed Railway in Composite Stratum. Geomat. Nat. Hazards Risk 2023, 14, 2208720. [Google Scholar] [CrossRef]
- Broere, W.; Festa, D. Correlation between the Kinematics of a Tunnel Boring Machine and the Observed Soil Displacements. Tunn. Undergr. Space Technol. 2017, 70, 125–147. [Google Scholar] [CrossRef]
- Goh, A.T.C.; Zhang, W.; Zhang, Y.; Xiao, Y.; Xiang, Y. Determination of Earth Pressure Balance Tunnel-Related Maximum Surface Settlement: A Multivariate Adaptive Regression Splines Approach. Bull. Eng. Geol. Env. 2018, 77, 489–500. [Google Scholar] [CrossRef]
- Shi, Y.-J.; Xiao, X.; Li, M.-G. Long-Term Longitudinal Deformation Characteristics of Metro Lines in Soft Soil Area. J. Aerosp. Eng. 2018, 31, 04018080. [Google Scholar] [CrossRef]
- Pan, Y.; Ou, S.; Zhang, L.; Zhang, W.; Wu, X.; Li, H. Modeling Risks in Dependent Systems: A Copula-Bayesian Approach. Reliab. Eng. Syst. Saf. 2019, 188, 416–431. [Google Scholar] [CrossRef]
- Moghtader, T.; Sharafati, A.; Naderpour, H.; Gharouni Nik, M. Estimating Maximum Surface Settlement Caused by EPB Shield Tunneling Utilizing an Intelligent Approach. Buildings 2023, 13, 1051. [Google Scholar] [CrossRef]
- Vinoth, M.; Aswathy, M.S. 3D Evolution of Soil Arching during Shield Tunnelling in Silty and Sandy Soils: A Comparative Study. Int. J. Numer. Anal. Methods Geomech. 2023, 47, 299–322. [Google Scholar] [CrossRef]
- Wang, J.; Feng, K.; Wang, Y.; Lin, G.; He, C. Soil Disturbance Induced by EPB Shield Tunnelling in Multilayered Ground with Soft Sand Lying on Hard Rock: A Model Test and DEM Study. Tunn. Undergr. Space Technol. 2022, 130, 104738. [Google Scholar] [CrossRef]


| Parameter | CR Equip. Machine 179 |
|---|---|
| Tunnel boring type | Earth pressure balance |
| Excavation diameter (mm) | 6303 |
| Shield diameter (mm) | 6250 |
| Cutterhead rotation speed (rpm) | 0~3.7 |
| Maximum thrust (kN) | 39,000 |
| Rated torque (kN/m) | 6000 |
| Unblocking torque (kN/m) | 7200 |
| Horizontal turning capability (m) | 250 |
| Maximum climbing capability (‰) | ±50 |
| Cutterhead opening ratio (%) | 34 |
| Stratum | Density (kg/m3) | Cohesion (kPa) | Internal Friction (°) | Elastic Modulus 1 (MPa) | Poisson’s Ratio |
|---|---|---|---|---|---|
| Plain fill soil | 1650 | 8 | 14 | 8 | 0.3 |
| Powdery clay | 1980 | 18 | 16 | 16 | 0.4 |
| Clayey gravelly sand | 2050 | 14 | 28 | 12 | 0.3 |
| Sandy tuff (fractured) | 2450 | 25 | 33 | 40 | 0.3 |
| Blocky granite (fractured) | 2500 | 48 | 35 | 100 | 0.3 |
| Slightly weathered tuff | 2610 | 710 | 45 | 1250 | 0.2 |
| Moderately weathered tuff | 2600 | 400 | 40 | 550 | 0.3 |
| Strongly weathered tuff | 2300 | 22 | 30 | 20 | 0.3 |
| Slightly weathered granite porphyry | 2680 | 530 | 45 | 1080 | 0.2 |
| Moderately weathered granite porphyry | 2600 | 300 | 40 | 400 | 0.3 |
| Strongly weathered granite porphyry | 2300 | 15 | 30 | 18 | 0.3 |
| Data ID | Settlement (cm) | Tunnelling Parameters | Grouting Parameters | Stratum Parameters | ||||||
|---|---|---|---|---|---|---|---|---|---|---|
| Thrust (kN) | Earth Pressure (kPa) | Tunnelling Speed (mm/min) | Grouting Pressure (kPa) | Grout Volume (m3) | Cohesion (kPa) | Internal Friction (°) | Poisson’s Ratio | Elastic Modulus (MPa) | ||
| 0 | −3.10 | 10,424 | 83 | 15 | 272 | 3.4 | 237 | 39.7 | 0.23 | 471 |
| 1 | −2.34 | 9817 | 94 | 33 | 244 | 3.1 | 180 | 37.6 | 0.22 | 477 |
| 2 | −4.29 | 7656 | 69 | 26 | 207 | 3.1 | 237 | 38.9 | 0.21 | 518 |
| 3 | −1.54 | 11,460 | 121 | 13 | 298 | 5.0 | 223 | 39.9 | 0.22 | 542 |
| 4 | −0.61 | 10,138 | 113 | 15 | 244 | 4.8 | 164 | 38.2 | 0.22 | 489 |
| 5 | −6.27 | 10,438 | 18 | 12 | 260 | 3.8 | 213 | 37.6 | 0.21 | 448 |
| 6 | −2.44 | 9855 | 90 | 16 | 223 | 3.2 | 230 | 42.9 | 0.20 | 533 |
| 7 | −3.12 | 9440 | 81 | 12 | 300 | 3.8 | 237 | 42.9 | 0.20 | 585 |
| 8 | −5.70 | 6886 | 17 | 22 | 194 | 5.3 | 172 | 40.9 | 0.21 | 391 |
| 9 | −7.09 | 7441 | 37 | 33 | 185 | 5.7 | 145 | 38.7 | 0.21 | 323 |
| 10 | −9.28 | 7791 | 21 | 20 | 203 | 5.6 | 160 | 38.4 | 0.20 | 238 |
| 11 | −9.90 | 7419 | 21 | 13 | 203 | 5.3 | 191 | 35.4 | 0.20 | 158 |
| 12 | −8.79 | 7965 | 69 | 37 | 214 | 5.9 | 161 | 39.5 | 0.21 | 150 |
| 13 | −8.71 | 9489 | 82 | 15 | 220 | 5.6 | 175 | 40.1 | 0.21 | 207 |
| 14 | −7.53 | 7045 | 73 | 28 | 188 | 5.9 | 77 | 35.9 | 0.26 | 220 |
| 15 | −7.56 | 7645 | 82 | 29 | 270 | 5.8 | 137 | 37.9 | 0.24 | 298 |
| 16 | −4.50 | 8921 | 76 | 27 | 334 | 5.3 | 142 | 40.1 | 0.23 | 383 |
| 17 | −3.92 | 7809 | 62 | 27 | 223 | 5.0 | 225 | 42.9 | 0.21 | 499 |
| 18 | −3.36 | 9379 | 54 | 39 | 190 | 5.2 | 198 | 40.6 | 0.22 | 475 |
| 19 | −1.61 | 9723 | 108 | 14 | 295 | 6.1 | 199 | 40.4 | 0.22 | 516 |
| 20 | −0.92 | 10,344 | 118 | 32 | 277 | 6.1 | 237 | 42.9 | 0.22 | 524 |
| 21 | −1.61 | 10,074 | 66 | 24 | 232 | 5.4 | 177 | 40.4 | 0.23 | 435 |
| 22 | −1.34 | 10,217 | 112 | 27 | 232 | 4.4 | 155 | 39.3 | 0.24 | 408 |
| 23 | 0.03 | 10,678 | 126 | 26 | 292 | 4.8 | 147 | 40.1 | 0.24 | 429 |
| 24 | −0.21 | 10,735 | 125 | 28 | 283 | 5.6 | 107 | 35.7 | 0.28 | 586 |
| 25 | −2.09 | 9961 | 64 | 44 | 264 | 6.2 | 159 | 39.6 | 0.27 | 447 |
| 26 | −1.68 | 9572 | 104 | 25 | 274 | 4.1 | 40 | 32.6 | 0.28 | 495 |
| 27 | −2.42 | 9374 | 125 | 34 | 274 | 6.2 | 40 | 33.3 | 0.28 | 461 |
| 28 | −1.13 | 11,109 | 105 | 26 | 247 | 6.2 | 40 | 31.0 | 0.28 | 520 |
| 29 | −1.25 | 9547 | 109 | 34 | 237 | 4.4 | 40 | 29.9 | 0.28 | 510 |
| 30 | −2.30 | 8677 | 142 | 36 | 233 | 3.6 | 40 | 27.0 | 0.28 | 454 |
| 31 | −1.09 | 10,429 | 145 | 30 | 268 | 3.6 | 40 | 29.5 | 0.28 | 515 |
| 32 | −1.11 | 10,260 | 126 | 41 | 243 | 3.2 | 40 | 31.2 | 0.28 | 518 |
| 33 | −3.11 | 9504 | 126 | 38 | 194 | 3.5 | 40 | 33.5 | 0.27 | 427 |
| 34 | −6.23 | 10,703 | 74 | 34 | 221 | 3.1 | 40 | 25.9 | 0.28 | 160 |
| 35 | −7.14 | 7041 | 64 | 33 | 200 | 3.2 | 40 | 25.7 | 0.28 | 147 |
| 36 | −7.76 | 7574 | 55 | 37 | 181 | 3.1 | 40 | 23.5 | 0.26 | 240 |
| 37 | −10.39 | 7563 | 26 | 29 | 135 | 4.1 | 102 | 23.3 | 0.23 | 91 |
| 38 | −10.37 | 7170 | 25 | 28 | 150 | 3.3 | 146 | 28.7 | 0.24 | 168 |
| 39 | −3.08 | 9289 | 107 | 27 | 228 | 3.9 | 163 | 28.1 | 0.26 | 470 |
| 40 | −2.82 | 9150 | 101 | 12 | 237 | 3.7 | 237 | 25.4 | 0.28 | 654 |
| Data ID | Relational Coefficients of Tunnelling Parameters | Relational Coefficients of Grouting Parameters | Relational Coefficients of Stratum Parameters | ||||||
|---|---|---|---|---|---|---|---|---|---|
| Thrust | Earth Pressure | Tunnelling Speed | Grouting Pressure | Grouting Volume | Cohesion | Internal Friction | Poisson’s Ratio | Elastic Modulus | |
| 0 | 0.87 | 0.72 | 0.44 | 0.98 | 0.44 | 0.62 | 0.78 | 0.58 | 0.95 |
| 1 | 0.79 | 0.74 | 0.97 | 0.68 | 0.40 | 0.73 | 0.92 | 0.59 | 0.85 |
| 2 | 0.54 | 0.73 | 0.88 | 0.69 | 0.50 | 0.54 | 0.70 | 0.71 | 0.74 |
| 3 | 0.76 | 0.92 | 0.36 | 0.94 | 0.80 | 0.76 | 0.99 | 0.56 | 0.91 |
| 4 | 0.68 | 0.72 | 0.34 | 0.56 | 0.66 | 0.63 | 0.73 | 0.52 | 0.68 |
| 5 | 0.56 | 0.55 | 0.65 | 0.67 | 0.96 | 0.44 | 0.59 | 0.95 | 0.67 |
| 6 | 0.81 | 0.71 | 0.40 | 0.60 | 0.50 | 0.67 | 0.67 | 0.51 | 0.96 |
| 7 | 0.78 | 0.71 | 0.41 | 0.78 | 0.64 | 0.62 | 0.62 | 0.45 | 0.73 |
| 8 | 0.52 | 0.52 | 0.76 | 0.76 | 1.00 | 0.47 | 0.52 | 0.81 | 0.85 |
| 9 | 0.71 | 0.75 | 0.43 | 0.88 | 0.83 | 0.42 | 0.51 | 0.97 | 0.83 |
| 10 | 0.84 | 0.87 | 0.61 | 0.67 | 0.74 | 0.48 | 0.42 | 0.80 | 0.76 |
| 11 | 0.87 | 0.97 | 0.56 | 0.62 | 0.67 | 0.40 | 0.46 | 0.91 | 0.87 |
| 12 | 0.86 | 0.66 | 0.38 | 0.67 | 0.59 | 0.50 | 0.42 | 0.76 | 0.91 |
| 13 | 0.54 | 0.58 | 0.61 | 0.65 | 0.65 | 0.48 | 0.41 | 0.84 | 0.91 |
| 14 | 0.67 | 0.75 | 0.47 | 0.98 | 0.64 | 0.50 | 0.57 | 0.57 | 0.91 |
| 15 | 0.82 | 0.67 | 0.46 | 0.54 | 0.66 | 0.41 | 0.51 | 0.70 | 0.83 |
| 16 | 0.80 | 0.83 | 0.78 | 0.53 | 0.79 | 0.58 | 0.62 | 0.99 | 0.91 |
| 17 | 0.54 | 0.64 | 0.92 | 0.73 | 0.91 | 0.56 | 0.56 | 0.68 | 0.82 |
| 18 | 0.79 | 0.56 | 0.60 | 0.55 | 0.91 | 0.60 | 0.70 | 0.72 | 0.98 |
| 19 | 0.69 | 0.79 | 0.37 | 0.93 | 0.83 | 0.78 | 0.94 | 0.56 | 0.85 |
| 20 | 0.76 | 0.81 | 0.60 | 0.71 | 0.90 | 0.84 | 0.84 | 0.50 | 0.78 |
| 21 | 0.77 | 0.51 | 0.48 | 0.58 | 0.95 | 0.95 | 0.94 | 0.67 | 0.68 |
| 22 | 0.78 | 0.79 | 0.54 | 0.56 | 0.63 | 0.73 | 0.90 | 0.72 | 0.61 |
| 23 | 0.74 | 0.76 | 0.40 | 0.69 | 0.61 | 0.48 | 0.77 | 0.59 | 0.55 |
| 24 | 0.78 | 0.79 | 0.46 | 0.68 | 0.83 | 0.33 | 0.58 | 0.93 | 0.83 |
| 25 | 0.80 | 0.53 | 0.70 | 0.76 | 0.70 | 0.96 | 0.94 | 0.87 | 0.75 |
| 26 | 0.66 | 0.76 | 0.52 | 0.78 | 0.60 | 0.37 | 0.57 | 0.76 | 0.80 |
| 27 | 0.69 | 0.86 | 0.89 | 0.88 | 0.67 | 0.39 | 0.66 | 0.75 | 0.82 |
| 28 | 0.93 | 0.71 | 0.49 | 0.60 | 0.81 | 0.35 | 0.49 | 0.92 | 0.79 |
| 29 | 0.62 | 0.76 | 0.78 | 0.57 | 0.63 | 0.36 | 0.47 | 0.80 | 0.78 |
| 30 | 0.56 | 0.71 | 0.83 | 0.63 | 0.54 | 0.38 | 0.45 | 0.82 | 0.79 |
| 31 | 0.80 | 0.82 | 0.57 | 0.68 | 0.42 | 0.35 | 0.46 | 0.82 | 0.78 |
| 32 | 0.76 | 0.92 | 0.84 | 0.58 | 0.38 | 0.35 | 0.50 | 0.84 | 0.79 |
| 33 | 0.79 | 0.76 | 0.63 | 0.55 | 0.59 | 0.41 | 0.73 | 0.79 | 0.83 |
| 34 | 0.53 | 0.91 | 0.46 | 0.93 | 0.64 | 0.74 | 0.64 | 0.50 | 0.64 |
| 35 | 0.64 | 0.89 | 0.44 | 0.97 | 0.87 | 0.93 | 0.72 | 0.46 | 0.70 |
| 36 | 0.83 | 0.91 | 0.43 | 0.96 | 0.72 | 0.61 | 0.67 | 0.50 | 0.98 |
| 37 | 0.77 | 0.87 | 0.41 | 1.00 | 1.00 | 0.55 | 1.00 | 0.52 | 1.00 |
| 38 | 0.89 | 0.89 | 0.42 | 0.87 | 1.00 | 0.46 | 0.64 | 0.46 | 0.78 |
| 39 | 0.73 | 1.00 | 0.87 | 0.68 | 0.66 | 0.68 | 0.52 | 0.89 | 0.95 |
| 40 | 0.68 | 0.87 | 0.40 | 0.69 | 0.60 | 0.64 | 0.44 | 0.73 | 0.64 |
| Parameter | Relational Degree | Ranking | |
|---|---|---|---|
| Tunnelling Parameters | Earth Pressure (kPa) | 0.762 | 2 |
| Tunnelling Speed (mm/min) | 0.575 | 8 | |
| Thrust (kN) | 0.730 | 3 | |
| Grouting Parameters | Grouting Pressure (kPa) | 0.726 | 4 |
| Grout Volume (m3) | 0.705 | 6 | |
| Stratum Parameters | Cohesion (kPa) | 0.562 | 9 |
| Internal Friction (°) | 0.648 | 7 | |
| Elastic Modulus (MPa) | 0.809 | 1 | |
| Poisson’s Ratio | 0.708 | 5 |
| Schemes | Thrust (kN) | Earth Pressure (kPa) | Elastic Modulus (%) | Grouting Pressure (kPa) |
|---|---|---|---|---|
| 1 | 6886 | 79 | 100 | 234 |
| 2 | 8030 | 79 | 100 | 234 |
| 3 | 9173 | 79 | 100 | 234 |
| 4 | 10,317 | 79 | 100 | 234 |
| 5 | 11,460 | 79 | 100 | 234 |
| 6 | 9173 | 20 | 100 | 234 |
| 7 | 9173 | 50 | 100 | 234 |
| 8 | 9173 | 109 | 100 | 234 |
| 9 | 9173 | 138 | 100 | 234 |
| 10 | 9173 | 79 | 50 | 234 |
| 11 | 9173 | 79 | 75 | 234 |
| 12 | 9173 | 79 | 125 | 234 |
| 13 | 9173 | 79 | 150 | 234 |
| 14 | 9173 | 79 | 100 | 134 |
| 15 | 9173 | 79 | 100 | 184 |
| 16 | 9173 | 79 | 100 | 284 |
| 17 | 9173 | 79 | 100 | 334 |
| Zone Name | Density (N/m3) | Elastic Modulus (MPa) | Poisson’s Ratio |
|---|---|---|---|
| Segment rings | 3250 | 3000 | 0.2 |
| Shield shell | 9500 | 200,000 | 0.3 |
| Grouting layer (pre-solidification) | 2100 | 240 | 0.3 |
| Grouting layer (post-solidification) | 2100 | 720 | 0.3 |
| Data Name | Actual Data | Simulation Data | R2 | RMSE |
|---|---|---|---|---|
| ZDBC65 | −2.42 | −2.37 | 0.911 | 0.235 |
| (Data ID 27) | ||||
| ZDBC64 | −1.68 | −2.04 | ||
| (Data ID 26) | ||||
| ZDBC63 | −2.09 | −2.23 | ||
| (Data ID 25) | ||||
| ZDBC62 | −0.21 | −0.56 | ||
| (Data ID 24) | ||||
| ZDBC61 | 0.03 | −0.36 | ||
| (Data ID 23) | ||||
| ZDBC60 | −1.34 | −1.09 | ||
| (Data ID 22) | ||||
| DBC10-01 | −0.79 | −0.92 | ||
| DBC10-01 | −1.86 | −2.01 | ||
| DBC10-01 | −1.95 | −2.02 | ||
| DBC10-04 | −0.88 | −1.01 |
Disclaimer/Publisher’s Note: The statements, opinions and data contained in all publications are solely those of the individual author(s) and contributor(s) and not of MDPI and/or the editor(s). MDPI and/or the editor(s) disclaim responsibility for any injury to people or property resulting from any ideas, methods, instructions or products referred to in the content. |
© 2023 by the authors. Licensee MDPI, Basel, Switzerland. This article is an open access article distributed under the terms and conditions of the Creative Commons Attribution (CC BY) license (https://creativecommons.org/licenses/by/4.0/).
Share and Cite
Luo, M.; Wang, D.; Wang, X.; Lu, Z. Analysis of Surface Settlement Induced by Shield Tunnelling: Grey Relational Analysis and Numerical Simulation Study on Critical Construction Parameters. Sustainability 2023, 15, 14315. https://doi.org/10.3390/su151914315
Luo M, Wang D, Wang X, Lu Z. Analysis of Surface Settlement Induced by Shield Tunnelling: Grey Relational Analysis and Numerical Simulation Study on Critical Construction Parameters. Sustainability. 2023; 15(19):14315. https://doi.org/10.3390/su151914315
Chicago/Turabian StyleLuo, Minhe, Ding Wang, Xuchun Wang, and Zelin Lu. 2023. "Analysis of Surface Settlement Induced by Shield Tunnelling: Grey Relational Analysis and Numerical Simulation Study on Critical Construction Parameters" Sustainability 15, no. 19: 14315. https://doi.org/10.3390/su151914315
APA StyleLuo, M., Wang, D., Wang, X., & Lu, Z. (2023). Analysis of Surface Settlement Induced by Shield Tunnelling: Grey Relational Analysis and Numerical Simulation Study on Critical Construction Parameters. Sustainability, 15(19), 14315. https://doi.org/10.3390/su151914315