Abstract
In Erbil, the capital city of the Kurdistan Region of Iraq, rapid urban growth has led to many sustainability challenges and has prompted shifts in neighborhood planning over time. This research examines the aspects of connectivity and mixed land use within five neighborhoods constructed during different periods. Given the limited research on this topic in regard to Erbil, the objective of this research is to bridge this gap by evaluating the performance of these two aspects of sustainable urban design in neighborhoods with different urban characteristics. The research methodology employed in this study integrates both qualitative and quantitative approaches to attain comprehensive insights. This approach encompasses surveys to assess residents’ satisfaction, measures the entropy index, and utilizes space syntax analysis to examine street networks. The findings of this study reveal that non-gated neighborhoods exhibit a higher level of connectivity and mixed land use, indicating the need for more substantial interventions in improving gated neighborhoods. Additionally, it shows that older neighborhoods with short and irregular streets demonstrate a higher level of connectivity. The implications of these findings extend beyond academia, bearing substantial significance for municipalities and policymakers involved in city development planning. In other words, it shows that the oldest neighborhood was the most compatible with indicators and principles of mixed land use and connectivity. However, gated neighborhoods, despite the good quality of the infrastructure, fall short of meeting the principles of sustainable neighborhoods.
1. Introduction
Sustainable development research has become increasingly focused on environmental conservation and resource management [1,2,3,4], with less attention paid to the effects of urbanization trends. This is especially true for developing countries, where these phenomena occur and have widespread impacts on ecological and natural resources [5]. Increasingly, studies from developing countries have shown how sustainable development has failed to create an optimal harmony between the environment, economy, and society [6,7].
The sustainable urban form approach has been proposed as a potential solution for achieving physical sustainability in cities in developing countries [8,9,10]. Meanwhile, there is no consensus among the researchers on how to overcome these issues due to the lack of a clear perspective and a lack of specific approaches for achieving a sustainable urban form in the city. UN-Habitat defines sustainable urbanism as a type of development, urban management, and lifestyle that promotes the effective use of land, the preservation of the natural environment, and a high quality of life [11]. Over the past century, Erbil has undergone significant urban transformation due to the ongoing expansion of its urban areas. The city’s urban form has evolved considerably. In its early stages, its neighborhoods were marked by a mixture of irregular and grid-like street patterns, along with traditional architectural styles. As time passed, particularly around the mid-century mark, wide, grid-patterned streets and contemporary house designs became prevalent. The current population of Erbil is 846,000 residents [12]. In addition, 215,000 (IDPs, Internally Displaced Persons) sought safety in Erbil from Baghdad and other Iraqi cities after the war of 2003 and its consequences [13] (Table 1 and Table 2). The oil revenue also strengthened the region’s economy and resulted in a construction boom. Despite the relative stability in Iraq, nonetheless, the current sense of safety in the city has been vital for Iraqi and foreign investors to invest in Erbil. All these factors collectively are speeding up the expansion of the city. This rapid growth of the urban area has raised concerns about sustainability issues regarding the new built neighborhoods in Erbil. More recently, driven by a rising need for housing [14], the government took steps to encourage private investment in the housing sector. The issuance of Investment Law No. 4 of 2006 facilitated the process of obtaining permission for housing projects by skipping the municipalities’ regulations. According to this law, the only body responsible for giving permission is the Board of Investment, which gives private companies the choice of planning the neighborhoods, including the zoning plan and street networks. This shift in legislation led to the emergence of gated communities in the city. Few studies are available concerning the expansion of the city and sustainability issues [15]. However, the focus of the studies is urban form transformation and identity [16,17], with little attention paid to the role of connectivity and mixed land use. Since these aspects in Erbil—a city in a developing country—have scarcely been covered in previous studies, this research attempts to fill this gap in knowledge. The main question of the research is: How do neighborhoods with different urban characteristics and built in different periods respond to mixed land use and connectivity aspects of sustainable urban forms? In this research, five different neighborhoods were chosen as case studies according to various criteria, such as their location in the city, gated or non-gated, time of construction of the street patterns, area, and population density. To measure the land-use mixture of these neighborhoods, the entropy index was used, and for the connectivity and walkability of the streets, space syntax analysis was performed. In addition, an on-site survey was carried out to measure the residents’ satisfaction with a set of indicators proposed based on the literature. Finally, the residents’ satisfaction was compared with the results of the entropy index, space syntax analysis, and the UN-Habitat criteria for sustainable neighborhoods. This study focuses on evaluating the chosen neighborhoods in Erbil based on the aspects of mixed land use and connectivity. These aspects have been extensively highlighted in the literature for their positive impacts in achieving a sustainable urban layout. The primary objective is to understand the performance of neighborhoods from various time periods concerning these two factors. Furthermore, this research aims to shed light on the differences between gated and non-gated neighborhoods in relation to these aspects. The present study is significant because it addresses the issues of connectivity and mixed land use in gated neighborhoods by comparing them to the earlier built non-gated neighborhoods of the city. The findings of this research show that gated neighborhoods are in need of substantial intervention to improve the performance of mixed land use and connectivity. The intervention includes changes in their physical infrastructure as well as legislation amendments. The findings will help the local municipalities by focusing on the indicators that need improvements in order to achieve sustainable neighborhoods.

Table 1.
Erbil city population from 1950 to 2020 and the number of IDPs (source: [12,13]).

Table 2.
Urbanization index, changes in urban and rural populations in Iraq (source of data: [12]).
2. Literature Review
In the context of advancing perspectives on urban sustainability, numerous authors have emphasized the importance and role of the urban form as a pivotal component [18,19,20]. Elkin argues that a sustainable city must possess a form and scale conducive to walking and cycling in order to foster social interaction [21]. Other researchers like Song [22] have proposed accessibility to commercial areas and public parks, as well as a mixed land-use approach, as primary factors influencing the sustainability of the urban form. Meanwhile, Frey places emphasis on features such as mixed-use spaces, social diversity, and access to services and open areas as vital indicators of a sustainable city [23]. Talen utilized a combination of spatial indicators, including enclosure, open spaces, appropriateness, public areas, proximity, mixed uses, centers, and edges, to assess the quality of the urban form [24]. To achieve a sustainable urban form, Williams concluded that a variety of forms exist that are characterized by a blend of uses, interconnected street layouts, and environmental control [25]. Ewing focused on factors such as land-use diversity, residential density, and street network accessibility [26]. The national swing of the population from rural to urban in the USA in 1920 has played a significant role in the necessity of zoning regulations [27]. In order to address these issues, modern urbanism has pushed us towards the fundamental principle of mixed land use [28]. Through the provision of a variety of functions, including residential, commercial, cultural, and industrial, mixed land use plays a significant role in sustainable development [29]. Dense and mixed-use urban neighborhoods, according to Jacobs, are more economically viable, socially secure, culturally interesting, and safer than mono-functional residence suburbs [30]. Retail, commercial, and shared activities must all be conveniently located to meet the needs of the local populace [31]. It has been found that a variety of uses near a place of employment can lessen the need for employees to commute [32]. The goal of establishing sustainable urban form is to reduce the need for travel, and mixed land use plays a significant part in accomplishing this goal [33,34]. Mixed land-use development is also impacted by societal issues. Public space utilization is more prevalent among the residents of mixed-use neighborhoods [35]. In a community with a mixture of land uses, there is great community cohesion, interaction, and sense of belonging [36]. Walking is supported for a variety of activities, as well as for leisure purposes, through a finely tuned combination of desirable destinations and good landscape features [37]. Moreover, the correlation between mixed land use and the three pillars of sustainability was defined by Grant: “Mixing uses forms part of a strategy of sustainable development as well as a theory of good urban form, with the objectives of economic vitality, social equity and environmental quality” [38]. Mixed land use reduces the need for car travel and boosts the number of people who choose to travel by foot or bike [39]. There is a sense of safety allowing children to play or ride bikes and the elderly to meet and talk [40]. Numerous studies indicate that higher population densities, mixed land uses, and pedestrian-friendly surroundings are all related to decreased car travel [41,42]. For a healthy urban form, communities should encourage mixed usage and avoid zoning [43]. In addition, urban connectivity, which describes the connections between urban blocks within a district and between districts, also increases community involvement and fosters long-term neighborhood cohesion [44]. It also promotes the concept of sustainable communities [45].
The development of neighborhood hubs that host a variety of amenities in support of a high quality of life is essential [46]. In the built environment, the ability to walk provides the most significant contribution to the vitality of a community; the higher the percentage of pedestrians, the more vital the community will be, improving social interaction [47]. Walkability is an indicator of the quality of the built environment, and it is positively associated with increased physical activity and improved public health [48]. Lastly, the previous literature has revealed a number of relevant indicators connected to mixed land use and connectivity. These indicators are used in the resident satisfaction questionnaire for the selected neighborhoods (Table 3).

Table 3.
Mixed land use and connectivity indicators.
3. Materials and Methods
The research adopted the mixed-method approach of qualitative and quantitative methods (Figure 1). The qualitative approach was used to explore, describe, and interpret the results via a combination of literature review, site visits, and observations. Nevertheless, different tools were used during the analysis of quantitative data, such as IBM_SPSS_Statistics_25.0x64, to assess residents’ satisfaction in each neighborhood. In addition, depthmapX-0.8.0 software was used for space syntax and street network analysis, as well as MS Excel 2019. Moreover, the entropy index equation was used for measuring the mixed land use of different neighborhoods. Lastly, the results were compared with each other and with the UN-Habitat criteria of sustainable neighborhoods. Using different tools was crucial to examine the mixed land use and connectivity of the selected neighborhoods, as space syntax analytical techniques only investigate layouts seen in plans. Therefore, the designed method helps us to gain deeper insight into the elements that need improvement in each neighborhood and the level of intervention required to achieve the sustainability goals.
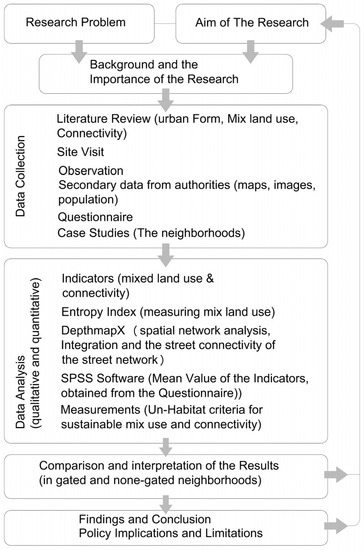
Figure 1.
The framework of the methodology.
3.1. Data Collection
Different data sources were used in this study to both ensure its validity and gain a better understanding of the subject matter. The data collected and used in this research included primary data, such as those obtained from the questionnaire on resident satisfaction. The questionnaire included simple written questions to ensure that even individuals with limited literacy could comprehend and respond. The survey took place In December 2022; the forms were personally distributed among the residents of the studied neighborhood; and 160 valid responses were collected out of 220. In addition, secondary sources were used, including the literature, satellite images, maps, and zoning plans of the city of Erbil (Figure 2). These data were mostly used to obtain and synthesize the findings into a textual narrative. Five neighborhoods in the city were chosen according to various criteria. The neighborhoods differed in their location from the center, density, area, street network, and housing typology (Figure 3, Figure 4 and Figure 5). Additionally, they evolved under different socio-economic conditions and thus represent different periods of growth of the city (Table 4 and Table 5).
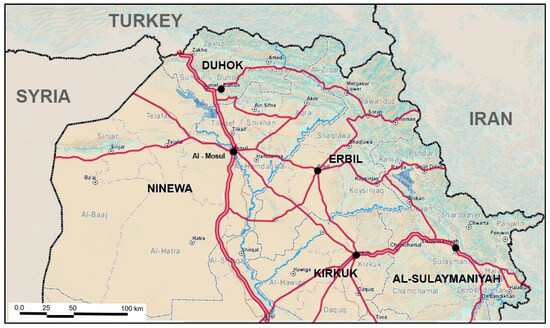
Figure 2.
The central location of Erbil according to the northern part of Iraq. (Source: [49], modified by the author).
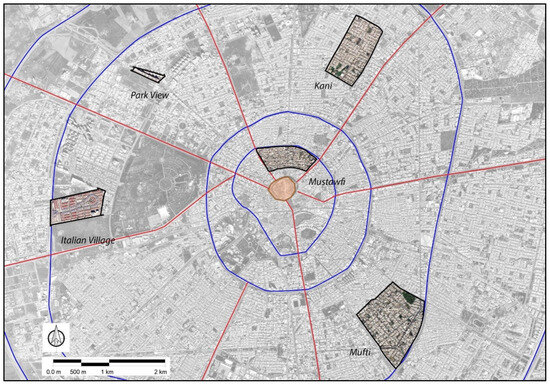
Figure 3.
The locations of the neighborhoods according to the city center, the red lines demonstrate the radial streets, while the blue lines are the circular streets. (Source: satellite image 2019, from Erbil municipality, modified by the author).
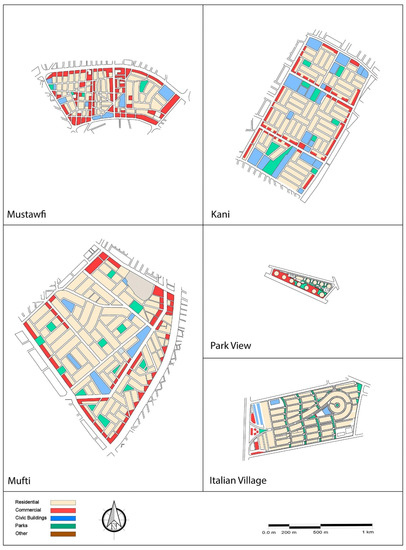
Figure 4.
The land-use plan and the street network of the case studies. (Source of the map: Erbil Municipality, drawing by the author).
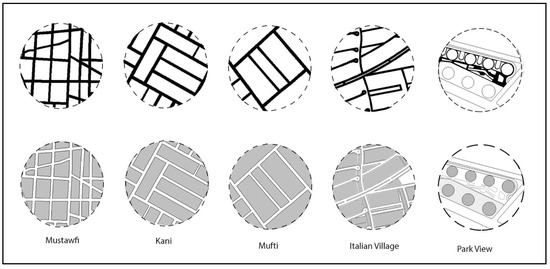
Figure 5.
Segments showing the urban fabric and the street network of the selected neighborhoods. (Source: Author).

Table 4.
Criteria of the chosen case studies. (Source: data from Kurdistan Region Statistics Office).

Table 5.
Land-use area of the neighborhoods. (Source: Erbil Municipality).
3.2. Data Analysis
This step mainly involved measurements, calculations of the data, and a comparative analysis of the results and the findings to derive dependable conclusions. The following tools and software were utilized in this research to analyze the collected data.
3.2.1. Measuring the Connectivity of Streets (Space Syntax)
Space syntax analysis (DepthmapX-0.8.0.) software was used to spatially analyze the integration and the street connectivity of the chosen neighborhoods. The association between walking behavior and the neighborhood built environment has received great attention in the literature. The static local metric called “street connectivity” describes the number of connections that each street has to its immediate neighbors. Increased street connectivity on the neighborhood level is of great importance for sustainable environments [50]. Good street connectivity encompasses many short links and intersections, with limited or no cul-de-sacs [51]. It relates to the number of intersections in a segment and stresses how an area is connected to the system [52]. The impact of block street designs on walking has been studied using the space syntax technique in a number of studies [53] focusing on the effects of walkability on physical activity [54]. These researchers came to the conclusion that neighborhoods with better street connectivity and more direct connections to neighboring areas are more walkable.
3.2.2. Measuring Land-Use Mix (Entropy Index)
The entropy index is used to measure the land-use mix by quantifying the balance of types (zones) within the same geography (neighborhood). In this research, this index is used to measure the homogeneity of the residential, commercial and public service area of the selected neighborhoods. The land-use mix refers to the combination and segregation of different types of land uses, serving as a measure of how homogeneous land use is within a specific geographical area. As a result, the entropy index has gained substantial acceptance as a suitable metric for illustrating the diversity of land-use patterns, as indicated in various studies [32,55,56,57]. Cervero, in particular, derived the entropy equation as follows:
where Pj is the proportion of developed land of the Jth land-use type. The entropy index has a value between 0 and 1, with 0 indicating homogeneous land use and 1 indicating an even distribution of all land-use types over the tract of land. In this research, the existing land-use distribution for each neighborhood was calculated on a map based on a site visit and the available data from the municipality of Erbil. The entropy index was computed for residential, commercial and public service land-use types with the following equation:
where t is the total area in square meters for three land uses; a1, a2 and a3 are the residential, commercial, and civic land-use areas, respectively; and n is 3 (total number of land uses calculated).
3.2.3. Measuring Residents’ Satisfaction
The data collected from the questionnaire were analyzed by utilizing IBM SPSS Statistics 25 software to compare means and to calculate the standard deviation of the selected neighborhoods. The goal of this analysis is to determine if there are statistical differences in the mean value of the indicators between the neighborhoods. The indicators identified in the literature review were used in the questionnaire for the selected neighborhoods to measure the residents’ satisfaction with each indicator. The survey was distributed randomly among the residents to assure the reliability and validity of the data collected. In the survey, respondents were asked to select a response on a five-point Likert scale (1–5) ranging from “very satisfied” (5) to “very dissatisfied” (1), in order to determine their degree of satisfaction (scoring range of Likert scale, 1–1.8: very dissatisfied, 1.81–2.6: dissatisfied, 2.61–3.4: neutral, 3.41–4.2: satisfied, 4.21–5: very satisfied [58].
3.2.4. UN-Habitat’s Criteria for Street Network and Mixed Land Use
UN-Habitat (United Nations Human Settlements Programme), in its attempt to address contemporary urbanization challenges such as population growth, urban sprawl, pollution, and urban mobility, has proposed an approach to attain sustainable neighborhoods [28]. This approach encompasses criteria for an efficient street network to provide sufficient space for walking and cycling, as well as access to amenities. To achieve this objective, it is recommended that a minimum of 30% of the land should be allocated to street networks, with a minimum of 18 km of street length per 1 km². Furthermore, concerning mixed land use, the proposal suggests that the floor area distribution for a sustainable neighborhood should be as follows: (40–60%) for economic use, (30–50%) for residential use, and (10%) for public services.
4. Results
4.1. Space Syntax Analysis
The street connectivity of the selected neighborhoods was computed by utilizing the space syntax technique with depthmapX-0.8.0 software. The attribute summary (Table 6) provides the average value for the following measures: a—connectivity (A street with many connections to its side streets has a high connectivity value, whereas a street with few connections has a low connectivity value [59]). b—integration (a normalized measure of the distance from a given space to all others in a system, which is used to calculate how close the original space is to all other spaces and can be seen as a measure of relative asymmetry). c—choice (measures how likely one is to pass through a street segment on all the shortest routes from one space to all other spaces in the entire system or within a predetermined distance from each segment [60]). d—node count (measures the number of lines encountered on the route from the selected line to all others). A spectral color legend is used to show the streets’ connectedness, with red indicating the highest values and blue indicating the lowest (Figure 6, Figure 7 and Figure 8). The blue axial lines along the boundary walls on the maps indicate lower connectivity with the surrounding neighborhoods.

Table 6.
Space syntax analysis: attribute summary.
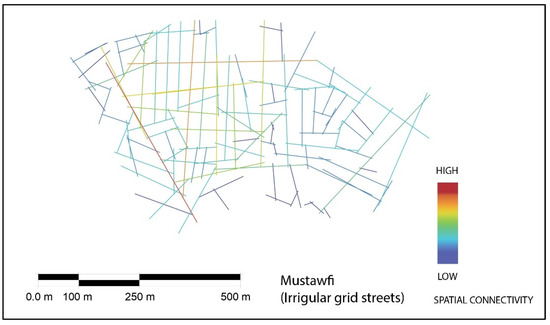
Figure 6.
Axial map analysis of the non-gated neighborhoods of Mustawfi.
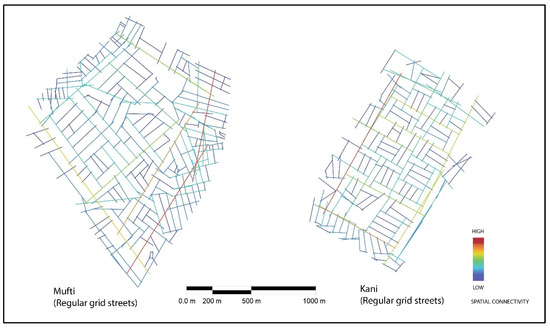
Figure 7.
Axial map analysis of the non-gated neighborhoods of Mufti and Kani.
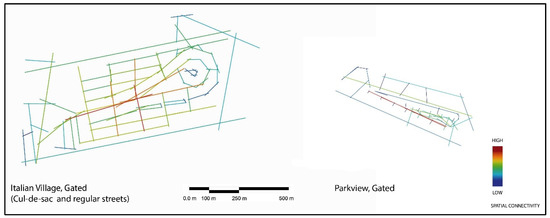
Figure 8.
Axial map analysis of the gated neighborhoods of the Italian Village and Park View.
The axial line analysis and the street connectivity values in the attribute summary demonstrate that the Mustawfi neighborhood, with irregular grid streets, has the highest street connectivity of 5.54783, while the gated Italian Village, with cul-de-sac streets, has the lowest connectivity and integration with results of 4.23377 and 1.8086, respectively (since the Italian Village has cul-de-sac streets, it was computed twice for street connectivity and walkway connectivity). In addition, both gated neighborhoods, the Italian Village and Park View have the lowest choice and node count values. The comparisons between the gated and non-gated neighborhoods show clear differences between these two types. The neighborhoods founded earlier (non-gated neighborhoods) demonstrate higher values of connectivity and, consequently, better walkability. The Italian Village, despite having wider streets and walkways, has limited integration and connectivity due to its cul-de-sacs and end-point streets.
4.2. Entropy Index
The results of the homogeneity measure show that the entropy index for mixed use is significantly higher in Mustawfi, at 0.84. Mustawfi is the oldest among all the neighborhoods. Kani and Mufti neighborhoods, both constructed during the middle of the last century, exhibit contrasting entropy values. Kani has an index of 0.80, which is much higher than Mufti’s 0.55. This difference is attributed to the greater availability of public service areas in Kani (Table 7). Park View, a high-rise gated neighborhood, also boasts a high index of 0.79. This is primarily due to the extensive commercial areas on the first and second floors of the apartments. The Italian Village neighborhood, characterized by terraced and semi-attached houses and developed by the private sector, records the lowest measured entropy index of 0.36. Such projects typically operate without municipal oversight or regulatory compliance, resulting in a lack of homogeneity in land-use types and insufficient public services.

Table 7.
The entropy index of the selected neighborhoods.
4.3. Residents’ Satisfaction
The results of the analyzed data obtained from the questionnaire showed the residents’ dissatisfaction with both gated neighborhoods; the very dissatisfied responses reached peaks of around 52% and 33% for Park View and the Italian Village, respectively, for the indicators of mixed land use (Figure 9, Table 8). Meanwhile, the non-gated neighborhood showed similar responses, with the majority being satisfied. Concerning the connectivity of the neighborhoods, most residents’ valuation was positive or neutral, except for Park View, for which the valuations were 30% dissatisfied and 23% very dissatisfied, respectively.
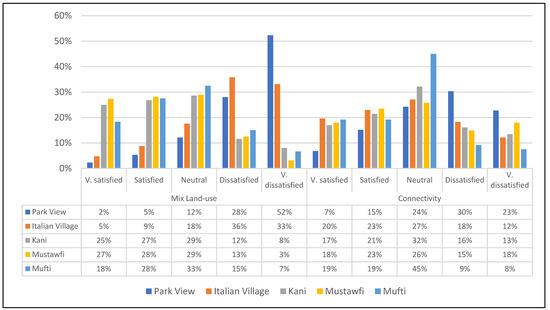
Figure 9.
The percentage of the satisfaction for mixed land-use and connectivity indicators.

Table 8.
The mean value of the indicators.
5. Discussion and Comparison
Nowadays, urban planning is increasingly focused on walkability, partly in response to public demand and in an effort to achieve sustainable urban development [44]. Consequently, the urban planning literature extensively debates the urban form aspects of mixed land use and connectivity due to their positive contributions to promoting sustainability. However, creating an inclusive land-use plan for a specific region presents considerable challenges. Therefore, each country must tailor its sustainable development strategy to address its unique issues and limitations. In this study, measurements and results obtained through various tools are compared. The comparison reveals that none of the five studied neighborhoods meet the criteria for mixed land use recommended by UN-Habitat. Nonetheless, three of them demonstrate a high degree of resident satisfaction with mixed land use. The interpretation of this finding suggests that criteria effective in developed countries may not necessarily suit cities in developing countries. Therefore, these criteria should be customized to fit the context of the city, taking into consideration the culture and social behavior of each society.
In this study, the results of the residents’ responses to connectivity in the Italian Village, despite it being a gated neighborhood, are positive. This can be attributed to the wide streets and the good condition of the walkways, which ensure walkability (Figure 10). For Park View, the mixed use and connectivity mean values are below the total average of the means for all the neighborhoods. Thus, it is necessary to create more stores and different economic activities in the gated neighborhoods. Since high-rise buildings can accommodate a higher number of housing units across multiple floors, a mixture of high-rise and low-rise residential buildings could be an effective strategy to overcome this issue, especially in gated neighborhoods. Accordingly, authorities can take advantage of the additional available area to increase greening, which will also help to ensure the walkability of the neighborhood. Furthermore, a comparison between the mean values of the gated and non-gated neighborhood indicators showed a higher degree of satisfaction in non-gated neighborhoods (Figure 11).
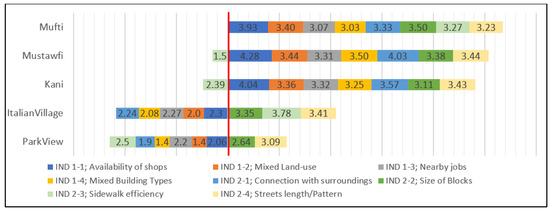
Figure 10.
Indicators of mixed land use and connectivity (mean value).
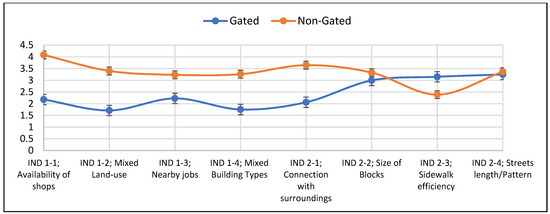
Figure 11.
Comparison of the indicators between gated and non-gated neighborhoods.
Concerning UN-Habitat’s recommendations, the neighborhood of Mustawfi requires slight intervention and changes to meet the recommended criteria for economic use and public use areas. The residential area in Mustawfi is slightly above the recommended range, at 53% (Table 9). This neighborhood has a sufficient street length, although the area of the streets falls slightly below the required amount, at 26%; however, in this measure, it is the highest among all the neighborhoods. Meanwhile, in Mufti and Kani, there is inadequate area for economic use, and Mufti also lacks a public service area.

Table 9.
A comparison of performance regarding mixed land use and connectivity via different tools.
Despite having limited public service and economic use areas, as well as a low entropy index, residents in the Mufti neighborhood expressed acceptable satisfaction with their neighborhood’s mixed land use and access to daily amenities due to its good connectivity, as demonstrated in the space syntax analysis. Similarly, in Kani, the restricted economic use area did not significantly affect residents’ satisfaction. Concerning mixed land use, the Italian Village and Park View (both are gated neighborhoods) lack adequate public service areas based on the recommendations of UN-Habitat. Though all the neighborhoods fail to meet the economic use area requirements, the Italian Village stands out with an exceptionally low ratio of only 3% and a very low entropy index of 0.36. This significantly hampers residents’ accessibility to daily amenities. Interestingly, despite scoring very low in terms of connectivity according to the space syntax analysis, residents’ satisfaction with connectivity remains high in this neighborhood. This is attributed to the high level of satisfaction with respect to walkability within the neighborhood concerning the indicator of sidewalk efficiency (IND 2-3). In Park View—a high-rise complex—there is a sufficient economic use area and a high entropy index of 0.79. However, the residents’ satisfaction with mixed land use and accessibility to daily amenities is the lowest, with a mean value of 1.77. A site visit to the area revealed that the commercial area is predominantly occupied by luxury retailers and restaurants, with very few stores, which explains the dissatisfaction of the residents. The results demonstrated that there is a positive association between connectivity and mixed land use in non-gated neighborhoods. This association is supported by previous studies with an emphasis on the role of mixed land use in promoting walkability [61,62]. However, this association is proved to be positive only when the residential uses are combined with non-residential uses within walking distance [62]. Moreover, the findings of this study partially supported this idea in gated neighborhoods. This is due to the fact that gated neighborhoods have limited connections with their surroundings and lack mixed building types. Based on the findings, the neighborhoods were categorized according to the level of intervention needed to improve their mixed land use, connectivity, and consequently, their overall sustainability (Table 10).

Table 10.
The challenges and the level of intervention needed for each neighborhood.
6. Conclusions
Over the past century, Erbil’s urban structure has undergone numerous changes, influenced by social, economic, and political factors. These factors have affected the transformation of the spatial pattern of the city’s neighborhoods. Additionally, as the city is the capital of the autonomous region of Kurdistan and has a high level of safety, it is expected to continue to grow. This study showed that changes in the street networks and spatial patterns have had a great influence on the level of sustainability. The research showed that the performance of the aspects of mixed land use and connectivity is highest in Mustawfi. This neighborhood is the oldest in this study and is characterized by short and irregular streets. Similarly, the performance of both aspects in Kani and Mufti is acceptable. These two neighborhoods are characterized by regular grid streets. However, the gated neighborhoods of Italian Village and Park View demonstrated the lowest performance for both aspects. Italian Village is characterized by regular and cul-de-sac streets, and Park View is comprised of high-rise buildings. Additionally, the assessment of the aspects of sustainable urban forms via different tools, as well as the statistical analysis, showed significant differences between the gated and non-gated neighborhoods. In other words, the improvement of gated neighborhoods requires higher interventions. The findings of the study have the potential to offer insights to local municipalities regarding deficiencies in mixed land use and connectivity within gated neighborhoods, highlighting the indicators that are in need of improvement. Moreover, it underscores the importance of employing diverse measurement tools, as this study reveals that a high entropy index in Park View is associated with low resident satisfaction with mixed land use. Nevertheless, it is essential to acknowledge the limitations of this study, including the reliance on a single method (the equation of entropy index) for measuring the homogeneity of land use and the limited number of participants in the questionnaire. Consequently, conducting a larger-scale questionnaire would enhance the accuracy of the collected data. Furthermore, integrating additional sustainability aspects such as diversity and density will contribute to a more comprehensive understanding of the elements requiring improvement to attain sustainability goals.
Funding
This research received no external funding.
Institutional Review Board Statement
Not applicable.
Informed Consent Statement
Not applicable.
Data Availability Statement
The datasets generated and analyzed during this research are available on request from the corresponding author.
Acknowledgments
The author would like to appreciate the efforts and support of KISSFAZEKAS Kornélia, Senior Research Fellow, and KÁDÁR Bálint, Budapest University of Technology and Economics, Department of Urban Planning and Design, for their support.
Conflicts of Interest
The author declares no conflict of interest.
References
- Baker, S. Sustainable development as symbolic commitment: Declaratory politics and the seductive appeal of ecological modernisation in the European Union. Environ. Politics 2007, 16, 297–317. [Google Scholar] [CrossRef]
- European, C. Towards Sustainability: Fifth Environmental Action Programme. Off. J. Eur. Comunities 1993, 36, 5–98. [Google Scholar]
- Ogbodo, S.G. The paradox of the concept of sustainable development under Nigeria’s environmental law. J. Sustain. Dev. 2010, 3, 201. [Google Scholar] [CrossRef][Green Version]
- Zaccai, E. Over two decades in pursuit of sustainable development: Influence, transformations, limits. Environ. Dev. 2012, 1, 79–90. [Google Scholar] [CrossRef]
- Cohen, B. Urbanization in developing countries: Current trends, future projections, and key challenges for sustainability. Technol. Soc. 2006, 28, 63–80. [Google Scholar] [CrossRef]
- Eastwood, R.; Lipton, M. The Impact of Changes in Human Fertility on Poverty; University of Sussex: Brighton, UK, 1997. [Google Scholar]
- United Nations Environment Programme. Towards a Green Economy: Pathways to Sustainable Development and Poverty Eradication; UNEP: Nairobi, Kenya, 2011. [Google Scholar]
- Chatterjee, U.; Biswas, A.; Mukherjee, J.U. Sustainable Urbanism in Developing Countries; CRC Press: Boca Raton, FL, USA, 2022. [Google Scholar]
- Jenks, M.; Burgess, R. Compact Cities: Sustainable Urban Forms for Developing Countries; E. & F.N. Spon: London, UK, 2000. [Google Scholar]
- Pugh, C.D.J.U. Sustainable Cities in Developing Countries: Theory and Practice at the Millennium; Earthscan: Oxford, UK, 2000. [Google Scholar]
- UN-Habitat. How Building Codes and Regulations Can Be Adapted to Meet the Basic Needs of the Poor: Report of the UN Seminar of Experts on Building Codes and Regulations in Developing Countries, Tӓllberg and Stockholm, March 1980; Swedish Council for Building Research: Stockholm, Sweden, 1980. [Google Scholar]
- UN. World Urbanization Prospects; Department of Economic and Social Affairs: New York, NY, USA, 2018; Available online: https://population.un.org/wup/download/ (accessed on 5 January 2022).
- IOM. Iraq—Displacement Report 115 (March—April 2020); IOM Iraq: Erbil, Iraq, 2020; Available online: https://dtm.iom.int/reports/iraq-%E2%80%94-displacement-report-115-march%E2%80%94april-2020 (accessed on 5 August 2023).
- Nishan, M. Urban Expansion of Erbil and The Effects of Environmental During the Period 1947–2017 (A Study in The Geography of Cities. J. Univ. Duhok 2019, 22, 452–468. [Google Scholar] [CrossRef]
- Mohammad, M.S.; Elmastas, N.; Abdullah, H. Temporal change of Urban Land Use: The case of Erbil City. Ecol. Environ. Conserv. Pap. 2021, 27, 48–58. [Google Scholar]
- Sabr, C.A. A study on the urban form of Erbil city (the capital of Kurdistan region) as an example of historical and fast growing city. Humanit. Soc. Sci. Rev. CD-ROM 2014, 3, 325–340. [Google Scholar]
- Ibrahim, R.; Mushatat, S.; Abdelmonem, M.G. Authenticity, identity and sustainability in post-war Iraq: Reshaping the urban form of Erbil City. J. Islam. Archit. 2014, 3, 58–68. [Google Scholar] [CrossRef][Green Version]
- Burton, E. Potential of the compact city for promoting social equity. In Achieving Sustainable Urban Form; Williams, K., Jenks, M., Burton, E., Eds.; Routledge: Oxfordshire, UK, 2000; Volume 1, pp. 19–29. [Google Scholar]
- Jabareen, Y.R. Sustainable urban forms: Their typologies, models, and concepts. J. Plan. Educ. Res. 2006, 26, 38–52. [Google Scholar] [CrossRef]
- Jones, C.; Jenks, M.; Bramley, G. Complementarities and Contradictions. In Dimensions of the Sustainable City; Jones, C., Jenks, M., Eds.; Springer: Dordrecht, The Netherlands; London, UK; New York, NY, USA, 2010; pp. 239–256. [Google Scholar]
- Elkin, T.; McLaren, D.; Hillman, M. Reviving the City: Towards Sustainable Urban Development; Friends of the Earth with Policy Studies Institute: Washington, DC, USA, 1991. [Google Scholar]
- Song, Y.; Knaap, G.-J. Measuring the effects of mixed land uses on housing values. Reg. Sci. Urban Econ. 2004, 34, 663–680. [Google Scholar] [CrossRef]
- Frey, H. Designing the City: Towards a More Sustainable Urban Form; E & FN Spon: London, UK, 1999. [Google Scholar]
- Talen, E. Neighborhoods as Service Providers: A Methodology for Evaluating Pedestrian Access. Environ. Plan. B Plan. Des. 2003, 30, 181–200. [Google Scholar] [CrossRef]
- Williams, K.; Burton, E.; Jenks, M. Achieving Sustainable Urban Form; E & FN Spon: London, UK, 2000. [Google Scholar]
- Ewing, R.; Pendall, R.; Chen, D. Measuring Sprawl and Its Transportation Impacts. Transp. Res. Rec. 2003, 1831, 175–183. [Google Scholar] [CrossRef]
- Whitnall, G. The History of Zoning. Ann. Am. Acad. Political Soc. Sci. 1931, 155, 1–14. [Google Scholar] [CrossRef]
- UN-Habitat. A New Strategy of Sustainable Neighbourhood Planning: Five Principles. 2014. Available online: https://unhabitat.org/five-principles-of-neighbourhood-design (accessed on 22 June 2023).
- Shen, Q.; Sun, F. What Makes Mixed-Use Development Economically Desirable? Lincoln Institute of Land Policy: Cambridge, MA, USA, 2020. [Google Scholar]
- Jacobs, J. The Death and Life of Great American Cities; Modern Library: New York, NY, USA, 1993. [Google Scholar]
- Farr, D.; Farr, D. Sustainable Urbanism: Urban Design with Nature; Wiley: Hoboken, NJ, USA, 2008. [Google Scholar]
- Cervero, R. Land-Use Mixing and Suburban Mobility. Transp. Q. 1988, 42, 429–446. [Google Scholar]
- Alberti, M. Urban form and ecosystem dynamics: Empirical evidence and practical implications. In Achieving Sustainable Urban Form; Williams, E.B., Jenks, M., Eds.; E & FN Spon: London, UK, 2000; pp. 84–96. [Google Scholar]
- van der Waals, J. The compact city and the environment: A review. Tijdschr. Voor Econ. En Soc. Geogr. 2000, 91, 111–121. [Google Scholar] [CrossRef]
- Saville-Smith, K. The Value of Neighbourhood Intensification: The Interface Between Dwelling, Neighbourhood Design and Affordability. In Proceedings of the ENHR 22nd International Housing Research Conference: Urban Dynamics & Housing Change-Crossing into the 2nd Decade of the 3rd Millennium, Istanbul, Turkey, 4–7 July 2010. [Google Scholar]
- Dempsey, N.; Bramley, G.; Power, S.; Brown, C. The social dimension of sustainable development: Defining urban social sustainability. Sustain. Dev. 2011, 19, 289–300. [Google Scholar] [CrossRef]
- Handy, S.L. Urban Form and Pedestrian Choices: Study of Austin Neighborhoods. Transp. Res. Rec. 1996, 1552, 135–144. [Google Scholar] [CrossRef]
- Grant, J. Mixed Use in Theory and Practice: Canadian Experience with Implementing a Planning Principle. J. Am. Plan. Assoc. 2002, 68, 71–84. [Google Scholar] [CrossRef]
- Ewing, R.; Cervero, R. Travel and the Built Environment. J. Am. Plan. Assoc. 2010, 76, 265–294. [Google Scholar] [CrossRef]
- Bahadure, S.; Kotharkar, R. Assessing Sustainability of Mixed Use Neighbourhoods through Residents’ Travel Behaviour and Perception: The Case of Nagpur, India. Sustainability 2015, 7, 12164–12189. [Google Scholar] [CrossRef]
- Soltani, A.; Pojani, D.; Askari, S.; Masoumi, H.E. Socio-demographic and built environment determinants of car use among older adults in Iran. J. Transp. Geogr. 2018, 68, 109–117. [Google Scholar] [CrossRef]
- Baobeid, A.; Koç, M.; Al-Ghamdi, S.G. Walkability and Its Relationships with Health, Sustainability, and Livability: Elements of Physical Environment and Evaluation Frameworks. Front. Built Environ. 2021, 7, 721218. [Google Scholar] [CrossRef]
- Michael, B. The contradictions of the compact city: A review. In Sustainable Development and Urban Form; Breheny, M., Ed.; Regional Science Associasion: Cambridge, UK, 1992; pp. 138–159. [Google Scholar]
- Talen, E. Sprawl Retrofit: Sustainable Urban Form in Unsustainable Places. Environ. Plan. B Plan. Des. 2011, 38, 952–978. [Google Scholar] [CrossRef]
- Moughtin, C. Urban Design: Street and Square; Butterworth Architecture: Oxford, UK, 1992. [Google Scholar]
- Carmona, M. Public Places—Urban Spaces: The Dimensions of Urban Design; Architectural Askews and Holts: Preston, UK, 2010. [Google Scholar]
- Nassar, U.; Saleh, A.; Fathi, A. Urban Sustainability and connectivity in gated communities in Cairo, Egypt. In Proceedings of the Conference: Contemporary Urban Issues Conference (CUI’13)—DAKAM, Istanbul, Turkey, 4–6 November 2013. [Google Scholar]
- Ewing, R.; Hajrasouliha, A.; Neckerman, K.M.; Purciel-Hill, M.; Greene, W. Streetscape Features Related to Pedestrian Activity. J. Plan. Educ. Res. 2016, 36, 5–15. [Google Scholar] [CrossRef]
- Agency, C.I. Maps-Iraq. Available online: https://www.cia.gov/resources/map/iraq/ (accessed on 22 August 2023).
- Zlatkovic, M.; Zlatkovic, S.; Sullivan, T.; Bjornstad, J.; Kiavash Fayyaz Shahandashti, S. Assessment of effects of street connectivity on traffic performance and sustainability within communities and neighborhoods through traffic simulation. Sustain. Cities Soc. 2019, 46, 101409. [Google Scholar] [CrossRef]
- VTPI. Roadway Connectivity: Creating More Connected Roadway and Pathway Networks; Victoria Transport Policy Institute_(VTPI): Victoria, BC, Canada, 2017; Available online: https://www.vtpi.org/ (accessed on 9 October 2022).
- Tasic, I.; Zlatkovic, M.; Martin, P.T.; Porter, R.J. Street Connectivity Versus Street Widening: Impact of Enhanced Street Connectivity on Traffic Operations in Transit-Supportive Environments. Transp. Res. Rec. 2015, 2494, 57–68. [Google Scholar] [CrossRef]
- Gul, Y.; Sultan, Z.; Jokhio, G.A. Contribution to the Environmental Sustainability by Improving the Walking Behaviour through Neighbourhoods’ Design with Special Reference to Developing Countries; E3S Web of Conferences: Les Ulis, France, 2020; EDP Sciences; Volume 158, p. 02002. [Google Scholar]
- Gul, Y.; Sultan, Z.; Moeinaddini, M.; Jokhio, G.A. The effects of physical activity facilities on vigorous physical activity in gated and non-gated neighbourhoods. Land Use Policy 2018, 77, 155–162. [Google Scholar] [CrossRef]
- Brown, B.B.; Yamada, I.; Smith, K.R.; Zick, C.D.; Kowaleski-Jones, L.; Fan, J.X. Mixed land use and walkability: Variations in land use measures and relationships with BMI, overweight, and obesity. Health Place 2009, 15, 1130–1141. [Google Scholar] [CrossRef]
- Frank, L.D.; Pivo, G. Relationships between Land Use and Travel Behavior in the Puget Sound Region; Washington State Transportation Commission: Washington, DC, USA, 1994. [Google Scholar]
- Frank, L.D.; Schmid, T.L.; Sallis, J.F.; Chapman, J.; Saelens, B.E. Linking objectively measured physical activity with objectively measured urban form: Findings from SMARTRAQ. Am. J. Prev. Med. 2005, 28, 117–125. [Google Scholar] [CrossRef] [PubMed]
- Likert, R. A technique for the measurement of attitudes. Arch. Psychol. 1932, 22, 55. [Google Scholar]
- Hillier, B.; Hanson, J. The Social Logic of Space; Cambridge University Press: Cambridge, UK, 1984; pp. 103–109. [Google Scholar]
- Hillier, B.; Burdett, R.; Peponis, J.; Penn, A. Creating life: Or, does architecture determine anything? Archit. Comport. /Archit. Behav. 1986, 3, 233–250. [Google Scholar]
- Song, Y.; Merlin, L.; Rodriguez, D. Comparing measures of urban land use mix. Comput. Environ. Urban Syst. 2013, 42, 1–13. [Google Scholar] [CrossRef]
- Sung, H.; Lee, S. Residential built environment and walking activity: Empirical evidence of Jane Jacobs’ urban vitality. Transp. Res. Part D Transp. Environ. 2015, 41, 318–329. [Google Scholar] [CrossRef]
Disclaimer/Publisher’s Note: The statements, opinions and data contained in all publications are solely those of the individual author(s) and contributor(s) and not of MDPI and/or the editor(s). MDPI and/or the editor(s) disclaim responsibility for any injury to people or property resulting from any ideas, methods, instructions or products referred to in the content. |
© 2023 by the author. Licensee MDPI, Basel, Switzerland. This article is an open access article distributed under the terms and conditions of the Creative Commons Attribution (CC BY) license (https://creativecommons.org/licenses/by/4.0/).