Article

The Biffis Canal Hydrodynamic System Performance Study of Drag-Dominant Tidal Turbine Using Moment Balancing Method

The School of Mechanical and Aerospace Engineering, Nanyang Technological University, 50 Nanyang Avenue, Singapore 639798, Singapore
*
Author to whom correspondence should be addressed.
Sustainability 2023, 15(19), 14187; https://doi.org/10.3390/su151914187
Submission received: 6 August 2023 / Revised: 8 September 2023 / Accepted: 20 September 2023 / Published: 25 September 2023
(This article belongs to the Special Issue Computational Fluid Dynamics Simulation: Application in Industries)

Abstract

:
Drag-dominant tidal turbine energy holds tremendous clean energy potential but faces significant hurdles as unsuitability of the actuator disc model due to the varying swept blockage area, unaccounted bypass flow downstream interaction, and rotor parasitic drag, whereas blade element momentum theory is computably effective for majorly 3-blade lift-dominated aerofoil. This study validates a novel method to find the optimal TSR of any turbine with a cost-effective and user-friendly moment balancing algorithm to support robust tidal energy development. Performance analysis CFD study of Pinwheel and Savonius tidal turbines in a Biffis canal hydrodynamic system was carried out. Thrust and idle moment are analyzed as functions of only inlet fluid velocity and rotational speed, respectively. These relationships were verified through regression analysis, and the turbines’ net moment equations were established based on these parameters. In both simulation models, rotational speed and inlet velocity were proved excellent predictor variables (R2 value ≈ 1) for idle and thrust moments, respectively. The optimal TSR values for Pinwheel and Savonius turbines were 2.537 and 0.671, respectively, within an acceptable error range for experimental validation. The optimal basin efficiency (ηopt, TSR) values for Pinwheel and Savonius in the 12% blockage channel were (29.09%, 4.0) and (25.67%, 2.87), respectively. The trade-off between TSRopt and ηopt is the key instruction concerning electricity generation and environmental impact.

1. Introduction

The potential of tidal energy as a reliable source of energy has been identified as a means of providing economic relief to communities located near coastlines or tidal channels. This sustainable energy source has the capacity to generate more than 130,000 terawatt-hours of electricity per year [1]. By utilizing smart grid infrastructure, the energy generated from tidal and wave technologies can be used to power residential, commercial, and tourism sectors, with the potential to meet 10% of the EU’s power demand by 2050 [2]. For this purpose, drag-dominated tidal turbines (DDTTs) with simpler geometries and lower flow velocities are ideal for deployment in slow water currents. These turbines include axial or crossflow turbines with a horizontal or vertical axis of rotation, respectively. Optimized performance of such turbines reduces maintenance requirements by identifying and addressing potential performance issues, such as fatigue, wear, cavitation, or excessive loads throughout the lifespan of tidal turbines. In this study, Pinwheel and Savonius are selected as two typical examples of turbines.
To optimize the design of a small horizontal axis wind turbine for low wind speed areas [3], the BEM theory was applied through the Qblade software (v0.6) and MATLAB (R2023a) script. Ref. [4] conducted experimental evaluations of Pinwheel rotors with different cutting styles in a wind tunnel and found that as the number of blades increases, the tip speed ratio (TSR) decreases, and the coefficient of power (Cp) is maximum for the 4-bladed rotor. Ref. [5] compared the performances of eleven different configurations of Pinwheel wind turbines using computational fluid dynamics (CFD) simulations and the Weibull distribution. Their findings suggest that an optimal TSR of 5.5, with a cut-in and cut-off speed of 1.65 m/s and 12.5 m/s, respectively, can be achieved. Ref. [6] discovered that the 2-bladed single-stage Savonius tidal turbine exhibited the highest power coefficient in experimental comparisons with those possessing 3 or 4 blades. Refs. [7,8] performed experimental investigations in a wind tunnel that verified an inverse correlation between performance and the overlap ratio, which denotes the proportion of the turbine blade overlap area to the total blade swept area. Refs. [9,10,11] investigated hydrodynamic turbine rejection load under different front or rear guide vanes in high blockage pipe flow model through entropy production theory.
To balance the computational cost, time, and accuracy, various simulation techniques for turbomachinery simulation were developed. The actuator disc model, which assumes the presence of a rotating virtual disc with or without porous holes perpendicular to the inflow direction around the rotor [12], is found not suitable for use with vertical-axis turbines due to the varying sweep area of the rotor plate [13] and the unsteady effect of the unaccounted bypass flow interaction on the downstream wake for horizontal-axis turbines [14]. Furthermore, it does not account for parasitic drag on the rotor and support walls in both turbine configurations [15]. The blade element momentum (BEM) theory, which is computationally effective for lift-dominated aerofoils [16], is found unsuitable for drag-dominated hydrofoils that are not always NACA-series type [17]. Commercial solvers like Ansys Fluent utilize expensive and labor-intensive models to optimize turbine design by coupling them with complex mathematical programming for flow simulations. However, this approach increases the complexity of the numerical solution, while the experimental validation for tidal turbines is a challenge for authors, as the required apparatus is significantly more expensive compared to wind tunnel equipment.
This study studies a supplementary moment balancing algorithm [18] that integrates cost-effectiveness and user-friendliness as the fundamental theory for performance optimization in tidal turbines. The research presents two-moment definitions, along with their mathematical derivation, focusing on moment values concerning the actuator disc model. The proposed moment definitions are internally and externally validated in relation to flow speed (U1) and rotational speed (ω). The study incorporates the moving reference frame (MRF) into the computational fluid dynamics (CFD) hydrodynamic system to determine the optimal power coefficient and operating conditions. Experimental and numerical validation is performed, and the wake flow velocity distribution is visualized to conduct a comprehensive channel parametric study. This investigation encompasses wake decay length (WDL), blockage effect, and channel efficiency in a restricted area of the tidal turbine.
This research contributes two significant insights: firstly, it assesses the tidal turbine’s ability to effectively harness kinetic energy from the flow in the channel and identifies the downstream extent of wake decay before the upstream velocity is restored. These factors serve as crucial indicators for evaluating the environmental and ecological sustainability of tidal turbines. Secondly, the algorithm provides preliminary results to aid engineers in comprehending the optimization process by selecting the most suitable computational technique. The proposed approach utilizes steady and k-ε turbulence models, which are efficient for 3-D CFD models on standard laptops. Consequently, the algorithm considerably reduces the computational costs associated with testing various tidal turbine designs by presenting a sustainable numerical computational method.

2. Methodology

2.1. Numerical Model Development

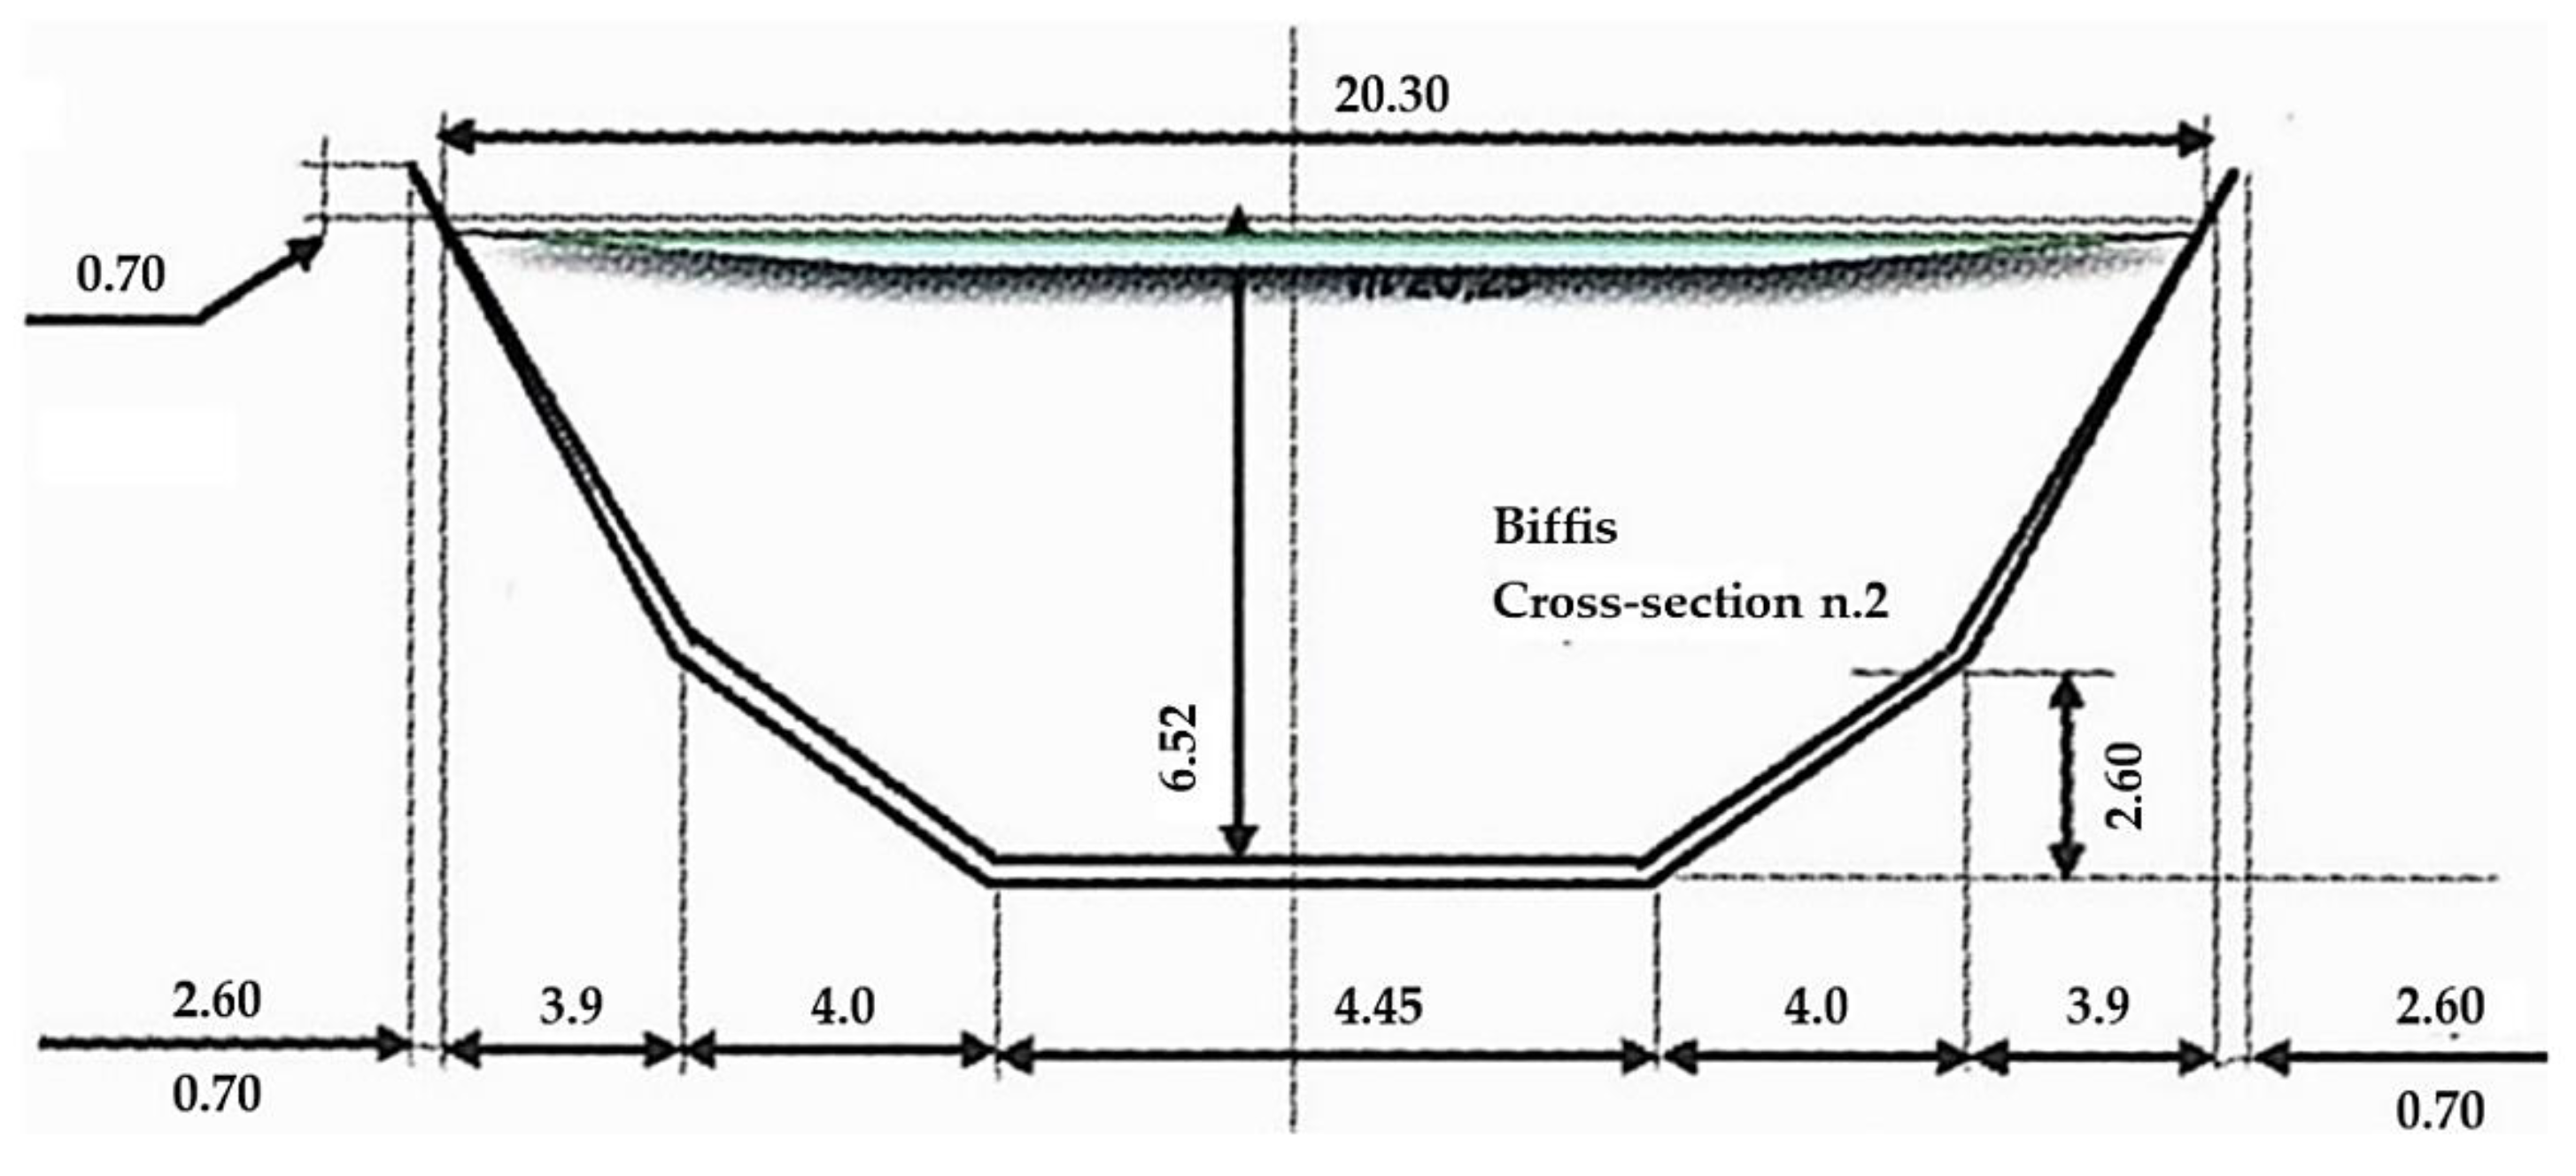
The previous study tested the rectangular channels with seawater continua for Pinwheel and Savonius turbines [18]. The geometries of the Pinwheel and Savonius turbines were developed using SolidWorks and subsequently imported into the Star-CCM+ platform. A similar method was also investigated through the real channel case by comparing the optimal hydraulic turbine array alignment while maintaining the same blockage [19]. For further investigation, a double-trapezoid cross-section channel retrieved from Malini (Figure 1) concerning the rotors being tested by HE Powergreen S.r.l. in the Biffis canal in Bussolengo, Italy, was used to perform simulations under the same continua and position with the previous study. The channel’s cross-section view and scales are summarised in Figure 2. This study planned to change the surrounding walls shape and surface boundary conditions (BCs) to validate the moment balancing method with actual environmental impact investigation.

2.2. Mesh in CFD Simulation

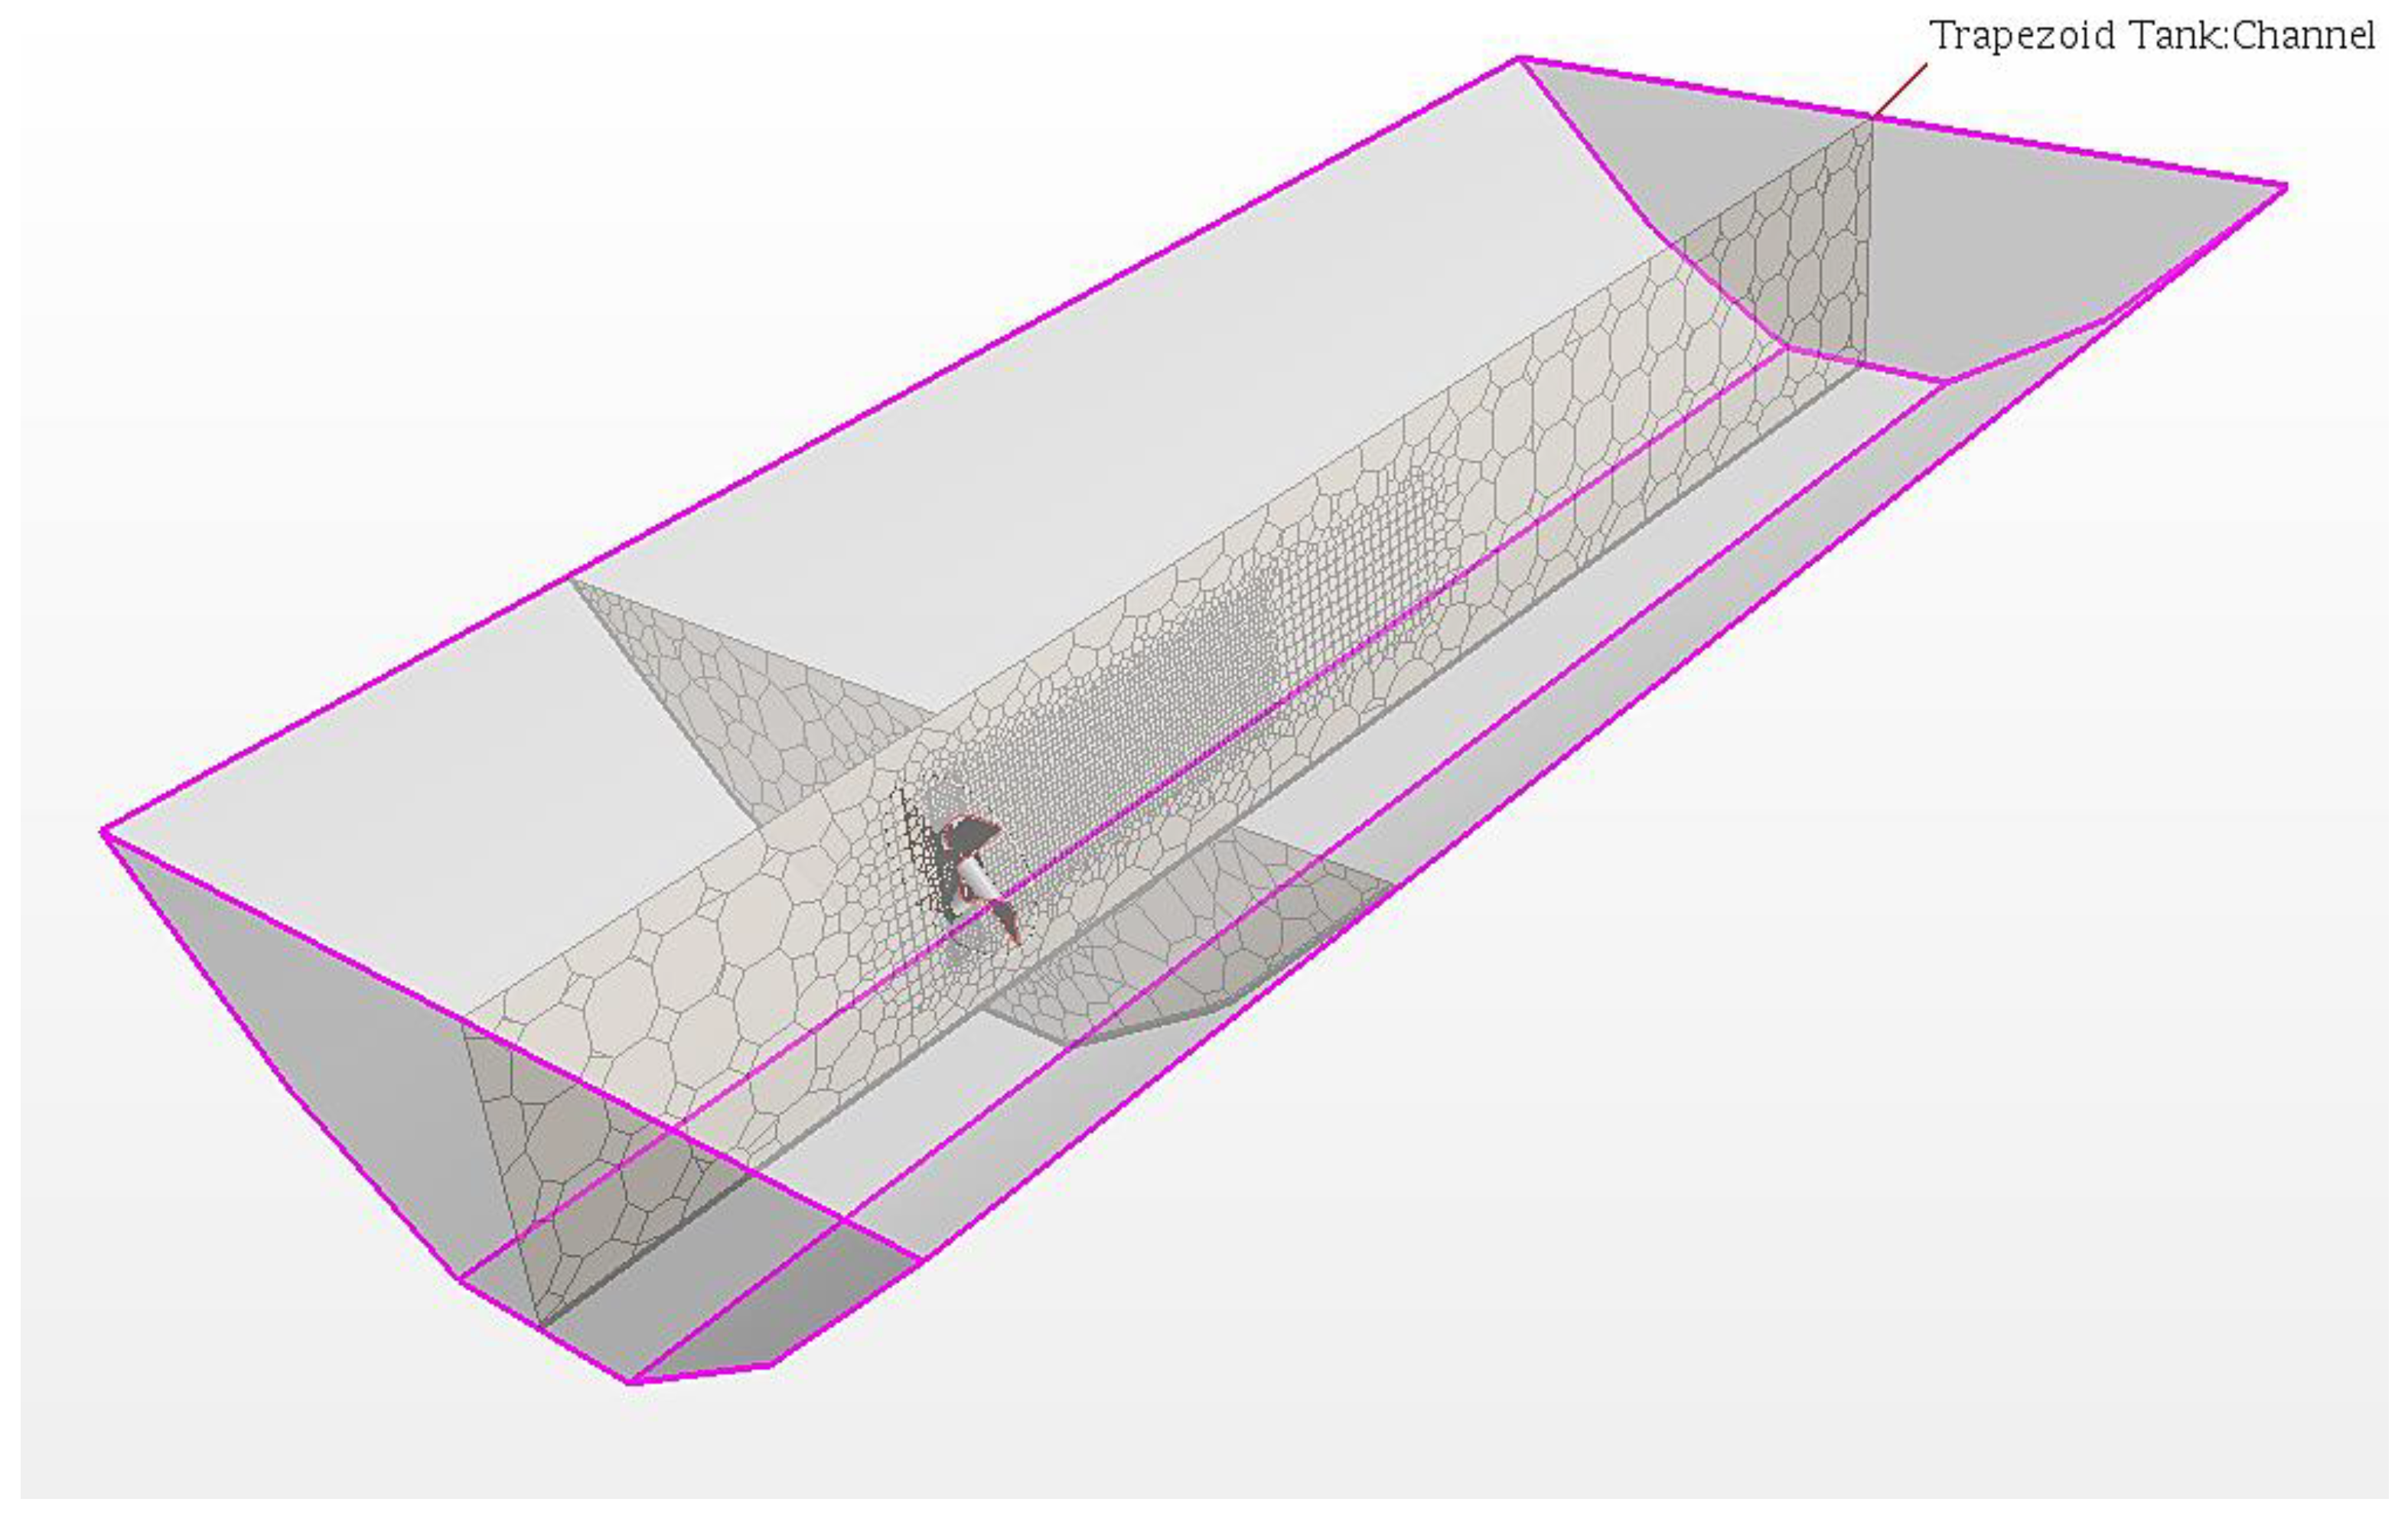
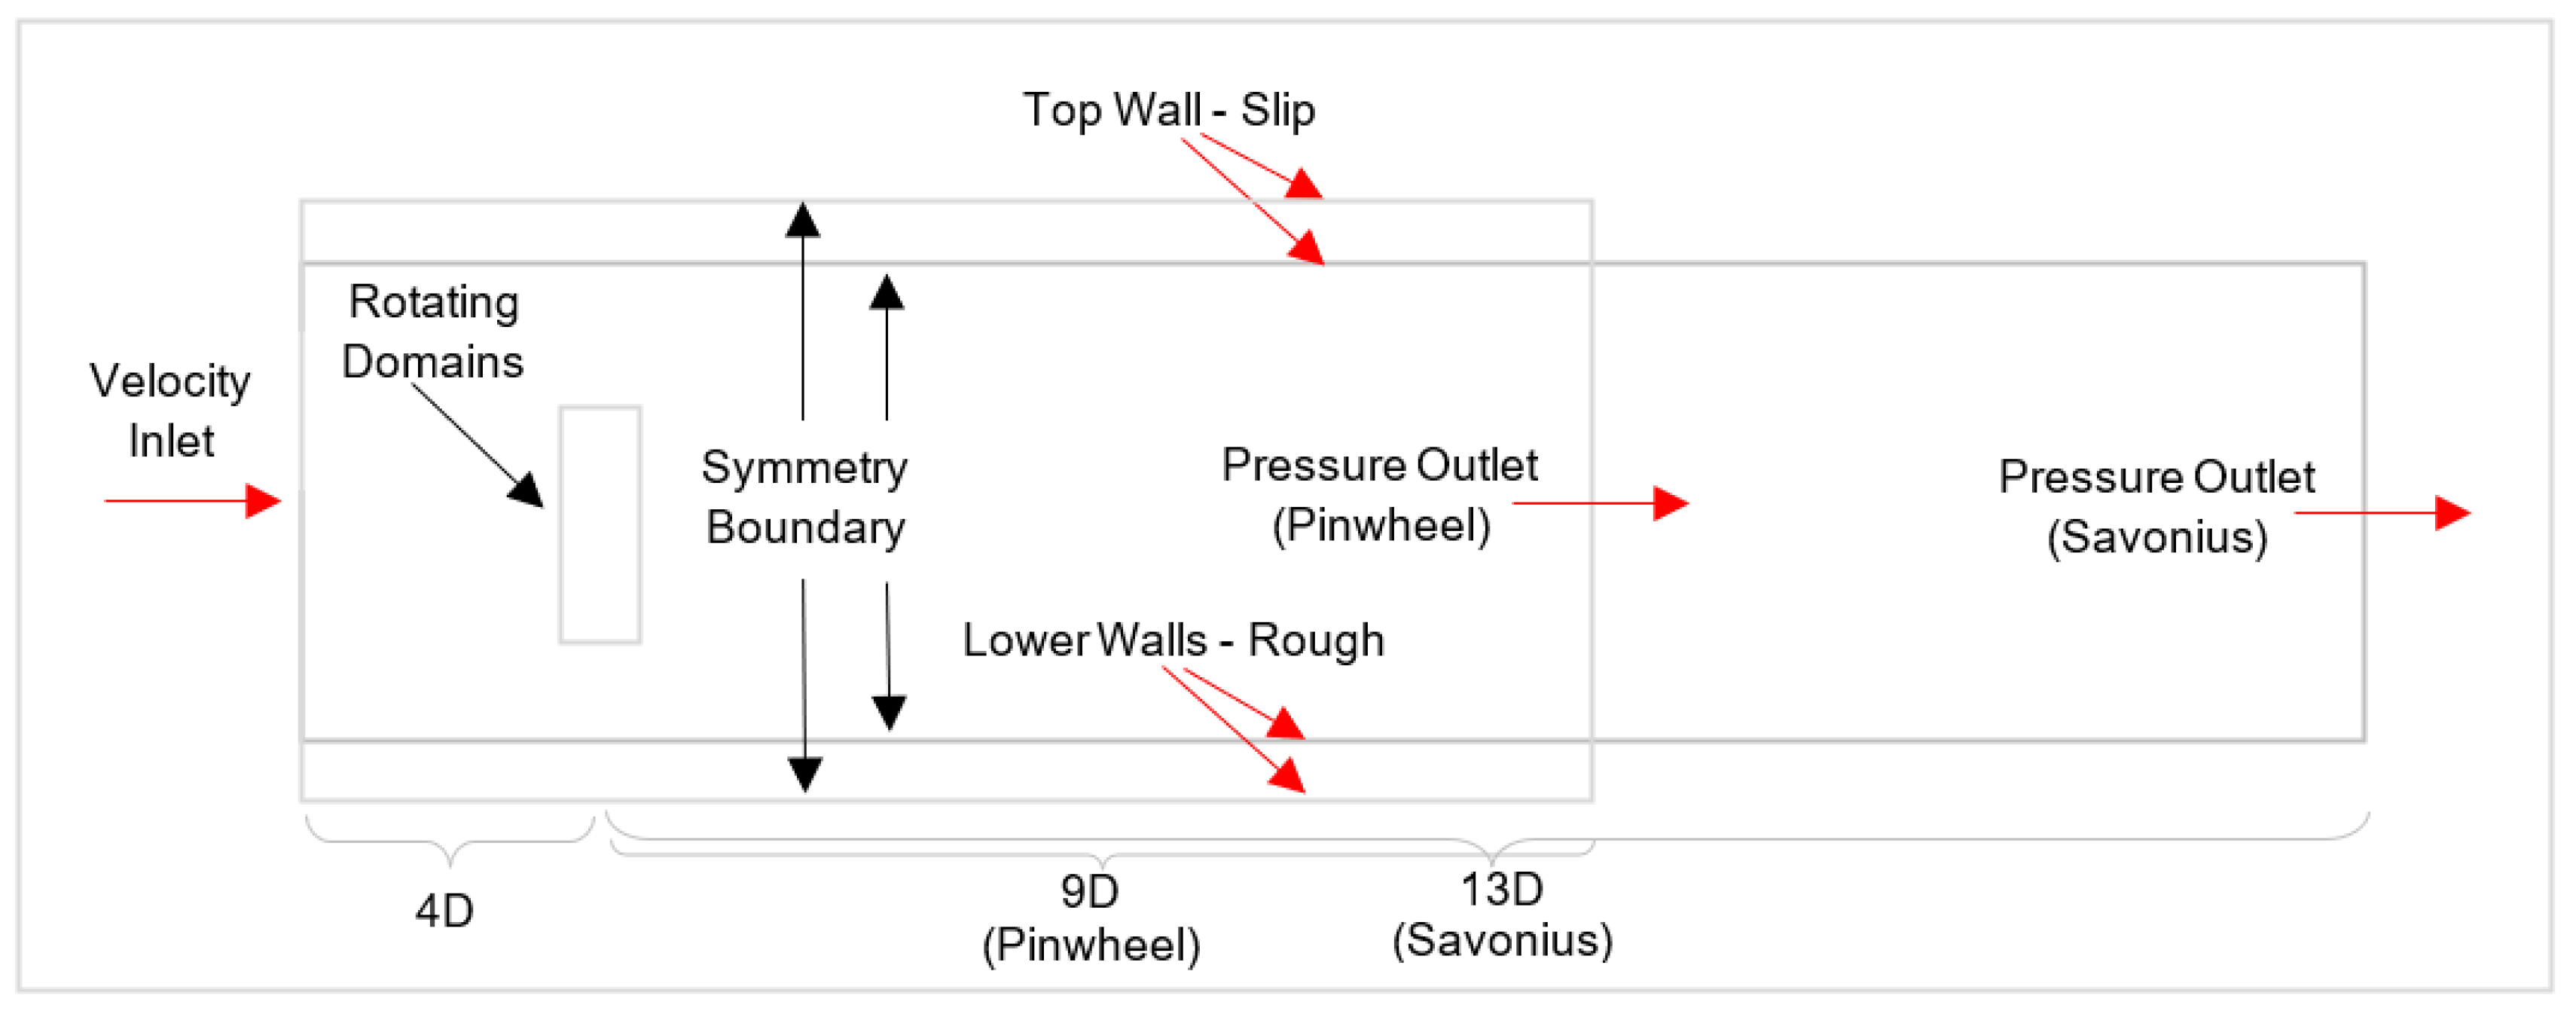
It is important to highlight that the flow domain for the Savonius turbine was designed with a longer downstream length of 13D (Rotor Diameter), whereas the Pinwheel turbine had a downstream length of 9D. The entire channel was 6:1, scaling down from the real channel scale for the convenience of saving meshing memory and parametric study. This design decision was made to ensure the achievement of a fully extended vortex for the Savonius turbine, given that its wake decay length is longer compared to that of the Pinwheel turbine [22,23,24,25,26]. The grid size of the trapezoid-profile tank was gradually refined into a smaller size of 2D × 2D × 4.5H and D × D × 2H cuboid (H is the rotor height), using a gradient mesh refinement approach at 60% and 30% of the grid base size (0.0822 m), respectively. The refinement process continued until it reached the Pinwheel/Savonius rotor plate at 5% of the base size. The domains have been showed in Figure 3 below.
Ref. [18] utilised the Savonius blade and channel area from [27] to calculate the blockage and aspect ratio with their definition equation shown as Equations (1) and (2). The aspect ratio is defined as the ratio of channel width to channel height, and the blockage ratio is the ratio of the rotor blades’ sweep area to the channel cross-section area. Maintaining the same aspect ratio value from this study was necessary for the dimensionless operation so that further modelling setup and simulation are conducted without the channel size and turbine blockage’s parameter’s impact. This study investigated the models by multiplying the Savonius turbine’s blade radius by a factor of 3.58 for an equal blade and channel area to Pinwheel’s. To maintain the same blockage and aspect ratio of 0.12 and 1.85, respectively, the blade and channel area for the Pinwheel and Savonius turbines remained constant at 0.283 m2 and 2.358 m2, respectively.
Aspect   Ratio = Channel   Width   =   0.600   m Channel   Height   =   0.325   m = 1.85
Blockage   Ratio = Blade   Area = 0.022   m 2 Channel   Area = 0.195   m 2 = 0.12
The downstream velocity fields are plotted under different TSRs to observe the blockage effect [27]. Experimental studies and numerical simulations were conducted to determine the optimal performance characteristics of a miniature Savonius turbine operating in a water channel with a low in-flow velocity of 0.5 m/s. The study revealed that the optimal TSR of 0.7 achieved the highest maximum power coefficient (Cp) value of 0.23. The 2 mm sheet thickness was implemented based on [28]. The scales of the two models are summarized in Table 1.
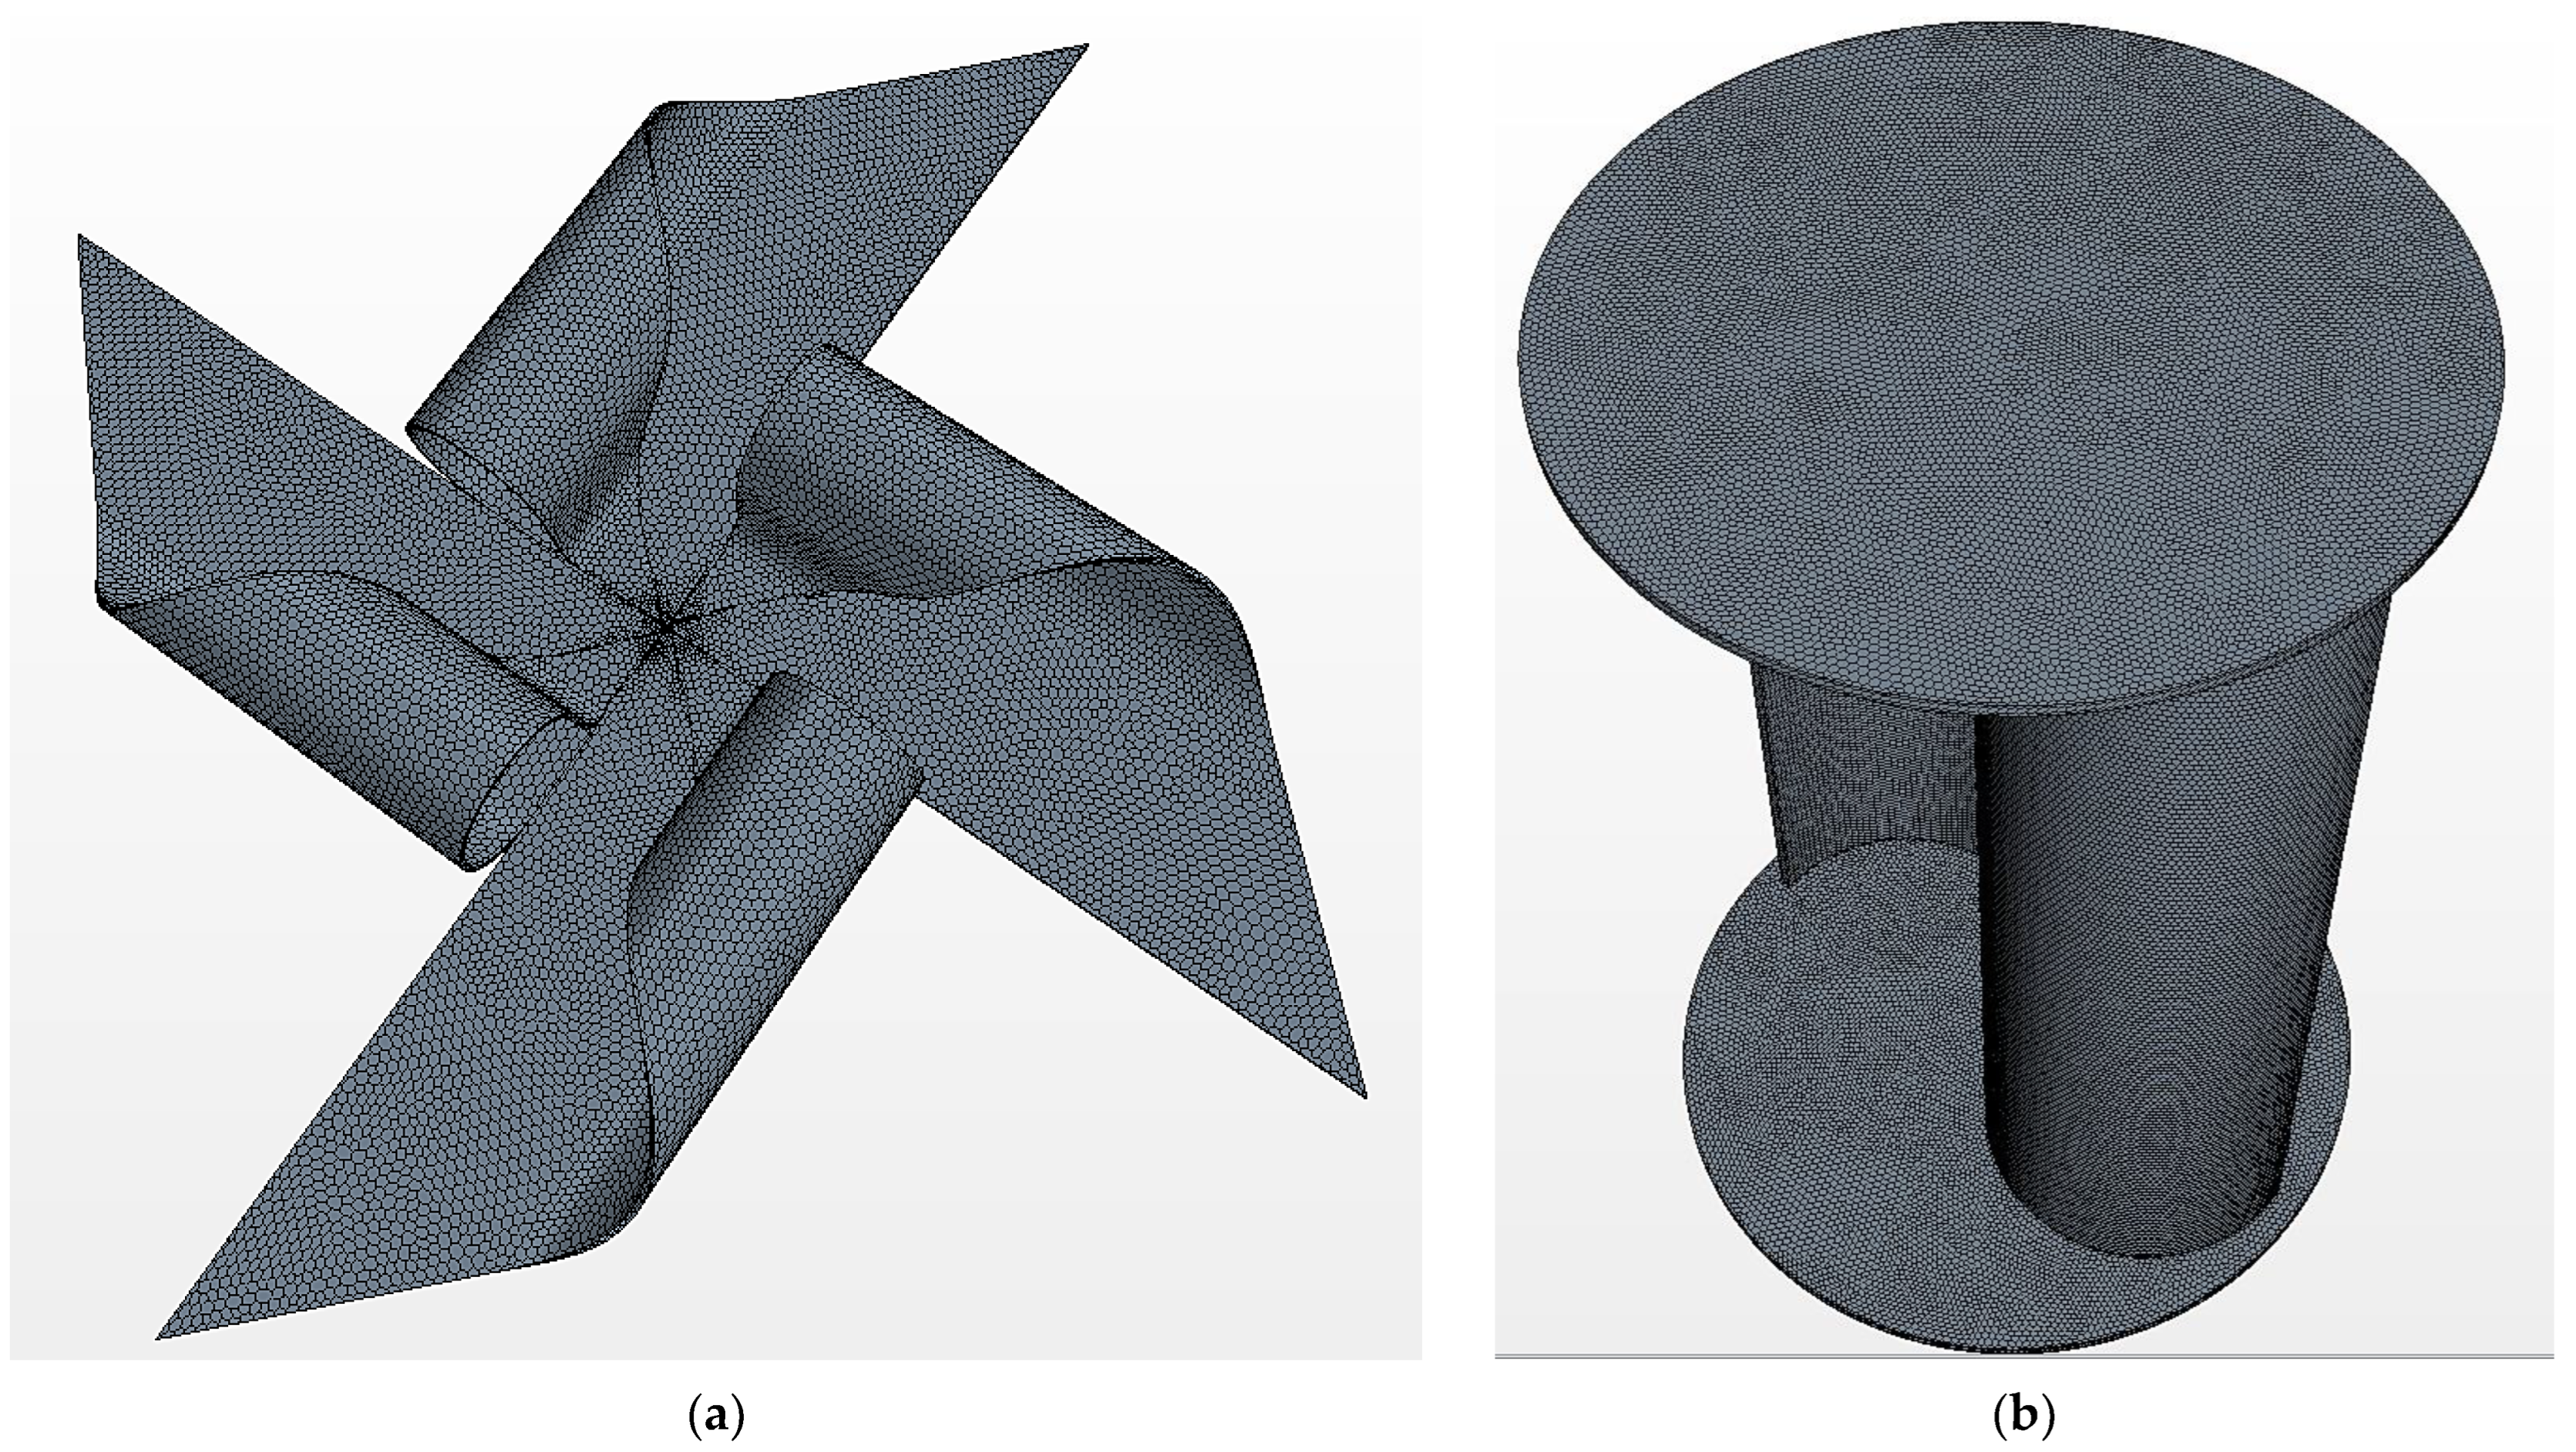
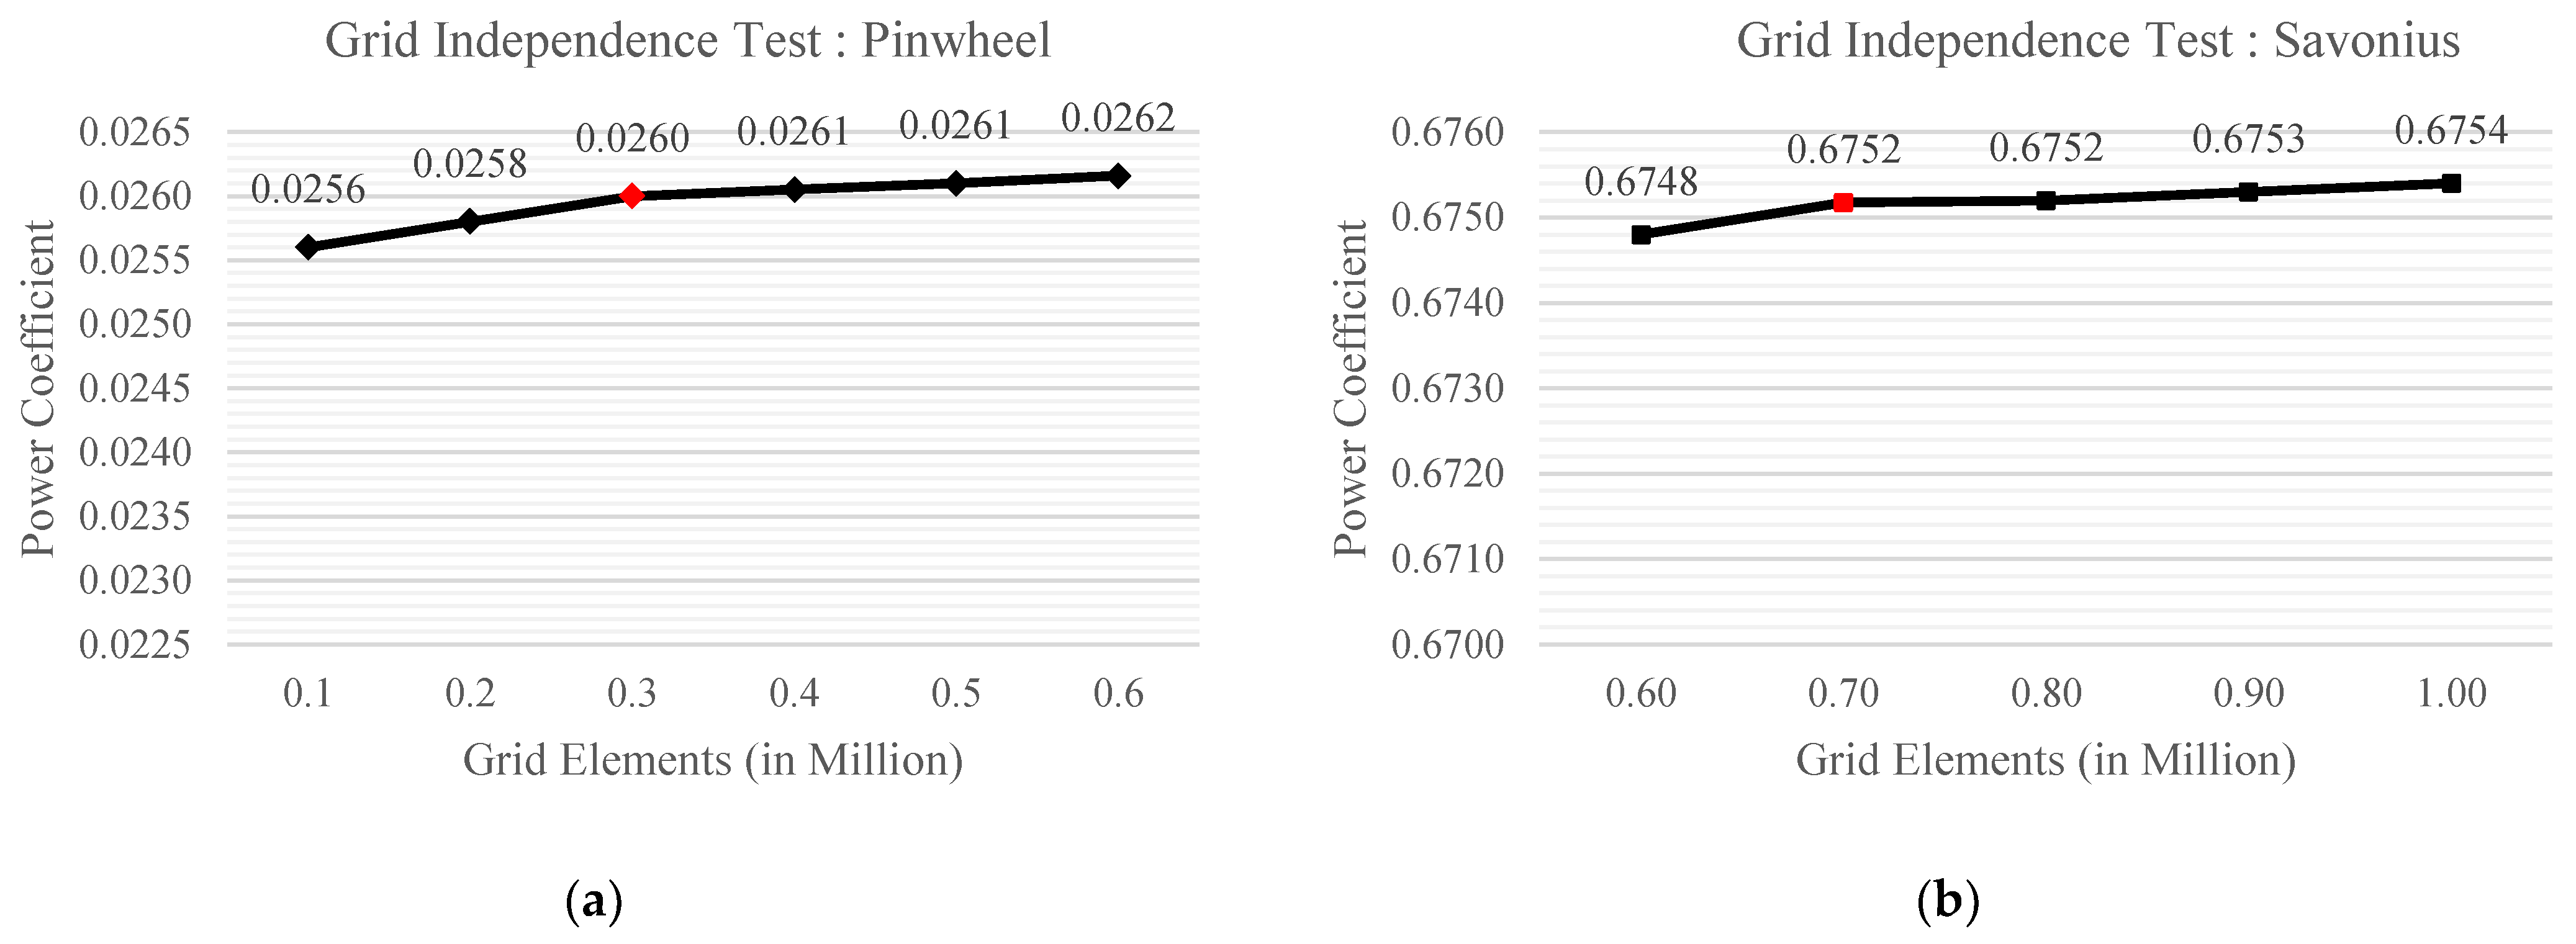
The volume mesh overview and cross-sectional views are shown in Figure 4 and Figure 5, respectively. For the Pinwheel turbine, a grid number of 277,793 cells was selected based on a fluid velocity of 0.8 m/s, rotational velocity of 8.0 rad/s, and TSR of 2.58. For the Savonius turbine, a grid number of 679,092 cells was selected based on a fluid velocity of 0.54 m/s, rotational velocity of 5.75 rad/s, and TSR of 0.63. The grid independence tests are shown in Figure 6. Fluid temperature for Savonius and Pinwheel simulation is assumed at the default value of 25 °C with seawater densities of 1025 kg/m3, respectively. k-ε turbulence steady-state segregated solver with continuity criterion set to residuals of magnitude 10−3 was selected for both models. This consistent choice aids in the comparison of the Cp-TSR performance curve simulation findings.
As shown in Figure 6, a grid independence test was conducted for both turbines. The Pinwheel turbine was tested under a rotational speed of 8.0 rad/s with a fluid velocity of 0.8 m/s (TSR = 2.58), while the Savonius turbine was tested under a rotational speed of 5.25 rad/s with a fluid velocity of 0.67 m/s (TSR = 0.46). The aim was to evaluate the sensitivity of the simulation results to changes in grid size and refinement level. The simulation results showed mild variations across different grid numbers for both turbines. This indicated acceptable numerical stability and convergence for this model setup. Consequently, the results suggested selecting a minimum grid resolution of 0.3 million grids for the Pinwheel turbine and 0.7 million grids for the Savonius turbine for the subsequent simulations. The grid number choice has been showed as red dots in Figure 6a,b. These choices allow us to meet accuracy requirements while minimizing computational costs.

2.3. Domain and Boundary Conditions

To ensure accurate analysis results, adjustments were made to the dimensions of the inlet, outlet, and surrounding walls of the stationary region. These adjustments aimed to facilitate the complete development of upstream and downstream flow while avoiding any influence on the analysis outcomes. Both the inlet and outlet boundaries were positioned upstream and downstream from the centroid of the turbine system. The side walls were assigned a symmetry boundary condition, and the top and bottom walls were assigned as slip and non-slip (rough) wall boundary conditions, respectively. These settings are intended to replicate the conditions of the Biffis canal watershed, thereby ensuring further simulation purposes. Throughout all flow simulations, seawater was considered as the working fluid. Figure 7 depicts the lateral view of the computational flow domain. The fluid domain was created on a 3-D scale and divided into a stationary region and a rotating domain, which housed the Pinwheel and Savonius turbine [29]. The left-side wall of the static domain, serving as the inlet, adopts a velocity boundary condition. Here, initial conditions (ICs) are specified within a predetermined range to govern the velocity parameters. This approach facilitates the integration of the MRF (moving reference frame) method into the actuator disc model, enabling the simulation of computational fluid dynamics (CFD) models. To establish a seamless interface between the rotating and static domains, a sliding wall is defined, ensuring minimal friction between them. Throughout the simulation of Savonius and Pinwheel turbines, the fluid temperature is assumed to maintain default values at 25 °C, while the utilized seawater densities stand at 1025 kg/m3. In the rotating domain, the blade surfaces are uniformly subjected to the wall friction condition, with the implementation of an identical y+ hybrid wall function. As for the outlet, positioned at the right-side wall, it is set as a pressure outlet featuring a relative pressure of zero Pa.
For the surrounding walls of the channel, the upper part was set as a slip plane, where the fluid slid along the wall without any shear force, and the fluid velocity did not correspond to the wall velocity. This was used to simulate a calm lake surface while neglecting the fluid’s waves and wave equations. Hence, it remained a relatively low computational cost to resolve the entire boundary layer even if the grid is relatively coarse. The lower walls, including the slopes and seabed, were treated as wall friction BCs governed by the y + hybrid wall function, combining low-Reynolds number and high-Reynolds number wall functions based on the y + value. A rough plane with a roughness thickness of 0.02 was determined for the actual soil and vegetation on the seabed. The friction equations for the upper and lower walls are given as Equations (3) and (4), respectively.
v S l i p = v e x t ( { v } e x t · n ) · n
where the superscript “ext” indicates that the value is extrapolated from neighbouring grid cells within the domain. n = a a , where a represents the outward grid surface normal vector, and this correction ensures the consistency between the normal component of the wall’s fluid velocity and the grid flux.
v R o u g h + = 1 κ l n E f · y +
where the superscript “+” is regarding the dimensionless velocity v R o u g h + and dimensionless distance y + near the wall where the fluid velocity gradually increases with distance from the boundary surface, followed by logarithmic law relationship as Equation (4). The von Kármán constant κ = 0.42 , and the turbulence dissipation rate E = 0.9 were used for the present study. f is the roughness function, which can be expressed as Equation (5) [30]:
f = 1 f o r   R + R s m o o t h + B R + R s m o o t h + R r o u g h + R r o u g h + + C R + a f o r   R s m o o t h + < R + < R r o u g h + B + C R + f o r   R + > R r o u g h +
where a = s i n π 2 · l o g ( R + / R smooth + ) l o g ( R rough + / R smooth + ) . R + is determined by the Equivalent Sand-grain Roughness r times y + / y w a l l and is selected at 1.2 as an empirical value [31]. Other parameters are valued as B = 0 , C = 0.253 , R s m o o t h + = 2.25 , and R r o u g h + = 90 from the classical study’s suggestion [32].
In this study, the flow turbulence was described by the realizable k-epsilon with two-layer (RKE 2L) method for the simulations conducted in STAR-CCM+. The RKE 2L method determines the turbulence dissipation rate (ε) and turbulence viscosity (μt) as a function of the distance from the wall in the near-wall layer. These values are seamlessly integrated with the results obtained from solving the transport equations in regions away from the wall. The turbulent kinetic energy equation is solved throughout the entire fluid domain. To discretize and solve the mass and momentum integral conservation equations, the segregated solver is employed. Additional information about this solver can be found in the StarCCM+ user manual. Equation (6) provides the calculation of μt by combining the turbulence kinetic energy (k) and turbulence dissipation rate (ε).
μ t = ρ C μ f μ k 2 ε
where
  • C μ = Model coefficient, equal to 0.9 in RKE 2L;
  • f μ = Damping coefficient, equal to 1 in RKE 2L.
The k and ε are obtained from the following transport equations Equations (7) and (8), where the velocity and direction are derived along the x direction. In comparison to the classical k-epsilon model, the RKE 2L model supplemented the model constant with more precise parameters ( C 3 ε ) that account for the interaction between the turbulent boundary layer and the turbulent core. This leads to a more accurate description of the turbulent mixing layer, making it particularly suitable for rapid motion and high-viscosity fluid turbomachinery systems, such as those operating under idle moment conditions.
ρ k t + ρ k U i x i = x i μ + μ t σ k k x i + f c G k + G b ρ ε Υ M + S k
    ρ ε t + ρ ε U i x i = x i μ + μ t σ ε ε x i + C 1 ε ε C 2 ε ρ ε 2 k + U i ε + ε k C 3 ε G b + S ε
where
  • G k = Turbulent kinetic energy generation coefficient;
  • G b = Turbulence dissipation rate generation coefficient;
  • Υ M = Specific dissipation rate to turbulent kinetic energy ratio;
  • C 1 ε , C 2 ε , C 3 ε = Model constants, equal to max 0.43 , S k 5 ε + S k ; 1.9 and 1.0, respectively, in RKE 2L;
  • S k , S ε = User-defined source terms;
  • σ k , σ ε = Turbulent Prandtl numbers, equal to 1.0 and 1.2, respectively, in RKE 2L.
Then, as described later in the text, the net moment is defined under the assumption of rotating machinery reaching equilibrium and steadiness. In this scenario, the time-dependent terms in the turbulence model become negligible. Therefore, in our simulation model, we ultimately opt for the “steady flow + 2-layer realizable k-epsilon turbulence model” as the governing equations for fluid flow. In the discussion section, we also address the accuracy differences between the RKE 2L model and the k-omega turbulence model, ultimately opting for the RKE 2L model.

2.4. Moment Analysis Method

Previous works investigated moment analysis of a single turbine in either horizontal or vertical axis configuration by utilizing a fixed inlet flow speed scheme. The TSR ranges of this study follow a dynamic TSR matrix for the simulations as studied in [18]. In this study, the simulation algorithm aims to investigate the net moment of rotating machinery under different BCs, specifically the rotating speed and flow velocity. The net moment values obtained are then used to determine the equilibrium state of the turbine’s rotational motion, indicated by the net moment approaching zero. This neutral point of the net moment is proven to determine the optimal power coefficient Cp, opt, which is essential for assessing the turbine’s performance.
Furthermore, to calculate the useful power generated by the turbine (P = ω · M), it is necessary to establish a net moment balancing equation at the neutral point. At this point, the approximate zero net moment can be considered as the sum of the flow’s thrust moment (acting as positive torque) and the turbine’s rotation moment (acting as resistance). To facilitate this calculation, the positive torque is defined as the thrust moment, M T h r u s t U 1 , 0 , governed by thrust coefficient C T and fluid velocity U 1 . The resistance effect is summarized as the Idle moment, M I d l e 0 , ω , which is defined when the turbine is rotating at constant speed in still water hence, a load is exerted on the turbine. It is governed by the viscosity and centrifugal force of the fluid. The idle and thrust moments are functions of the boundary conditions, namely the rotational velocity ω and the fluid velocity U1, respectively. Mathematical derivations are presented below to demonstrate the feasibility of this algorithm within simulation systems.
Previous studies have documented the definition and composition of net torque in rotating machinery such as [33] studied the performance dependence of VAWTs on the moment of inertia in an unsteady wind tunnel, and proposed Equation (9) with the net angular momentum Δ L as a sum of torque of wind turbine τ w , brake τ B and load τ L .
Δ L = I d w d t = τ w τ B τ L
By applying the principle of conservation of angular momentum and assuming steady operation in Equation (10), the sum of the external moments Σ τ is zero as derived in Equation (10) or the form of moment balancing equation in Equation (11):
Σ τ = Δ L = τ w τ L + τ B = 0
M n e t , o p t U 1 , ω = M T h r u s t U 1 , 0 + M I d l e 0 , ω = 0
where the thrust moment is the torque generated by the wind turbine i.e., M T h r u s t = τ w and the idle moment is equal to the sum of the load torque and the braking torque i.e., M I d l e = τ L + τ B . In the case of the horizontal axis Pinwheel turbine, the simulation result finds that the braking torque τ B is zero, thus noted as M I d l e   . Table 2 illustrates the investigation of the three moments in the CFD simulation cases, leading to the situations described in the aforesaid definitions.
The mathematical expression of the idle and thrust moments with aspect to ω and U 1 is derived from the steady state and incompressible flow modified Navier–Stokes equations in the MRF form, containing the additional centrifugal force terms in the momentum conservation shown as Equation (12) [34]. The source term of the relative coordinate system is used to derive the expression of idle moment M I d l e on the rotor plate through integration as Equation (13). Hereby the M I d l e is linearly related to only the ω 2 as the product of force arm r and pressure difference p .
ρ U 1 t + U 1 2 U 1 = p + μ 2 U 1 + ρ ω 2 r + 2 ω U r o t a t i o n a l
M I d l e = ( p d A + τ d A ) d r
The thrust moment M T h r u s t will be calculated as Equation (14) which is the product of the thrust force and force arm. The Pinwheel and Savonius with different cross-section profiles are then derived as the corresponding form.
M T h r u s t = F T h r u s t · l = 1 2 ρ A C T U 1 2 × l = ρ π D 3 C T 16 · U 1 2     P i n w h e e l ρ a b C T 2 · U 1 2       S a v o n i u s
To summarise the algorithm of the moment balancing method, the turbine performance study will be simplified to find the value of net moment (targeting variables) close to zero on the corresponding TSR graph (x-axis values). This value represents the equilibrium state, and the corresponding TSR is considered the optimal TSR. Subsequently, the idle moment and thrust moment corresponding to this equilibrium state are calculated based on the rotational speed and inflow velocity. This information is then used to establish the moment balancing equation and calculate the useful power using Equation (15).
C p , opt = P useful P in = ω M Thrust / Idle 1 2 ρ A U 1 3
The two independent variables, i.e., U 1 and ω comprise a dynamic tip speed ratio (TSR) matrix using Equation (13), are shown for both turbines as Table 3 and Table 4. The turbine’s optimal TSR can be obtained by the Cp-TSR curve.
T S R = ω R U 1

3. Results and Discussion

3.1. Idle and Thrust Moment Relationship Quadratic with U 1 and ω

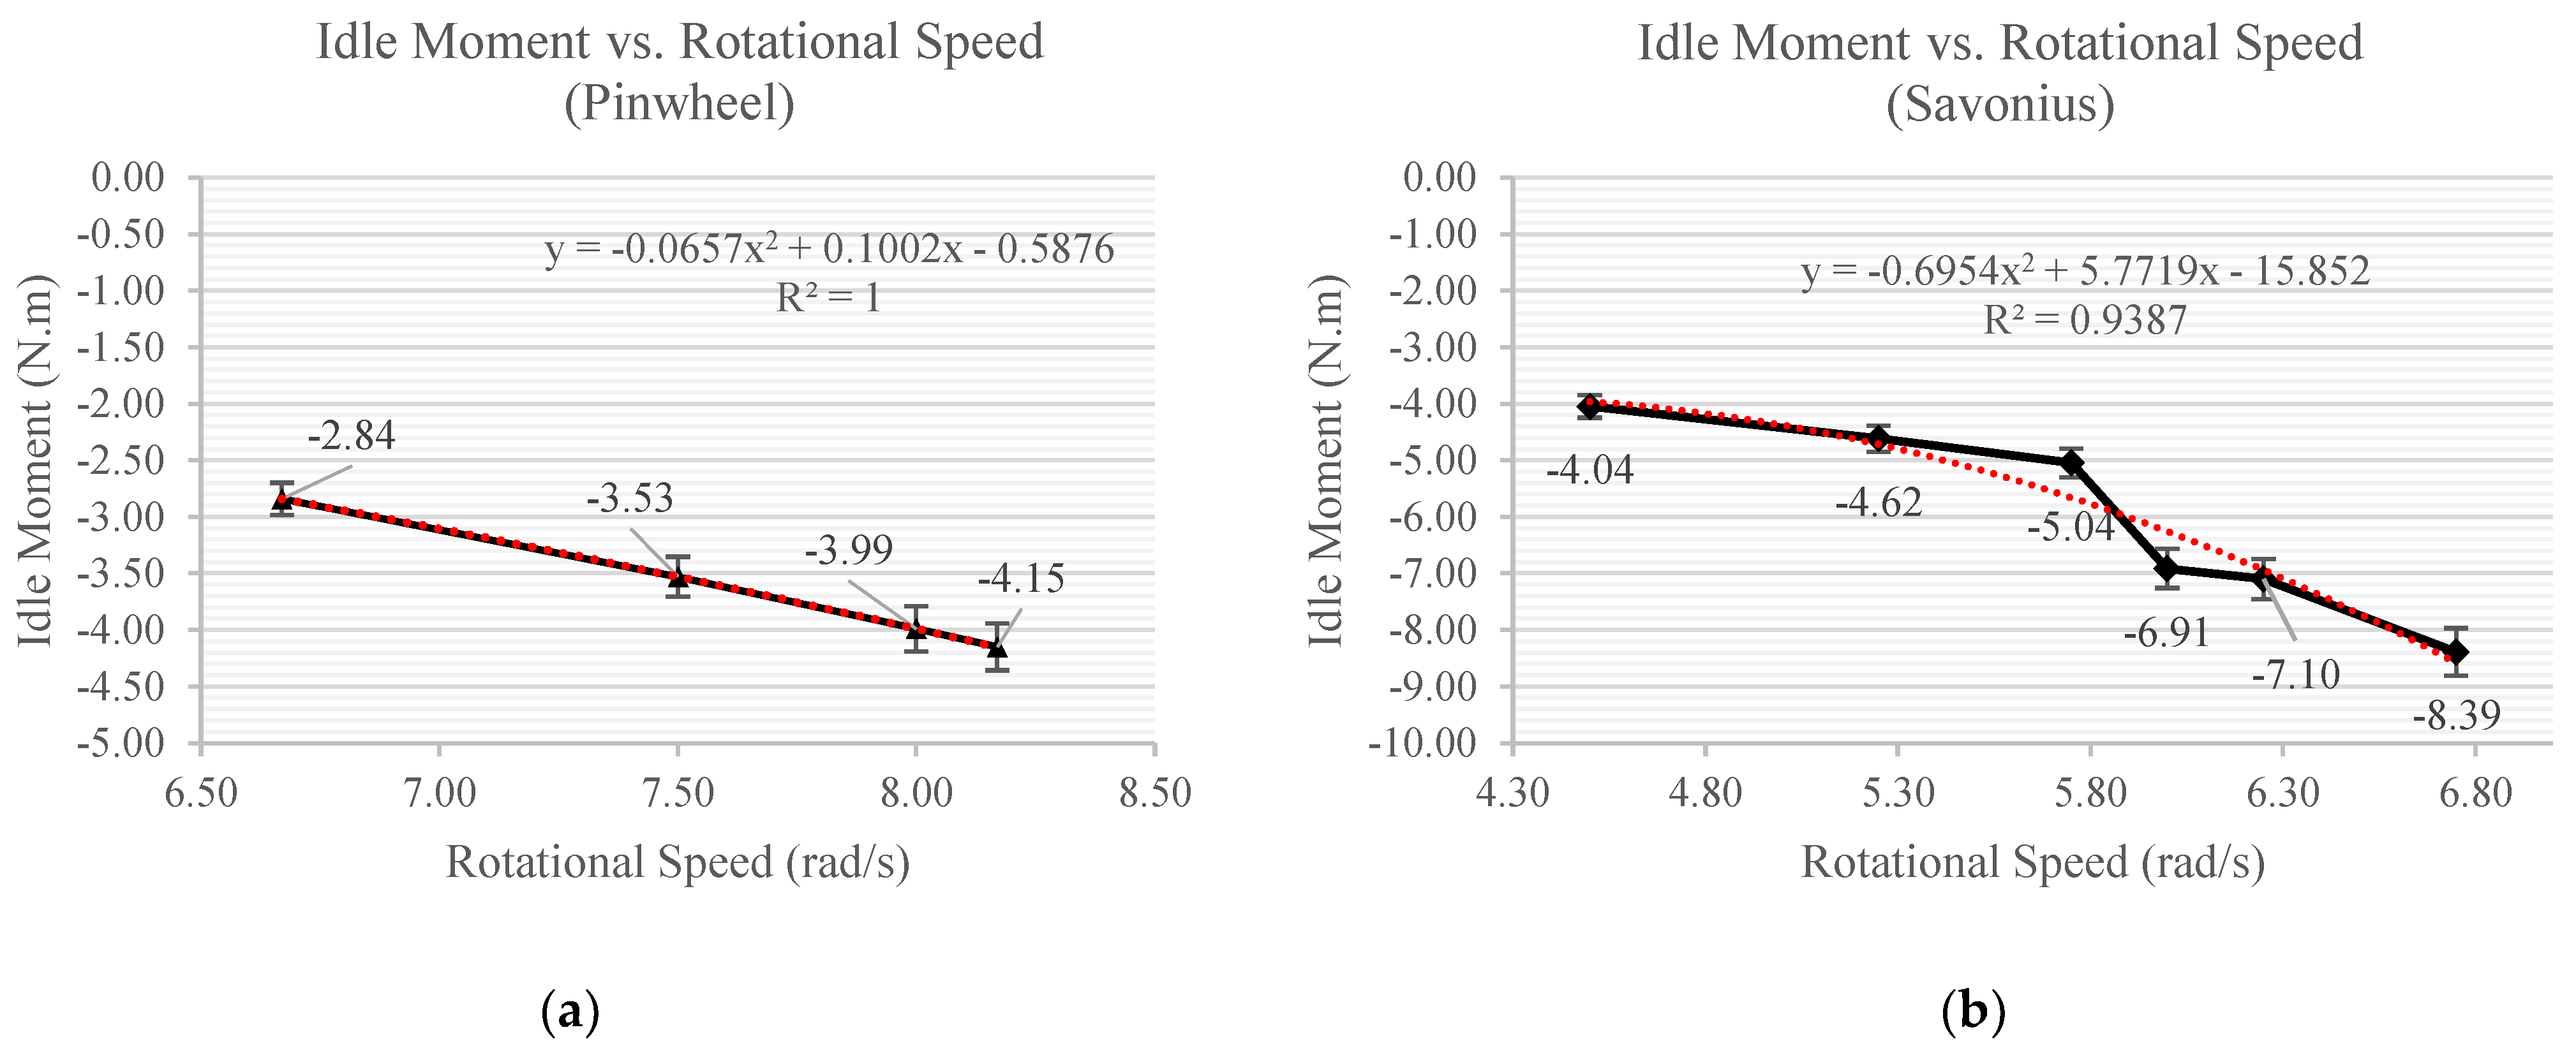
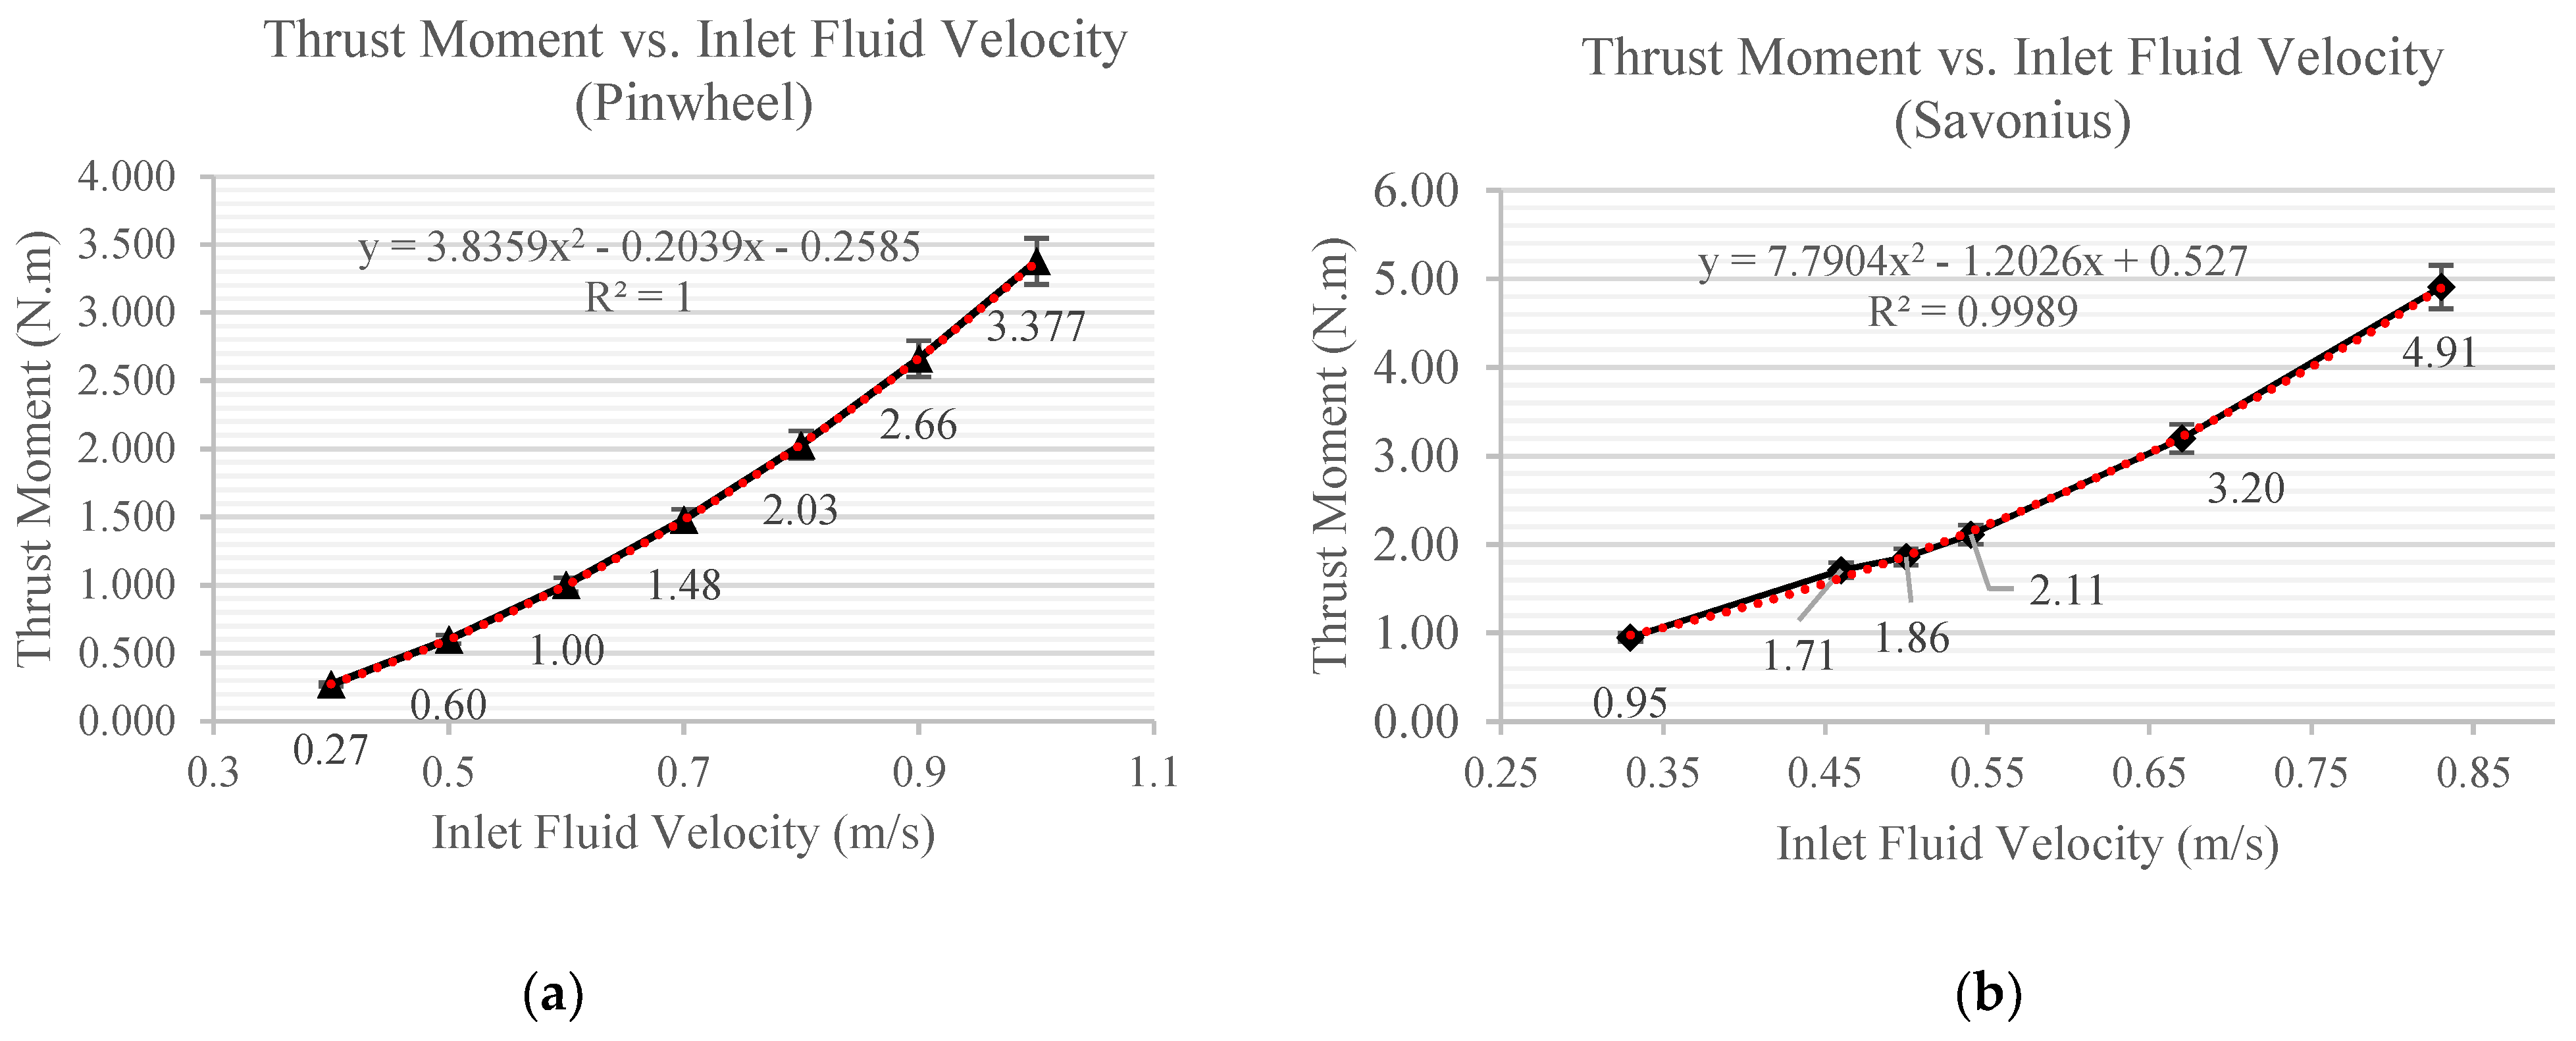
The validation results with aspect to idle and thrust moments relationship with the corresponding BCs ω and U 1 under the CFD simulation model aimed to prove the assumption and mathematic derivation in Section 2.4 and Equations (13) and (14). For internal validation of the simulation findings, regression analysis was performed for the idle and thrust moments with rotational speed and inlet fluid velocity as independent variables, respectively. Rotational speed and inlet velocity are found to be exceptional predictor variables, with R2 ≈ 1, for idle and thrust moments, respectively, in both models. The quadratic relationship between M i d l e ω and M T h r u s t U 1 is shown in Figure 8 and Figure 9, respectively.
The relationship between the three moments is visualized in Figure 10. It can be demonstrated that the idle moment exhibits minimal deviation from a constant value with the growth of TSR, whereas the thrust moment curve closely adheres to the shape of the net moment curve. The rotor’s balanced state is represented when the net moment is zero, that is, the neutral point of the simulation.

3.2. Cp vs. TSR Curve

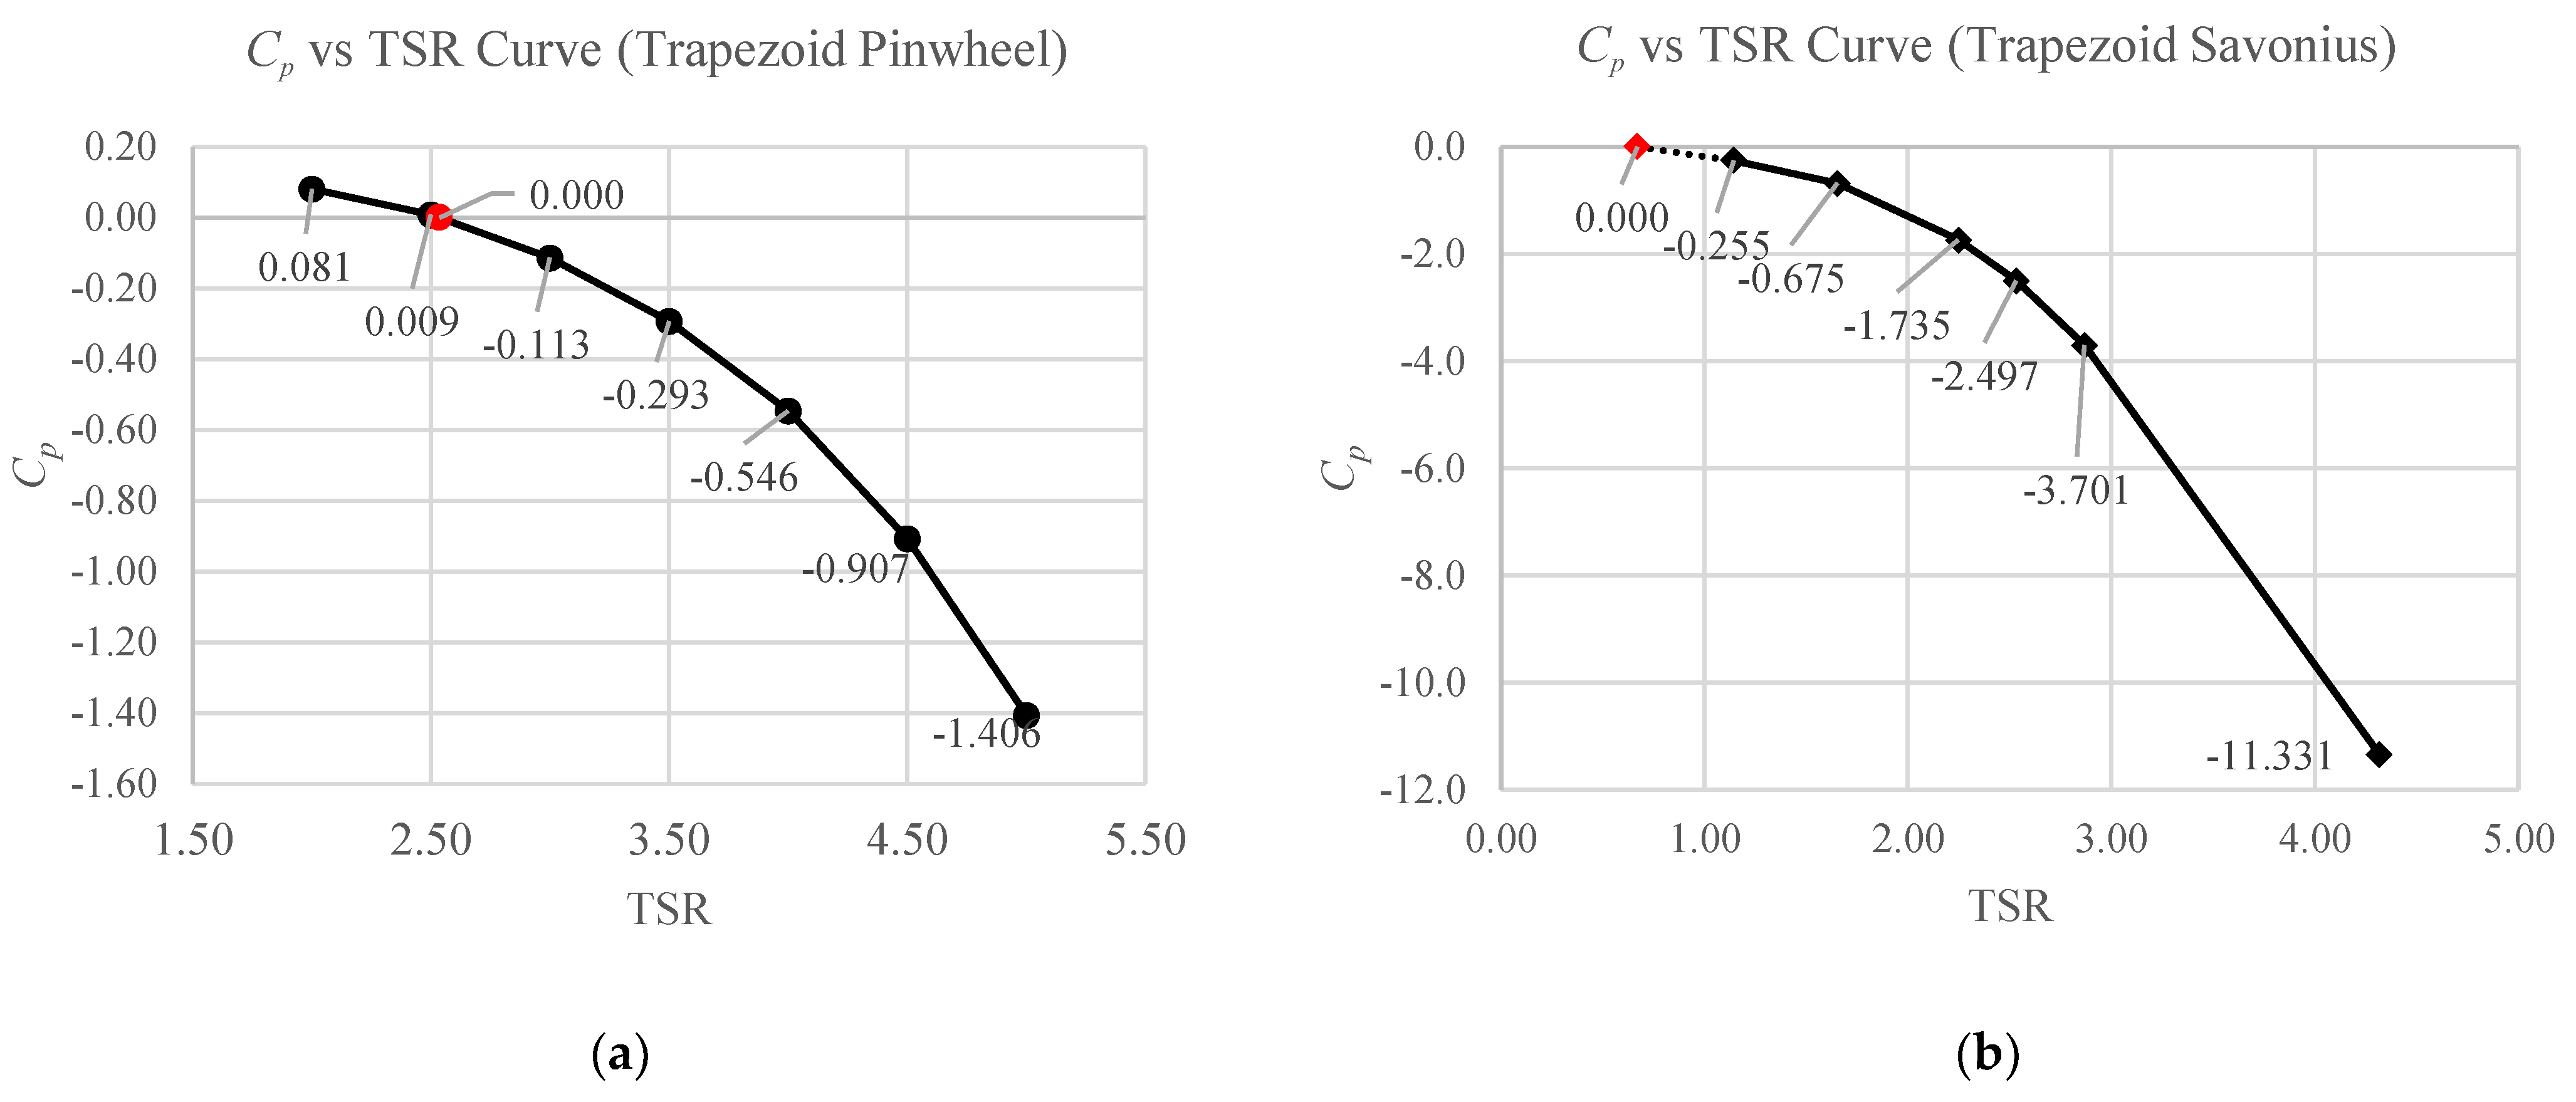
For the external validation of the simulation findings, the optimal Cp and TSR are found and compared with the reference studies for Pinwheel and Savonius, which lie in the acceptable range of experimental validation. The results are summarised in Table 5 and shown in Figure 11 by applying the central difference method for interpolation methods where the difference between the Cp values at two neighbouring points are divided by the distance between them as the mathematical expression:   f ' x 0 = f x 0 + h f x 0 h 2 h .
As the most classic and simple VATT, the experimental research results of Savonius turbines are based on extensive measurements, yielding relatively accurate findings. Our simulation experiments align well with these results, with an error rate of only +4.32%. By adopting more precise interpolation methods, we can further reduce the error rate significantly.
On the other hand, Pinwheel turbines, being a novel type of DATT turbine, are less commonly utilized in undersea environments. Experimental results for Pinwheel turbines often require more sophisticated equipment and a larger dataset for support. A study [4] compared traditional pinwheel designs, which have blades without trimming, with those that have undergone hydrodynamic performance improvement through optimized blade shapes. In this study, the Pinwheel design implements a cut on the blade edge, and the optimal TSR determined using the moment balancing analysis method lies between the range of the two aforementioned designs. The upward and downward deviations were +21.16% and −37.96%, respectively. This does not imply that the study’s results are inaccurate; rather, it indicates that the design falls within the upper and lower bounds of blade optimization, therefore providing valuable reference data for further studies and comparison.

3.3. Wake Velocity Vector Plots

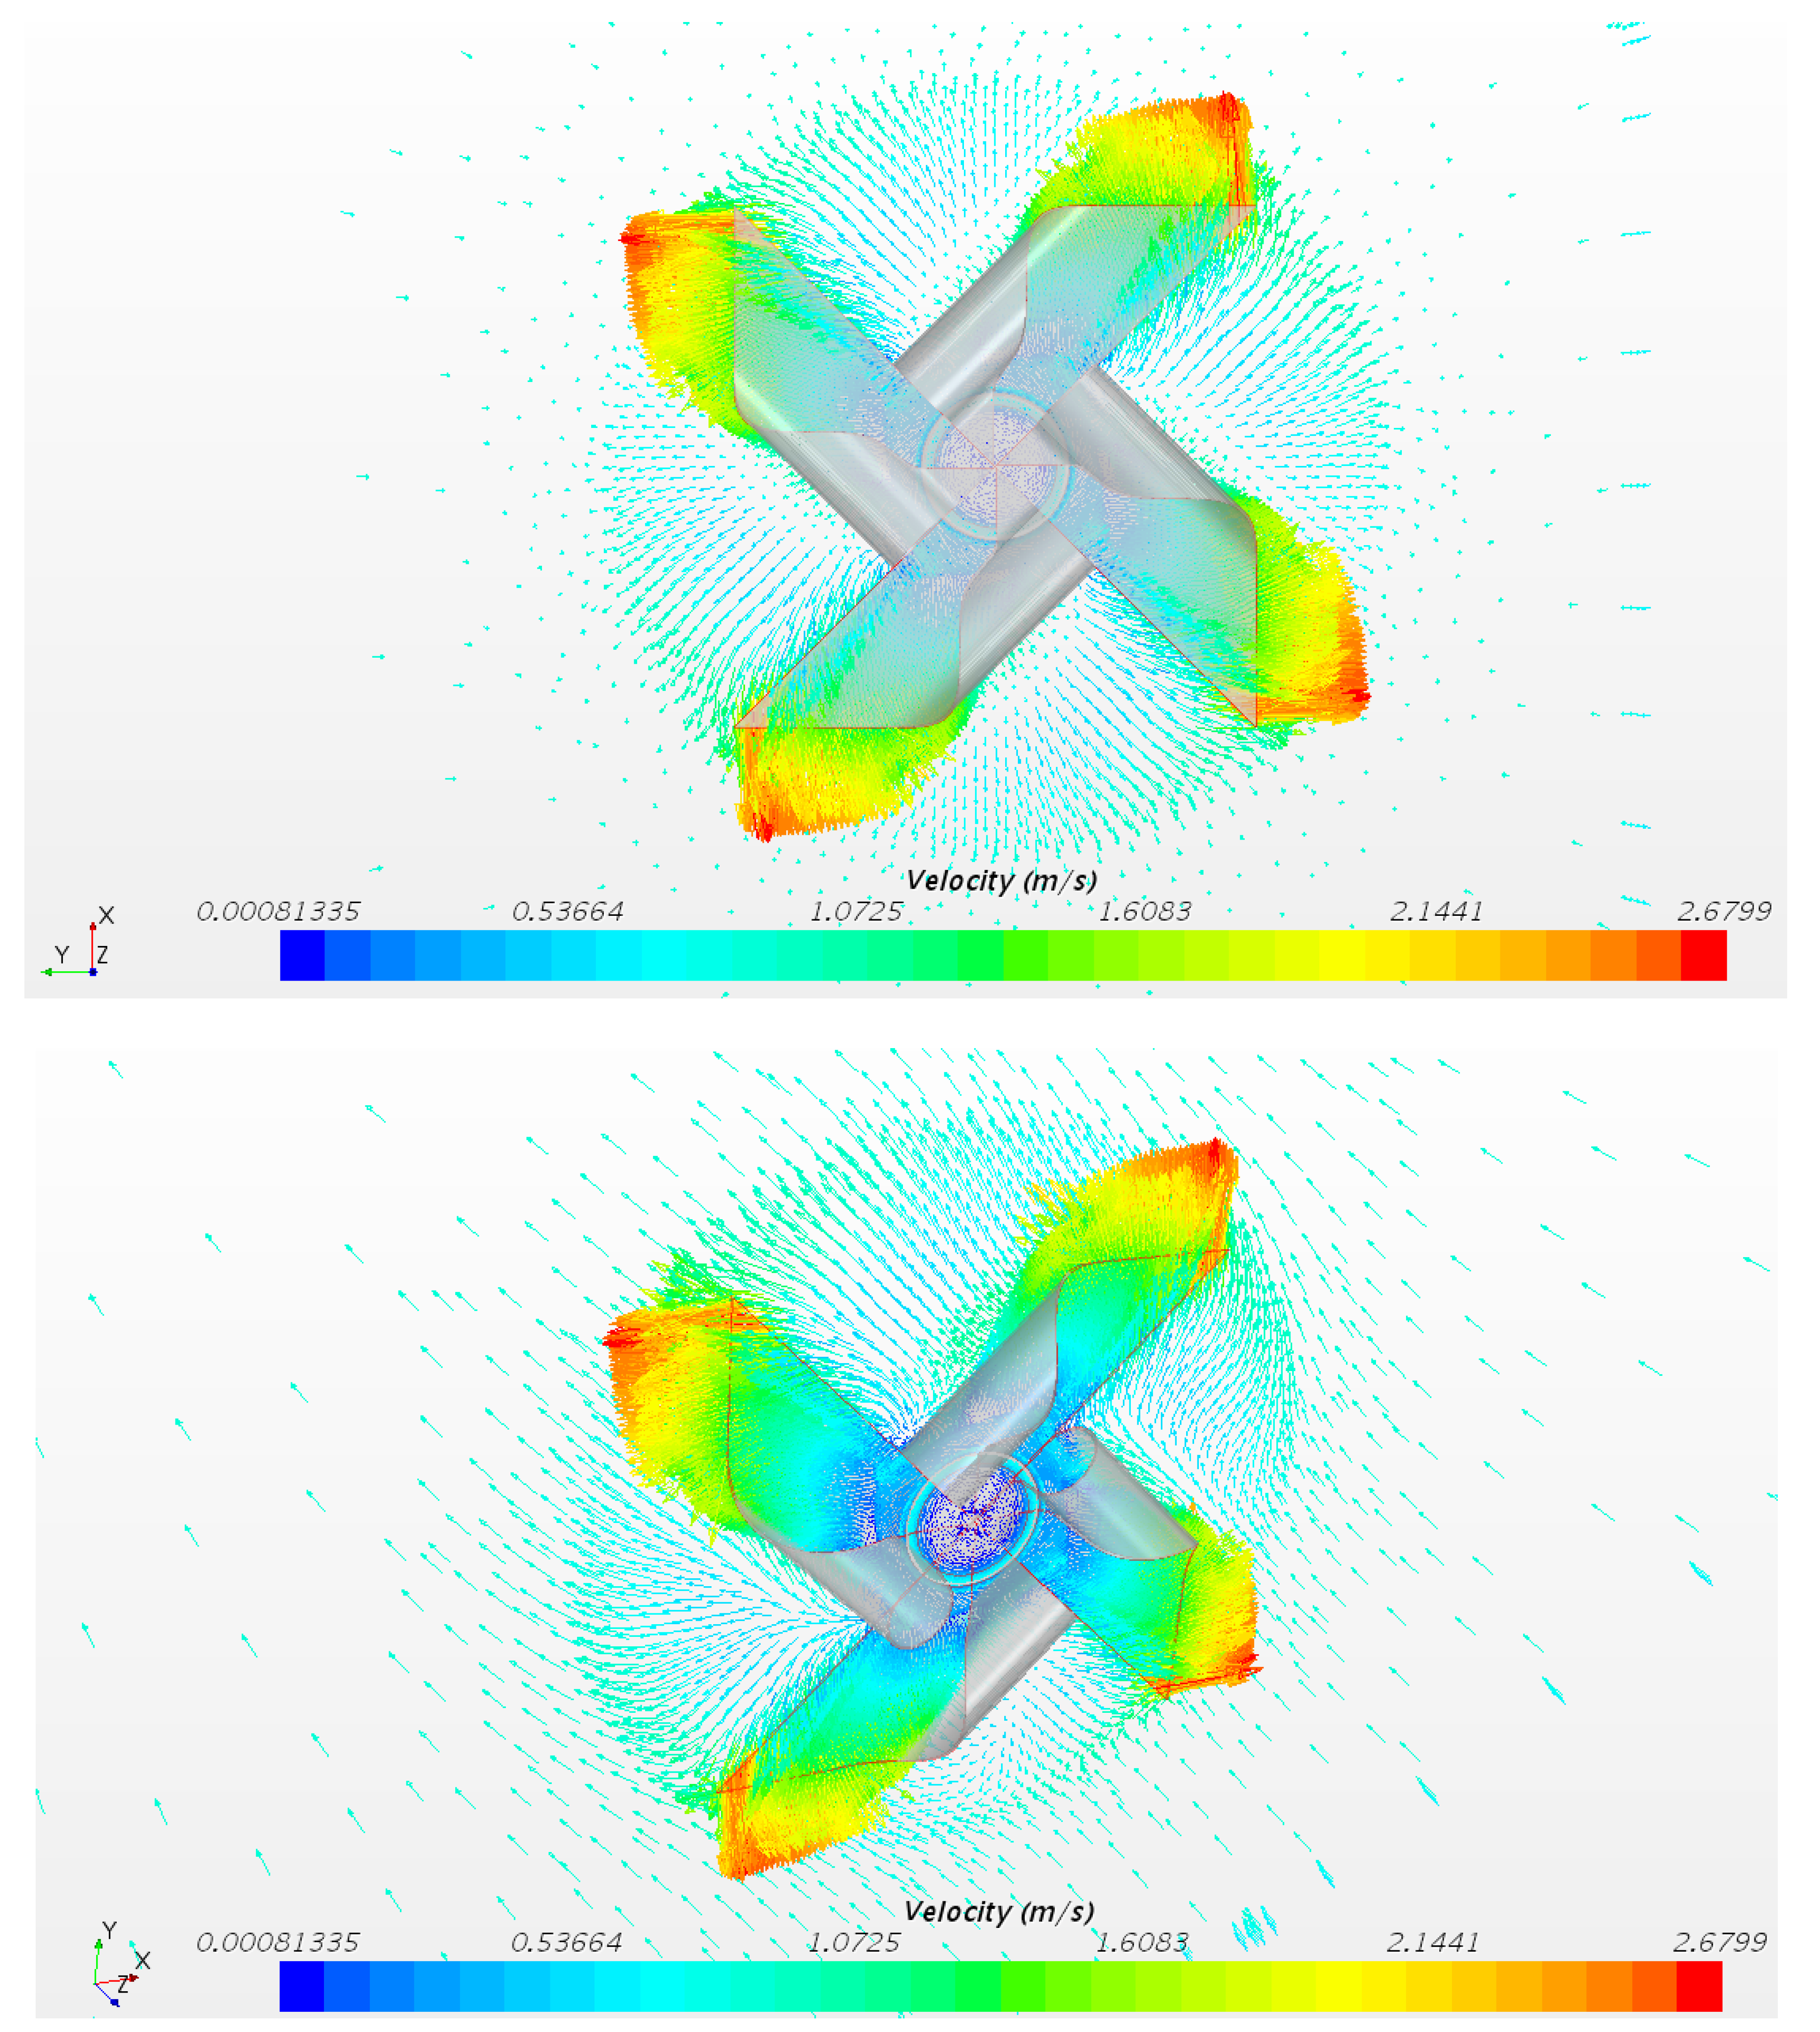
The blade tip of the Pinwheel exhibited a maximum speed value of 2.68 m/s, as indicated by the red glyphs. As one progresses towards the center of the Pinwheel, the speeds gradually decrease and approach zero at the incident edge, which is highlighted by the dark blue glyphs in Figure 12.
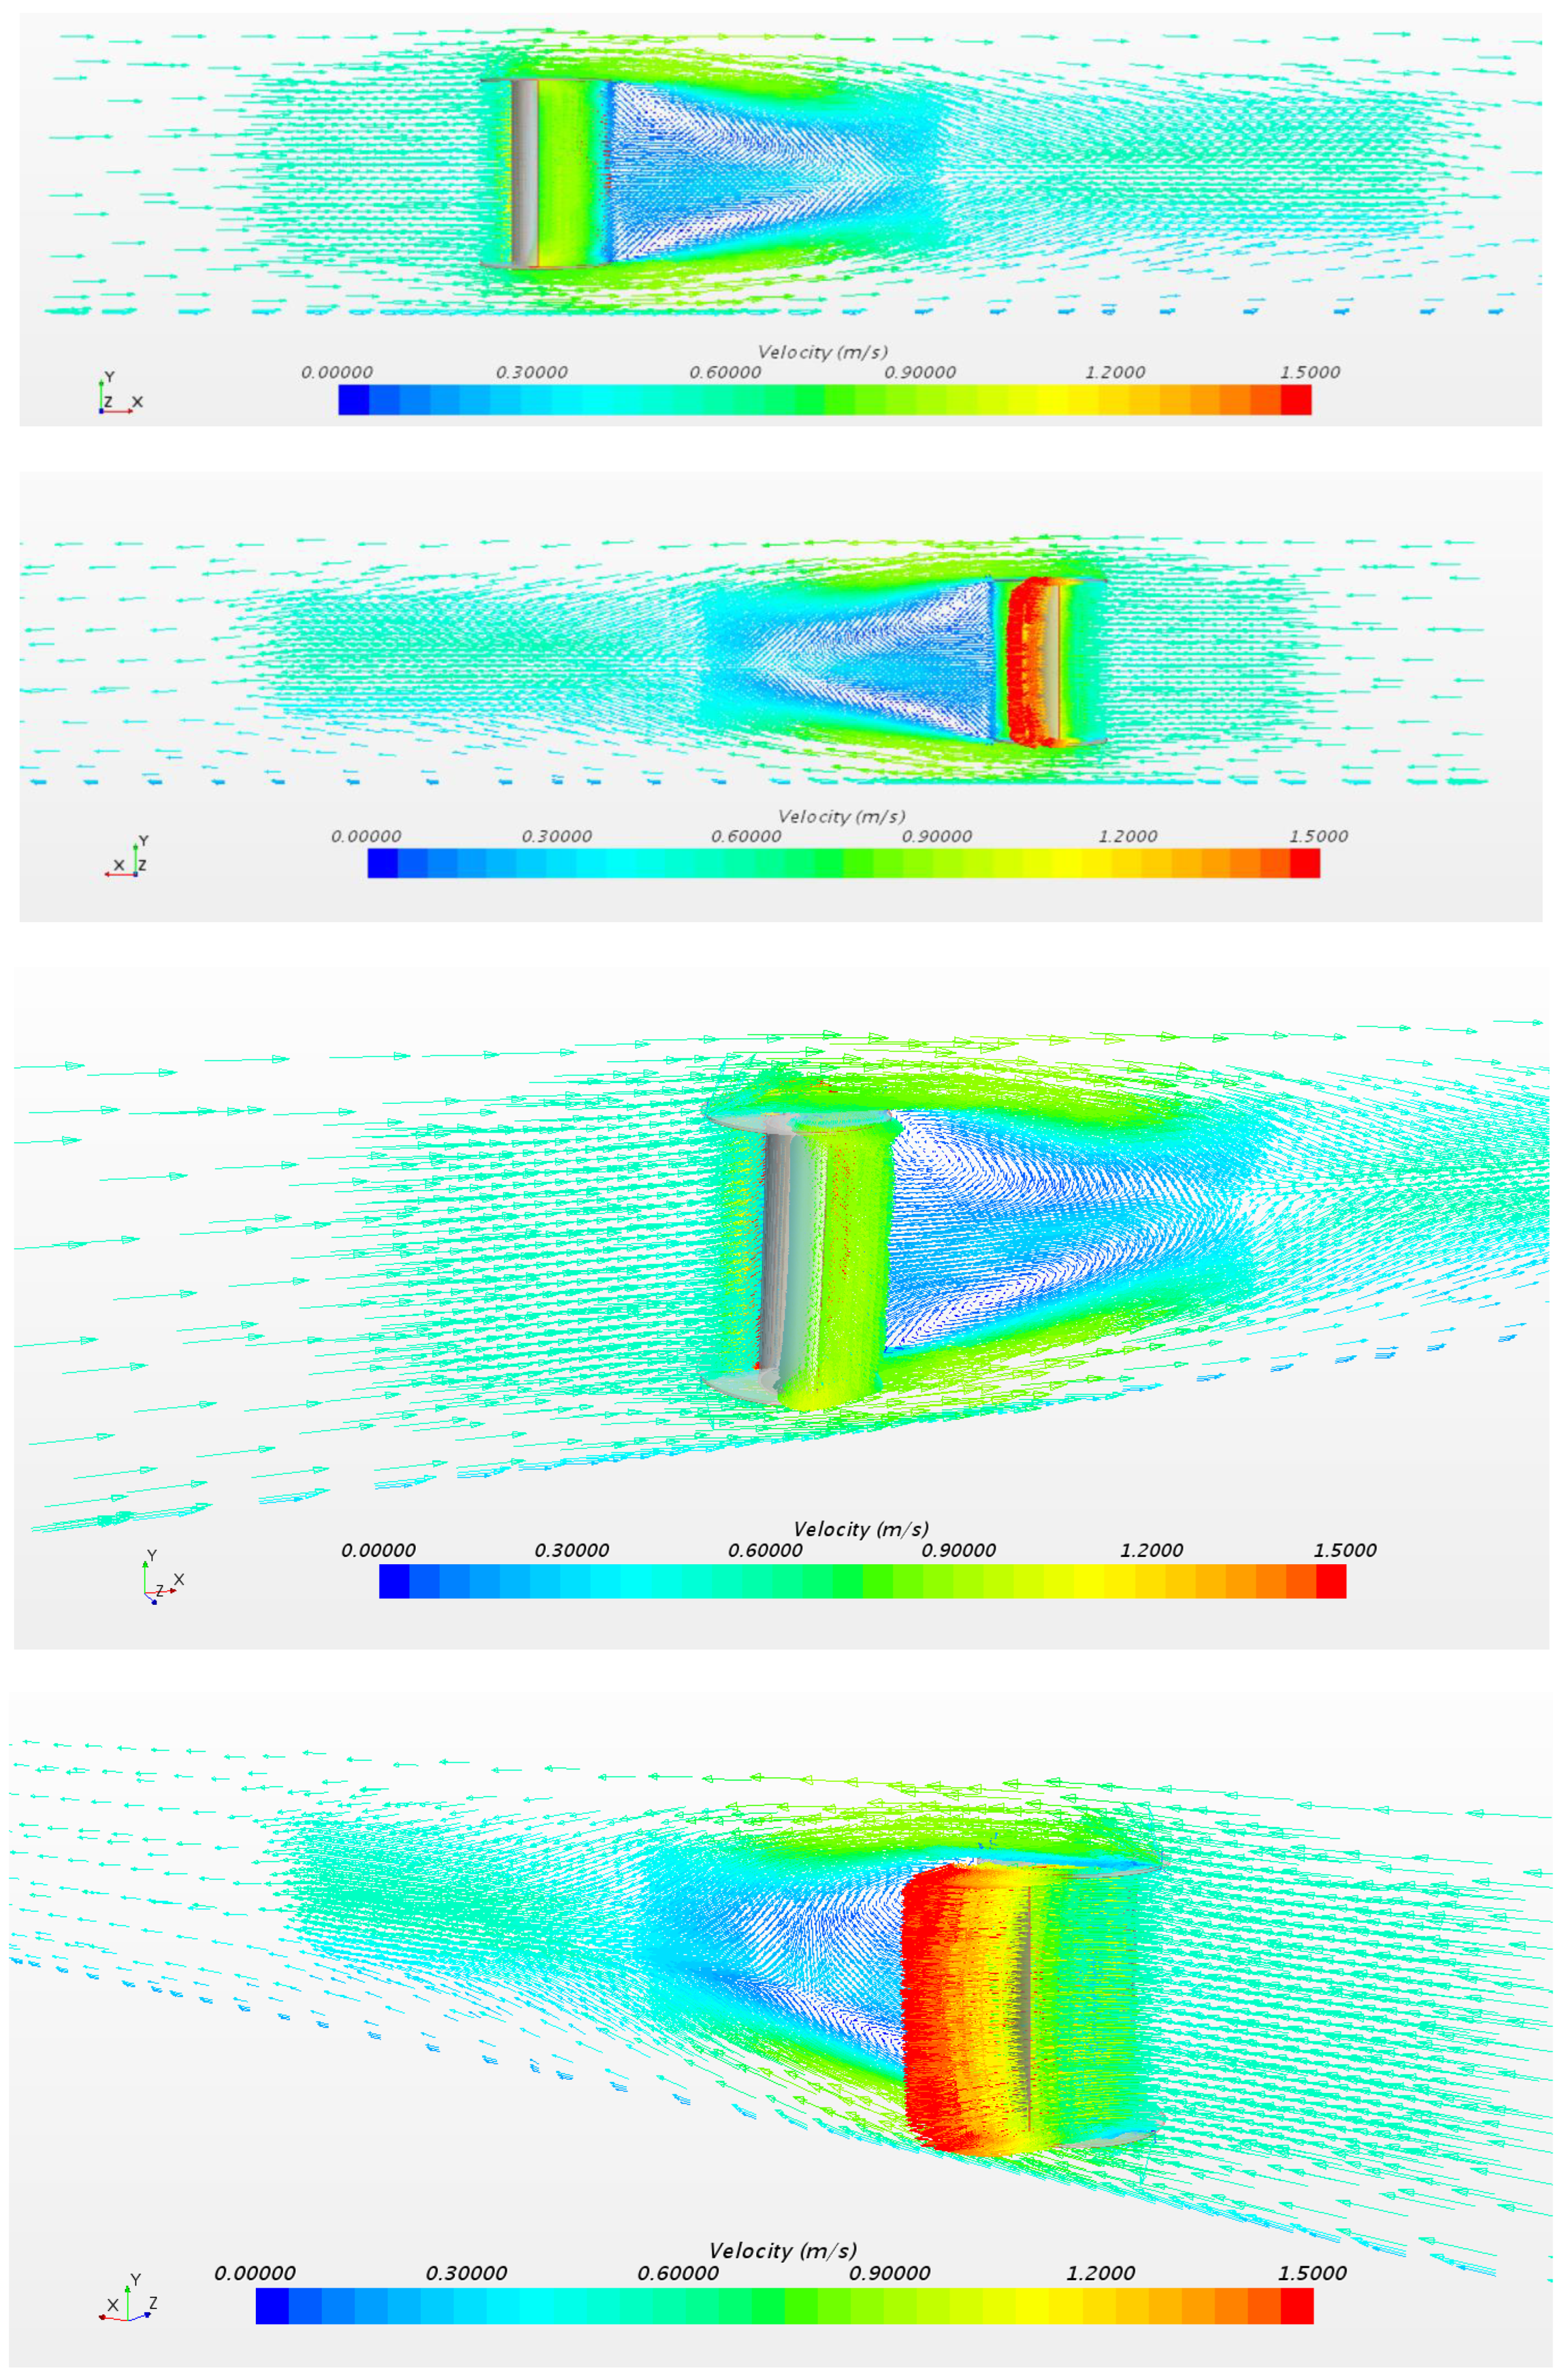
Figure 13 illustrates the presence of the whirling phenomenon within the wake area of the Savonius turbine. Specifically, the downstream portion of the wake exhibits a gradual reduction in tangential velocity, with a maximum value of 1.5 m/s, as denoted by the red glyphs. It should be noted that the high fluid velocity predominantly occurs on the near-surface of the blade for both turbines. At the curved surfaces of the blades, the fluid generates rotational motion for the turbine. Regarding the wake decay length, the Pinwheel demonstrates a notable recovery of downstream flow compared to the Savonius turbine.

3.4. Flow Velocity and Wake Distribution

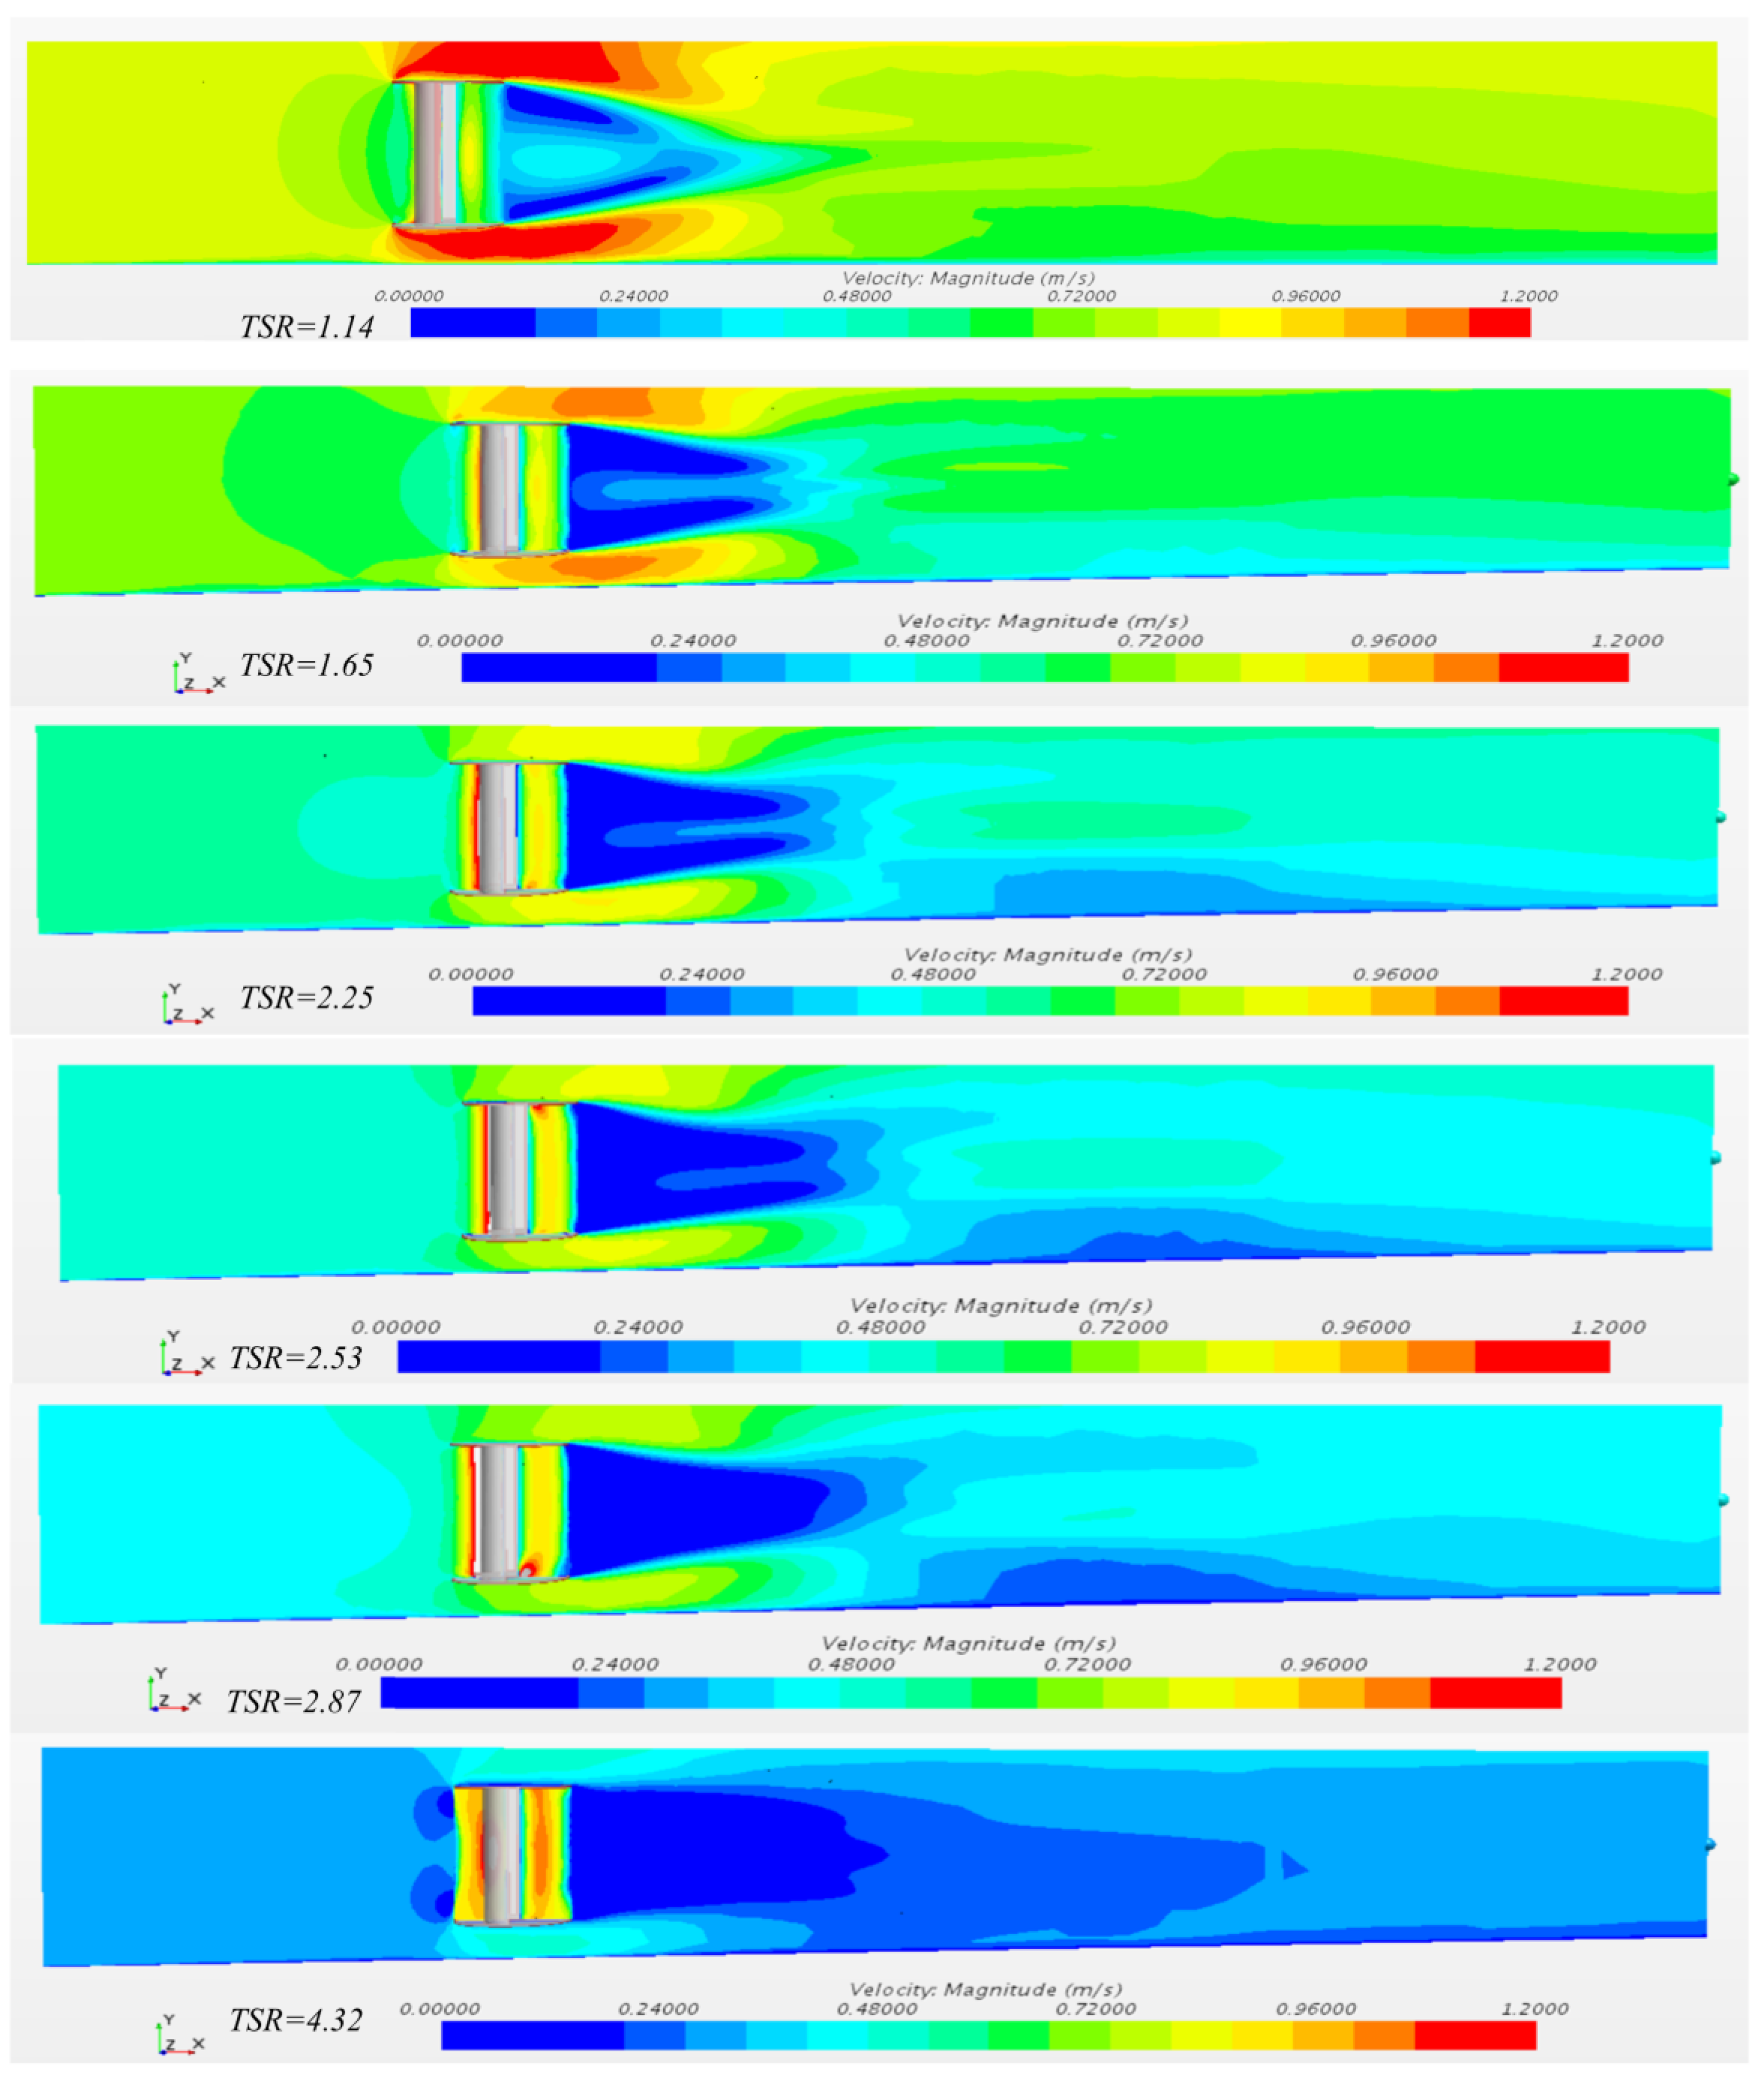
Figure 14 and Figure 15 below indicate the simulation results of velocity scalar plots of Pinwheel and Savonius under different TSR ranges, respectively. For Pinwheel, as TSR increases, the downstream flow field has the following principles:
  • For the wake downstream, the wake decay length (WDL) gradually shortens as the inflow velocity increases and the turbine’s working tip speed ratio (TSR) decreases. This indicates that the minimum distance required for the wake to be blended with the bypass flow reduces, leading to the gradual restoration of upstream velocity and a decrease in its impact on the downstream water potential.
  • Regarding the vortex, when the inflow velocity is lower, and the TSR is higher, the downstream backflow significantly dissipates and transforms into forward flow. Two regions have small vortices between the turbine blades at the ninety-degree gap. With increasing inflow velocity and slowing down of rotation (reducing TSR), these two small vortices gradually disappear and merge into the main vortex.
  • The fluid in the tail part of the Pinwheel turbine maintains static flow, creating a dead zone.
For the Savonius turbine, the downstream flow is depicted in Figure 15, and the distinctive features compared to the Pinwheel turbine mainly occur in the bypass flow, summarized as follows:
(1)
Due to its slender and tall shape, the turbine compresses the bypass flow in the upper and lower regions, especially at lower TSR and higher flow velocities. This feature becomes particularly pronounced at TSR = 1.14. In fact, the narrow and elongated bypass enhances the channel’s blockage efficiency.
(2)
Concerning the downstream wake, the presence of bypass flow and the friction with the seabed further weaken the near-bed flow velocity, making it challenging for the downstream flow to quickly return to a level close to the upstream velocity. This has long-term effects on the downstream environment, particularly on fish species with upstream migration habits. The length of the wake diffusion layer (WDL) increases with increasing TSR, consistent with the pattern observed in the Pinwheel turbine.
(3)
Regarding the vortex shape, two vortex streets originate from the upper and lower blades and extend downstream. At high TSR, when TSR > 2.87 (near-idle operation), the vortex streets merge to form a larger dead zone where quasi-steady flow concentrates at the ends of the blades.
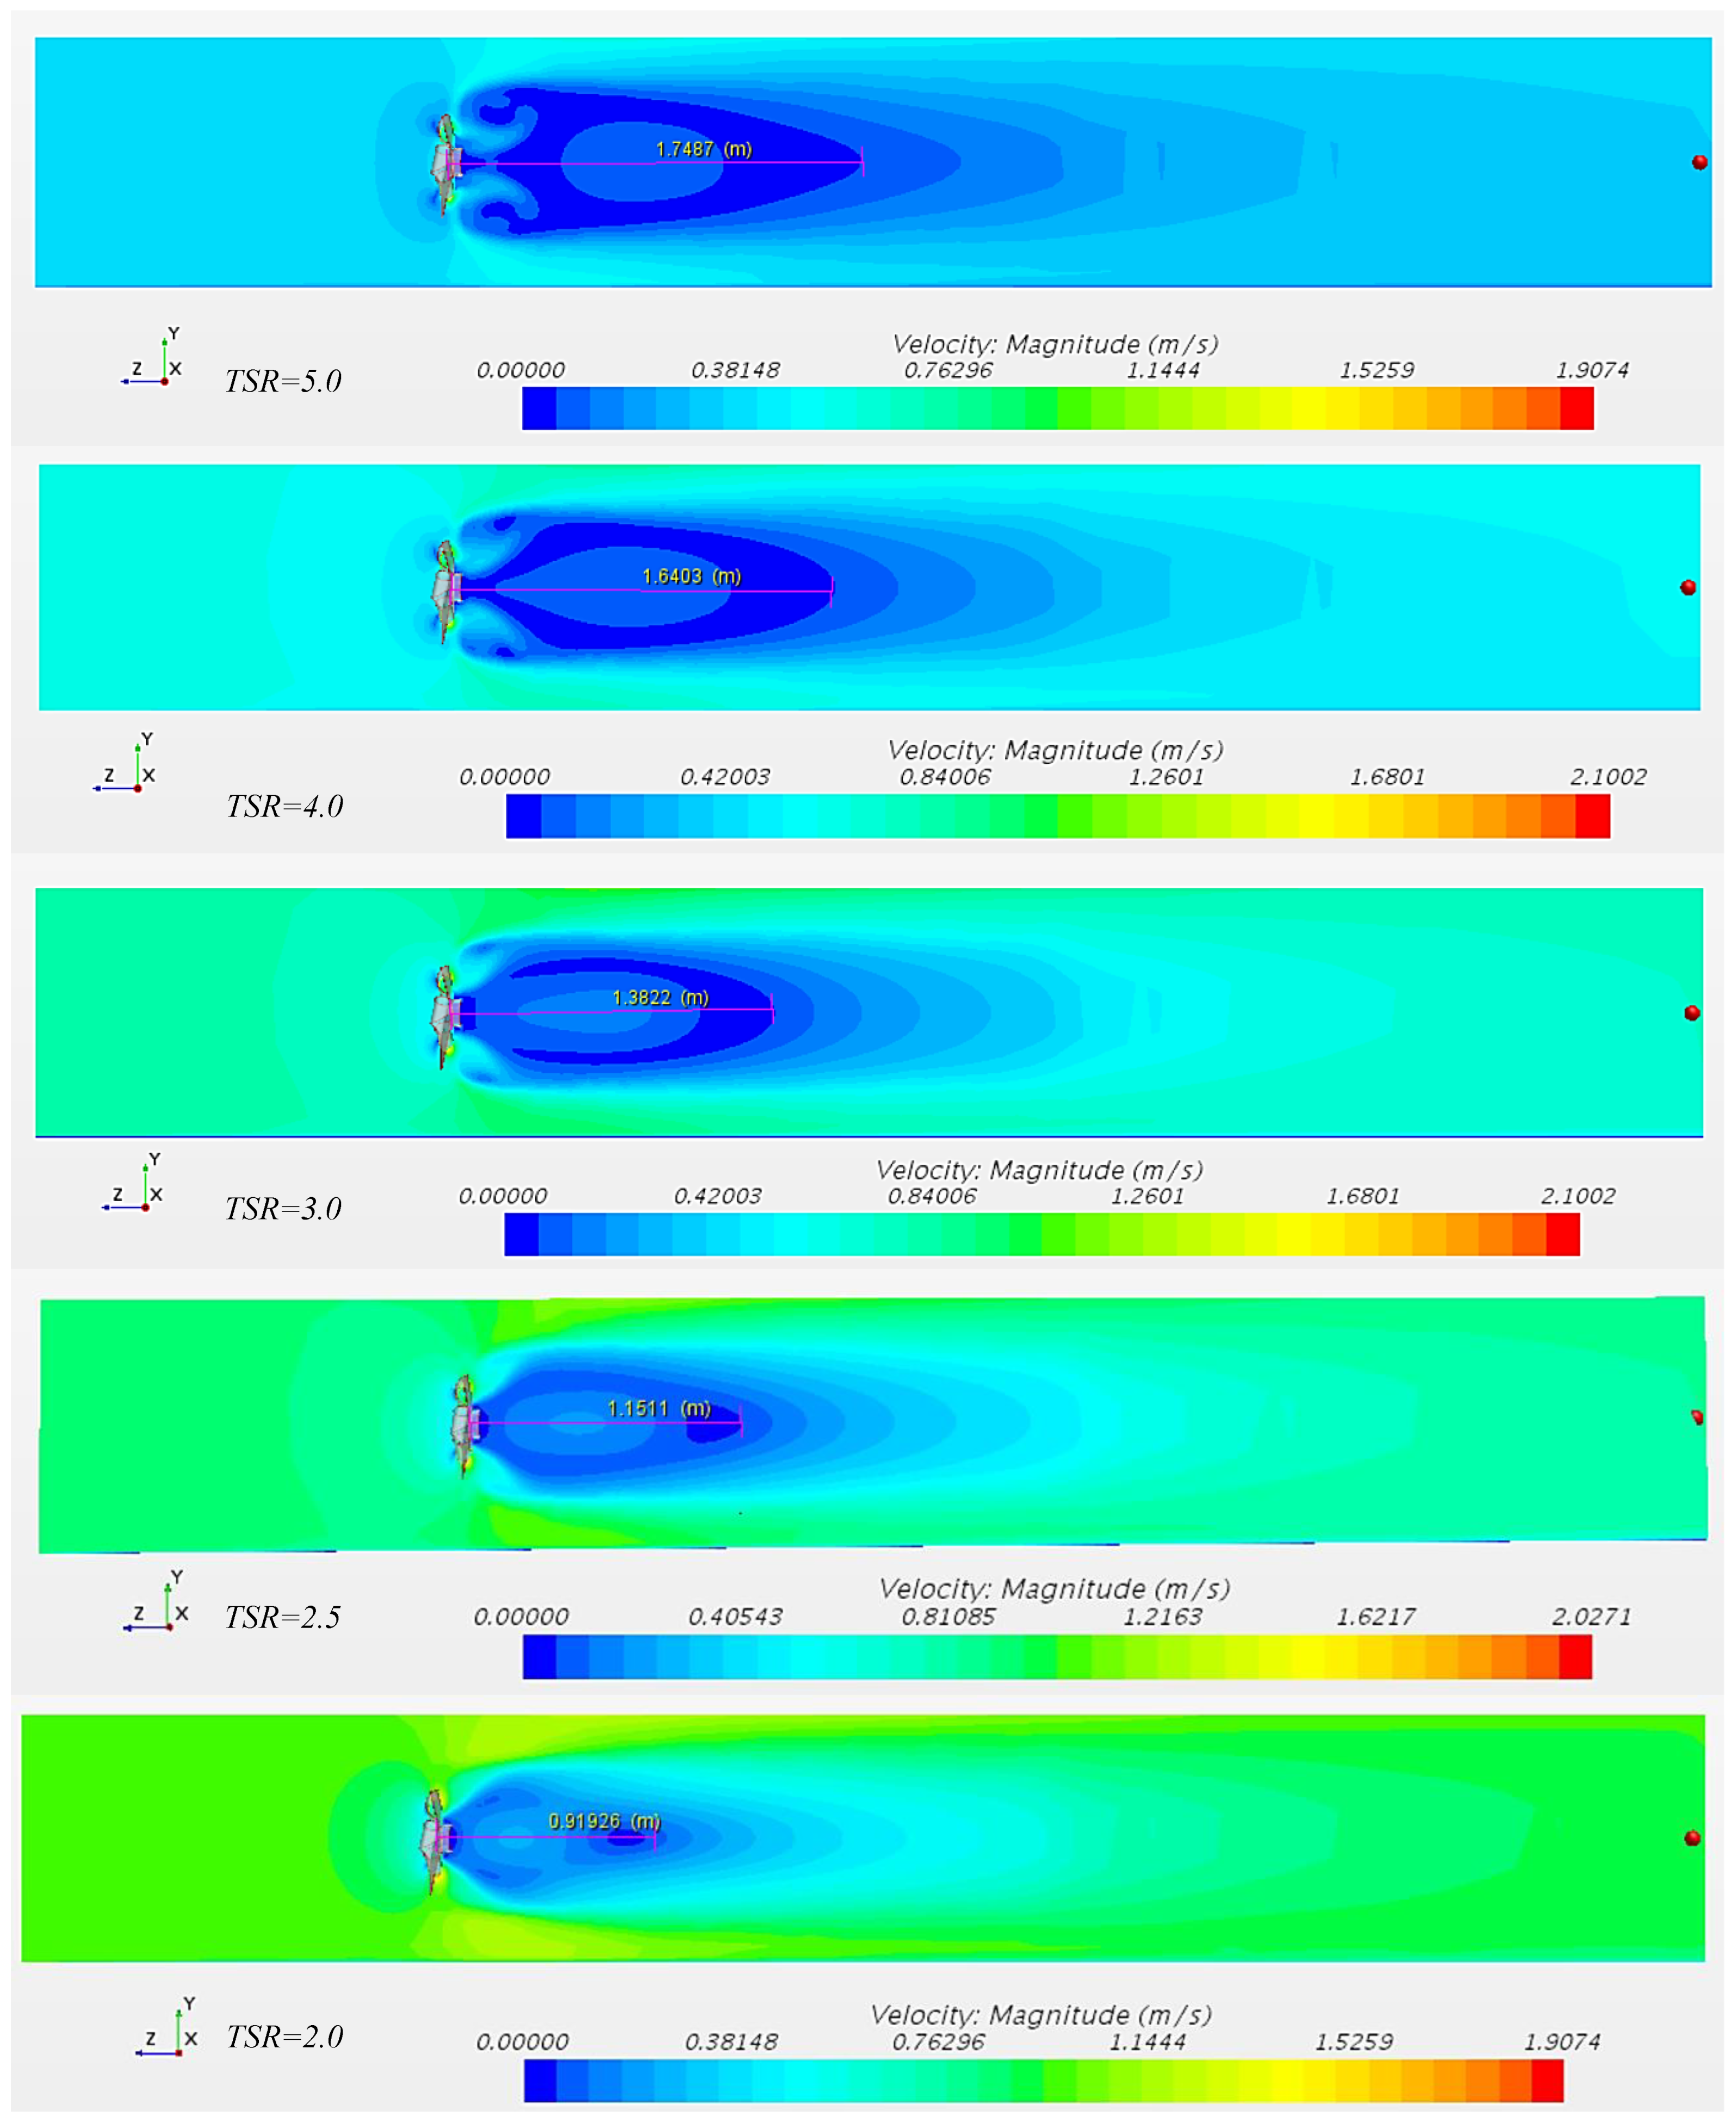
Figure 14. The wake’s velocity field shape in the Pinwheel turbine; TSR ranging from 2.00 to 5.00.
Sustainability 15 14187 g014
Figure 15. The wake’s velocity field for the Savonius turbine; TSR ranging from 1.14 to 4.32.
Sustainability 15 14187 g015
The upstream velocity U1 and downstream velocity U2 for the two turbines are summarised in Table 6, where the new parameter “basin efficiency η” is indicated in Equation (17) for both Pinwheel and Savonius. The basin efficiency measures how the turbine blockage affects the channel’s downstream and flow power collection. From Table 6, as the U1 decreases, the Pinwheel and Savonius of basin efficiency show a similar quadratic trend, where the η reaches a peak at 0.6 m/s (TSR = 4.0) for Pinwheel at 29.09%, and 0.46 m/s (TSR = 2.87) for Savonius at 25.67%. Low η happens when the TSR is too low or too high. However, an abnormal case on Savonius is observed when U1 is greater than 0.83 m/s and η. These two cases, corresponding to Figure 12’s TSR = 0.32 and 0.39, are affected by the jet flow on the bypass as a flow enhancer effect, as discussed previously.
B a s i n     e f f i c i e n c y   η = u s e f u l   p o w e r p o w e r   r e m o v e d   f r o m   f l o w = P u s e f u l P i n P o u t = ω · M T h r u s t / I d l e 1 2 ρ A U 1 3 1 2 ρ A U 2 3
This study indicates an intriguing observation: the optimal TSR of a turbine (e.g., 0.83 for Savonius) does not coincide with the TSR corresponding to its channel efficiency, η (e.g., 0.46 for Savonius). The optimal TSR of a turbine represents the working rotational speed at which it can maximize the collection of incoming flow energy, indicating its power generation efficiency. On the other hand, the channel efficiency η represents the efficiency of collecting kinetic energy from upstream and restoring it downstream in the waterway, representing the environmental energy utilization efficiency. For instance, when the flow velocity difference between upstream and downstream becomes smaller, the power removed from the channel decreases, leading to greater η.
Therefore, achieving a balance between power generation efficiency and environmental energy utilization efficiency is crucial for the utilization of tidal stream turbines. Within this range of TSR values, it is essential to make informed judgments based on specific requirements and practical considerations.

3.5. Error and Uncertainty Discussion

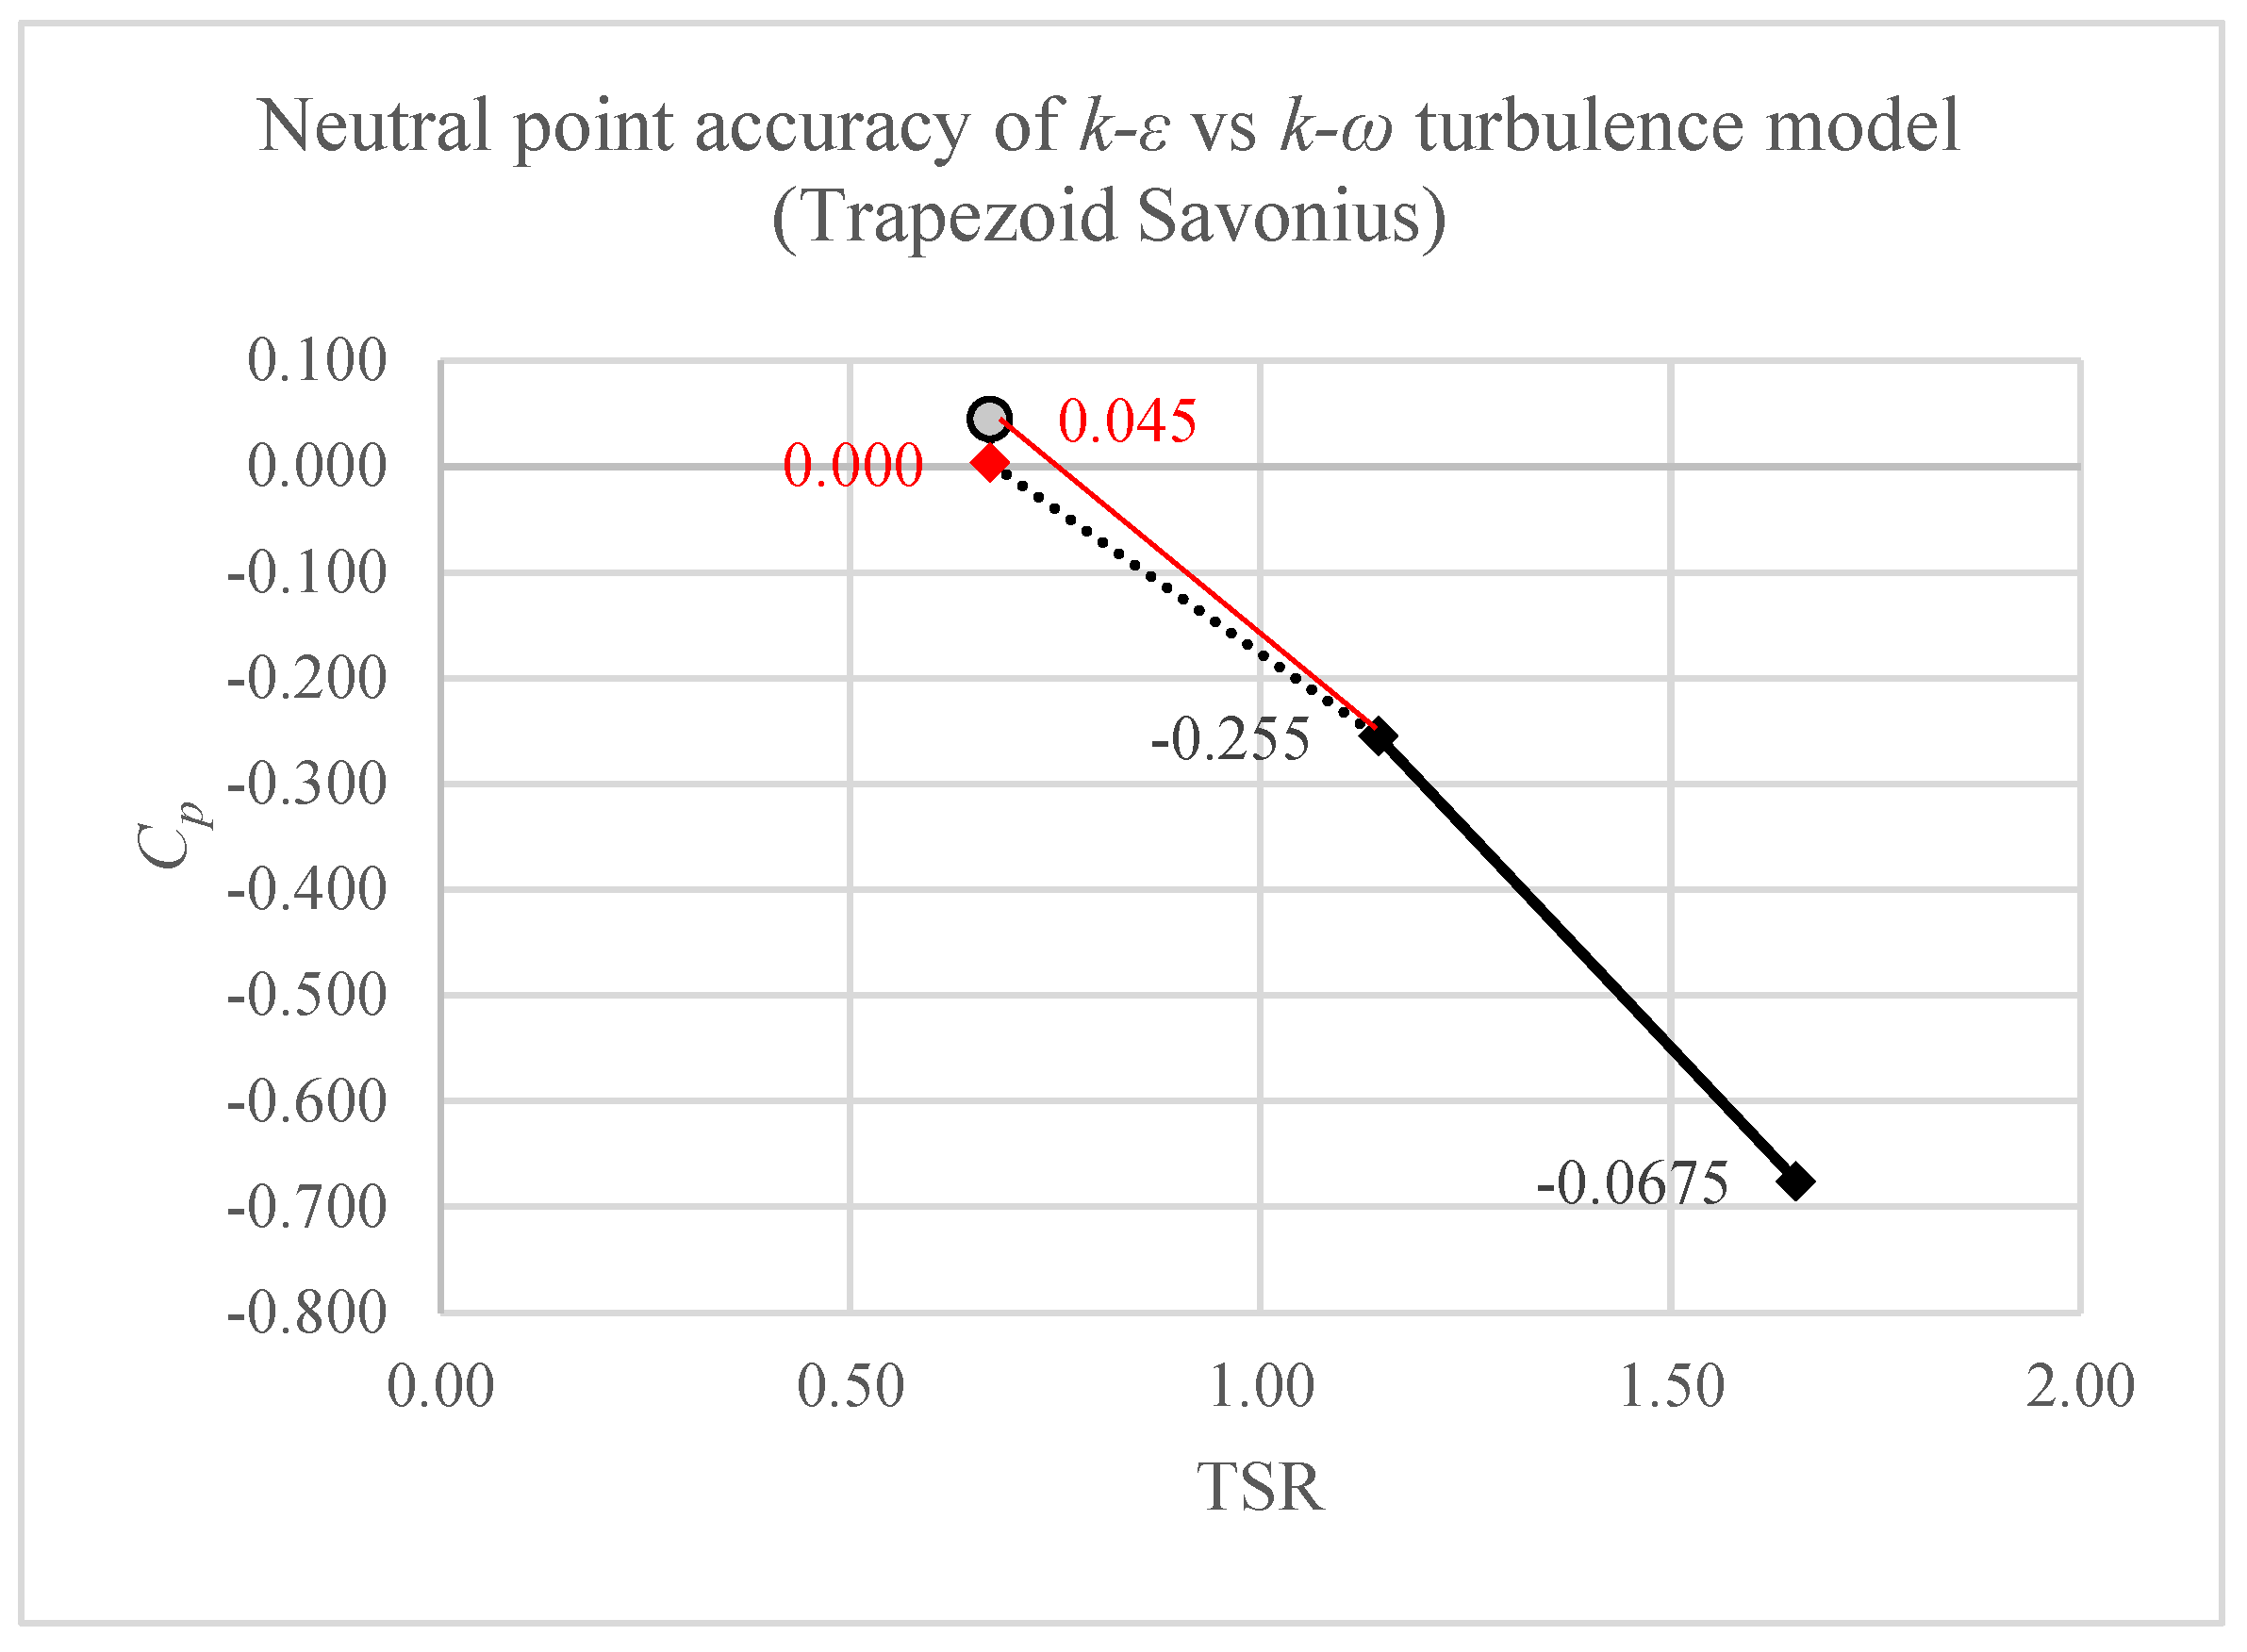
The deviations in optimal Cp and TSR for the two models could be due to the relative viscosity, which is a measure of the fluid’s resistance to flow and decreases as its temperature increases. The water temperatures for Pinwheel and Savonius models were assumed to be 25 °C, as it was not specified in the literature. k-ω model has been increasingly popular due to its accuracy in simulating rotating machinery [35]. The optimal TSR obtained with k-ε turbulence is 0.671 when Cp reaches the neutral point at 0.000. The k-ω model provides a Cp value of 0.045 under the same optimal TSR given in [27], as shown in Figure 16. Through the central difference method for interpolation, the k-ω model calculated optimal TSR at 0.741 with the error rate at +5.58%, i.e.,   0.741 0.7 0.741 × 100 % = 5.58 % from the previous experiment. Although the difference between the two turbulence models is less significant, an important reason to choose k-ε model over k-ω is the shorter computational time, i.e., faster convergency speed. Hence, k-ε turbulence was used for the two models.
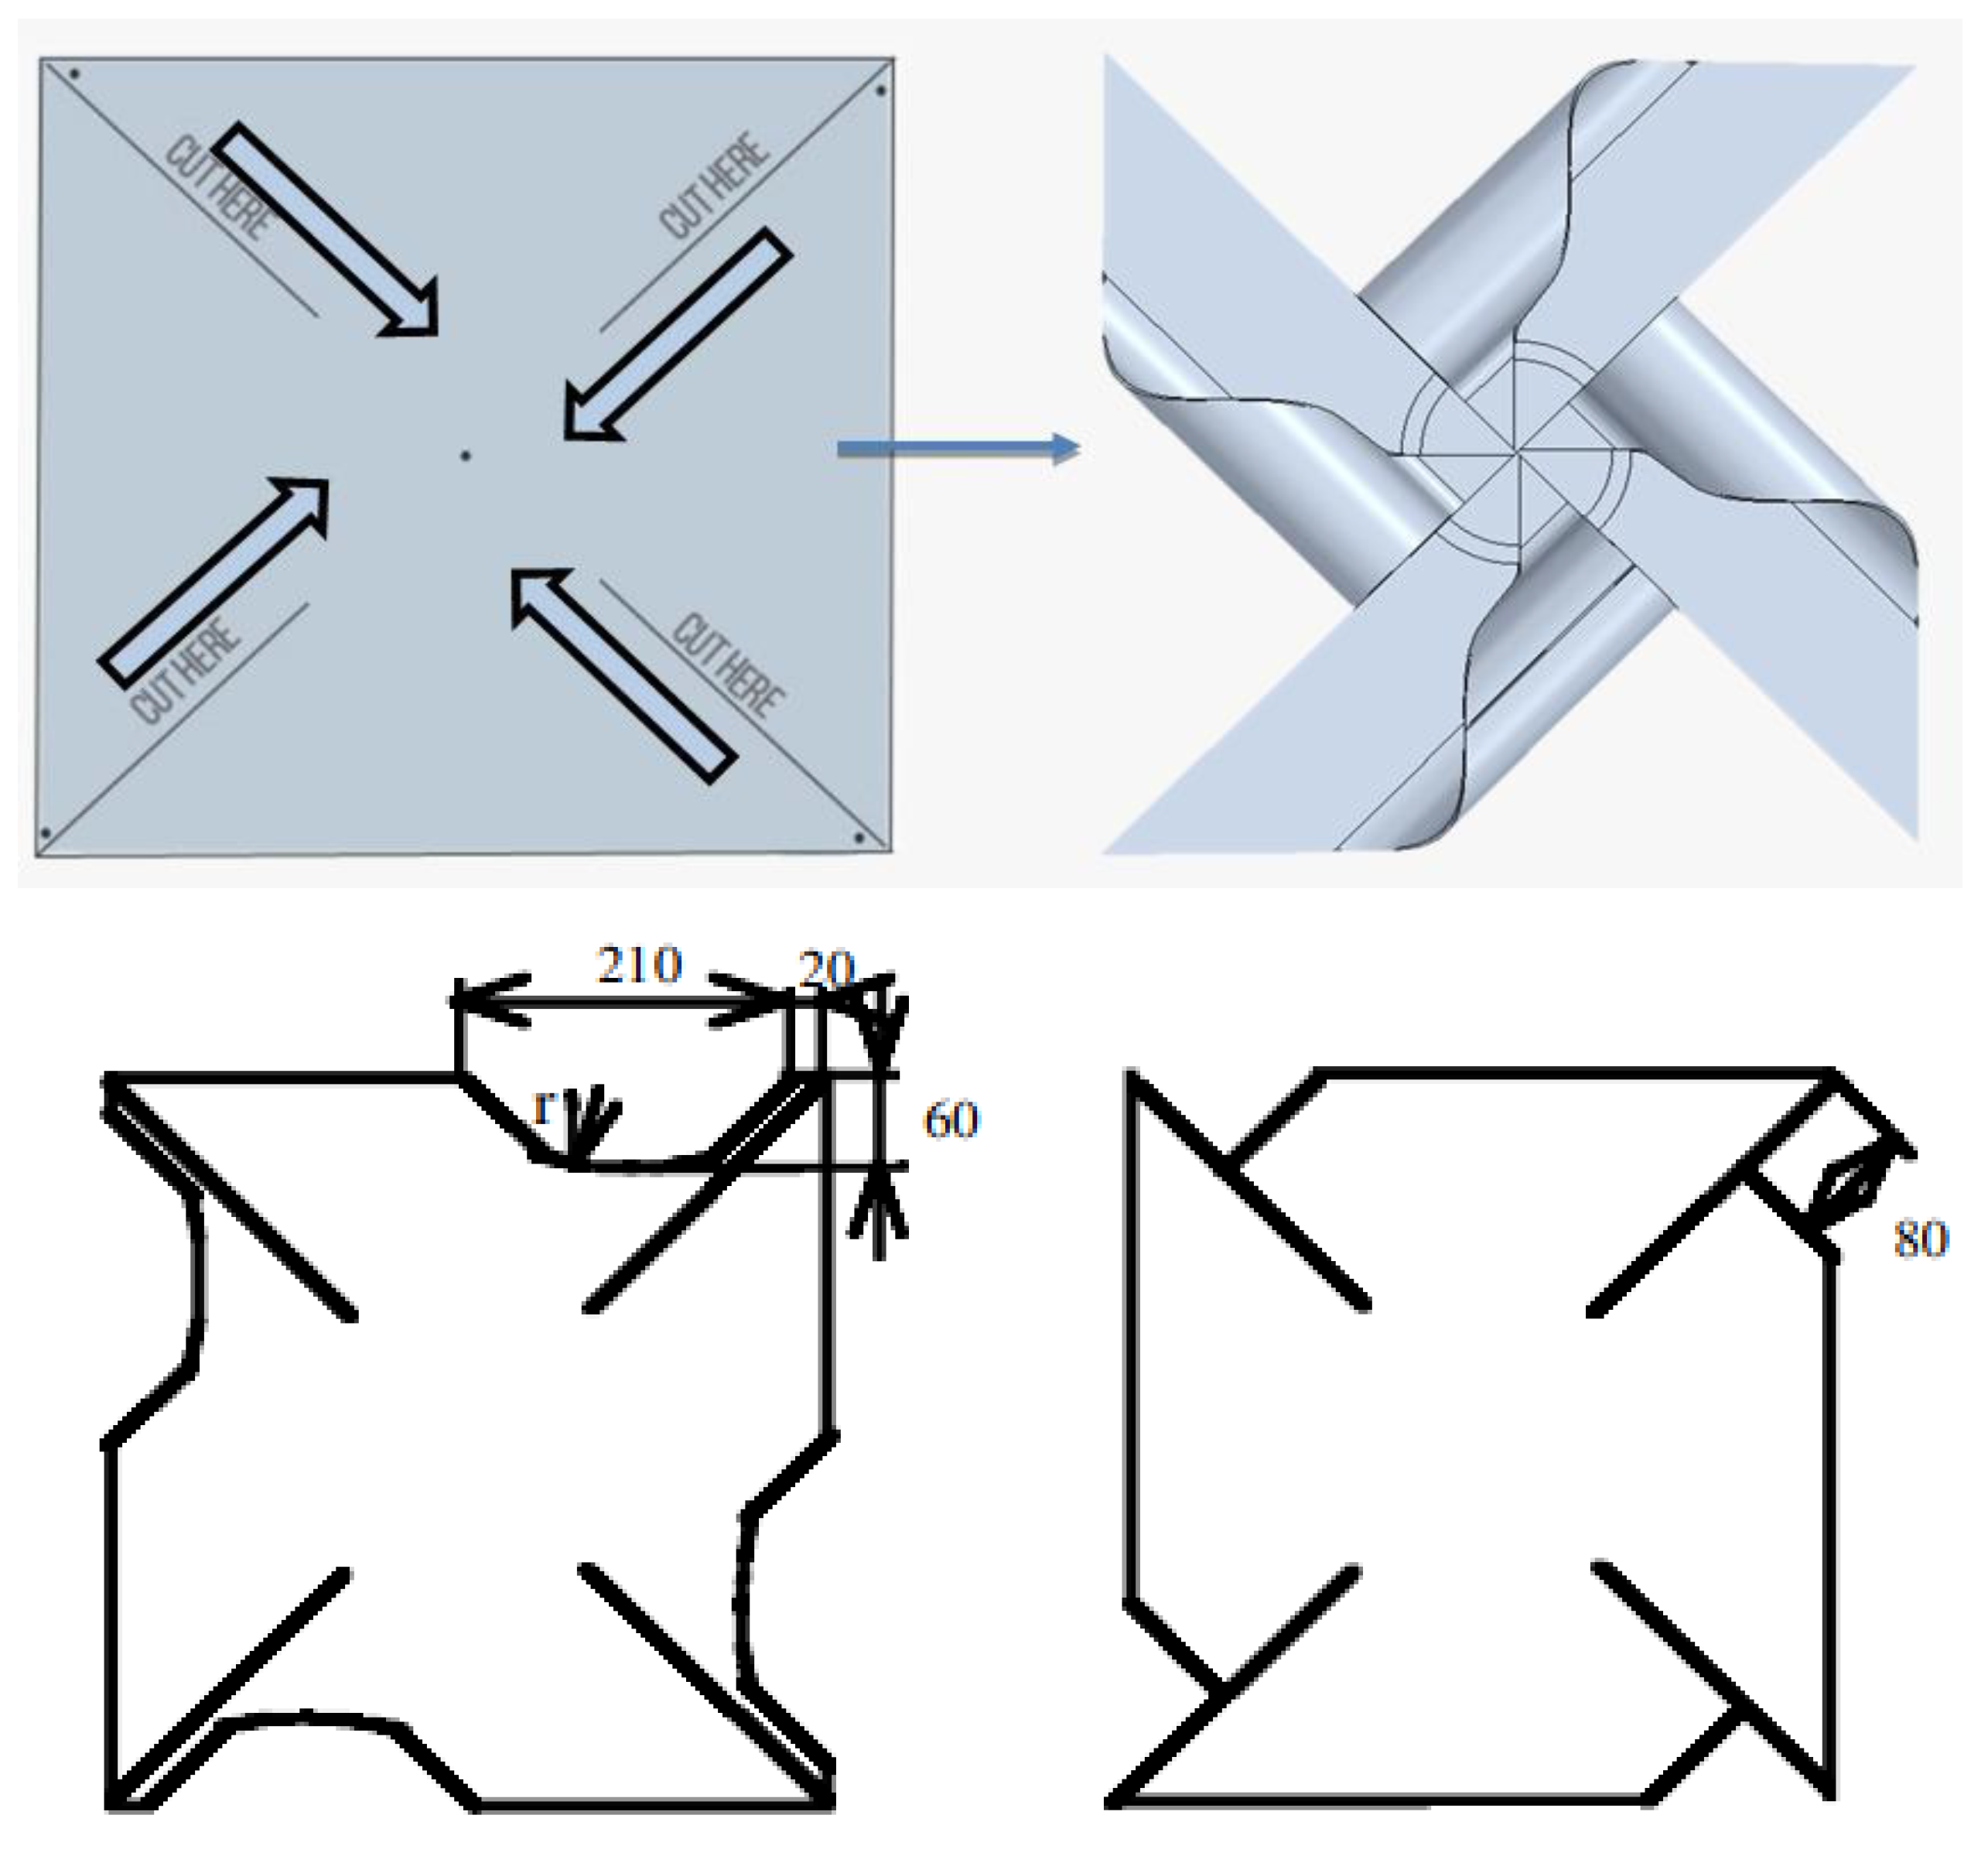
Table 5 shows the comparison and error analysis of the Pinwheel’s optimal TSR calculated using the torque balance simulation method and experimental results from the external literature [4]. Pinwheel’s traditional shape was created by cutting a square along its four corners towards the centre and folding half of a quarter to form the swirling channel, while the remaining half of the quarter formed the blade, as illustrated in the upper part of Figure 17. However, after experimental exploration, the optimal Pinwheel shape was determined to involve cutting along the front for 60 mm and edge for 80 mm to obtain blade shapes that align better with the streamlined trajectory, as shown in the lower part of Figure 17.
For the experimental results of the optimal TSR for the traditional pinwheel and the optimal pinwheel mentioned above, the literature provided values of 2.0 and 3.5, respectively. This helped identify the range of optimal TSR for the pinwheel under different improved blade shapes. The blade shape used in this paper fell between the traditional and optimal shapes, resulting in an optimal TSR value of 2.537. The error range, compared to the maximum and minimum values, still fell within a reasonable range in between. Furthermore, since there are limited experimental results for the Pinwheel hydrodynamic test, the numerical solutions presented in this paper serve as valuable simulation references for Pinwheel performance tests, contributing to future research in this field.
Furthermore, the computational analysis yielded findings suggesting that the gap between the up and down plates in the domain channel used for the Savonius simulation was narrower in comparison to the channel walls. This narrower gap was a consequence of maintaining a consistent blockage ratio throughout the parametric study, which resulted in the formation of a slender and tall shape for the Savonius turbine. As a result, the upper and lower clearances of the channel were reduced. In instances where the incoming flow velocity was high, this reduction in clearances could potentially create a flow enhancement effect similar to that observed in a diffuser, potentially exacerbating the instability of idle and thrust moments. However, it is important to note that due to the inherent design of vertical-axis generators, the uncertainty in torque analysis results for Savonius turbines was found to be higher in comparison to horizontal-axis turbines.
In terms of the blockage effect from Figure 14 and Figure 15, they both conclude that when the turbine’s blockage ratio is 12% in a channel, a low TSR working condition leads to a longer wake decay length; that is to say, the blockage, by comparing the bypass flow and wake flow, exerts less effect on downstream flow. This suggests that the low TSR working condition of a tidal turbine will adversely affect the channel’s downstream flow speed. The channel ecosystem will require a longer time to restore this part of speed. Otherwise, the flow pattern alternation can result in a change in sediment deposition with fluid–sediment–structure interaction or scouring, erosion patterns, and migratory paths of marine species. Comprehensive environmental impact assessments (EIAs) are required to investigate the blockage ratio before the installation of tidal turbines to identify and mitigate potential adverse effects.

4. Conclusions

This study successfully established the algebraic equations between newly introduced parameters with the turbine’s net moment and applied this method to model validation in the actual Biffis canal hydrodynamic system. It is found that at the neutral point, idle and thrust moments will offset each other in the optimal state. By this method, the optimal TSR for the Pinwheel turbine is 2.537, and for the Savonius turbine is 0.671. In both simulation models, rotational speed and inlet velocity were proved as excellent predictor variables (R2 value ≈ 1) for idle and thrust moments, respectively.
The significance of the moment balancing equation is to replace the unsteady cyclic volume force analysis with a simplified steady moment analysis. This method is useful in simulations for determining the values of U 1 and ω to achieve equilibrium. Engineers can determine the optimal power coefficient by observing their model results for the net moment approaching zero, indicating a neutral point where the idle and thrust moments are equal and can be used interchangeably to calculate the useful power coefficient.
The optimal basin efficiency ηopt, as another parameter of environmental energy utilization efficiency, is observed at 29.09% when TSR is approximately 4.0 for Pinwheel and at 25.67% when TSR is 2.87 for Savonius. This provides a reference for the trade-off between optimal tip speed ratio (TSR) and basin efficiency η, which would be useful for any practical environmental impact assessments. The simulation results prove that the moment balancing method is suitable for the application of turbine configuration design and machinery test by commercial software with less computational time and cost. Hence, the proposed technique is feasible to supplement the existing industry methods, support sustainable production, and maximize the economic viability of tidal energy projects in climate-resilient coastal areas with straits formed between small islands.
Finally, in the subsequent stage of the study, it is crucial to examine the suitability of the NACA series blade configuration for the lift-dominant turbine through moment analysis. This presents additional challenges and opportunities since the current BEM method is widely employed, offering a balance between accuracy and computational cost. Furthermore, it is essential to investigate and test the CFD model that incorporates multiple turbine array alignments, considering significant flow interaction and wake loss. This paper provides a numerical validation of the moment balancing method and highlights that the optimal TSR should be guided by the channel efficiency ηopt for the development of computational and environmental sustainability in tidal turbine hydrodynamic systems.

Author Contributions

Conceptualization, E.Y.K.N.; methodology, Y.Z. and S.M.; software, S.M.; validation, Y.Z. and S.M.; formal analysis, Y.Z. and S.M.; investigation, Y.Z. and S.M.; data curation, S.M.; writing—original draft preparation, Y.Z. and S.M.; writing—review and editing, E.Y.K.N.; visualization, Y.Z. and S.M.; supervision, E.Y.K.N.; project administration, E.Y.K.N.; funding acquisition, E.Y.K.N. All authors have read and agreed to the published version of the manuscript.

Funding

This research is appreciative of the Interdisciplinary Graduate School scholarship for funding this project. Experimental results used are open-access and can be found in [4,27].

Institutional Review Board Statement

Not applicable.

Informed Consent Statement

Not applicable.

Data Availability Statement

Not applicable.

Acknowledgments

The authors would like to thank Nanyang Technological University for providing the computing facilities needed to carry out this study, as well as the Interdisciplinary Graduate School scholarship for funding this project.

Conflicts of Interest

The authors declare no conflict of interest.

Nomenclature

L Angular momentum: kg∙m2/s
A Cross-section area of a rotor plate, m
U 1 Inflow speed, m/s
RRotor radius, m
C P Power Coefficient
C T Thrust Coefficient
RRotor radius, m
CFDComputational Fluid Dynamics
EUEuropean Union
DDTTsDrag-dominated tidal turbines
k-εKappa-Epsilon Turbulence Model
k-ωKappa-Omega Turbulence Model
SSTShear-Stress Transport Turbulence Model
VATsVertical Axis Turbines
DDTTsDrag-Dominant Tidal Turbines
BEMBlade Element Method
MRFMoving Reference Frame
WDLWake Decay Length
GREEK LETTERS
rDensity, kg/m3
λTip Speed Ratio
ω Turbine’s rotation speed, rad/s
μ Dynamic Viscosity, Pa∙s
SUBSCRIPTS
optOptimal case
SUPERSCRIPTS
*Offset condition

References

  1. IRENA. Innovation Outlook: Ocean Energy Technologies; International Renewable Energy Agency: Abu Dhabi, United Arab Emirates, 2020. [Google Scholar]
  2. European Commission. Tidal Flows Generate Huge Potential for Clean Electricity|Research and Innovation. Available online: https://ec.europa.eu/research-and-innovation/en/projects/success-stories/all/tidal-flows-generate-huge-potential-clean-electricity (accessed on 7 March 2023).
  3. Islam, M.R.; Bin Bashar, L.; Rafi, N.S. Design and Simulation of a Small Wind Turbine Blade with Qblade and Validation with MATLAB. In Proceedings of the 2019 4th International Conference on Electrical Information and Communication Technology (EICT), Khulna, Bangladesh, 20–22 December 2019. [Google Scholar] [CrossRef]
  4. Nemoto, Y.; Ushiyama, I. Experimental Study of a Pinwheel-Type Wind Turbine. Wind. Eng. 2003, 27, 227–236. [Google Scholar] [CrossRef]
  5. Islam, R.; Sultana Snikdha, Z.; Iffat, A.; Shahadat, M.M.Z. Optimum Blade Design of Pinwheel Type Horizontal Axis Wind Turbine for Low Wind Speed Areas. In Proceedings of the 2021 International Conference on Automation, Control and Mechatronics for Industry 4.0 (ACMI), Rajshahi, Bangladesh, 8–9 July 2021. [Google Scholar] [CrossRef]
  6. Wihadi, D.; Mardikus, S. Experimental Investigation of Blades Number of Savonius Water Turbine on Performance Characteristic. In Proceedings of the 5th International Conference on Industrial, Mechanical, Electrical, and Chemical Engineering 2019 (ICIMECE 2019), Surakarta, Indonesia, 17–18 September 2019. [Google Scholar] [CrossRef]
  7. Biswas, A.; Gupta, R.; Sharma, K.K. Experimental Investigation of Overlap and Blockage Effects on Three-Bucket Savonius Rotors. Wind. Eng. 2007, 31, 363–368. [Google Scholar] [CrossRef]
  8. Patel, V.; Patel, R. Energy Extraction Using Modified Savonius Rotor from Free-Flowing Water. Mater. Today Proc. 2021, 45, 5190–5196. [Google Scholar] [CrossRef]
  9. Chen, H.; Zhou, D.; Kan, K.; Xu, H.; Zheng, Y.; Binama, M.; Xu, Z.; Feng, J. Experimental investigation of a model bulb turbine under steady state and load rejection process. Renew. Energy 2021, 169, 254–265. [Google Scholar] [CrossRef]
  10. Kan, K.; Xu, Z.; Chen, H.; Xu, H.; Zheng, Y.; Zhou, D.; Muhirwa, A.; Maxime, B. Energy loss mechanisms of transition from pump mode to turbine mode of an axial-flow pump under bidirectional conditions. Energy 2022, 257, 124630. [Google Scholar] [CrossRef]
  11. Kan, K.; Binama, M.; Chen, H.; Zheng, Y.; Zhou, D.; Su, W.; Muhirwa, A. Pump as turbine cavitation performance for both conventional and reverse operating modes: A review. Renew. Sustain. Energy Rev. 2022, 168, 112786. [Google Scholar] [CrossRef]
  12. Yilmaz, A.E.; Meyers, J. Numerical Simulations of Flow Fields through Conventionally Controlled Wind Turbines & Wind Farms. J. Phys. Conf. Ser. 2014, 524, 012158. [Google Scholar] [CrossRef]
  13. Churchfield, M.J.; Schreck, S.J.; Martinez, L.A.; Meneveau, C.; Spalart, P.R. An Advanced Actuator Line Method for Wind Energy Applications and Beyond. In Proceedings of the 35th Wind Energy Symposium, Grapevine, TX, USA, 9–13 January 2017. [Google Scholar]
  14. Whelan, J.I.; Graham, J.M.R.; Peiró, J. A Free-Surface and Blockage Correction for Tidal Turbines. J. Fluid Mech. 2009, 624, 281–291. [Google Scholar] [CrossRef]
  15. Muchala, S.; Willden, R.H.J. Impact of Tidal Turbine Support Structures on Realizable Turbine Farm Power. Renew. Energy 2017, 114, 588–599. [Google Scholar] [CrossRef]
  16. Koh, W.X.M.; Ng, E.Y.K. Effects of Reynolds Number and Different Tip Loss Models on the Accuracy of BEM Applied to Tidal Turbines as Compared to Experiments. Ocean. Eng. 2016, 111, 104–115. [Google Scholar] [CrossRef]
  17. Pucci, M.; Di Garbo, C.; Bellafiore, D.; Zanforlin, S.; Umgiesser, G. A BEM-Based Model of a Horizontal Axis Tidal Turbine in the 3D Shallow Water Code SHYFEM. J. Mar. Sci. Eng. 2022, 10, 1864. [Google Scholar] [CrossRef]
  18. Zhang, Y.; Mittal, S.; Ng, E.Y.-K. CFD Validation of Moment Balancing Method on Drag-Dominant Tidal Turbines (DDTTs). Processes 2023, 11, 1895. [Google Scholar] [CrossRef]
  19. Cacciali, L.; Battisti, L.; Dell’Anna, S. Multi-Array Design for Hydrokinetic Turbines in Hydropower Canals. Energies 2023, 16, 2279. [Google Scholar] [CrossRef]
  20. HE-Powergreen. HE-PowerGreen|Pure Hydro Power. Available online: https://www.he-powergreen.it/ (accessed on 28 July 2023).
  21. Malini, C. Il Canale Biffis. Serie Acque e Bonifiche; Sometti Editoriale: Mantova, Italy, 2017; ISBN 8874956762. [Google Scholar]
  22. Abu Bakar, N.A.; Mohd Shamsuddin, M.S.; Kamaruddin, N.M. Experimental Study of a Hybrid Turbine for Hydrokinetic Applications on Small Rivers in Malaysia. J. Adv. Res. Appl. Sci. Eng. Technol. 2022, 28, 318–324. [Google Scholar] [CrossRef]
  23. Aliferis, A.D.; Jessen, M.S.; Bracchi, T.; Hearst, R.J. Performance and Wake of a Savonius Vertical-Axis Wind Turbine under Different Incoming Conditions. Wind. Energy 2019, 22, 1260–1273. [Google Scholar] [CrossRef]
  24. Kang, C.; Opare, W.; Pan, C.; Zou, Z. Upstream Flow Control for the Savonius Rotor under Various Operation Conditions. Energies 2018, 11, 1482. [Google Scholar] [CrossRef]
  25. Yuwono, T.; Sakti, G.; Nur Aulia, F.; Chandra Wijaya, A. Improving the Performance of Savonius Wind Turbine by Installation of a Circular Cylinder Upstream of Returning Turbine Blade. Alex. Eng. J. 2020, 59, 4923–4932. [Google Scholar] [CrossRef]
  26. Zhang, B.; Song, B.; Mao, Z.; Tian, W. A Novel Wake Energy Reuse Method to Optimize the Layout for Savonius-Type Vertical Axis Wind Turbines. Energy 2017, 121, 341–355. [Google Scholar] [CrossRef]
  27. Kumar, A.; Saini, G. Flow Field and Performance Study of Savonius Water Turbine. Mater. Today Proc. 2021, 46, 5219–5222. [Google Scholar] [CrossRef]
  28. Salazar Marin, E.A.; Rodríguez, A.F. Design, Assembly and Experimental Tests of a Savonius Type Wind Turbine. Sci. Tech. 2019, 24, 397–407. [Google Scholar] [CrossRef]
  29. Crooks, J.M.; Hewlin, R.L.; Williams, W.B. Computational Design Analysis of a Hydrokinetic Horizontal Parallel Stream Direct Drive Counter-Rotating Darrieus Turbine System: A Phase One Design Analysis Study. Energies 2022, 15, 8942. [Google Scholar] [CrossRef]
  30. Adams, T.; Grant, C.; Watson, H. A Simple Algorithm to Relate Measured Surface Roughness to Equivalent Sand-Grain Roughness. Int. J. Mech. Eng. Mechatron. 2012, 1, 66–71. [Google Scholar] [CrossRef]
  31. Process Engineer’s Tools. Surface Roughness of Common Materials—Table of Reference Values. Powderprocess.net. Available online: https://www.powderprocess.net/Tools_html/Data_Diagrams/Pipe_Roughness.html (accessed on 28 July 2023).
  32. Hara, Y.; Hara, K.; Hayashi, T. Moment of Inertia Dependence of Vertical Axis Wind Turbines in Pulsating Winds. Int. J. Rotating Mach. 2012, 2012, 910940. [Google Scholar] [CrossRef]
  33. Cebeci, T.; Bradshaw, P. Momentum Transfer in Boundary Layers; Hemisphere Publishing: London, UK; McGraw-Hill: New York, NY, USA, 1977; pp. 176–180. [Google Scholar]
  34. Menon, S.H.; Mathew, J.; Jayaprakash, J. Derivation of Navier—Stokes Equation in Rotational Frame for Engineering Flow Analysis. Int. J. Thermofluids 2021, 11, 100096. [Google Scholar] [CrossRef]
  35. Yang, B.; Lawn, C. Fluid Dynamic Performance of a Vertical Axis Turbine for Tidal Currents. Renew. Energy 2011, 36, 3355–3366. [Google Scholar] [CrossRef]
Figure 1. Four aligned VAWT crossflow hydrokinetic turbines installed in a uniform canal configuration (Reprinted/adapted with permission from Ref. [20]. 2023, HE Powergreen S.r.l).
Sustainability 15 14187 g001
Figure 2. Cross-section view of the boundary walls of the CFD model modified by the Biffis canal from Malini (Reprinted/adapted with permission from Ref. [21]. 2023, Il Canale Biffis. Serie Acque e Bonifiche; Sometti Editoriale: Mantova, Italy).
Sustainability 15 14187 g002
Figure 3. Perspective view of the computation flow domain for the Pinwheel/Savonius CFD simulations (3-D).
Sustainability 15 14187 g003aSustainability 15 14187 g003b
Figure 4. Volume mesh overview for (a) Pinwheel and (b) Savonius turbine.
Sustainability 15 14187 g004
Figure 5. Mesh cross-section views for (a) Pinwheel and (b) Savonius turbine.
Sustainability 15 14187 g005
Figure 6. Grid independence test for (a) Pinwheel and (b) Savonius turbine.
Sustainability 15 14187 g006
Figure 7. Lateral view of the computation flow domain for the Pinwheel/Savonius CFD simulations (3-D).
Sustainability 15 14187 g007
Figure 8. M i d l e ω quadratic relationship for (a) Pinwheel and (b) Savonius turbines. “The red dash line is the fitted quadric curve”.
Sustainability 15 14187 g008
Figure 9. M T h r u s t U 1 quadratic relationship for (a) Pinwheel and (b) Savonius turbines. “The red dash line is the fitted quadric curve”.
Sustainability 15 14187 g009
Figure 10. Net, thrust, and idle moments curves for (a) Pinwheel and (b) Savonius turbines.
Sustainability 15 14187 g010
Figure 11. C p T S R curve for the optimal neutral point for (a) Pinwheel and (b) Savonius turbines.
Sustainability 15 14187 g011
Figure 12. Flow characteristics for Pinwheel turbine at TSR = 3.0.
Sustainability 15 14187 g012
Figure 13. Flow characteristics for the Savonius turbine at TSR = 1.65.
Sustainability 15 14187 g013
Figure 16. Cp vs TSR curve near the neutral point of k-ε (black dash) and k-ω (red) turbulence model for the Savonius turbine.
Sustainability 15 14187 g016
Figure 17. Pinwheel turbine traditional (top) and optimised configurations (bottom) of front-cutting (bottom left) and edge-cutting (bottom right) (Reprinted/adapted with permission from Ref. [4]. 2023, Nemoto, Y.; Ushiyama, I. Experimental Study of a Pinwheel-Type Wind Turbine. Wind. Eng. 2003, 27, 227–236. https://doi.org/10.1260/030952403769016708).
Sustainability 15 14187 g017
Table 1. Scales of the CFD Models.
ParameterPinwheelSavonius
Blade Radius [m]0.300.211
Rotor Diameter [m]0.600.422
Rotor Height [m]0.600.670
End-Plate Diameter [m]-0.235
Blade Area [m2]0.283
Channel Width [m]3.370
Channel Height [m]2.137
Channel Area [m2]2.358 (3.370 × 2.137)
Aspect Ratio1.85
Blockage Ratio0.12
Table 2. Summary of the net, idle, and thrust moment cases in CFD simulation cases.
Target SetInitial SetConditions in CFD
M T h r u s t U 1 , 0 Static turbine, varying inlet flow velocity
M I d l e 0 , ω Rotating turbine, fixed inlet flow velocity
M N e t U 1 , ω Rotating turbine, varying inlet flow velocity
Table 3. Dynamic TSR matrix in different initial conditions for Pinwheel rotor.
TSRRotational Speed ω (rad/s)
6.677.508.008.17
Inlet
speed U1
(m/s)
0.45.005.636.006.13
0.54.004.504.804.90
0.63.343.754.004.09
0.72.863.213.433.50
0.82.502.813.003.06
0.92.222.502.672.72
1.02.002.252.402.45
Table 4. Dynamic TSR matrix in different initial conditions for Savonius rotor.
TSRRotational Speed ω (rad/s)
4.505.255.756.006.256.75
Inlet speed U1 (m/s)0.332.883.363.683.844.004.32
0.462.062.412.642.752.873.10
0.501.902.222.432.532.642.85
0.541.762.052.252.342.442.64
0.671.421.651.811.891.972.13
0.831.141.331.461.531.591.72
Table 5. Validation for characteristic optimal TSR values.
ModelReference Experiment
Result
Simulation ResultError Percentage
Pinwheel
(Optimal TSR) [4]
2.0
For traditional Pinwheel
2.537 2.537 2.0 2.537 ×   100 = + 21.16 %
3.5
For optimal aerodynamic shape Pinwheel
2.537 2.537 3.5 3.5 ×   100 = 37.96 %
Savonius
(Optimal TSR) [27]
0.70.671 (   0.671 0.7 0.671 ) ×   100 = + 4.32 %
Table 6. Basin efficiency η under different inflow speeds U1 for Pinwheel and Savonius turbine.
PinwheelU1TSRU2PusefulPremovedηWDL (in m)
1.002.00.924255.461208.4821.14%0.92
0.902.50.822208.87880.9823.71%1.15
0.803.00.724160.46618.7425.93%1.38
0.703.50.628115.23414.5127.80%1.57
0.604.00.53575.93261.0329.09%1.64
0.504.50.45345.93151.0625.58%1.70
0.405.00.37224.6777.3419.62%1.75
SavoniusU1TSRU2PusefulPremovedηWDL (in m)
0.831.140.787108.86698.5115.59%0.98
0.671.650.63647.93358.6013.37%1.07
0.542.250.50635.58192.4118.49%1.26
0.502.530.46033.32151.0622.06%1.22
0.462.870.41730.19117.6325.67%1.34
0.334.320.3049.3543.4321.52%1.58
Disclaimer/Publisher’s Note: The statements, opinions and data contained in all publications are solely those of the individual author(s) and contributor(s) and not of MDPI and/or the editor(s). MDPI and/or the editor(s) disclaim responsibility for any injury to people or property resulting from any ideas, methods, instructions or products referred to in the content.