
Bioremediation of Metal-Polluted Industrial Wastewater with Algal-Bacterial Consortia: A Sustainable Strategy

 , and
, and
Abstract
:1. Introduction
2. Materials and Methods
2.1. Species Collection
2.2. Industrial Effluent Collection
2.3. Experimental Design
2.4. Sample Preparation and Extraction of HMs from Algae-Bacteria Consortium
2.5. Water Analysis
2.5.1. pH and Electric Conductivity (EC)
2.5.2. Sulphide
2.5.3. Fluoride
2.5.4. Chloride
2.5.5. Calcium, Magnesium and Total Hardness
2.5.6. Colour and Turbidity
2.5.7. Biological Oxygen Demand (BOD)
2.5.8. Chemical Oxygen Demand (COD)
2.5.9. Total Suspended Solids (TSS)
2.5.10. HM Analysis
2.6. Formula
2.6.1. Bioconcentration Factor (BCF) (%)
2.6.2. Bioremoval Efficiency (%)
2.7. Statistical Analysis
3. Results and Discussion
3.1. Physiochemical Parameters of Water Sample
3.2. Heavy Metal Analysis
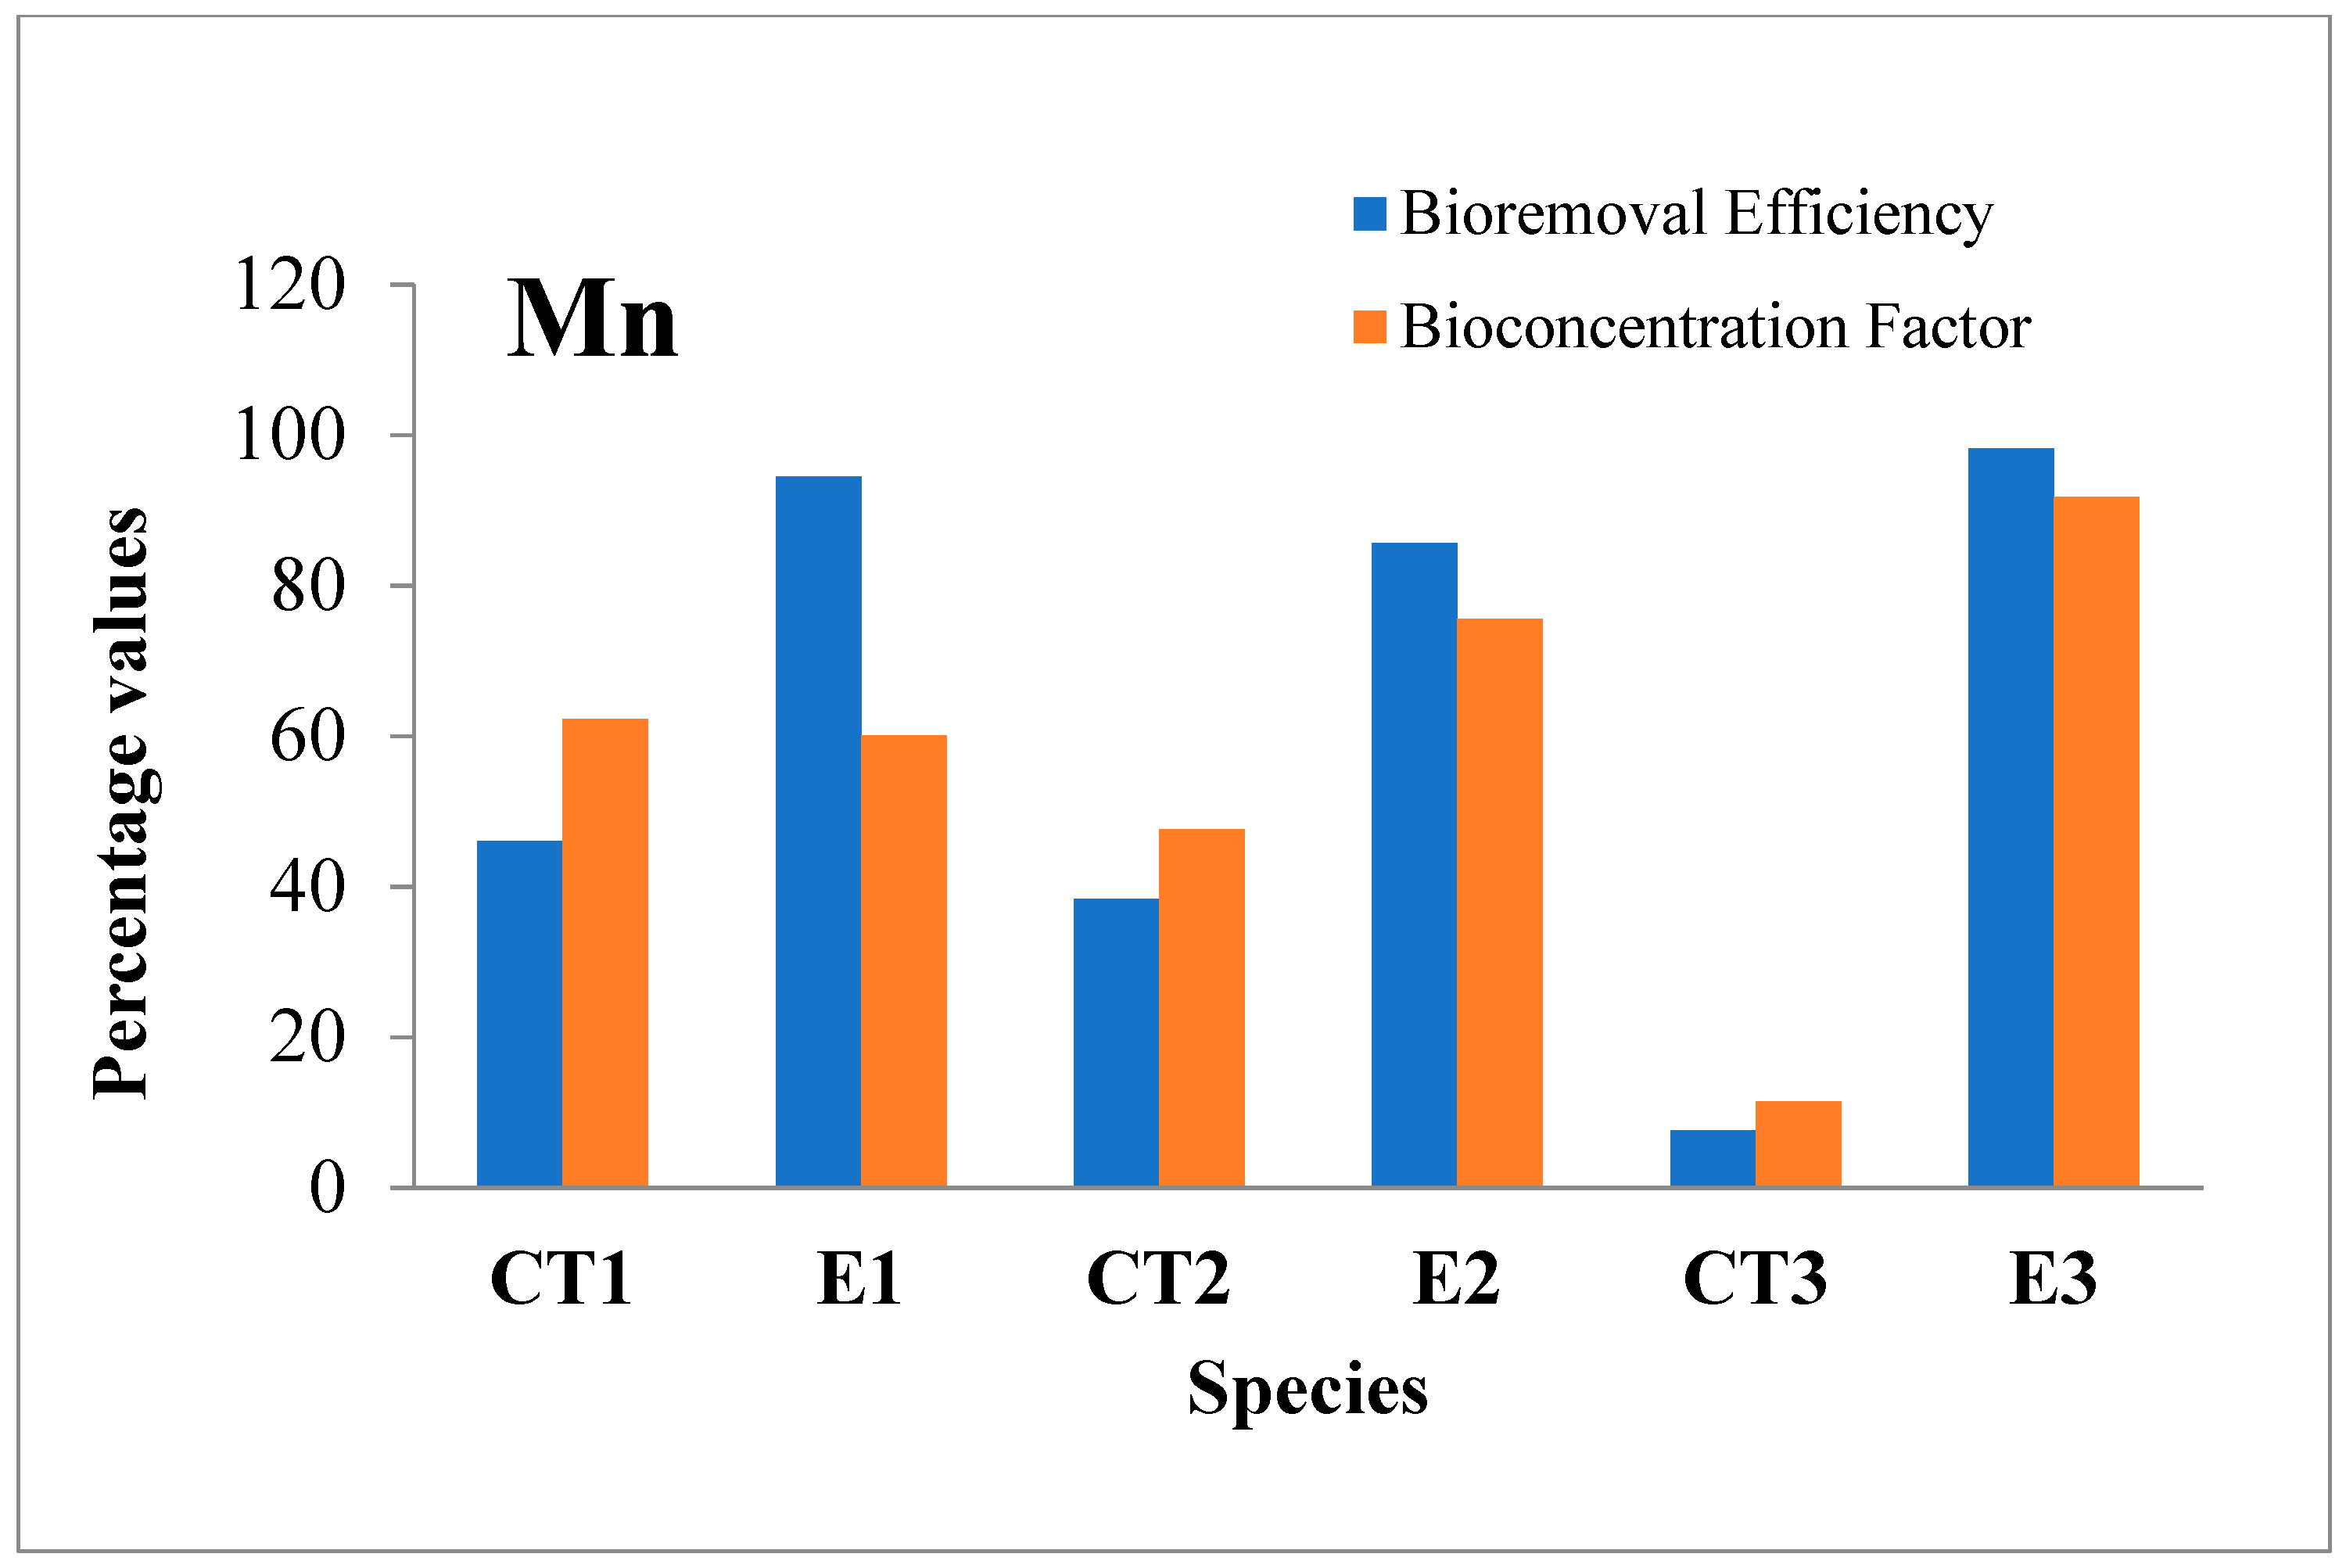
3.2.1. Manganese (Mn)
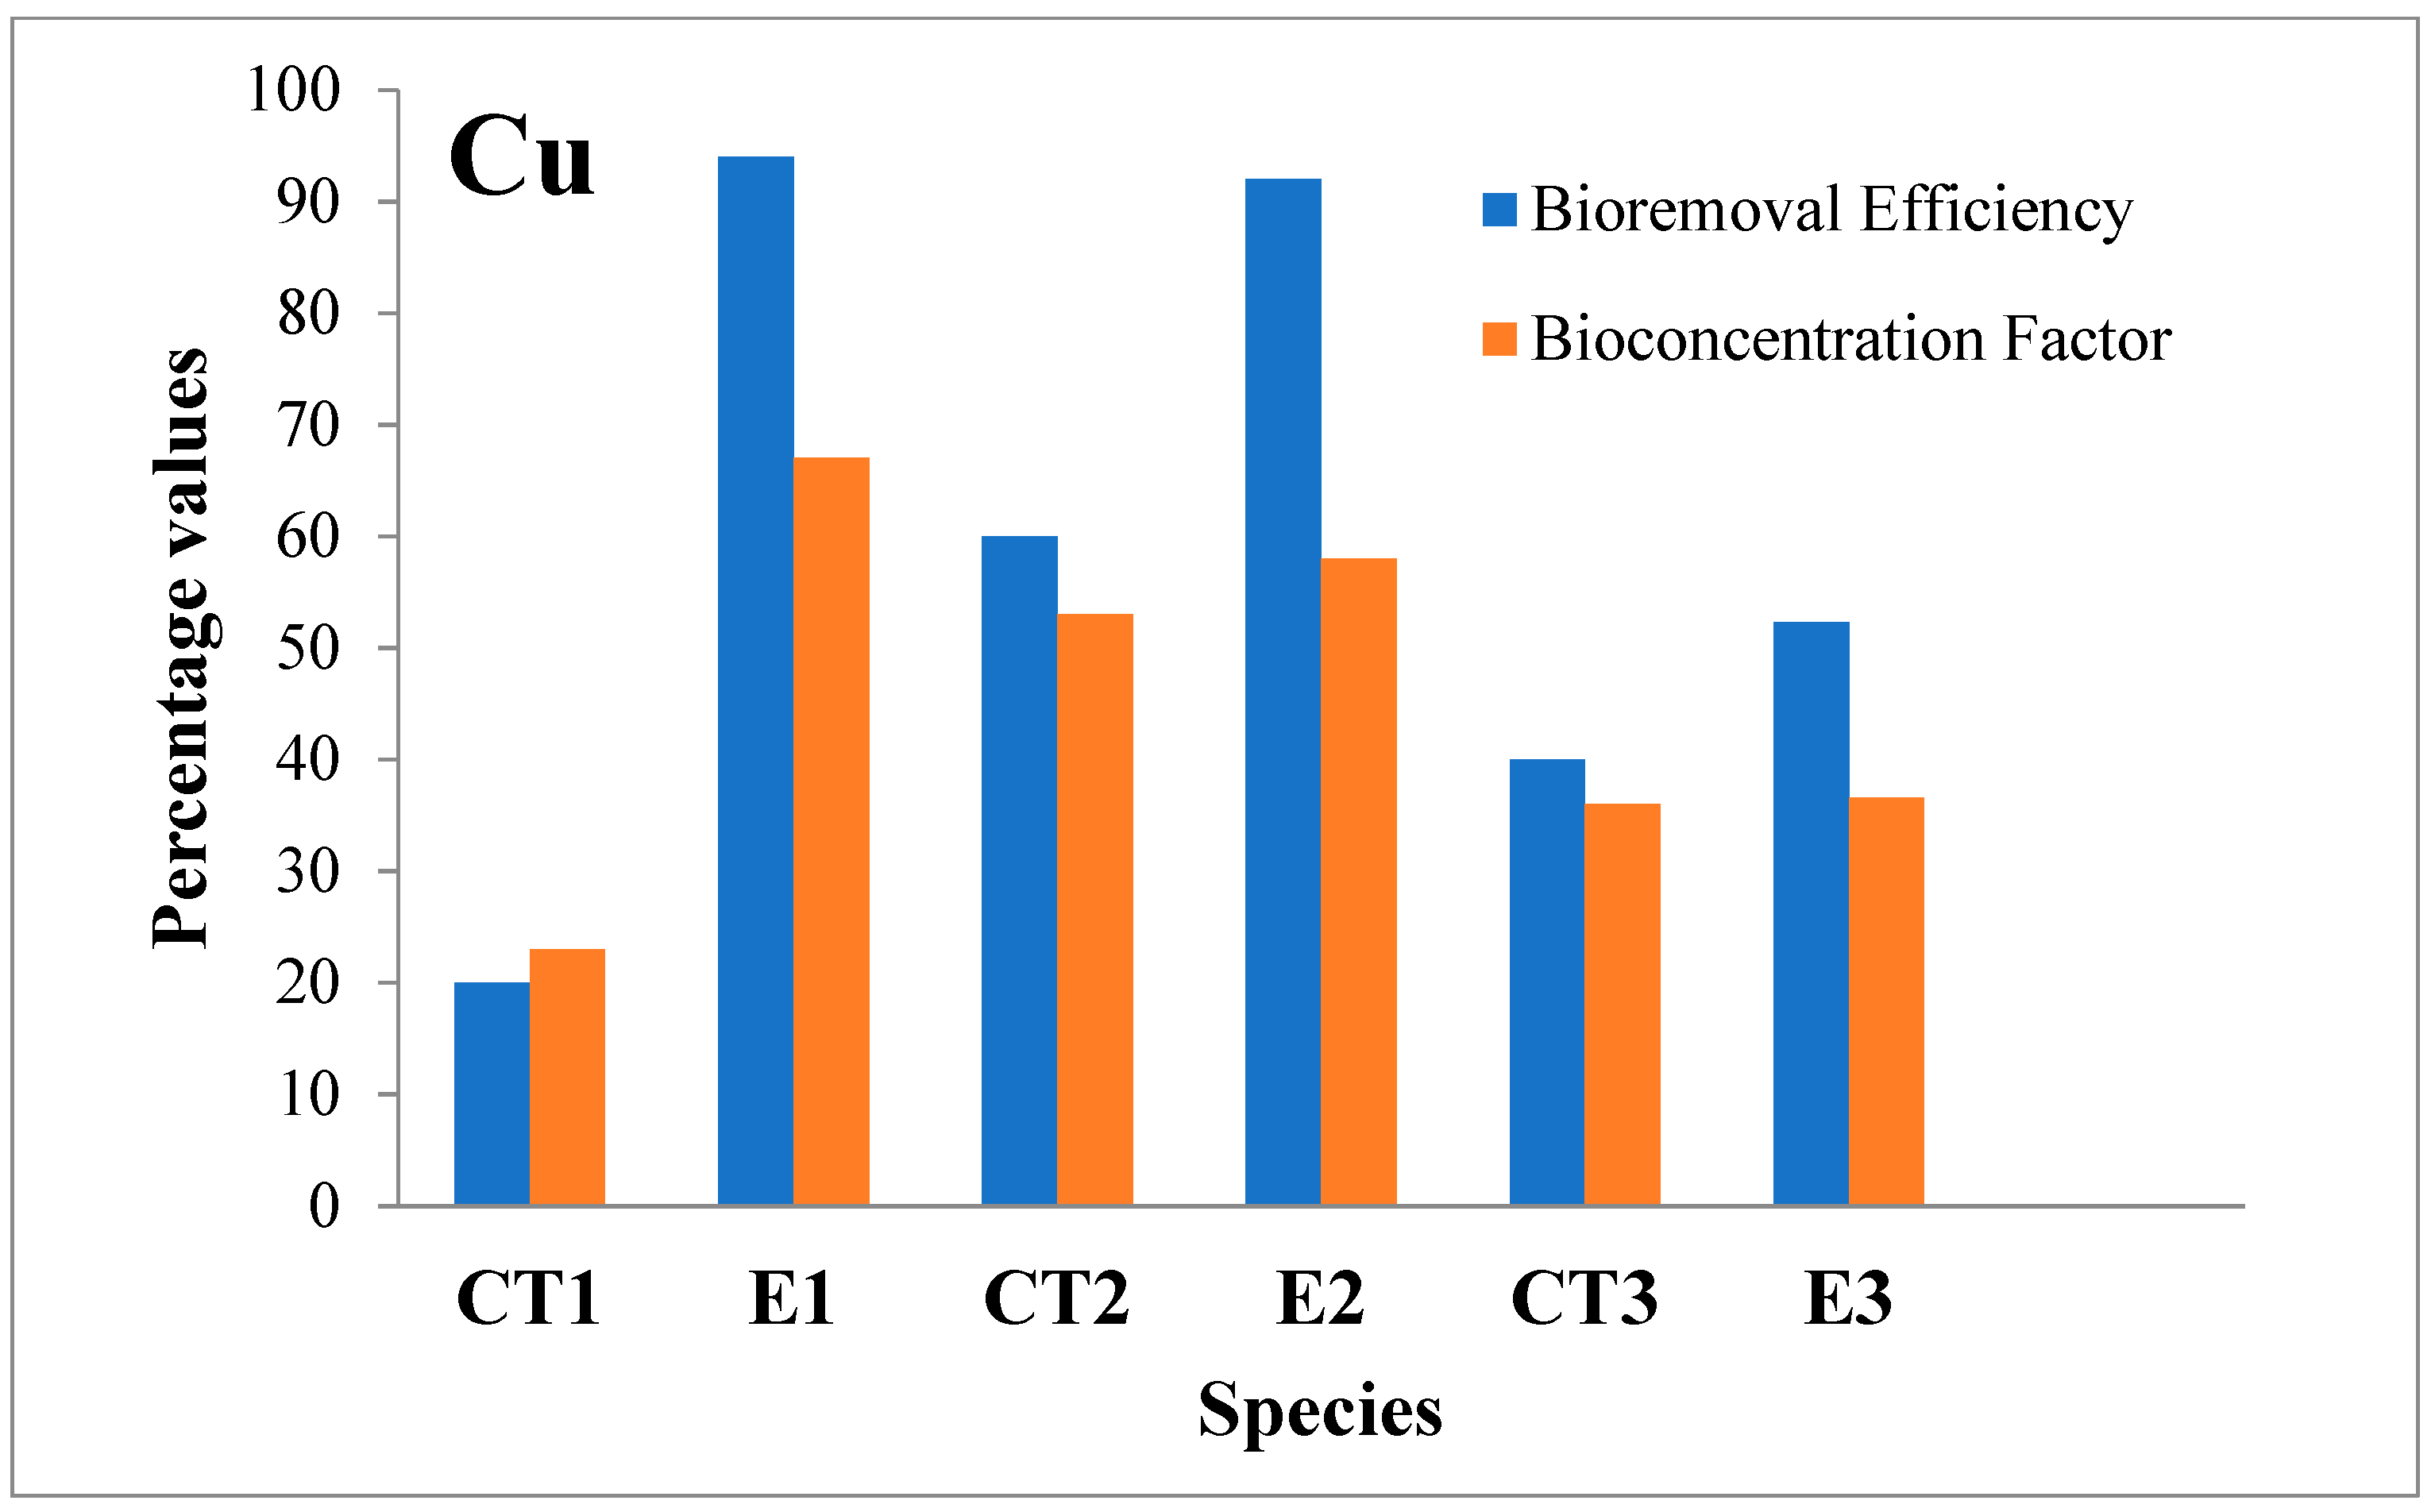
3.2.2. Copper (Cu)
3.2.3. Chromium (Cr)
3.2.4. Cadmium (Cd)
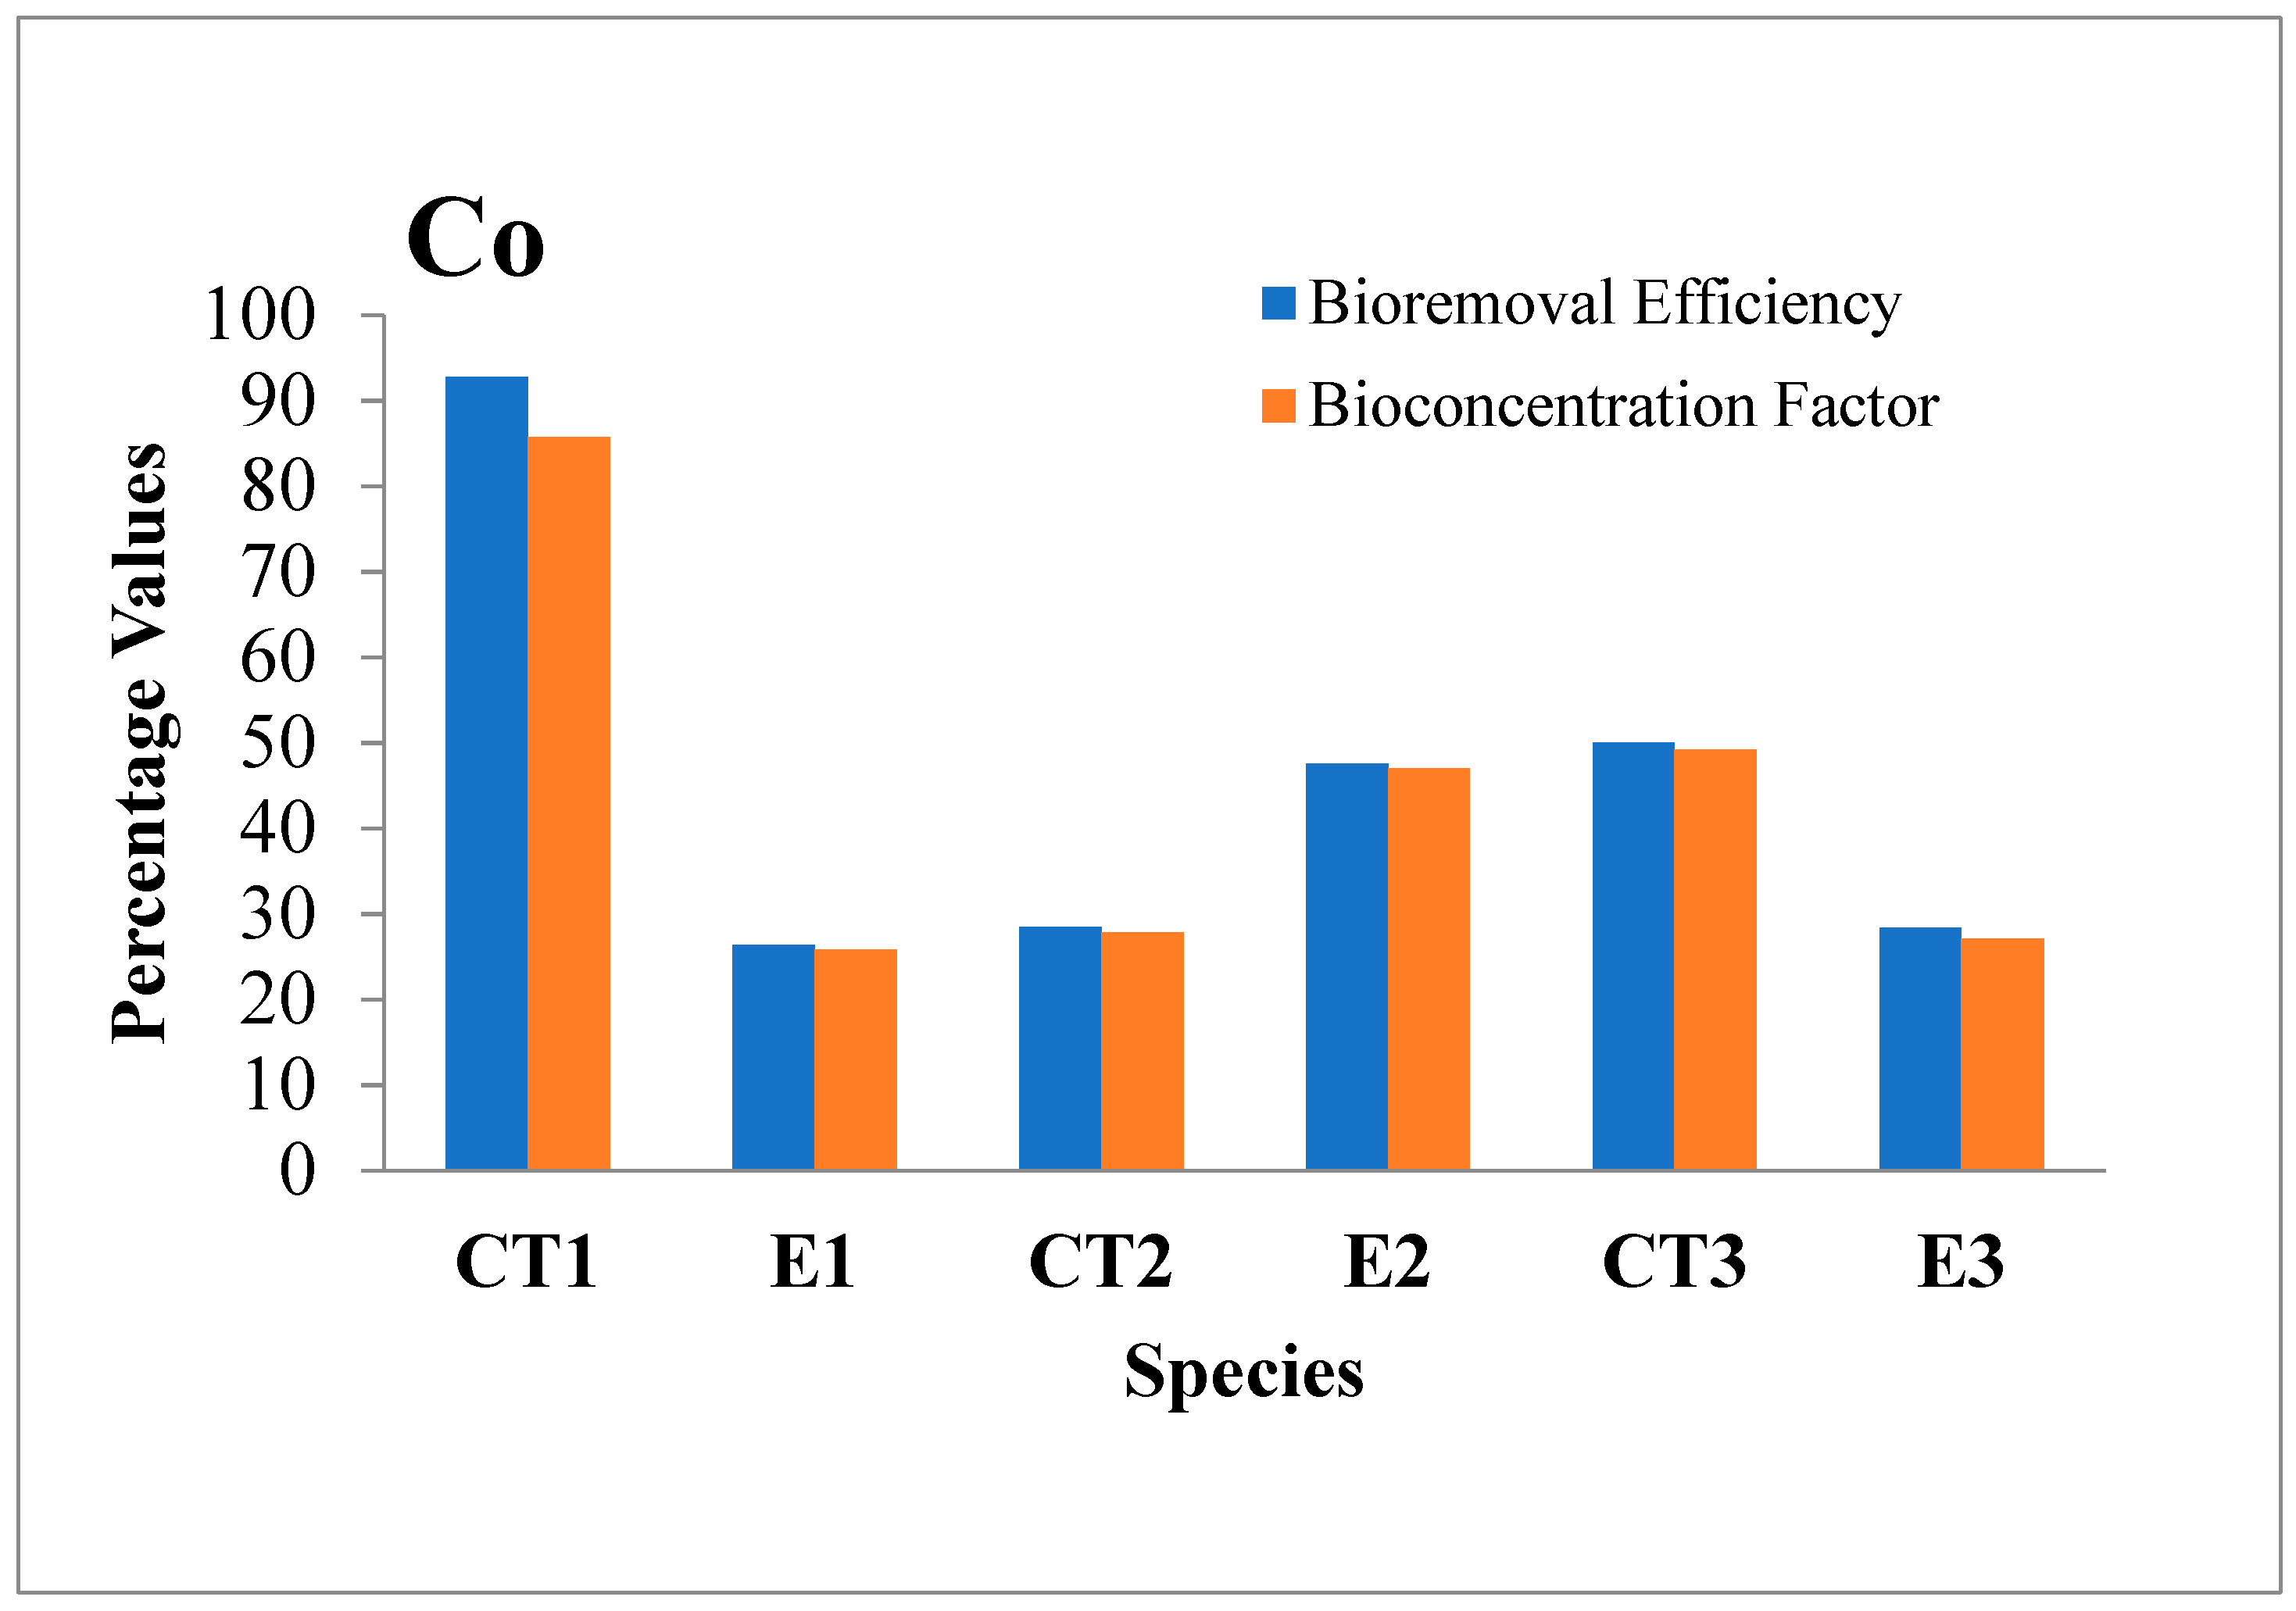
3.2.5. Cobalt (Co)
3.2.6. Silver (Ag)
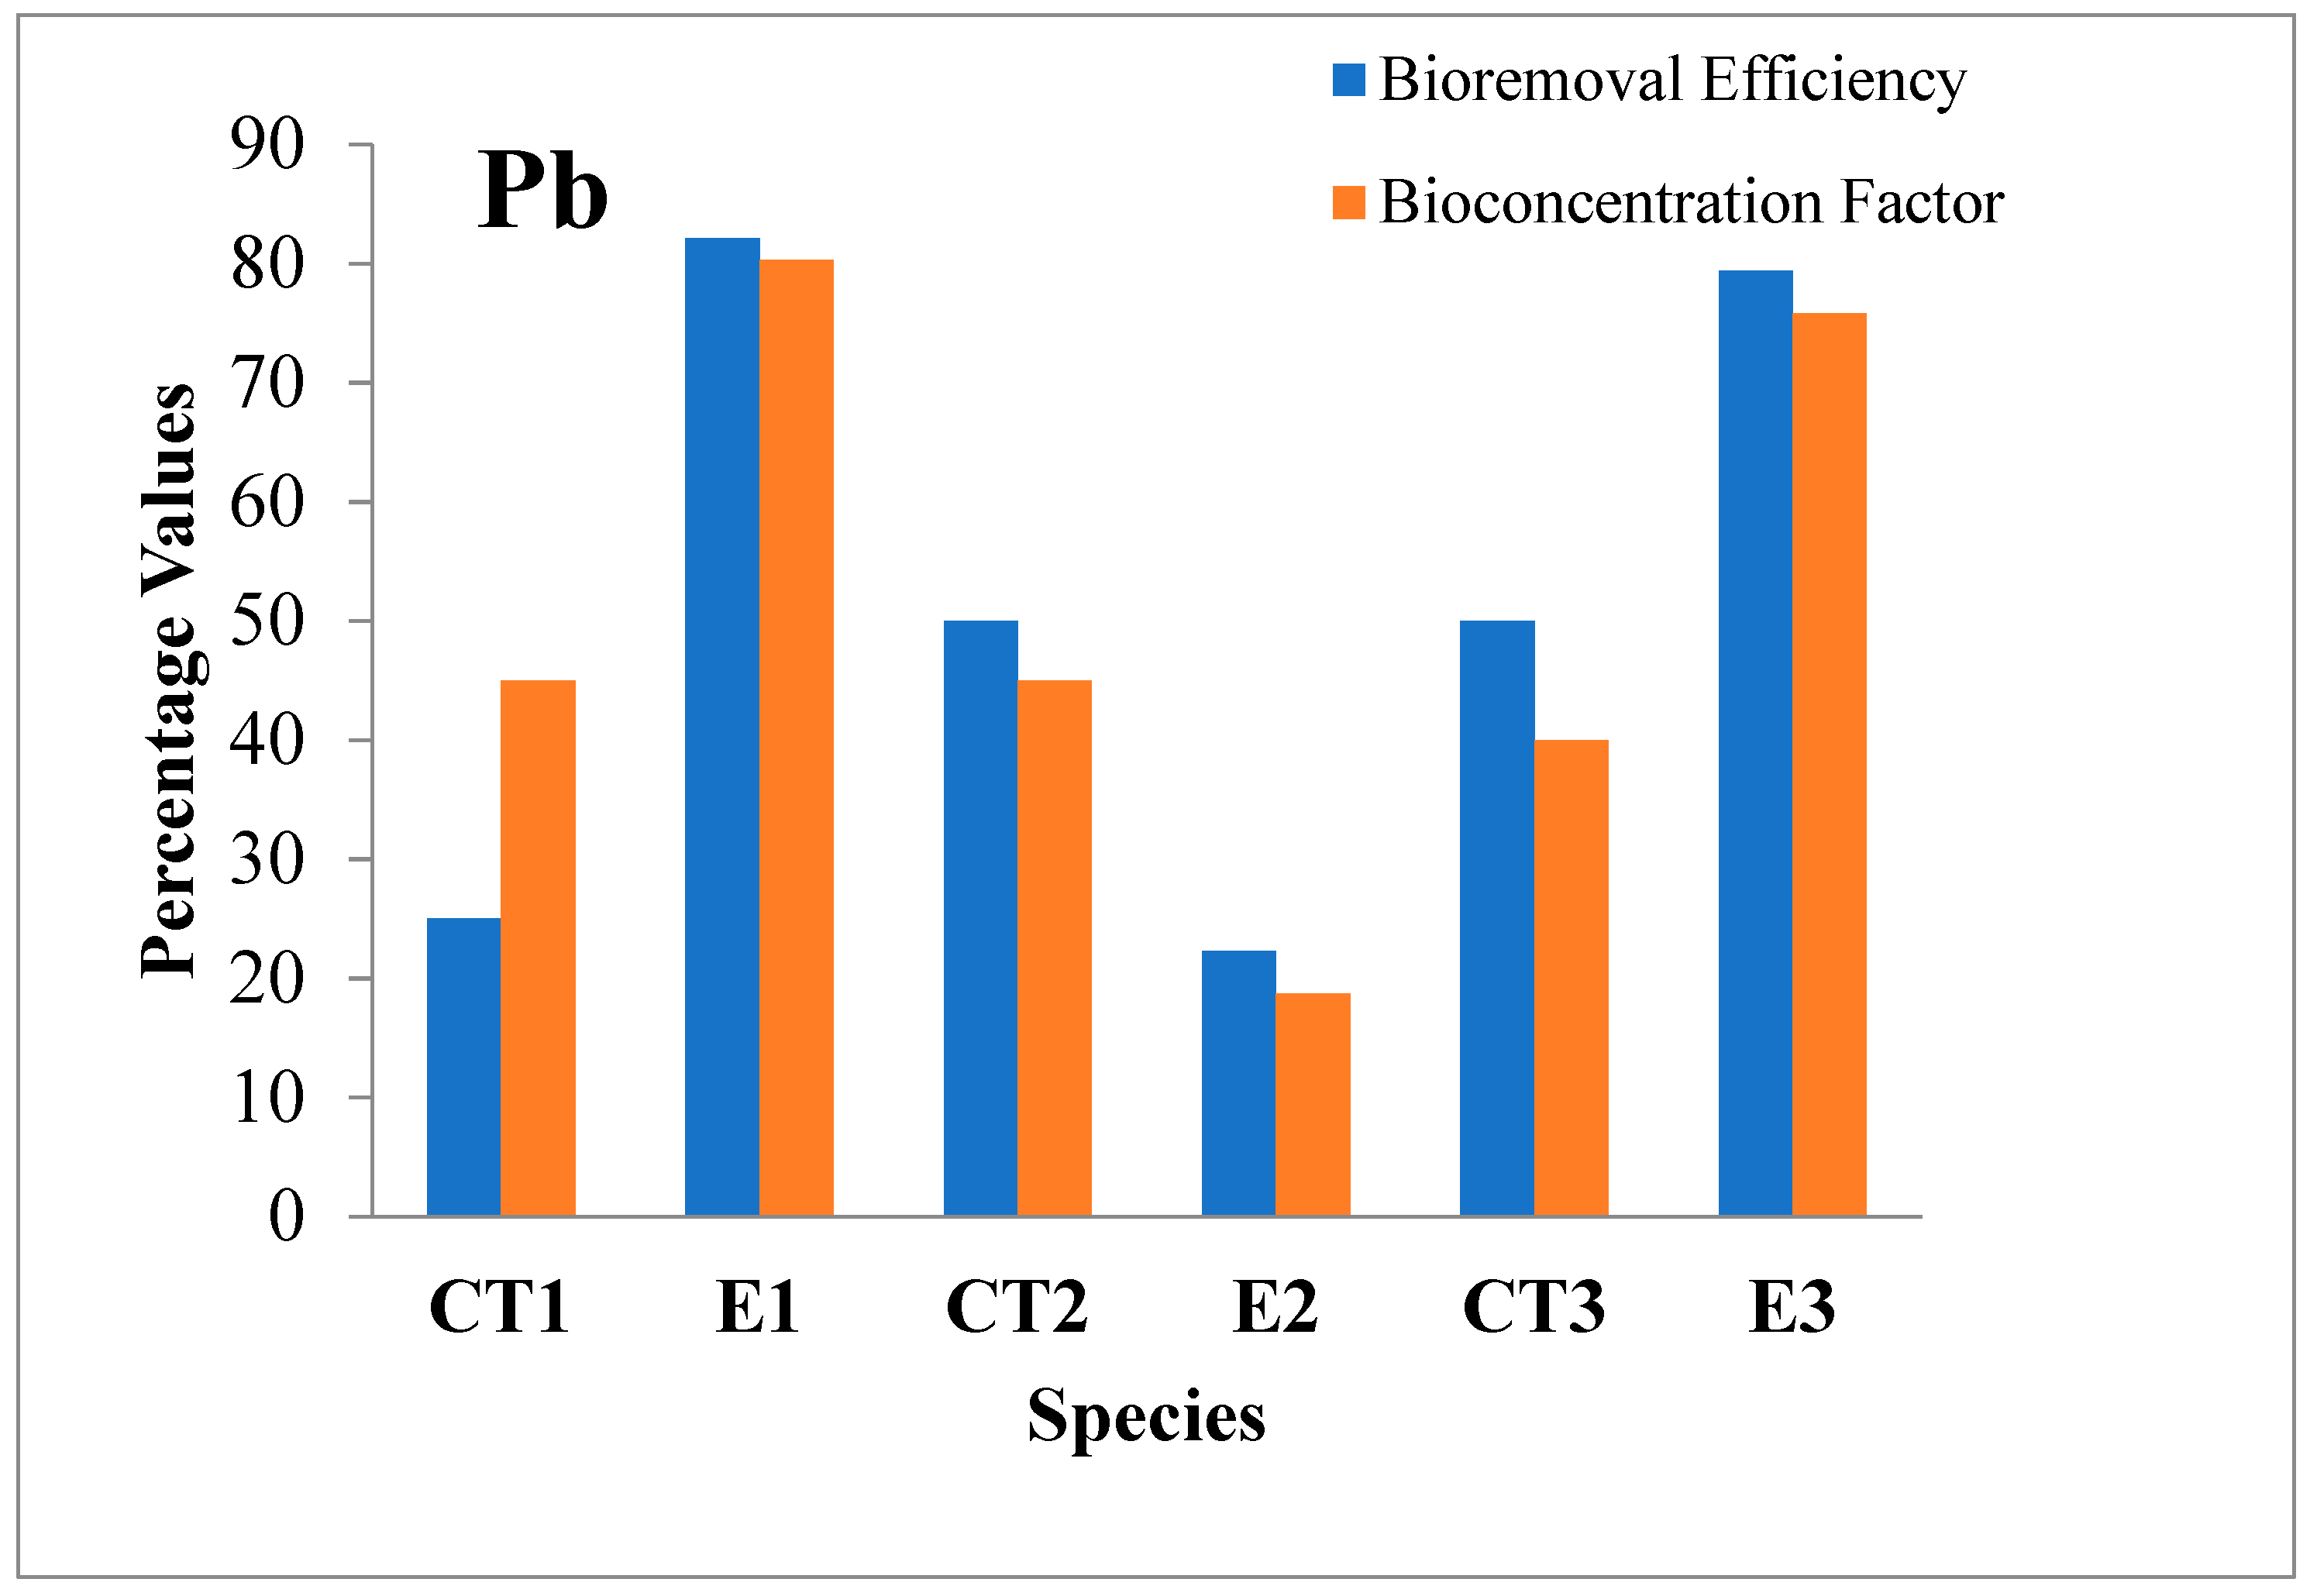
3.2.7. Lead (Pb)
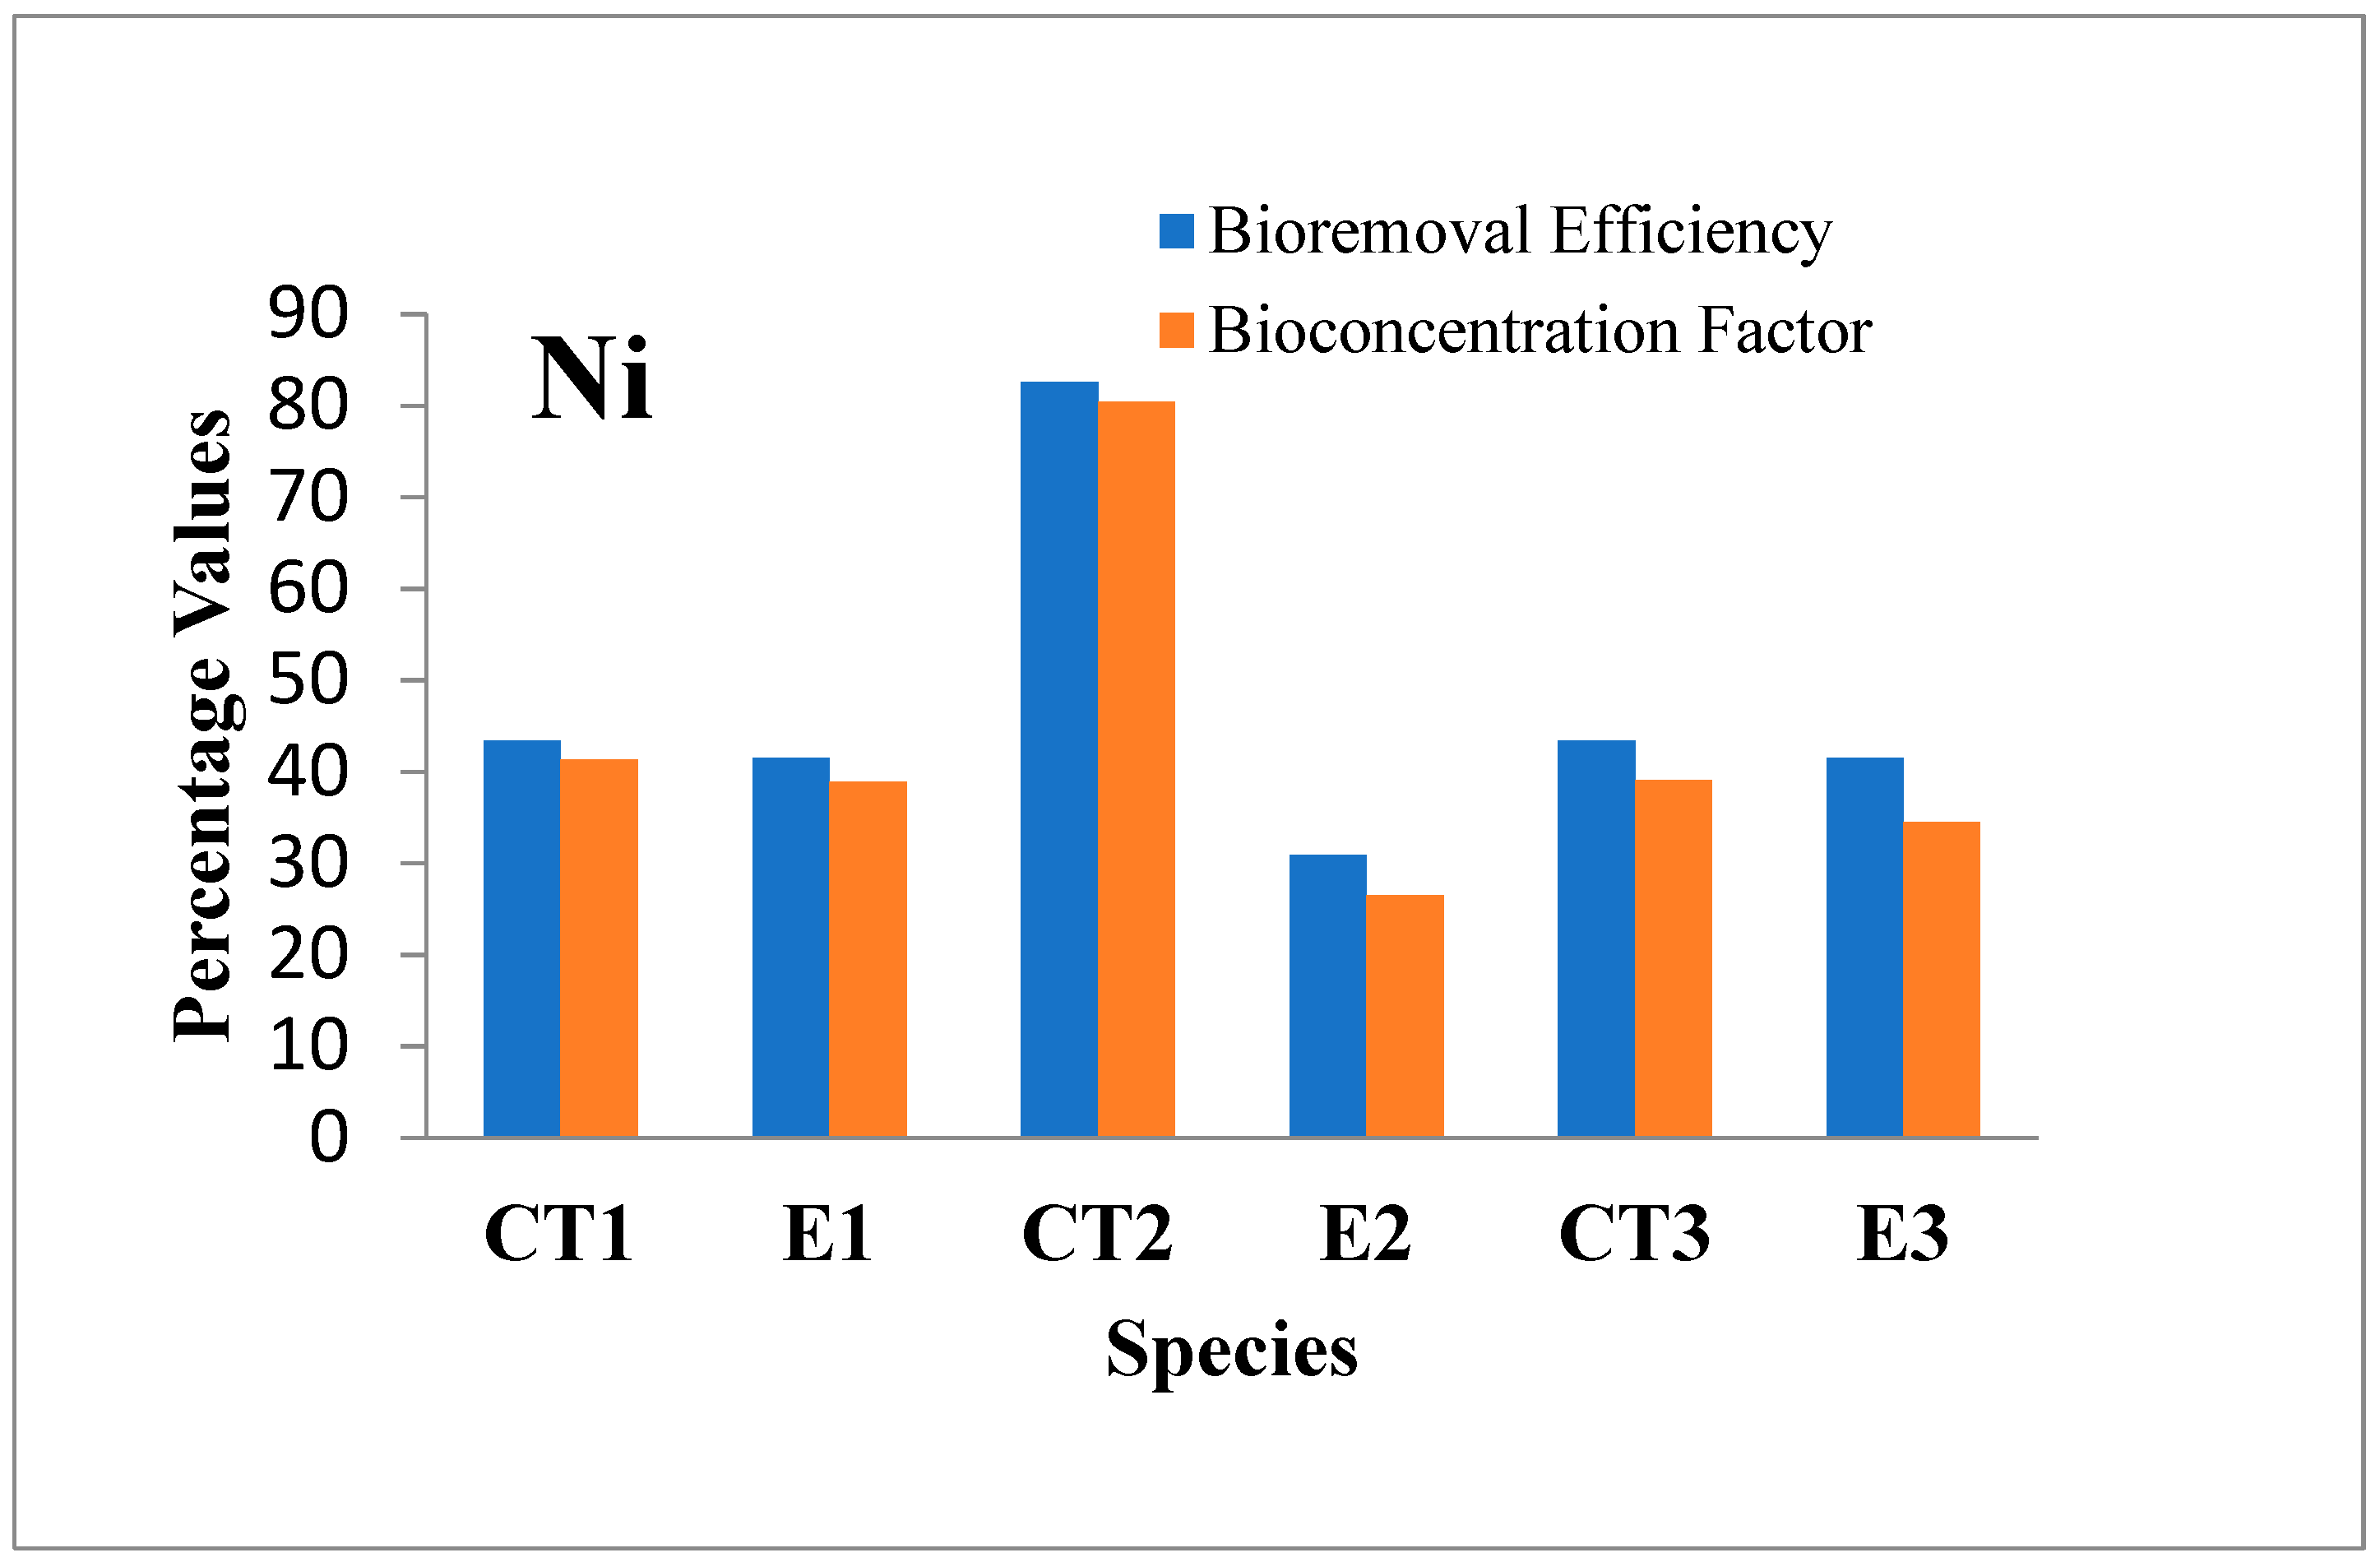
3.2.8. Nickel (Ni)
3.2.9. Calcium (Ca)
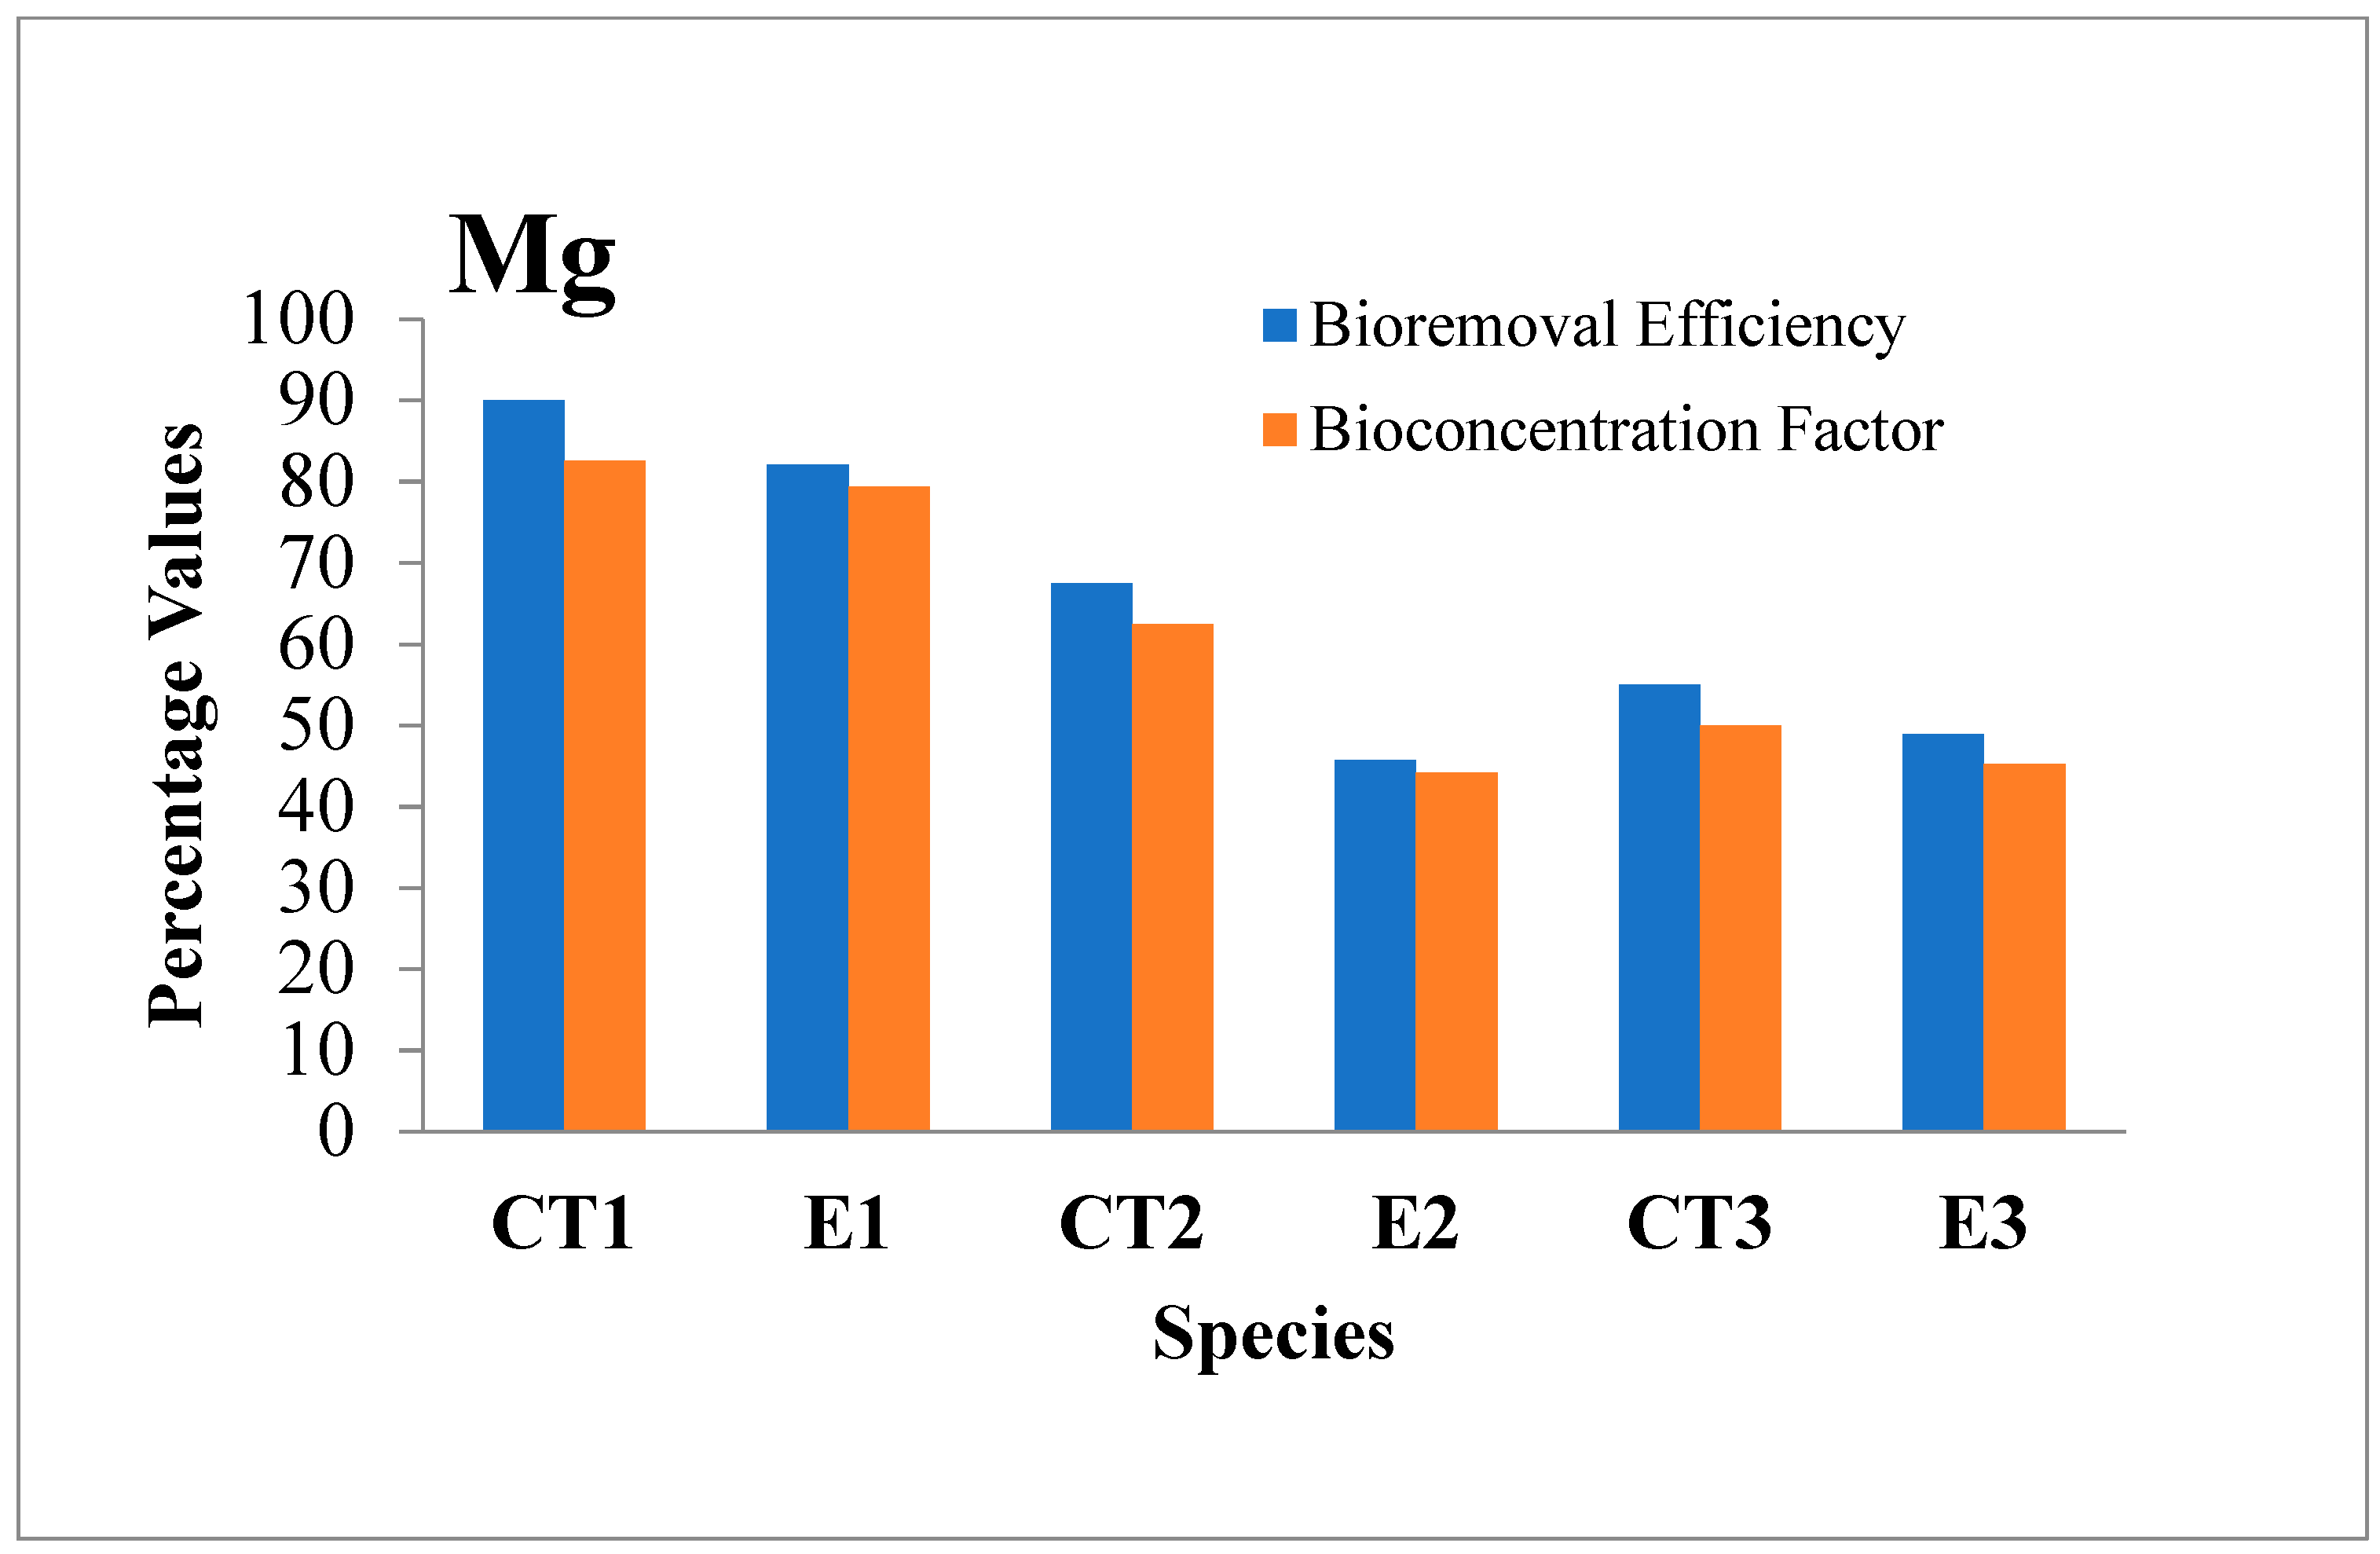
3.2.10. Magnesium (Mg)
4. Conclusions
Supplementary Materials
Author Contributions
Funding
Institutional Review Board Statement
Informed Consent Statement
Data Availability Statement
Acknowledgments
Conflicts of Interest
References
- Li, F.J.; Yang, H.W.; Ayyamperumal, R.; Liu, Y. Pollution, Sources, and Human Health Risk Assessment of Heavy Metals in Urban Areas around Industrialization and Urbanization-Northwest China. Chemosphere 2022, 308, 136396. [Google Scholar] [CrossRef] [PubMed]
- Khan, S.; Ullah, A.; Ayaz, T.; Aziz, A.; Aman, K.; Habib, M.; Yilmaz, S.; Farid, A.; Yasmin, H.; Ali, Q. Phycoremediation of Industrial Wastewater Using Vaucheria debaryana and Cladophora glomerata. Environ. Monit. Assess. 2023, 195, 825. [Google Scholar] [CrossRef] [PubMed]
- Sharma, P.; Dutta, D.; Udayan, A.; Kumar, S. Industrial Wastewater Purification through Metal Pollution Reduction Employing Microbes and Magnetic Nanocomposites. J. Environ. Chem. Eng. 2021, 9, 106673. [Google Scholar]
- Yaqoob, A.A.; Ibrahim, M.N.M.; Ahmad, A.; Vijaya Bhaskar Reddy, A. Toxicology and Environmental Application of Carbon Nanocomposite. In Environmental Remediation through Carbon Based Nano Composites; Springer: New York, NY, USA, 2021; pp. 1–18. [Google Scholar]
- Alabdeh, D.; Karbassi, A.R.; Omidvar, B.; Sarang, A. Speciation of Metals and Metalloids in Anzali Wetland, Iran. Int. J. Environ. Sci. Technol. 2020, 17, 1411–1424. [Google Scholar] [CrossRef]
- Zhang, Q.; Xu, E.G.; Li, J.; Chen, Q.; Ma, L.; Zeng, E.Y.; Shi, H. A Review of Microplastics in Table Salt, Drinking Water, and Air: Direct Human Exposure. Environ. Sci. Technol. 2020, 54, 3740–3751. [Google Scholar] [CrossRef] [PubMed]
- Zaynab, M.; Al-Yahyai, R.; Ameen, A.; Sharif, Y.; Ali, L.; Fatima, M.; Ali Khan, K.; Li, S. Health and Environmental Effects of Heavy Metals. J. King Saud Univ. Sci. 2022, 34, 101653. [Google Scholar]
- Shovon, M.N.H.; Majumdar, B.C.; Rahman, Z. Heavy Metals (Lead, Cadmium, and Nickel) Concentration in Different Organs of Three Commonly Consumed Fishes in Bangladesh. Fish. Aquac. J. 2017, 8, 1–6. [Google Scholar]
- Uddin, M.N.; Desai, F.; Asmatulu, E. Engineered Nanomaterials in the Environment: Bioaccumulation, Biodilution, and Biotransformation. Environ. Chem. Lett. 2020, 18, 1073–1083. [Google Scholar] [CrossRef]
- Rakib, M.R.J.; Rahman, M.A.; Onyena, A.P.; Kumar, R.; Sarker, A.; Hossain, M.B.; Islam, A.R.M.T.; Islam, M.S.; Rahman, M.M.; Jolly, Y.N. A Comprehensive Review of Heavy Metal Pollution in the Coastal Areas of Bangladesh: Abundance, Bioaccumulation, Health Implications, and Challenges. Environ. Sci. Pollut. Res. 2022, 29, 67532–67558. [Google Scholar]
- Alengebawy, A.; Abdelkhalek, S.T.; Qureshi, S.R.; Wang, M.Q. Heavy Metals and Pesticides Toxicity in Agricultural Soil and Plants: Ecological Risks and Human Health Implications. Toxics 2021, 9, 42. [Google Scholar] [CrossRef]
- Ayaz, T.; Khan, S.; Khan, A.Z.; Lei, M.; Alam, M. Remediation of Industrial Wastewater Using Four Hydrophyte Species: A Comparison of Individual (Pot Experiments) and Mixed Plants (Constructed Wetland). J. Environ. Manag. 2020, 255, 109833. [Google Scholar] [CrossRef] [PubMed]
- Fei, Y.; Hu, Y.H. Recent Progress in Removal of Heavy Metals from Wastewater: A Comprehensive Review. Chemosphere 2023, 335, 139077. [Google Scholar] [CrossRef] [PubMed]
- Irshad, M.A.; Nawaz, R.; Wojciechowska, E.; Mohsin, M.; Nawrot, N.; Nasim, I.; Hussain, F. Application of Nanomaterials for Cadmium Adsorption for Sustainable Treatment of Wastewater: A Review. Water Air Soil Pollut. 2023, 234, 54. [Google Scholar] [CrossRef]
- Al-Mashhadani, E.S.; Al-Mashhadani, M.K. Utilization of Chlorella vulgaris after the Extraction Process in Wastewater Treatment as a Biosorption Material for Ciprofloxacin Removal. J. Ecol. Eng. 2023, 24, 1–5. [Google Scholar] [CrossRef]
- Solayman, H.M.; Hossen, M.A.; Abd Aziz, A.; Yahya, N.Y.; Hon, L.K.; Ching, S.L.; Zoh, K.D. Performance Evaluation of Dye Wastewater Treatment Technologies: A Review. J. Environ. Chem. Eng. 2023, 11, 109610. [Google Scholar]
- Zapata-Mendoza, P.C.O.; Berrios-Tauccaya, O.J.; Tirado-Kulieva, V.A.; Gonzales-Malca, J.A.; Ricse-Reyes, D.R.; Ber-rios-Zevallos, A.A.; Seminario-Sanz, R.S. Environmentally Friendly Technologies for Wastewater Treatment in Food Processing Plants: A Bibliometric Analysis. Sustainability 2022, 14, 14698. [Google Scholar] [CrossRef]
- Kuanar, A.; Kabi, S.K.; Rath, M.; Dhal, N.K.; Bhuyan, R.; Das, S.; Kar, D. A Comparative Review on Bioremediation of Chromium by Bacterial, Fungal, Algal, and Microbial Consortia. Geomicrobiol. J. 2022, 39, 515–530. [Google Scholar] [CrossRef]
- Rong, H.; Li, Y.; Wang, J.; Zhang, Q.; Cui, B.; Guo, D. Towards advanced mariculture wastewater treatment by bacterial-algal symbiosis system with different bacteria and algae inoculation ratios. J. Water Process Eng. 2023, 53, 103826. [Google Scholar] [CrossRef]
- Cui, B.; Liu, C.; Rong, H.; Luo, S.; Guo, D.; Ji, B. CO2 favors the lipid and biodiesel production of microalgal-bacterial granular sludge. Results Eng. 2023, 17, 100980. [Google Scholar] [CrossRef]
- Saravanan, A.; Kumar, P.S.; Varjani, S.; Jeevanantham, S.; Yaashikaa, P.R.; Thamarai, P.; Abirami, B.; George, C.S. A Review on Algal-Bacterial Symbiotic System for Effective Treatment of Wastewater. Chemosphere 2021, 271, 129540. [Google Scholar] [CrossRef]
- El-Sheekh, M.; Abdel-Daim, M.M.; Okba, M.; Gharib, S.; Soliman, A.; El-Kassas, H. Green Technology for Bioremediation of the Eutrophication Phenomenon in Aquatic Ecosystems: A Review. Afr. J. Aquat. Sci. 2021, 46, 274–292. [Google Scholar] [CrossRef]
- Tariq, M.; Ali, M.; Shah, Z.J.S.E. Characteristics of Industrial Effluents and Their Possible Impacts on Quality of Underground Water. Soil Environ. 2006, 25, 64–69. [Google Scholar]
- Amin, N.; Ayaz, M.; Alam, S.; Gul, S. Heavy Metals Contamination through Industrial Effluent to Irrigation Water in Gadoon Amazai (Swabi) and Hayatabad (Peshawar) Pakistan. J. Sci. Res. 2013, 6, 111–124. [Google Scholar] [CrossRef]
- Khan, M.J.; Jan, M.T.; Khan, K. Effect of Organic and Inorganic Amendments on the Heavy Metal Content of Soil and Wheat Crop Irrigated with Wastewater. Sarhad J. Agric. 2013, 29, 49–57. [Google Scholar]
- Amin, N.U.; Ahmad, T. Contamination of Soil with Heavy Metals from Industrial Effluent and Their Translocation in Green Vegetables of Peshawar, Pakistan. RSC Adv. 2015, 5, 14322–14329. [Google Scholar] [CrossRef]
- Khan, S.; Shamshad, I.; Waqas, M.; Nawab, J.; Ming, L. Remediating Industrial Wastewater Containing Potentially Toxic Elements with Four Freshwater Algae. Ecol. Eng. 2017, 102, 536–541. [Google Scholar] [CrossRef]
- Shamshad, I.; Khan, S.; Waqas, M.; Asma, M.; Nawab, J.; Gul, N.; Raiz, A.; Li, G. Heavy Metal Uptake Capacity of Freshwater Algae (Oedogonium westii) from Aqueous Solution: A Mesocosm Research. Int. J. Phytoremediation 2016, 18, 393–398. [Google Scholar] [CrossRef]
- APHA. Compendium of Methods for the Microbiological Examination, 3rd ed.; American Public Health Association: Washington, DC, USA, 1992; pp. 105–119, 325–367, 371–415, 451–469, 637–658. [Google Scholar]
- Saidu, M.; Yuzir, A.; Salim, M.R.; Richard, A.; Afiz, B. Effect of operating parameter on the anaerobic digestion oil palm mesocarp fibre with cattle manure for biogas production. In IOP Conference Series: Earth and Environmental Science; IOP Publishing: Bristol, UK, 2020; Volume 476, p. 012085. [Google Scholar]
- American Public Health Association. Standard Methods for the Examination of Water and Waste Water, 10th ed.; American Public Health Association: Washington, DC, USA, 1985. [Google Scholar]
- Farid, N.; Ullah, A.; Khan, S.; Butt, S.; Khan, A.Z.; Afsheen, Z.; El-Serehy, H.A.; Yasmin, H.; Ayaz, T.; Ali, Q. Algae and Hydrophytes as Potential Plants for Bioremediation of Heavy Metals from Industrial Wastewater. Water 2023, 15, 2142. [Google Scholar] [CrossRef]
- Basílico, G.; Faggi, A.; de Cabo, L. Tolerance to Metals in Two Species of Fabaceae Grown in Riverbank Sediments Polluted with Chromium, Copper, and Lead. In Phytoremediation; Springer: New York, NY, USA, 2018; pp. 169–178. [Google Scholar]
- Pak, E.P. National Standards for Drinking Water Quality, Government of Pakistan, Pakistan Environmental Protection Agency (Ministry of Environment): Islamabad, Pakistan, 2008.
- Mahmood, R.; Shariff, R.; Ali, S.; Hayyat, M.U. Bioremediation of Textile Effluents by Indigenous Bacterial Consortia and Its Effects on Zea mays L. CVC 1415. J. Anim. Plant Sci. 2013, 23, 1193–1199. [Google Scholar]
- Mubashar, M.; Naveed, M.; Mustafa, A.; Ashraf, S.; Shehzad Baig, K.; Alamri, S.; Siddiqui, M.H.; Zabochnicka-Świątek, M.; Szota, M.; Kalaji, H.M. Experimental Investigation of Chlorella vulgaris and Enterobacter sp. MN17 for Decolorization and Removal of Heavy Metals from Textile Wastewater. Water 2020, 12, 3034. [Google Scholar] [CrossRef]
- Raza, N.; Rizwan, M.; Mujtaba, G. Bioremediation of Real Textile Wastewater with a Microalgal-Bacterial Consortium: An Eco-Friendly Strategy. Biomass Convers. Biorefinery 2022, 1–13. [Google Scholar] [CrossRef]
- Das, C.; Ramaiah, N.; Pereira, E.; Naseera, K. Efficient Bioremediation of Tannery Wastewater by Monostrains and Consortium of Marine Chlorella sp. and Phormidium sp. Int. J. Phytoremediation 2018, 20, 284–292. [Google Scholar] [CrossRef]
- Orandi, S.; Lewis, D.M.; Moheimani, N.R. Biofilm Establishment and Heavy Metal Removal Capacity of an Indigenous Mining Algal-Microbial Consortium in a Photo-Rotating Biological Contactor. J. Ind. Microbiol. Biotechnol. 2012, 39, 1321–1331. [Google Scholar] [CrossRef]
- Allam, N. Bioremediation Efficiency of Heavy Metals and Azo Dyes by Individual or Consortium Bacterial Species Either as Free or Immobilized Cells: A Comparative Study. Egypt. J. Bot. 2017, 57, 555–564. [Google Scholar] [CrossRef]
- Abdel-Razek, M.A.; Abozeid, A.M.; Eltholth, M.M.; Abouelenien, F.A.; El-Midany, S.A.; Moustafa, N.Y.; Mohamed, R.A. Bioremediation of a Pesticide and Selected Heavy Metals in Wastewater from Various Sources Using a Consortium of Microalgae and Cyanobacteria. Slov. Vet. 2019, 56, 61–73. [Google Scholar]
- Yu, Q.; Li, P.; Li, B.; Zhang, C.; Zhang, C.; Ge, Y. Effects of Algal-Bacterial Ratio on the Growth and Cadmium Accumulation of Chlorella salina-Bacillus subtilis Consortia. J. Basic Microbiol. 2022, 62, 518–529. [Google Scholar] [CrossRef] [PubMed]
- Raju, C.A.; Anitha, J.; Kalyani, R.M.; Satyanandam, K.; Jagadeesh, P. Sorption of cobalt using marine macro seaweed graciliariacorticatared algae powder. Mater. Today Proc. 2021, 44, 1816–1827. [Google Scholar] [CrossRef]
- Vafajoo, L.; Cheraghi, R.; Dabbagh, R.; McKay, G. Removal of cobalt (II) ions from aqueous solutions utilizing the pre-treated 2-Hypnea Valentiae algae: Equilibrium, thermodynamic, and dynamic studies. Chem. Eng. J. 2018, 331, 39–47. [Google Scholar] [CrossRef]
- Ali, R.; Bashir, K.; Ahmad, S.; Ullah, A.; Shah, S.F.; Ali, Q.; Ahmad, A. Bioremediation of Heavy Metals from Industrial Effluents Using Bacillus pakistanensis and Lysinibacillus composti. Sustainability 2023, 15, 7591. [Google Scholar] [CrossRef]
- Kehinde, L.I.; Adekanmi, A.A.; Ahmad, L.K.; Akinkunmi, O.O.; Tomi, O.B.; Ajewole, O.M. Bioremediation of Waste Water from Pharmaceutical Industry by Bacteria (Bacillus subtilis). J. Environ. Issues Clim. Chang. 2022, 1, 38–50. [Google Scholar] [CrossRef]
- Benazir, J.F.; Suganthi, R.; Rajvel, D.; Pooja, M.P.; Mathithumilan, B. Bioremediation of chromium in tannery effluent by microbial consortia. Afr. J. Biotechnol. 2010, 9, 3140–3143. [Google Scholar]
- Shashirekha, V.; Sridharan, M.R.; Swamy, M. Bioremediation of tannery effluents using a consortium of blue-green algal species. CLEAN Soil Air Water 2011, 39, 863–873. [Google Scholar] [CrossRef]
- Saranraj, P.; Stella, D. Bioremediation of sugar mill effluent by immobilized bacterial consortium. Int. J. Res. Pure Appl. Microbiol. 2012, 2, 43–48. [Google Scholar]
- Sen, S.K.; Raut, S.; Dora, T.K.; Mohapatra, P.K. Contribution of hot spring bacterial consortium in cadmium and lead bioremediation through quadratic programming model. J. Hazard. Mater. 2014, 265, 47–60. [Google Scholar] [CrossRef]
- Hamid, B.; Kaushik, G.; Chawla, J.; Ahmad Baba, Z. Isolation and development of efficient bacterial consortia for bioremediation of textile dye effluent. J. Pollut. Eff. Cont. 2015, 3, 2. [Google Scholar]
- Oaikhena, E.E.; Makaije, D.B.; Denwe, S.D.; Namadi, M.M.; Haroun, A.A. Bioremediation potentials of heavy metal tolerant bacteria isolated from petroleum refinery effluent. Am. J. Environ. Protect. 2016, 5, 29–34. [Google Scholar] [CrossRef]
- Wan, W.; Xing, Y.; Qin, X.; Li, X.; Liu, S.; Luo, X.; Huang, Q.; Chen, W. A manganese-oxidizing bacterial consortium and its biogenic Mn oxides for dye decolorization and heavy metal adsorption. Chemosphere 2020, 253, 126627. [Google Scholar] [CrossRef] [PubMed]
- Naaz, F.; Bhattacharya, A.; Mathur, M.; Bano, F.; Pant, K.K.; Malik, A. Exploration of heavy metal uptake potential of three algal strains/consortia in suspended and attached growth systems. J. Water Process Eng. 2021, 43, 102315. [Google Scholar] [CrossRef]
- Chandrashekharaiah, P.S.; Gupte, Y.; Sarkar, P.; Prasad, S.; Sanyal, D.; Dasgupta, S.; Banik, A. Algae-bacterial aquaculture can enhance heavy metals (Pb2+ and Cd2+) remediation and water re-use efficiency of synthetic streams. Resour. Conserv. Recycl. 2022, 180, 106211. [Google Scholar] [CrossRef]
- Anusha, P.; Ragavendran, C.; Kamaraj, C.; Sangeetha, K.; Thesai, A.S.; Natarajan, D.; Malafaia, G. Eco-friendly bioremediation of pollutants from contaminated sewage wastewater using special reference bacterial strain of Bacillus cereus SDN1 and their genotoxicological assessment in Allium cepa. Sci. Total Environ. 2023, 863, 160935. [Google Scholar] [CrossRef]


| Physiochemical Parameters | CT1 | E1 | CT2 | E2 | CT3 | E3 | PAK-EPA NEQS | |||||||
|---|---|---|---|---|---|---|---|---|---|---|---|---|---|---|
| Mean | Ef. % | Mean | Ef. % | Mean | Ef. % | Mean | Ef. % | Mean | Ef. % | Mean | Ef. % | |||
| pH | I | 7.3 | −6.2 | 6.83 | −14.0 | 7.3 | −5.2 | 6.83 | −13.9 | 7.3 | −7.5 | 6.83 | −11.4 | 6–10 |
| F | 7.74 | 7.79 | 7.68 | 7.78 | 7.85 | 7.61 | ||||||||
| EC (mS/cm) | I | 0.436 | 14.9 | 1.195 | 14.3 | 0.436 | 40.8 | 1.195 | 10.1 | 0.436 | 49.5 | 1.195 | 14.5 | ---- |
| F | 0.371 | 1.023 | 0.258 | 1.074 | 0.22 | 1.021 | ||||||||
| Temperature | I | 26.6 | 48.1 | 26.8 | 47.3 | 26.6 | 49.2 | 26.8 | 44 | 26.6 | 46.6 | 26.8 | 43.6 | ---- |
| F | 13.8 | 14.1 | 13.5 | 15.0 | 14.2 | 15.1 | ||||||||
| BOD (mg/L) | I | 04 | 25 | 85.5 | 66.0 | 04 | 50 | 85.5 | 57.8 | 04 | 50 | 85.5 | 54.3 | 80 |
| F | 03 | 29 | 02 | 36 | 02 | 39 | ||||||||
| COD (mg/L) | I | 05 | 20 | 921 | 81.8 | 05 | 40 | 921 | 76.0 | 05 | 40 | 921 | 78.3 | 150 |
| F | 04 | 167 | 03 | 221 | 03 | 199 | ||||||||
| TSS (mg/L) | I | 02 | 20 | 232 | 82.7 | 02 | 10.5 | 232 | 75.8 | 02 | 31.5 | 232 | 66.3 | 150 |
| F | 1.6 | 40 | 1.79 | 56 | 1.53 | 78 | ||||||||
| TDS (mg/L) | I | 288 | 5.2 | 794 | 24.3 | 288 | 24.6 | 794 | 10.5 | 288 | 17.7 | 794 | 14.3 | 3500 |
| F | 273 | 601 | 217 | 610 | 237 | 680 | ||||||||
| Sulphide (mg/L) | I | 0.4 | 50 | 5.6 | 78.5 | 0.4 | 35 | 5.6 | 75 | 0.4 | 35 | 5.6 | 78.5 | 1 |
| F | 0.20 | 1.2 | 0.26 | 1.4 | 0.26 | 0.9 | ||||||||
| Colour (TCU) | I | 0.345 | 85.5 | 440 | 84.3 | 0.345 | 15.9 | 440 | 85.7 | 0.34 | 70.5 | 440 | 85.6 | <15 |
| F | 0.05 | 68.91 | 0.29 | 62.72 | 0.10 | 63.10 | ||||||||
| Turbidity (NTU) | I | 1.080 | 5.5 | 54.65 | 69.6 | 1.080 | 2.7 | 54.65 | 61.5 | 1.080 | 13 | 54.65 | 40.2 | <5 NTU |
| F | 1.02 | 16.59 | 1.05 | 21.01 | 1.04 | 32.68 | ||||||||
| Fluoride (mg/L) | I | 0.13 | 23 | 3.6 | 38.8 | 0.13 | 30.7 | 3.6 | 30.5 | 0.13 | 23.0 | 3.6 | 8.3 | 10 |
| F | 0.10 | 2.2 | 0.09 | 2.5 | 0.10 | 3.3 | ||||||||
| Chloride (mg/L) | I | 54 | 25.9 | 162 | 32.0 | 54 | 27.7 | 162 | 19.7 | 54 | 62.9 | 162 | 1.2 | 1000 |
| F | 40 | 110 | 39 | 130 | 20 | 160 | ||||||||
| Calcium Hardness (mg/L) | I | 280 | 14.2 | 590 | 11.8 | 280 | 17.8 | 590 | 37.2 | 280 | 7.1 | 590 | 28.8 | ---- |
| F | 240 | 520 | 230 | 370 | 260 | 420 | ||||||||
| Magnesium Hardness (mg/L) | I | 180 | 33.3 | 395 | 48.3 | 180 | 27.7 | 395 | 41.7 | 180 | 50 | 395 | 34.1 | ---- |
| F | 120 | 110 | 130 | 230 | 90 | 260 | ||||||||
| Total Hardness (mg/L) | I | 460 | 21.7 | 985 | 36.0 | 460 | 21.7 | 985 | 39.0 | 460 | 23.9 | 985 | 30.9 | <500 |
| F | 360 | 630 | 360 | 600 | 350 | 680 | ||||||||
| Heavy Metals | CT1 | E1 | CT2 | E2 | CT3 | E3 | NEQS | |||||||
|---|---|---|---|---|---|---|---|---|---|---|---|---|---|---|
| Mean | Ef. % | Mean | Ef. % | Mean | Ef. % | Mean | Ef. % | Mean | Ef. % | Mean | Ef. % | |||
| Mn | I | 0.013 | 46.1 | 1.23 | 94.5 | 0.013 | 38.4 | 1.23 | 85.6 | 0.013 | 7.6 | 1.23 | 98.2 | 1.5 |
| F | 0.007 | 0.067 | 0.008 | 0.176 | 0.012 | 0.021 | ||||||||
| Cu | I | 0.010 | 20 | 0.81 | 94.0 | 0.010 | 60 | 0.81 | 92.0 | 0.010 | 40 | 0.81 | 52.3 | 1.0 |
| F | 0.008 | 0.048 | 0.004 | 0.064 | 0.006 | 0.386 | ||||||||
| Cr | I | 0.016 | 87.5 | 2.12 | 93.2 | 0.016 | 31.2 | 2.12 | 91.6 | 0.016 | 56.2 | 2.12 | 97.7 | 0.1 |
| F | 0.002 | 0.144 | 0.011 | 0.177 | 0.007 | 0.047 | ||||||||
| Cd | I | 0.012 | 75 | 0.18 | 77.7 | 0.012 | 66.6 | 0.18 | 75.5 | 0.012 | 91.6 | 0.18 | 76.6 | 0.1 |
| F | 0.003 | 0.040 | 0.004 | 0.044 | 0.001 | 0.042 | ||||||||
| Co | I | 0.014 | 92.8 | 0.151 | 26.4 | 0.014 | 28.5 | 0.151 | 47.6 | 0.014 | 50 | 0.151 | 28.4 | --- |
| F | 0.001 | 0.111 | 0.010 | 0.079 | 0.007 | 0.108 | ||||||||
| Ag | I | 0.054 | 74.0 | 0.24 | 41.6 | 0.054 | 79.6 | 0.24 | 54.1 | 0.054 | 70.3 | 0.24 | 33.3 | 1.0 |
| F | 0.014 | 0.14 | 0.011 | 0.11 | 0.016 | 0.16 | ||||||||
| Pb | I | 0.002 | 50 | 1.12 | 82.1 | 0.002 | 50 | 1.12 | 22.3 | 0.002 | 50 | 1.12 | 79.4 | 0.5 |
| F | 0.001 | 0.2 | 0.001 | 0.87 | 0.001 | 0.23 | ||||||||
| Ni | I | 0.046 | 43.4 | 0.113 | 41.5 | 0.046 | 82.6 | 0.113 | 30.9 | 0.046 | 43.4 | 0.113 | 41.5 | 1.0 |
| F | 0.026 | 0.066 | 0.008 | 0.078 | 0.026 | 0.066 | ||||||||
| Ca | I | 1.72 | 98.0 | 14.5 | 79.0 | 1.72 | 52.3 | 14.5 | 59.8 | 1.72 | 76.3 | 14.5 | 82.7 | --- |
| F | 0.034 | 3.036 | 0.819 | 5.819 | 0.406 | 2.504 | ||||||||
| Mg | I | 0.040 | 90 | 0.19 | 82.1 | 0.040 | 67.5 | 0.19 | 45.7 | 0.040 | 55 | 0.19 | 48.9 | --- |
| F | 0.004 | 0.034 | 0.013 | 0.103 | 0.018 | 0.097 | ||||||||
| Species | Mn | Cu | Cr | Cd | Co | Ag | Pb | Ni | Ca | Mg |
|---|---|---|---|---|---|---|---|---|---|---|
| CT1 | 0.0081 | 0.0023 | 0.012 | 0.0080 | 0.012 | 0.023 | 0.0009 | 0.019 | 1.451 | 0.033 |
| E1 | 0.74 | 0.543 | 1.756 | 0.142 | 0.039 | 0.062 | 0.90 | 0.044 | 9.77 | 0.151 |
| CT2 | 0.0062 | 0.0053 | 0.005 | 0.0071 | 0.0039 | 0.026 | 0.0009 | 0.037 | 0.901 | 0.025 |
| E2 | 0.93 | 0.470 | 1.613 | 0.131 | 0.071 | 0.084 | 0.21 | 0.030 | 8.01 | 0.084 |
| CT3 | 0.0015 | 0.0036 | 0.008 | 0.010 | 0.0069 | 0.005 | 0.0008 | 0.018 | 1.093 | 0.020 |
| E3 | 1.13 | 0.297 | 2.068 | 0.135 | 0.041 | 0.044 | 0.85 | 0.039 | 7.41 | 0.086 |
Disclaimer/Publisher’s Note: The statements, opinions and data contained in all publications are solely those of the individual author(s) and contributor(s) and not of MDPI and/or the editor(s). MDPI and/or the editor(s) disclaim responsibility for any injury to people or property resulting from any ideas, methods, instructions or products referred to in the content. |
© 2023 by the authors. Licensee MDPI, Basel, Switzerland. This article is an open access article distributed under the terms and conditions of the Creative Commons Attribution (CC BY) license (https://creativecommons.org/licenses/by/4.0/).
Share and Cite
Bashir, K.; Khan, S.; Ali, R.; Yasmin, H.; Gaafar, A.-R.Z.; Khilgee, F.E.A.; Butt, S.; Ullah, A. Bioremediation of Metal-Polluted Industrial Wastewater with Algal-Bacterial Consortia: A Sustainable Strategy. Sustainability 2023, 15, 14056. https://doi.org/10.3390/su151914056
Bashir K, Khan S, Ali R, Yasmin H, Gaafar A-RZ, Khilgee FEA, Butt S, Ullah A. Bioremediation of Metal-Polluted Industrial Wastewater with Algal-Bacterial Consortia: A Sustainable Strategy. Sustainability. 2023; 15(19):14056. https://doi.org/10.3390/su151914056
Chicago/Turabian StyleBashir, Kashif, Sara Khan, Ramzan Ali, Humaira Yasmin, Abdel-Rhman Z. Gaafar, Fazal E. Azeem Khilgee, Sadia Butt, and Amin Ullah. 2023. "Bioremediation of Metal-Polluted Industrial Wastewater with Algal-Bacterial Consortia: A Sustainable Strategy" Sustainability 15, no. 19: 14056. https://doi.org/10.3390/su151914056
APA StyleBashir, K., Khan, S., Ali, R., Yasmin, H., Gaafar, A.-R. Z., Khilgee, F. E. A., Butt, S., & Ullah, A. (2023). Bioremediation of Metal-Polluted Industrial Wastewater with Algal-Bacterial Consortia: A Sustainable Strategy. Sustainability, 15(19), 14056. https://doi.org/10.3390/su151914056