
Preliminary Study on Indoor Air Temperature and Moisture Behaviour in 13th-Century Churches in Latvia


Abstract
1. Introduction
- Indoor climate for conservation;
- Indoor climate for thermal comfort.
- No heating;
- Conservation heating;
- Heating for thermal comfort.
2. Literature Review
3. Materials and Methods
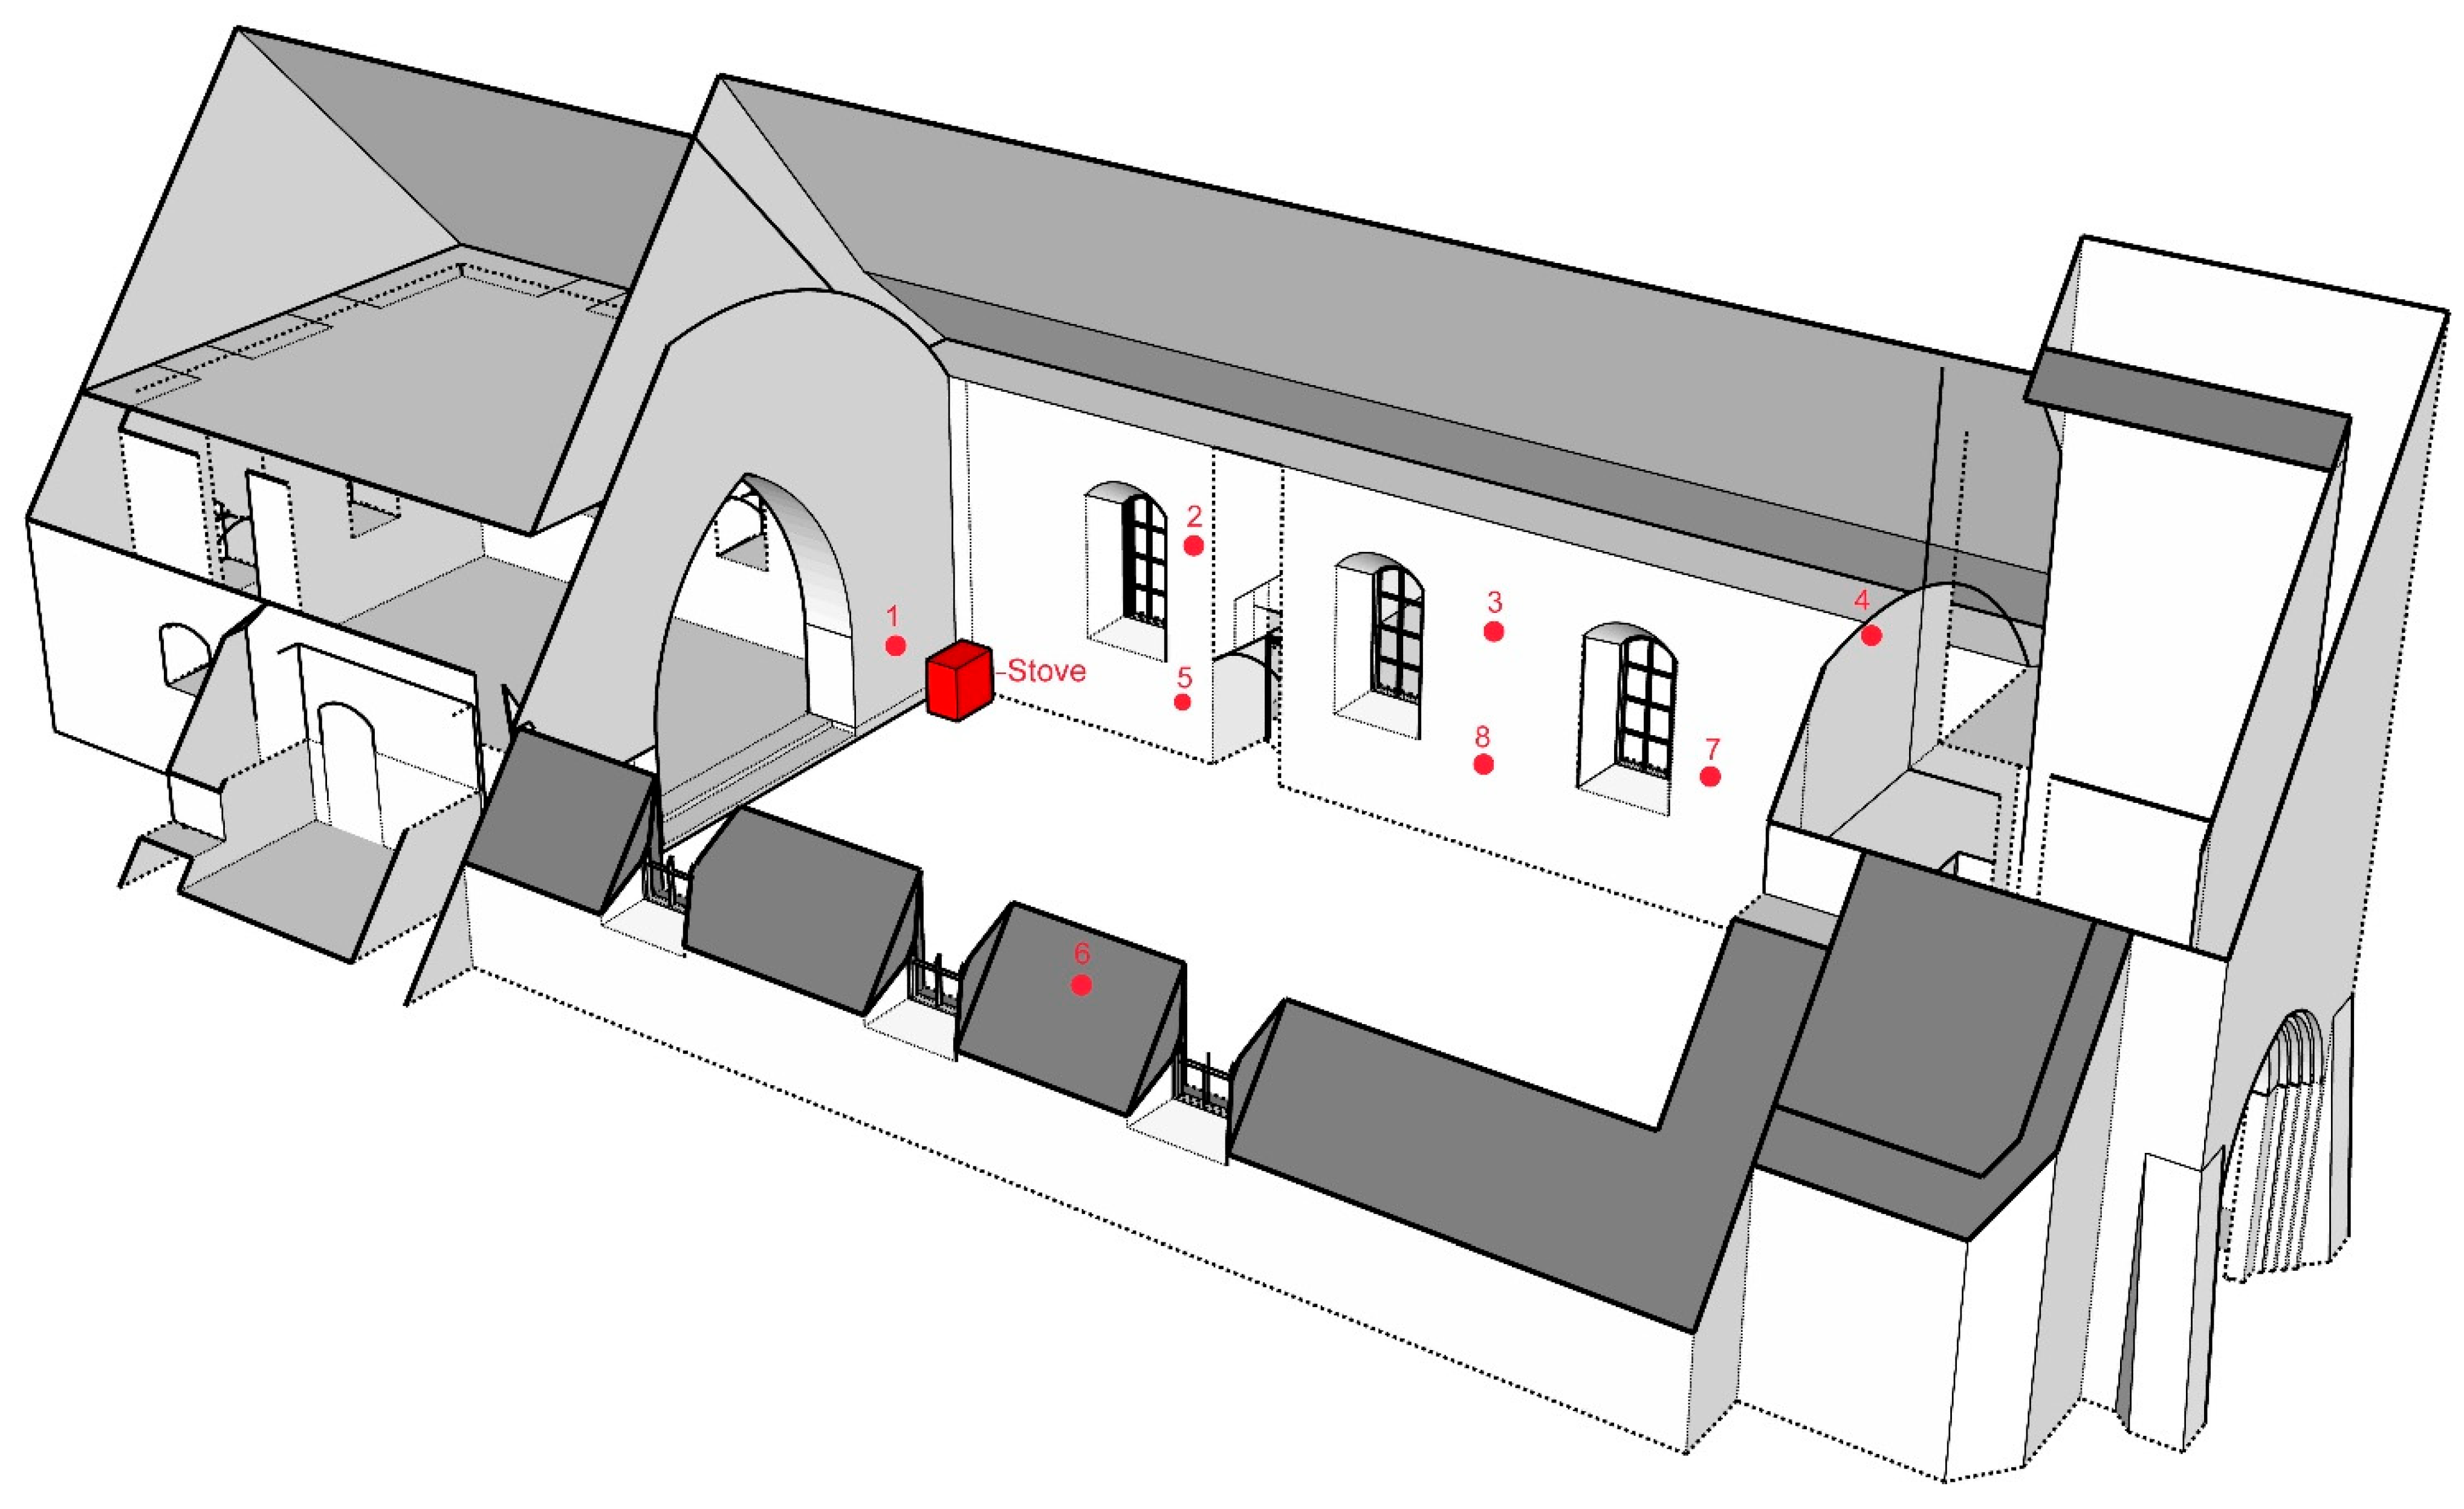
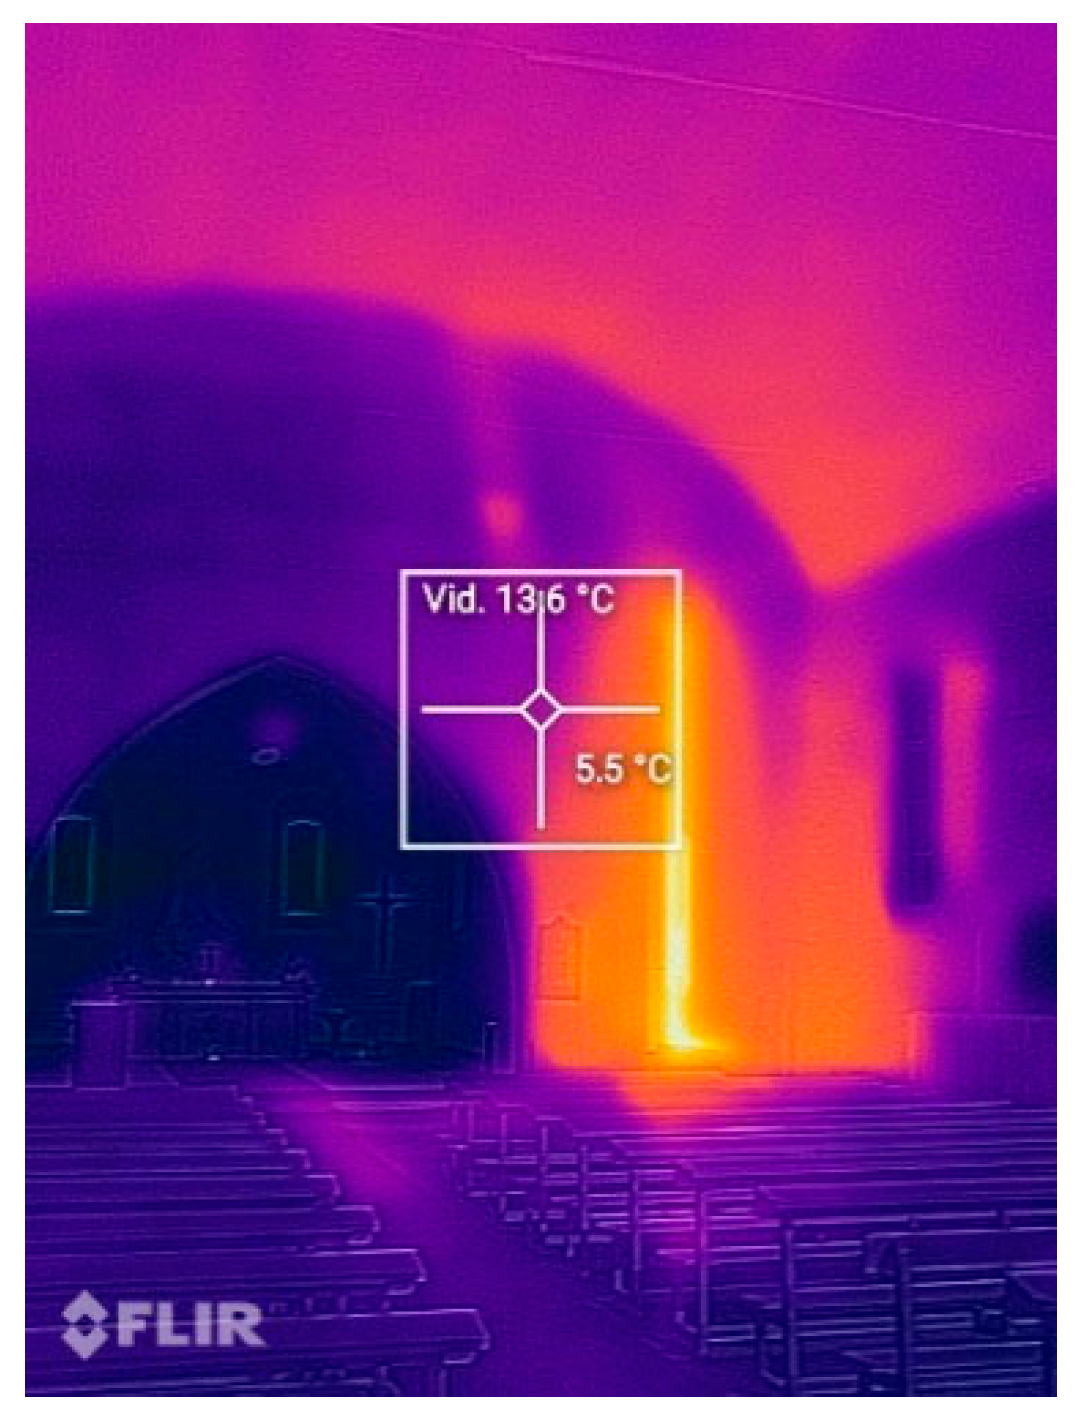
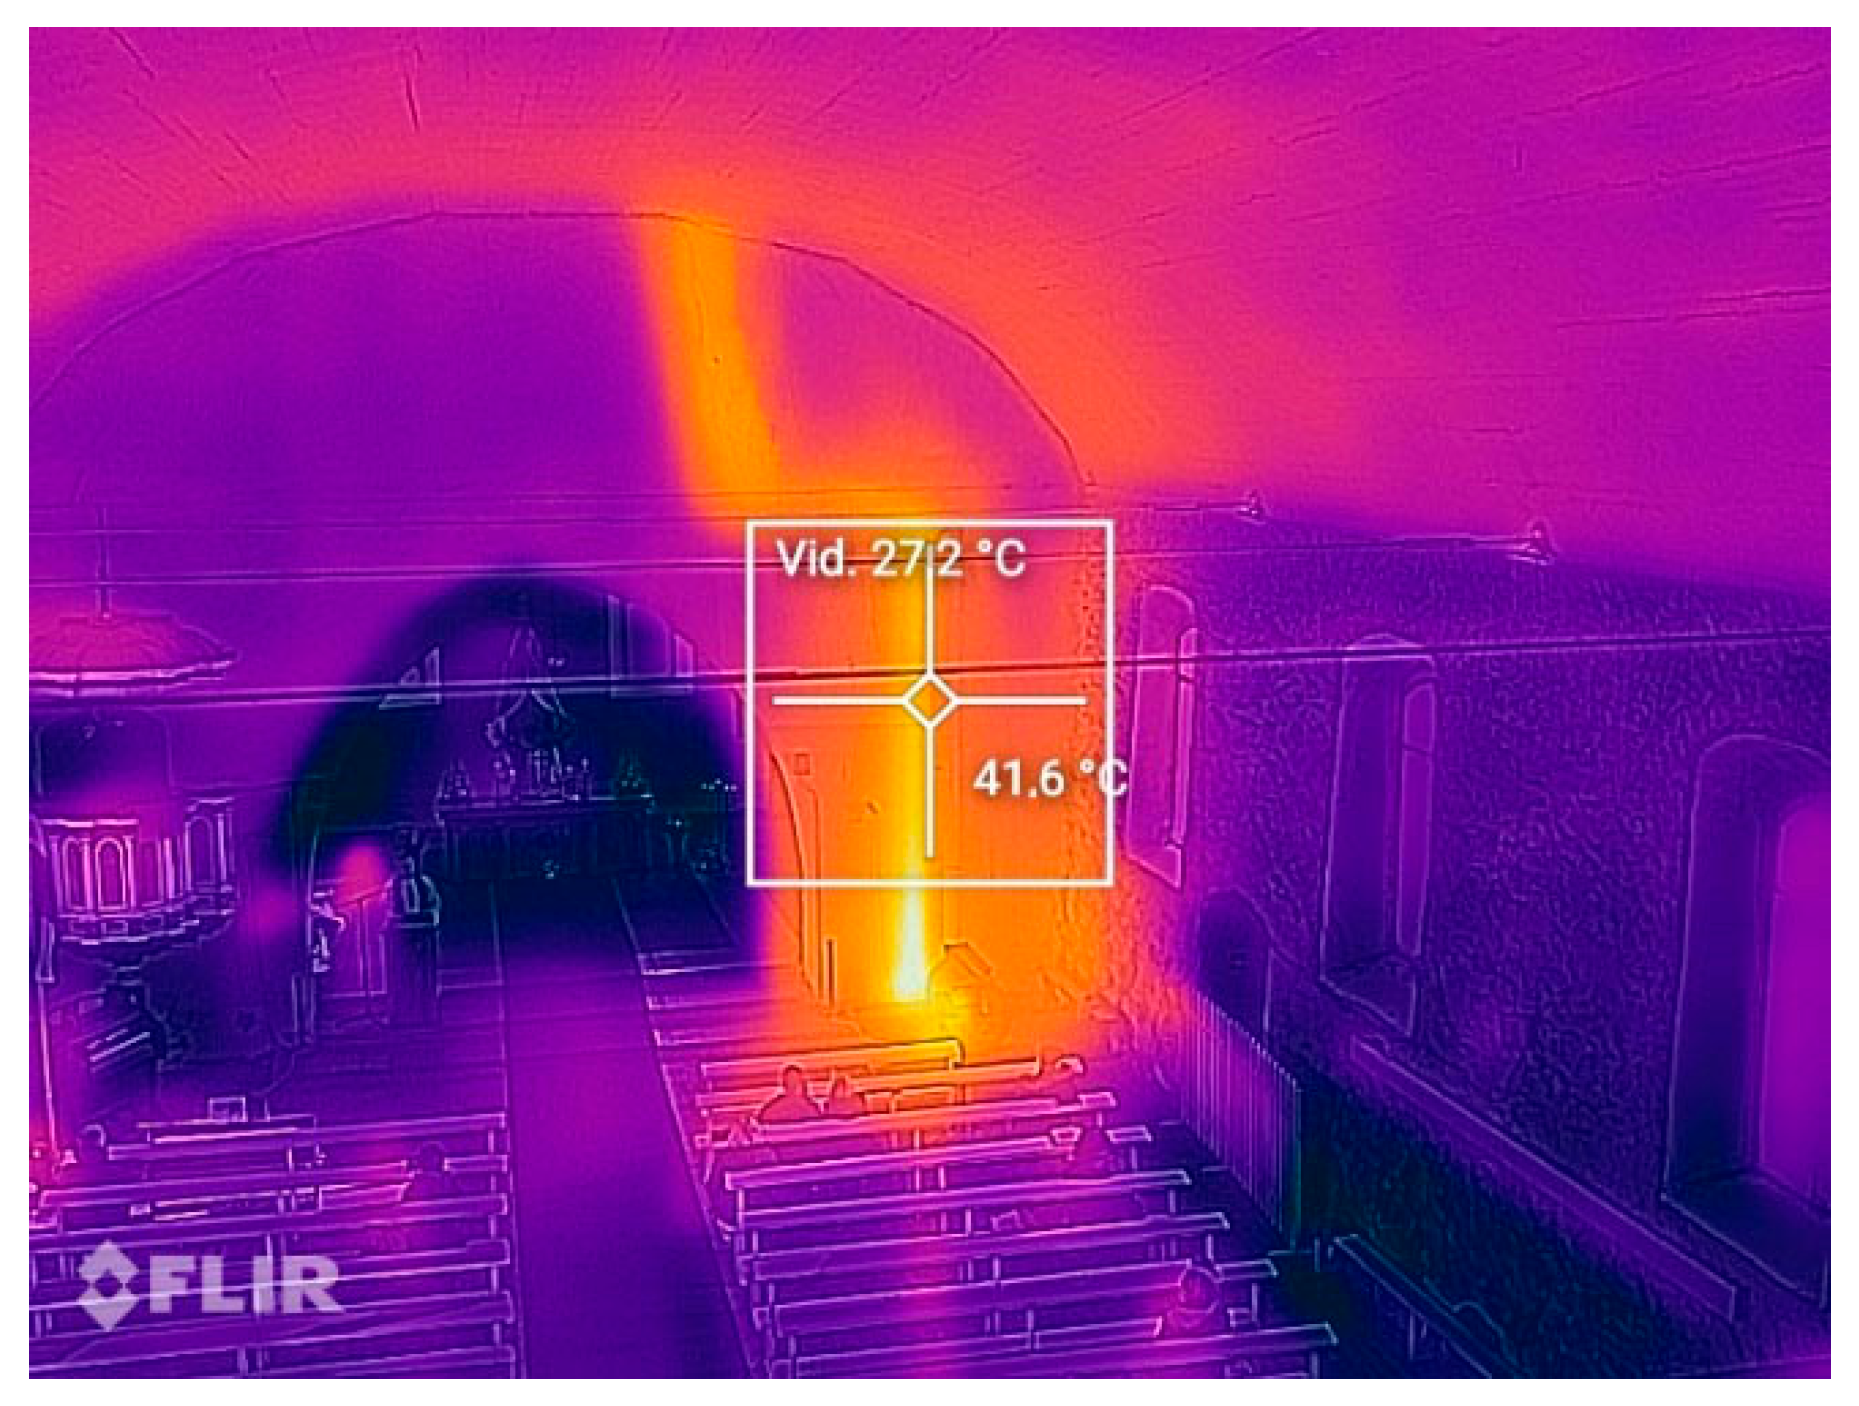
3.1. The Warm Air Flow and Temperature Distribution in the Premises of the Krimulda Church and on the Surface of the External Wall
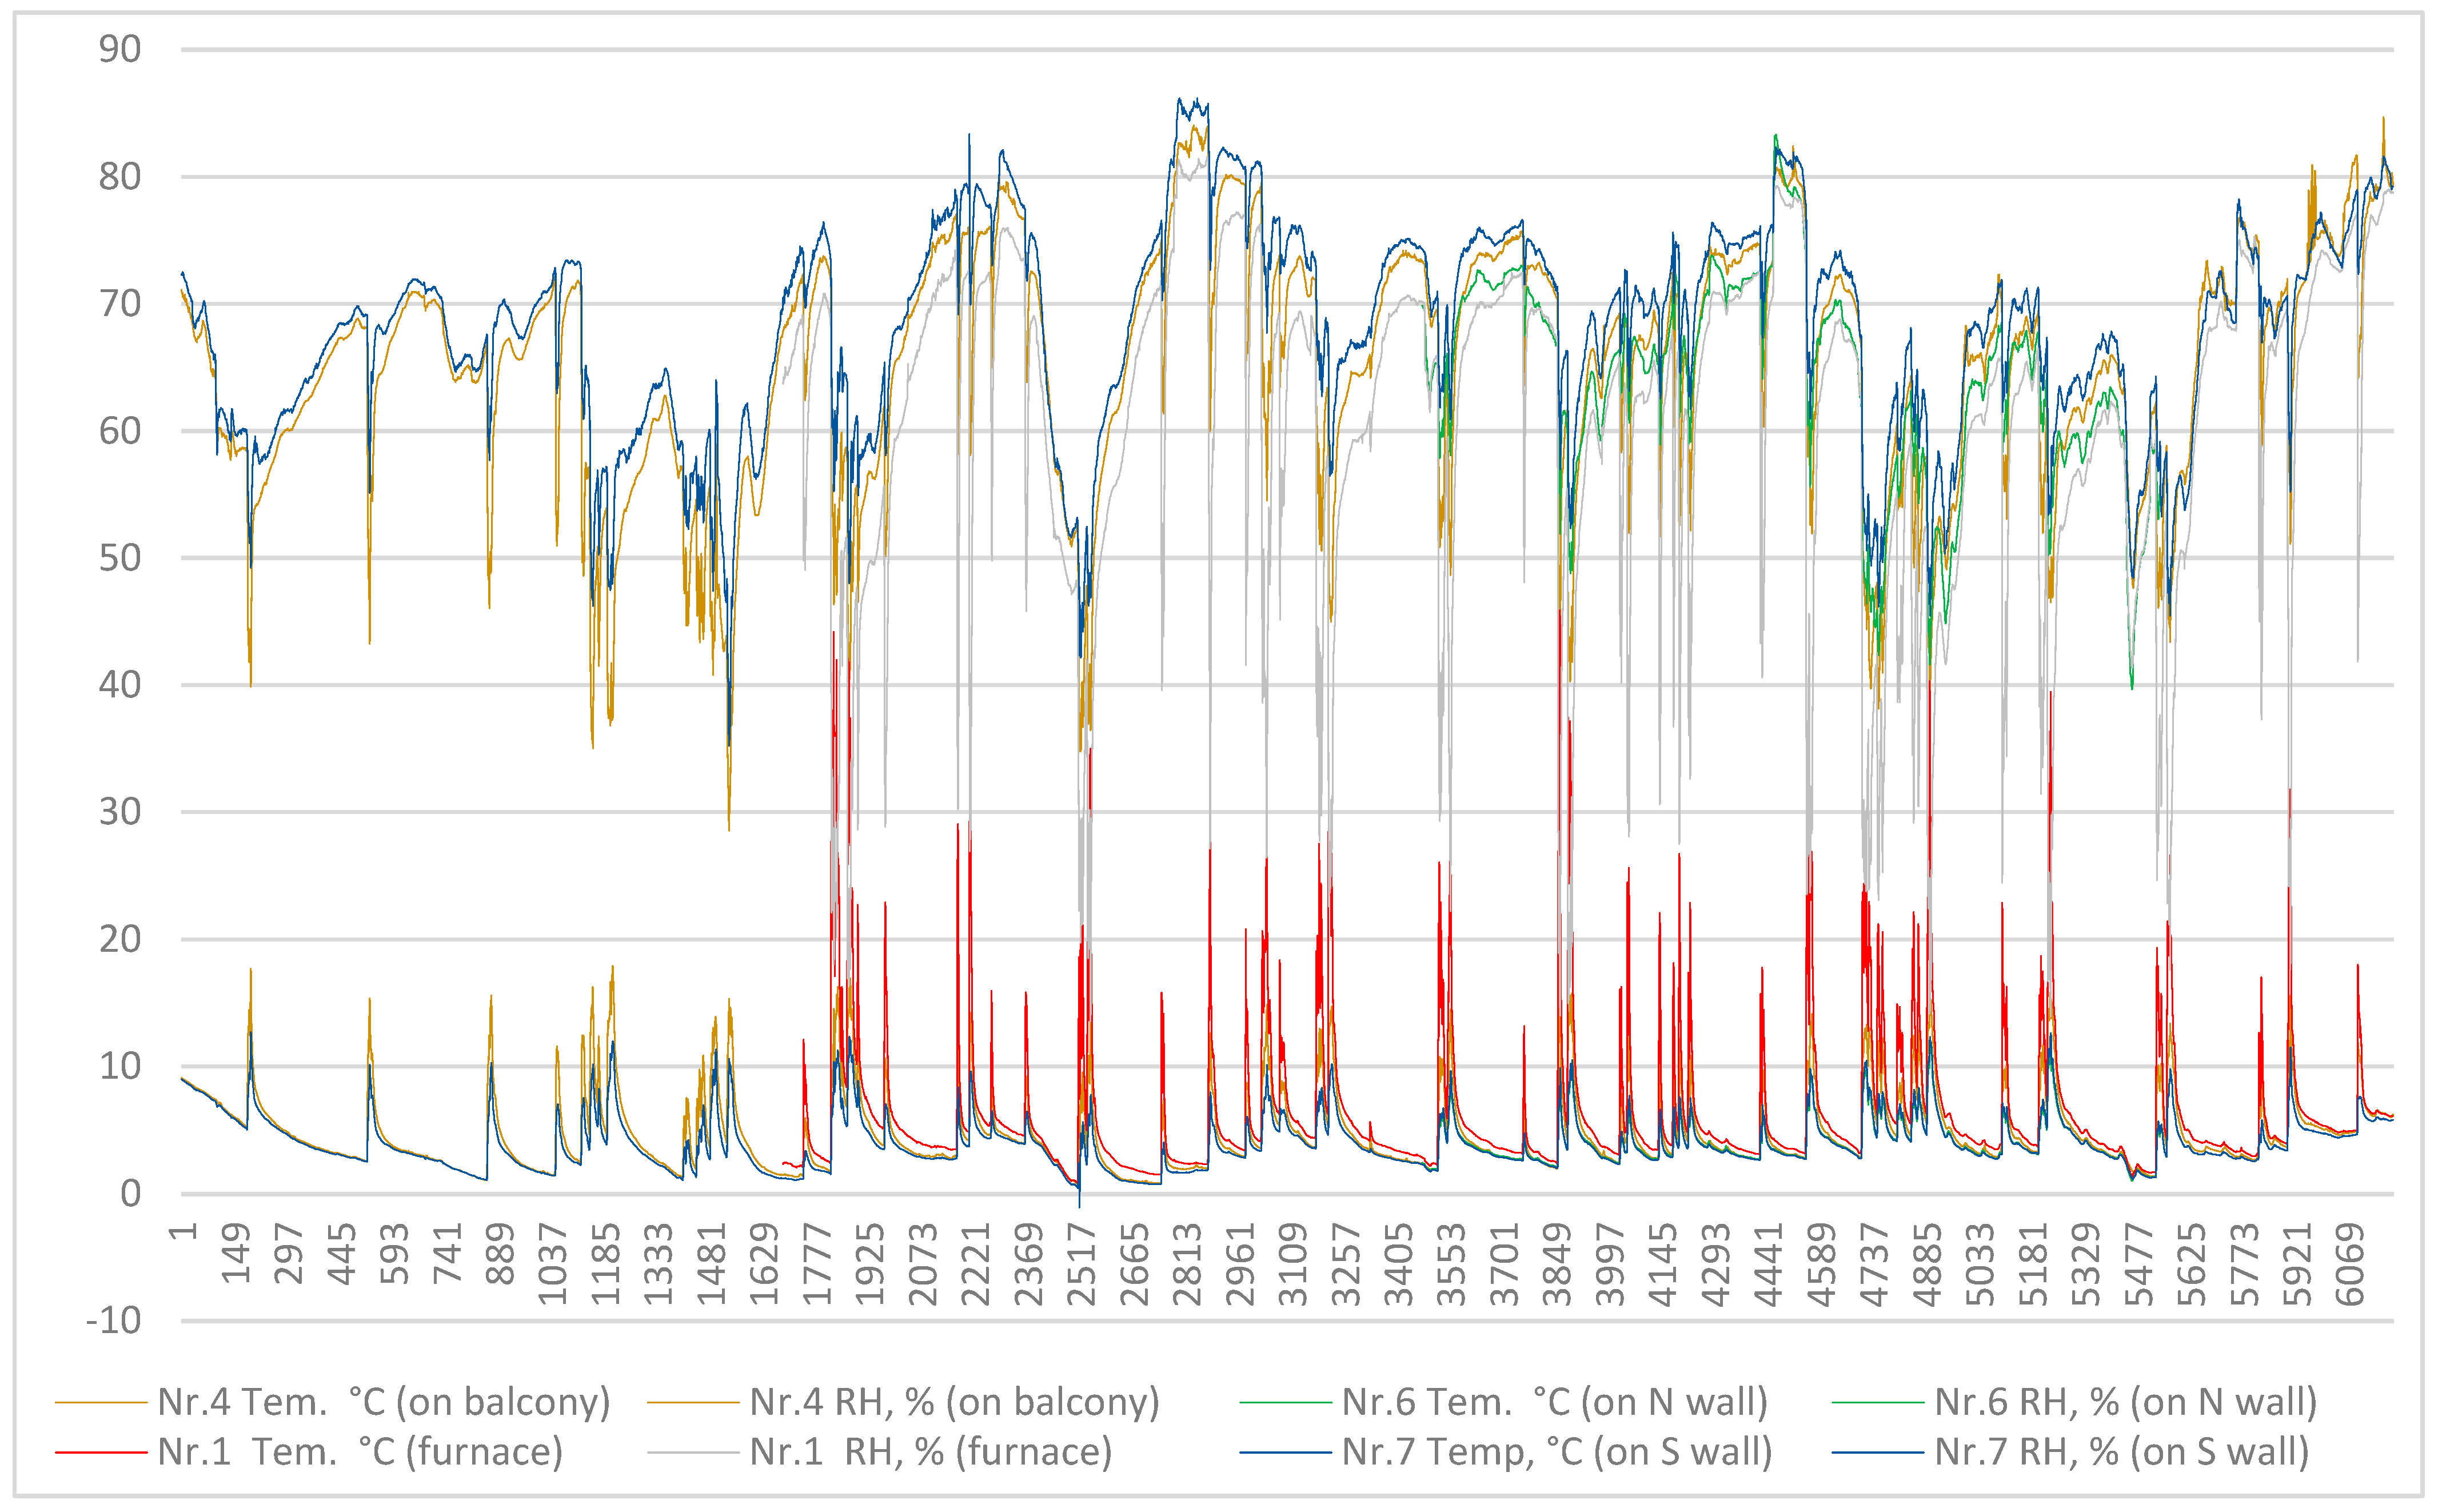
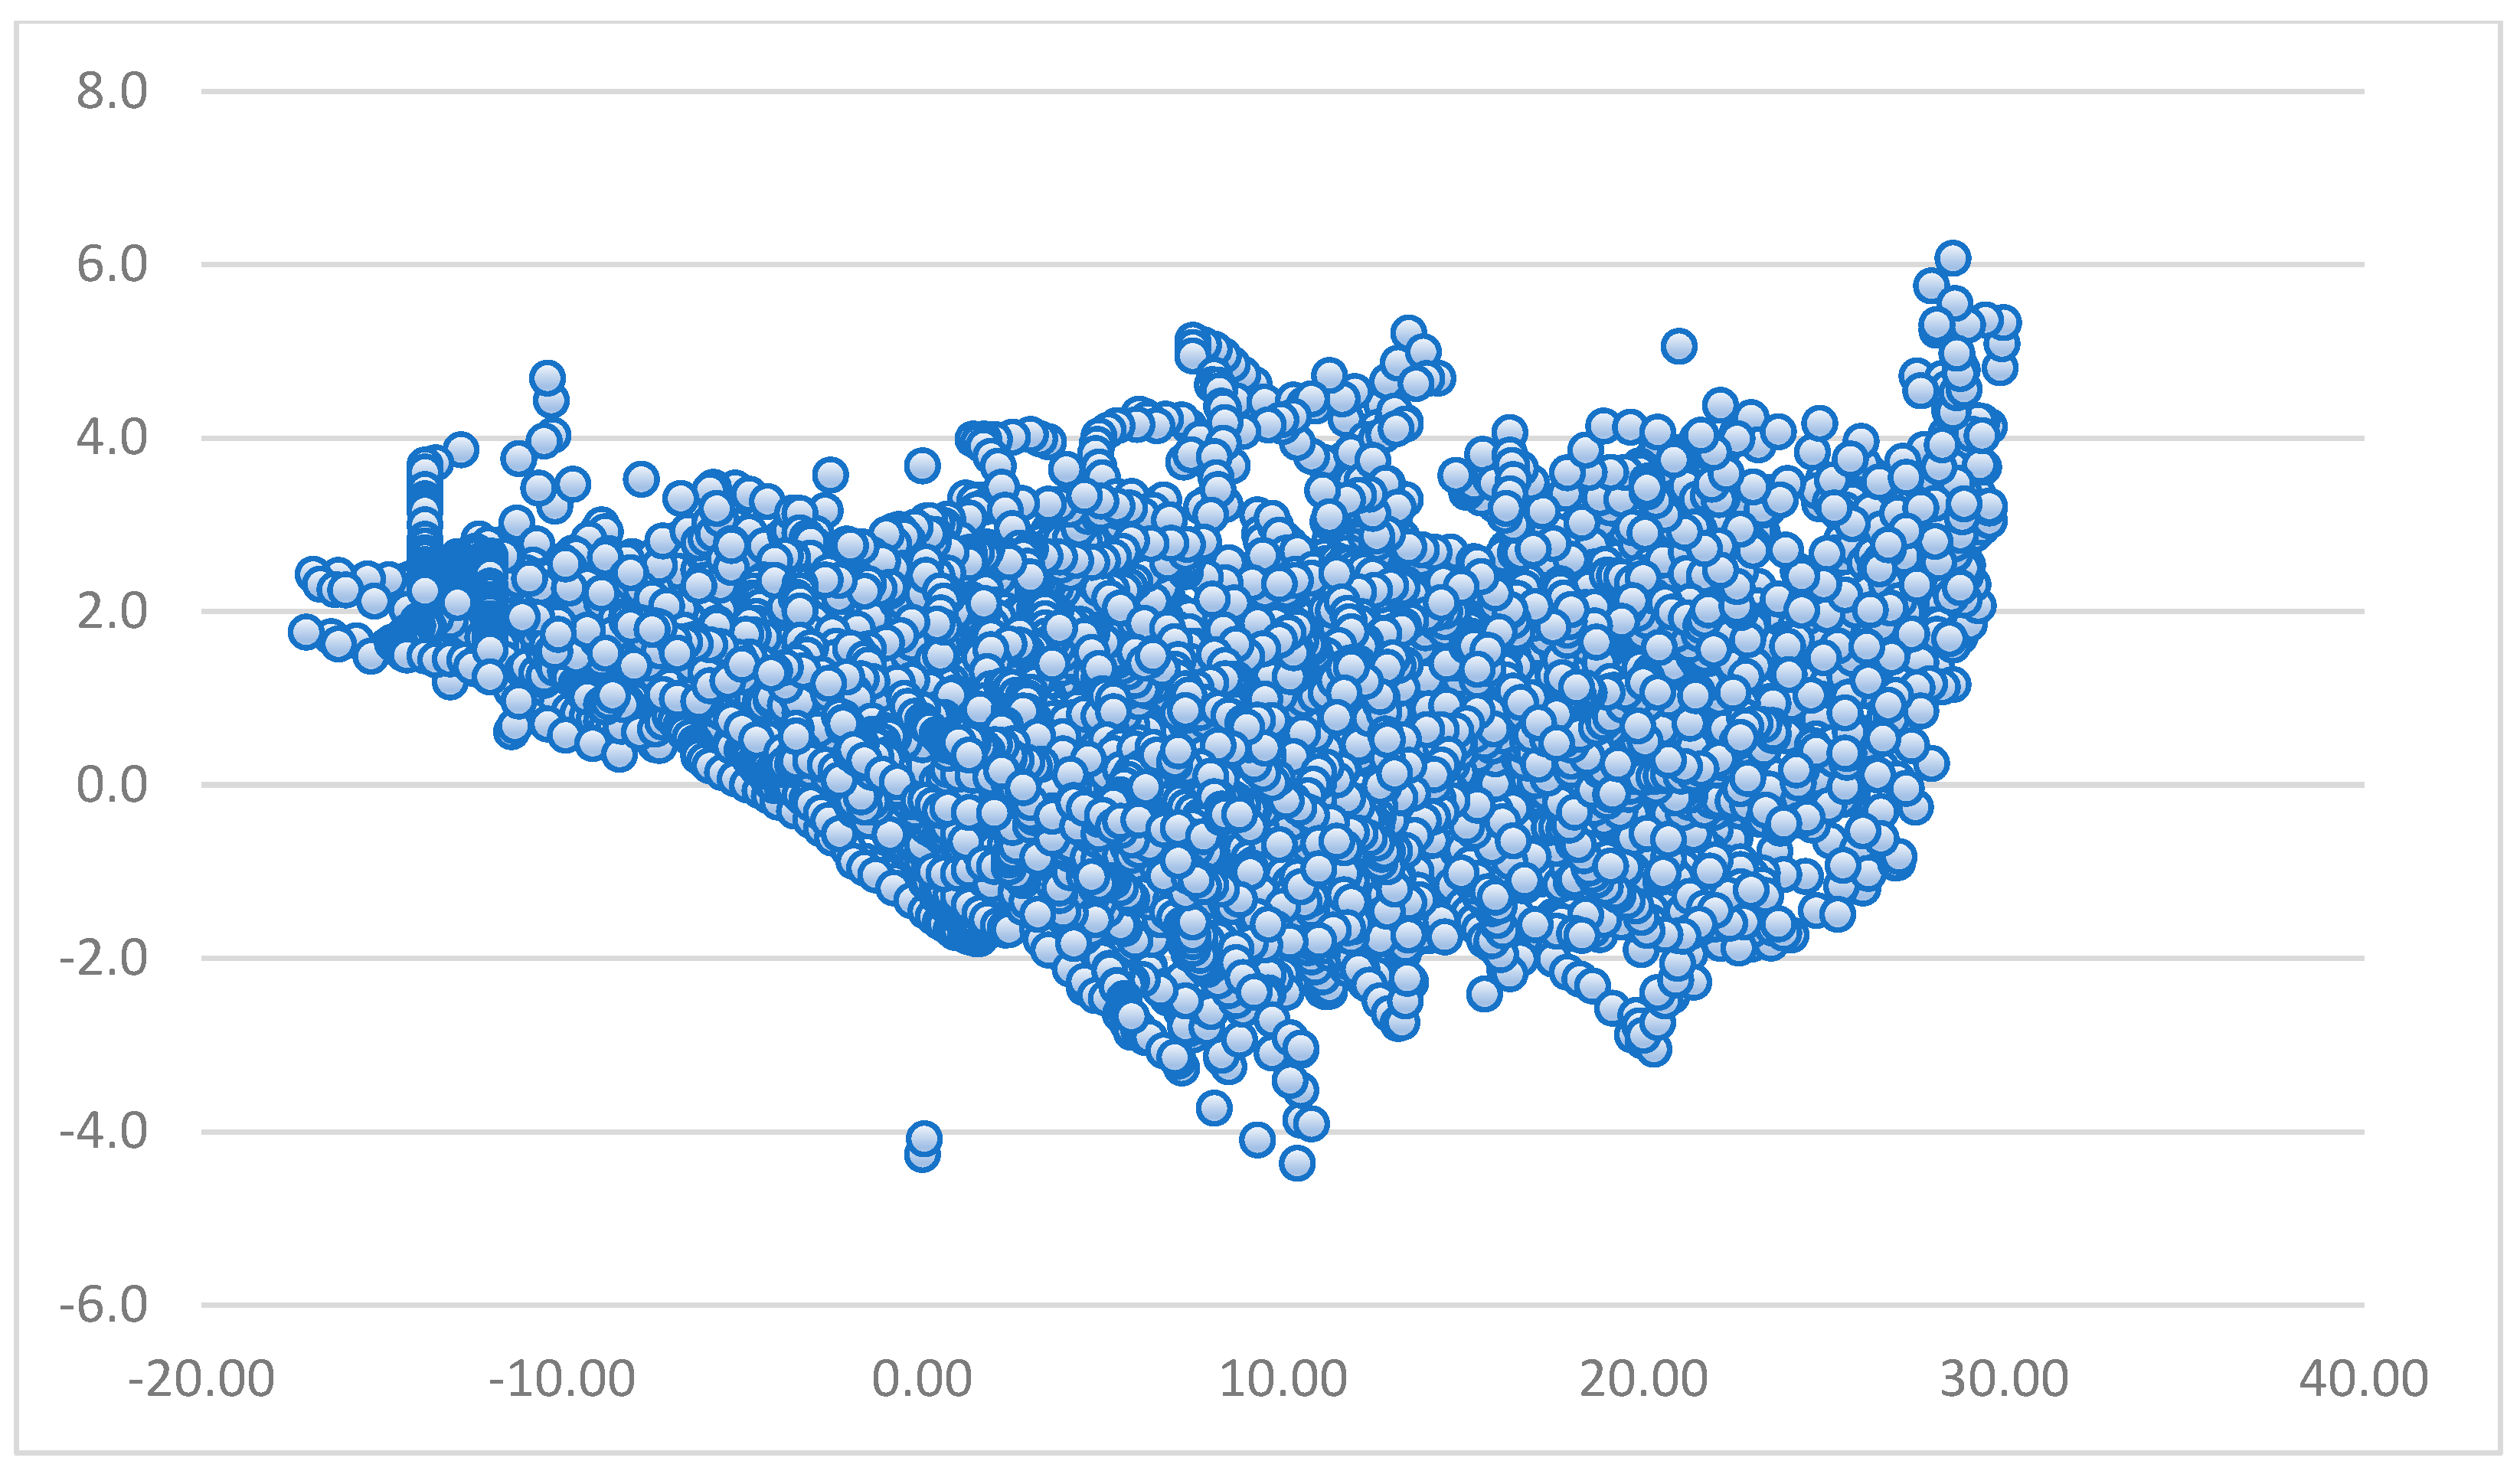
3.2. The Influence of Outdoor Air Humidity on the Indoor Microclimate
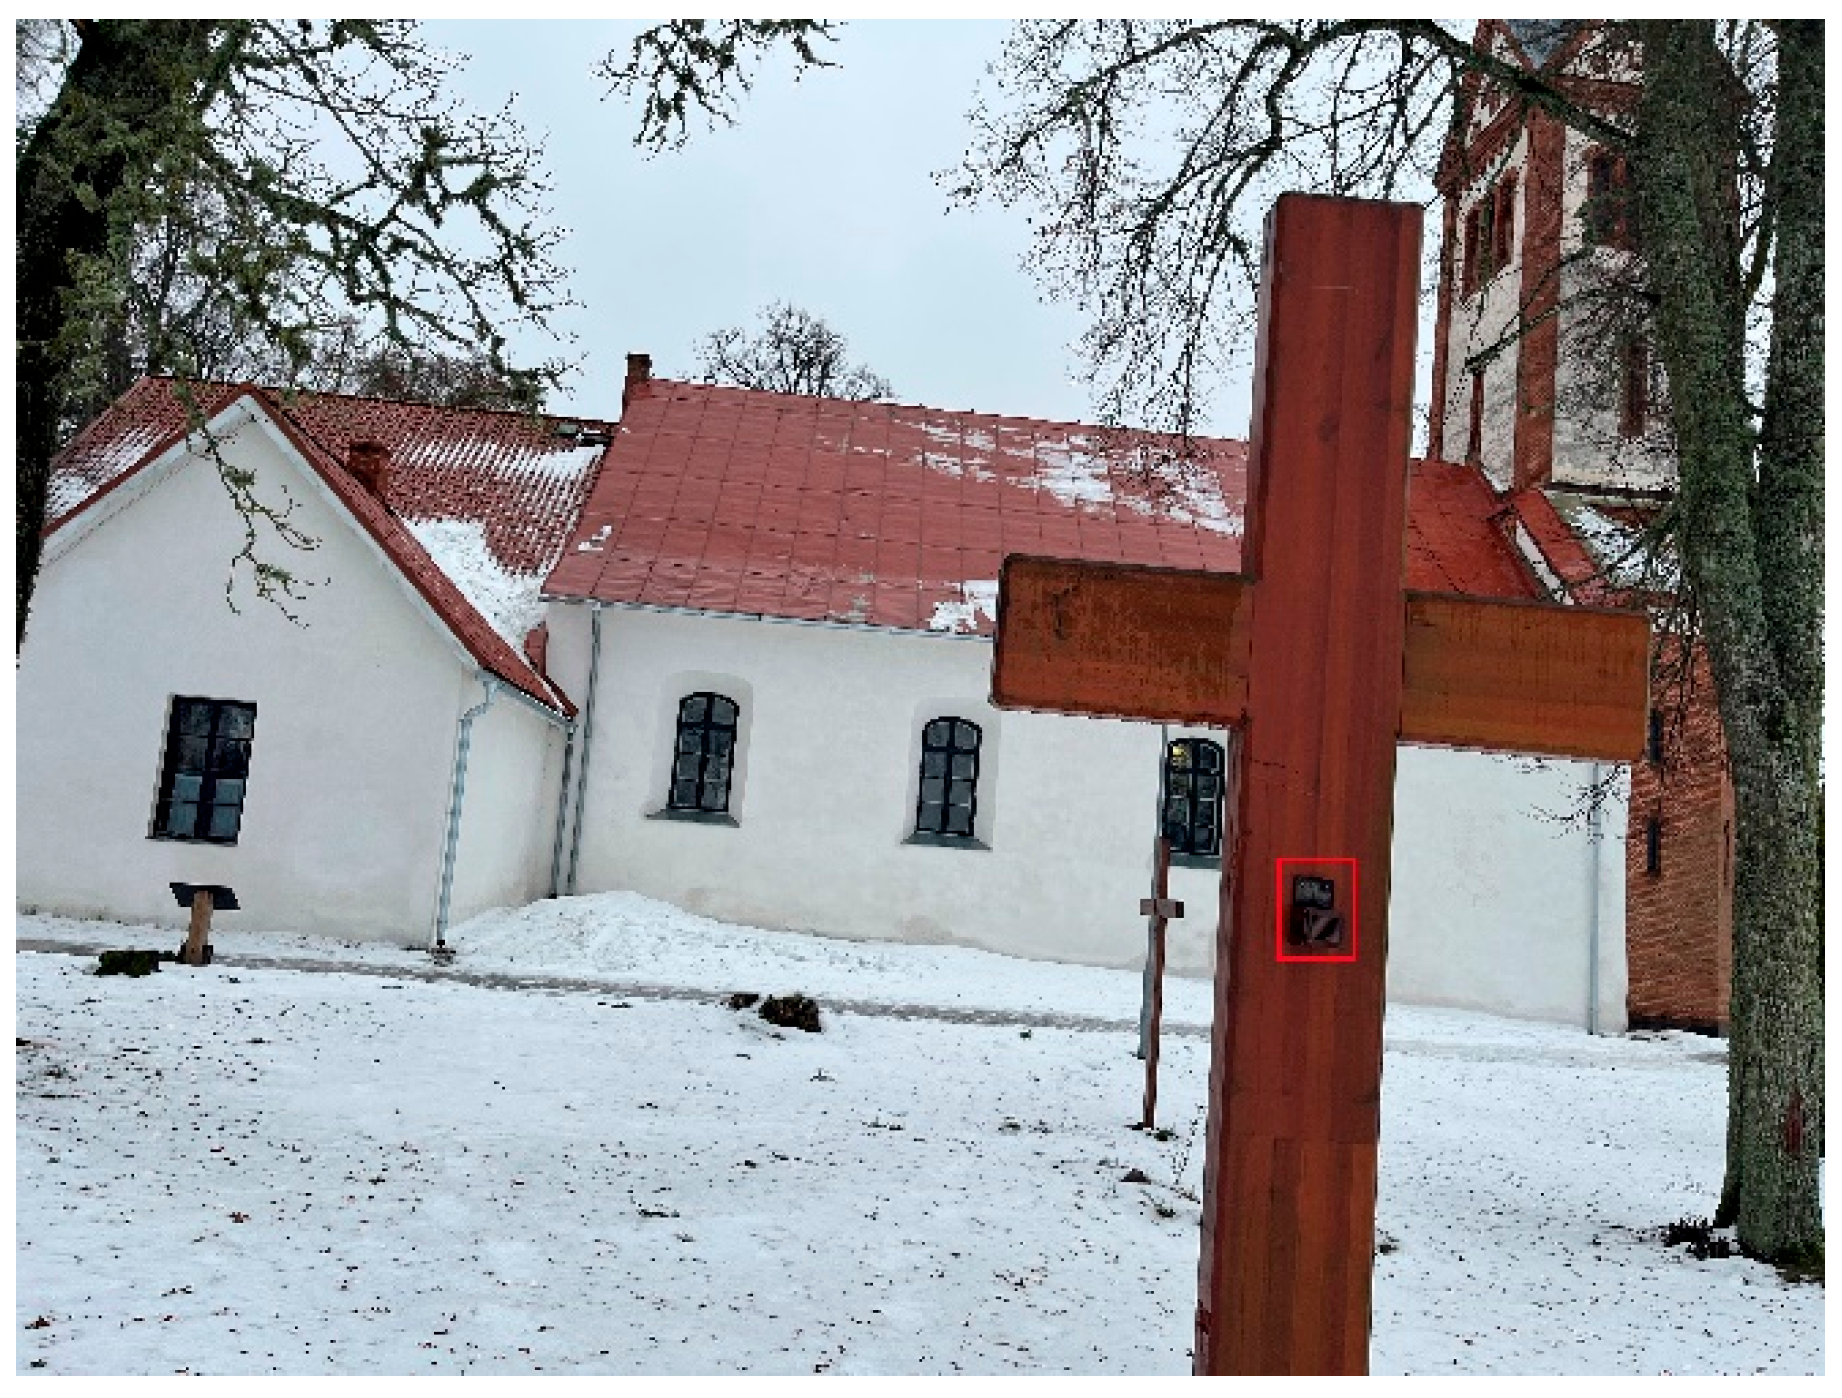
- From 7 July 2022 to 24 April 2023 and from 10 January 2022 to 24 April 2022, microclimate measurements were taken in the Krimulda Church with exterior masonry walls and both brick and wooden vaulted ceilings. The Krimulda Church is a popular tourist attraction in Latvia, welcoming visitors 24/7 throughout the year. This accessibility provides a comprehensive understanding of how outdoor air humidity impacts the indoor microclimate. The Krimulda Church is situated in rural territory, in the middle part of Latvia, 34.45 km away from the border of the capital of Latvia, Riga, horizontally to the east. The parish hall’s area is 315.51 m2 and the volume is 3313 m3.
4. Results and Discussion
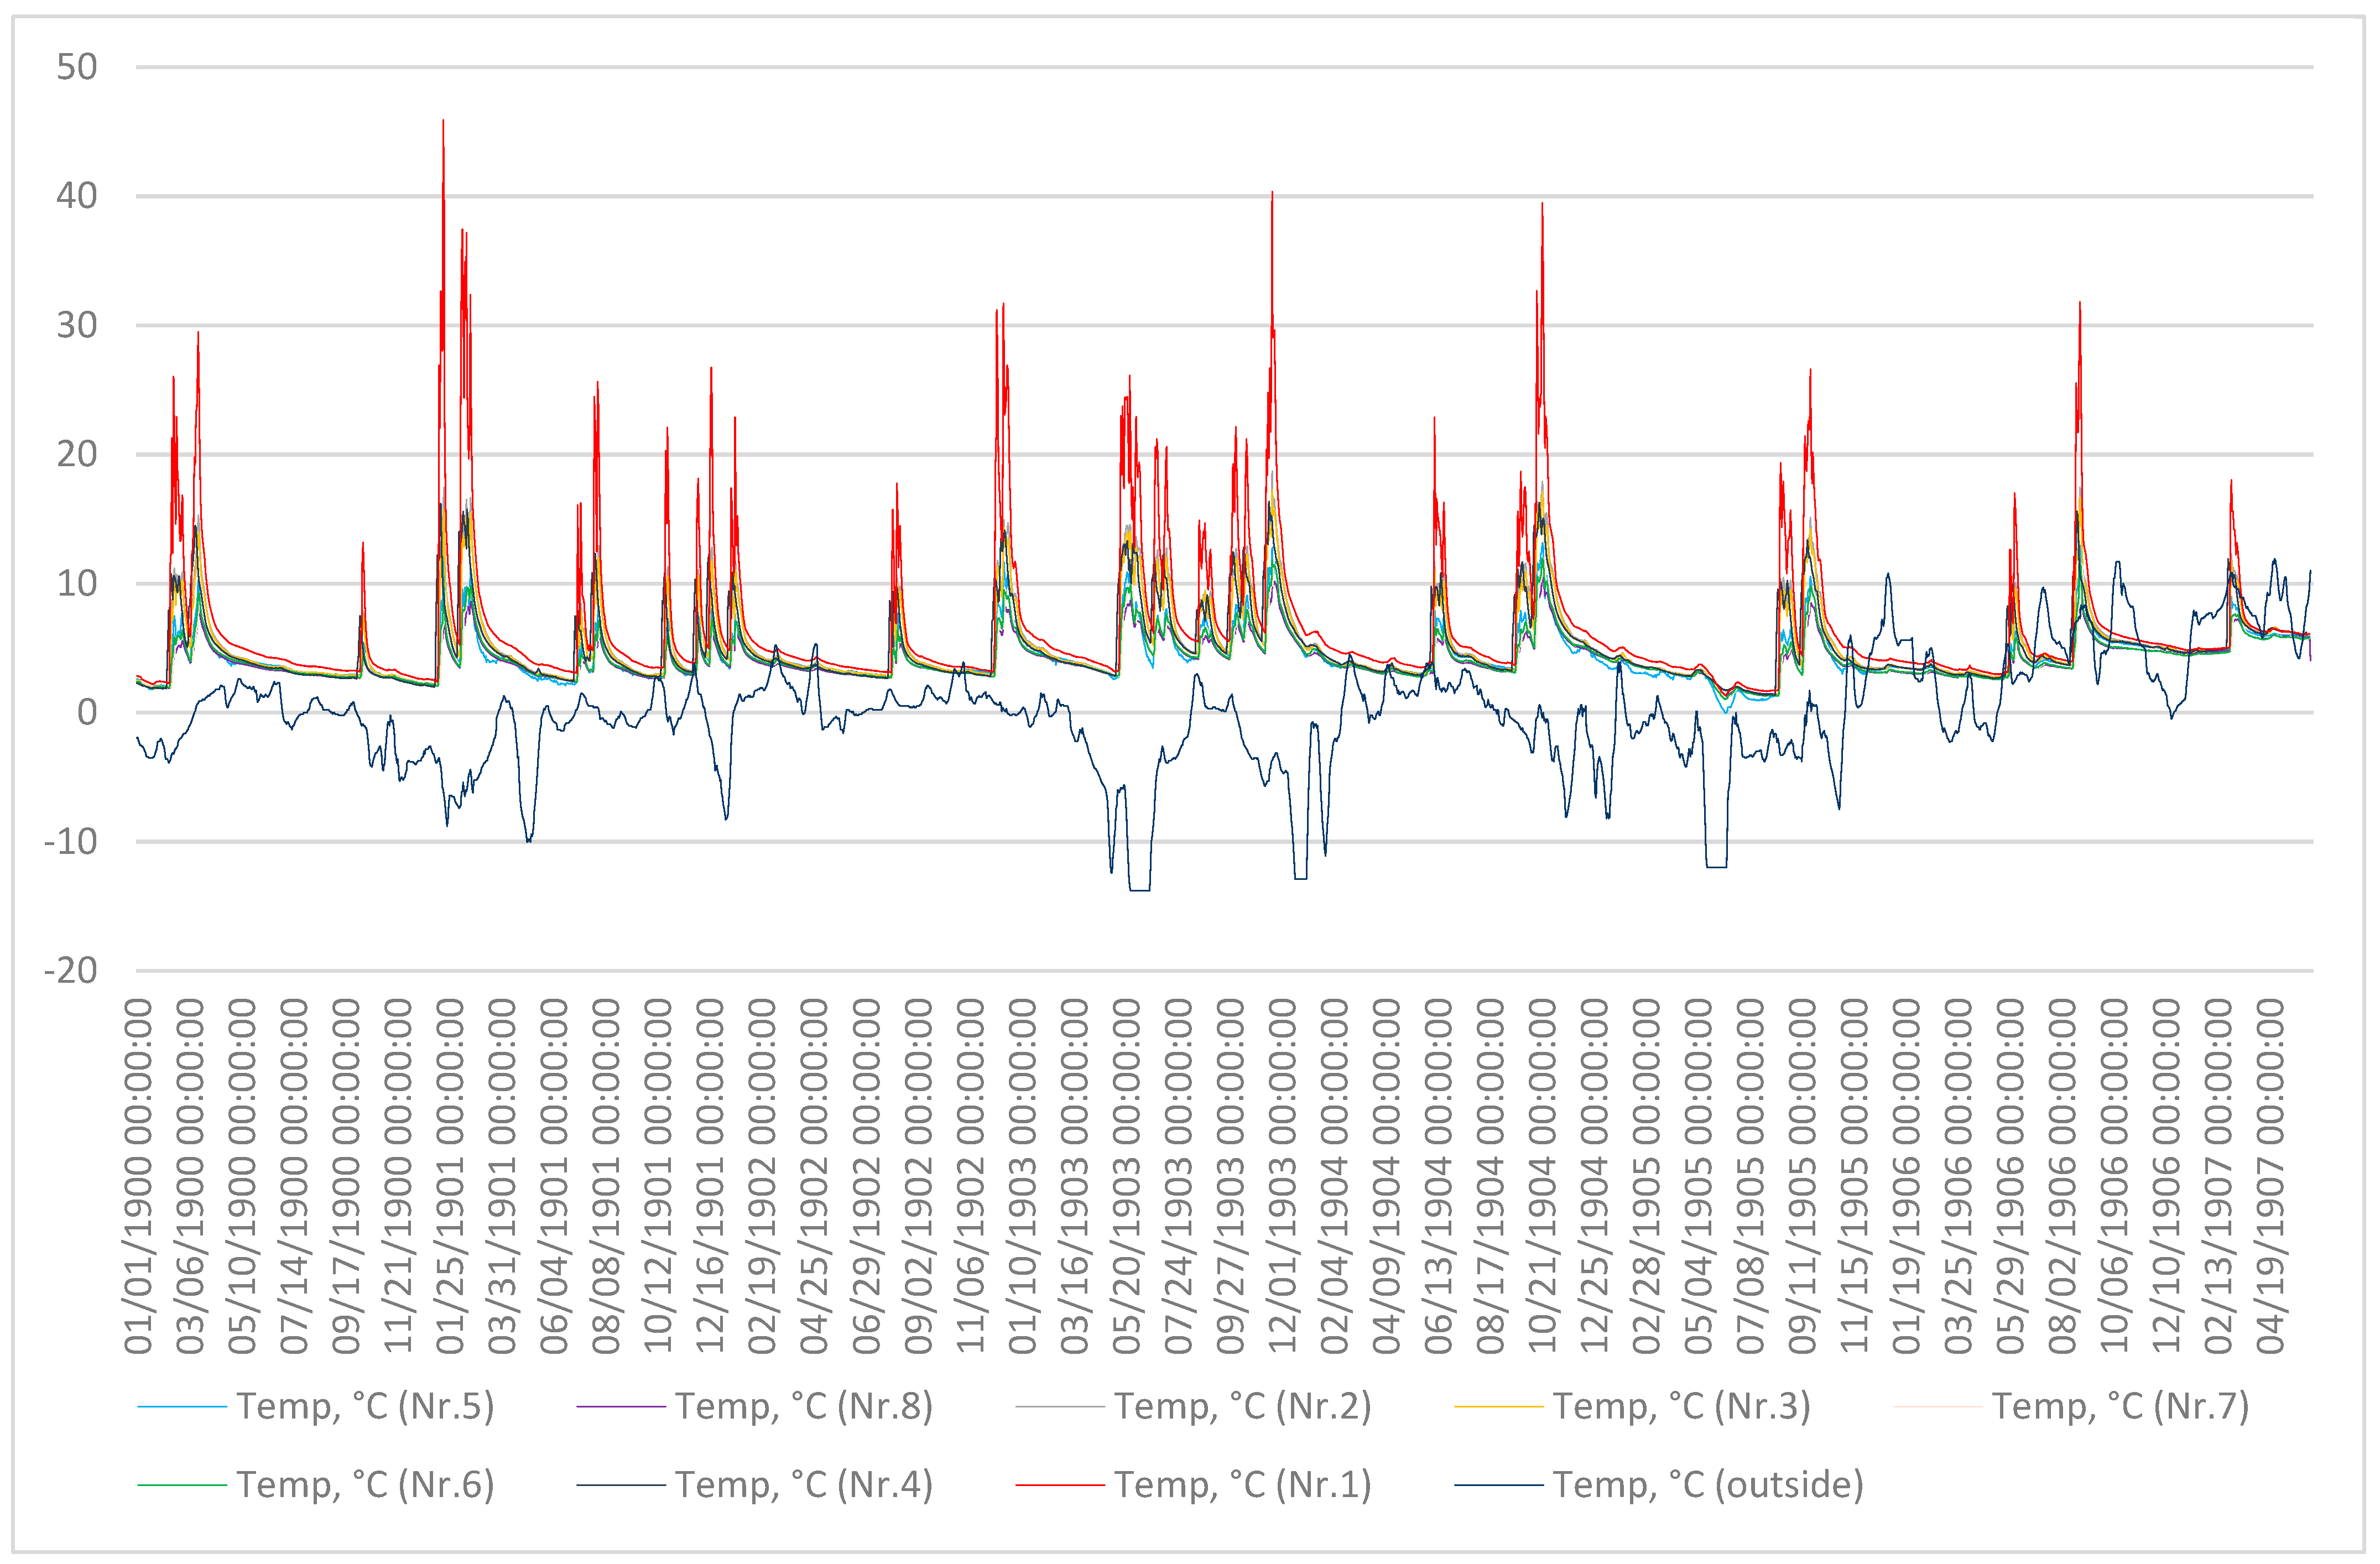
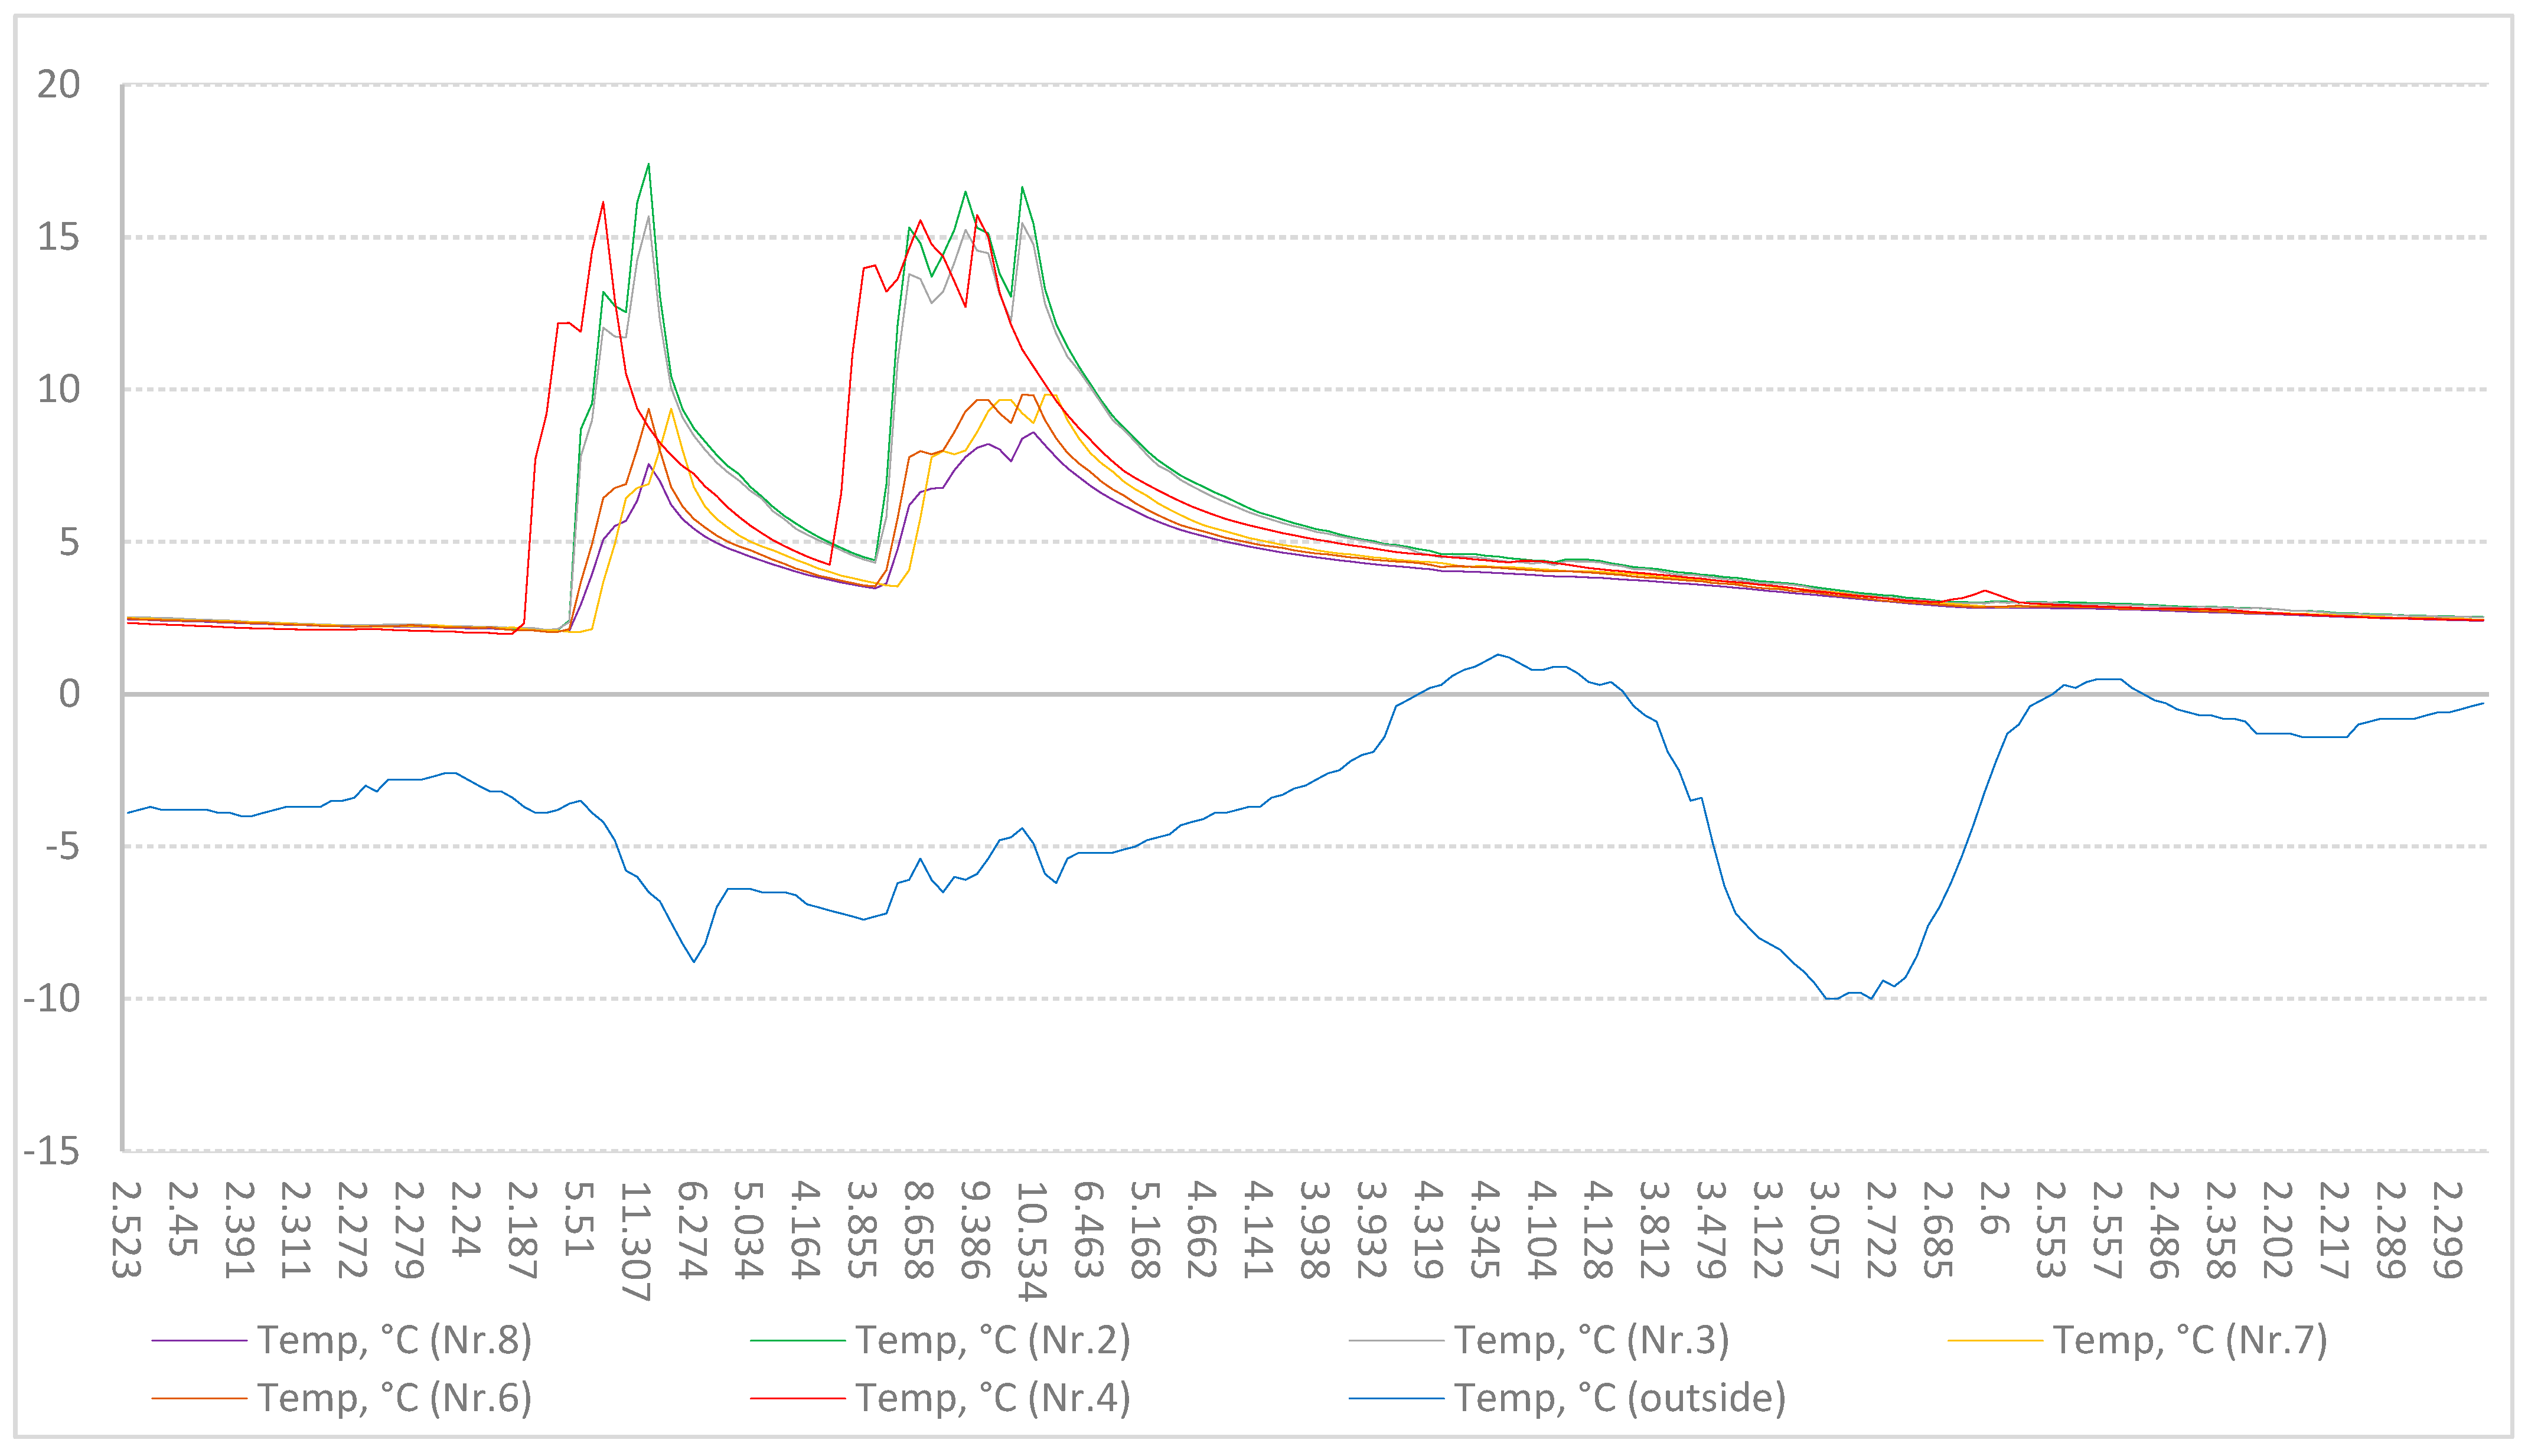
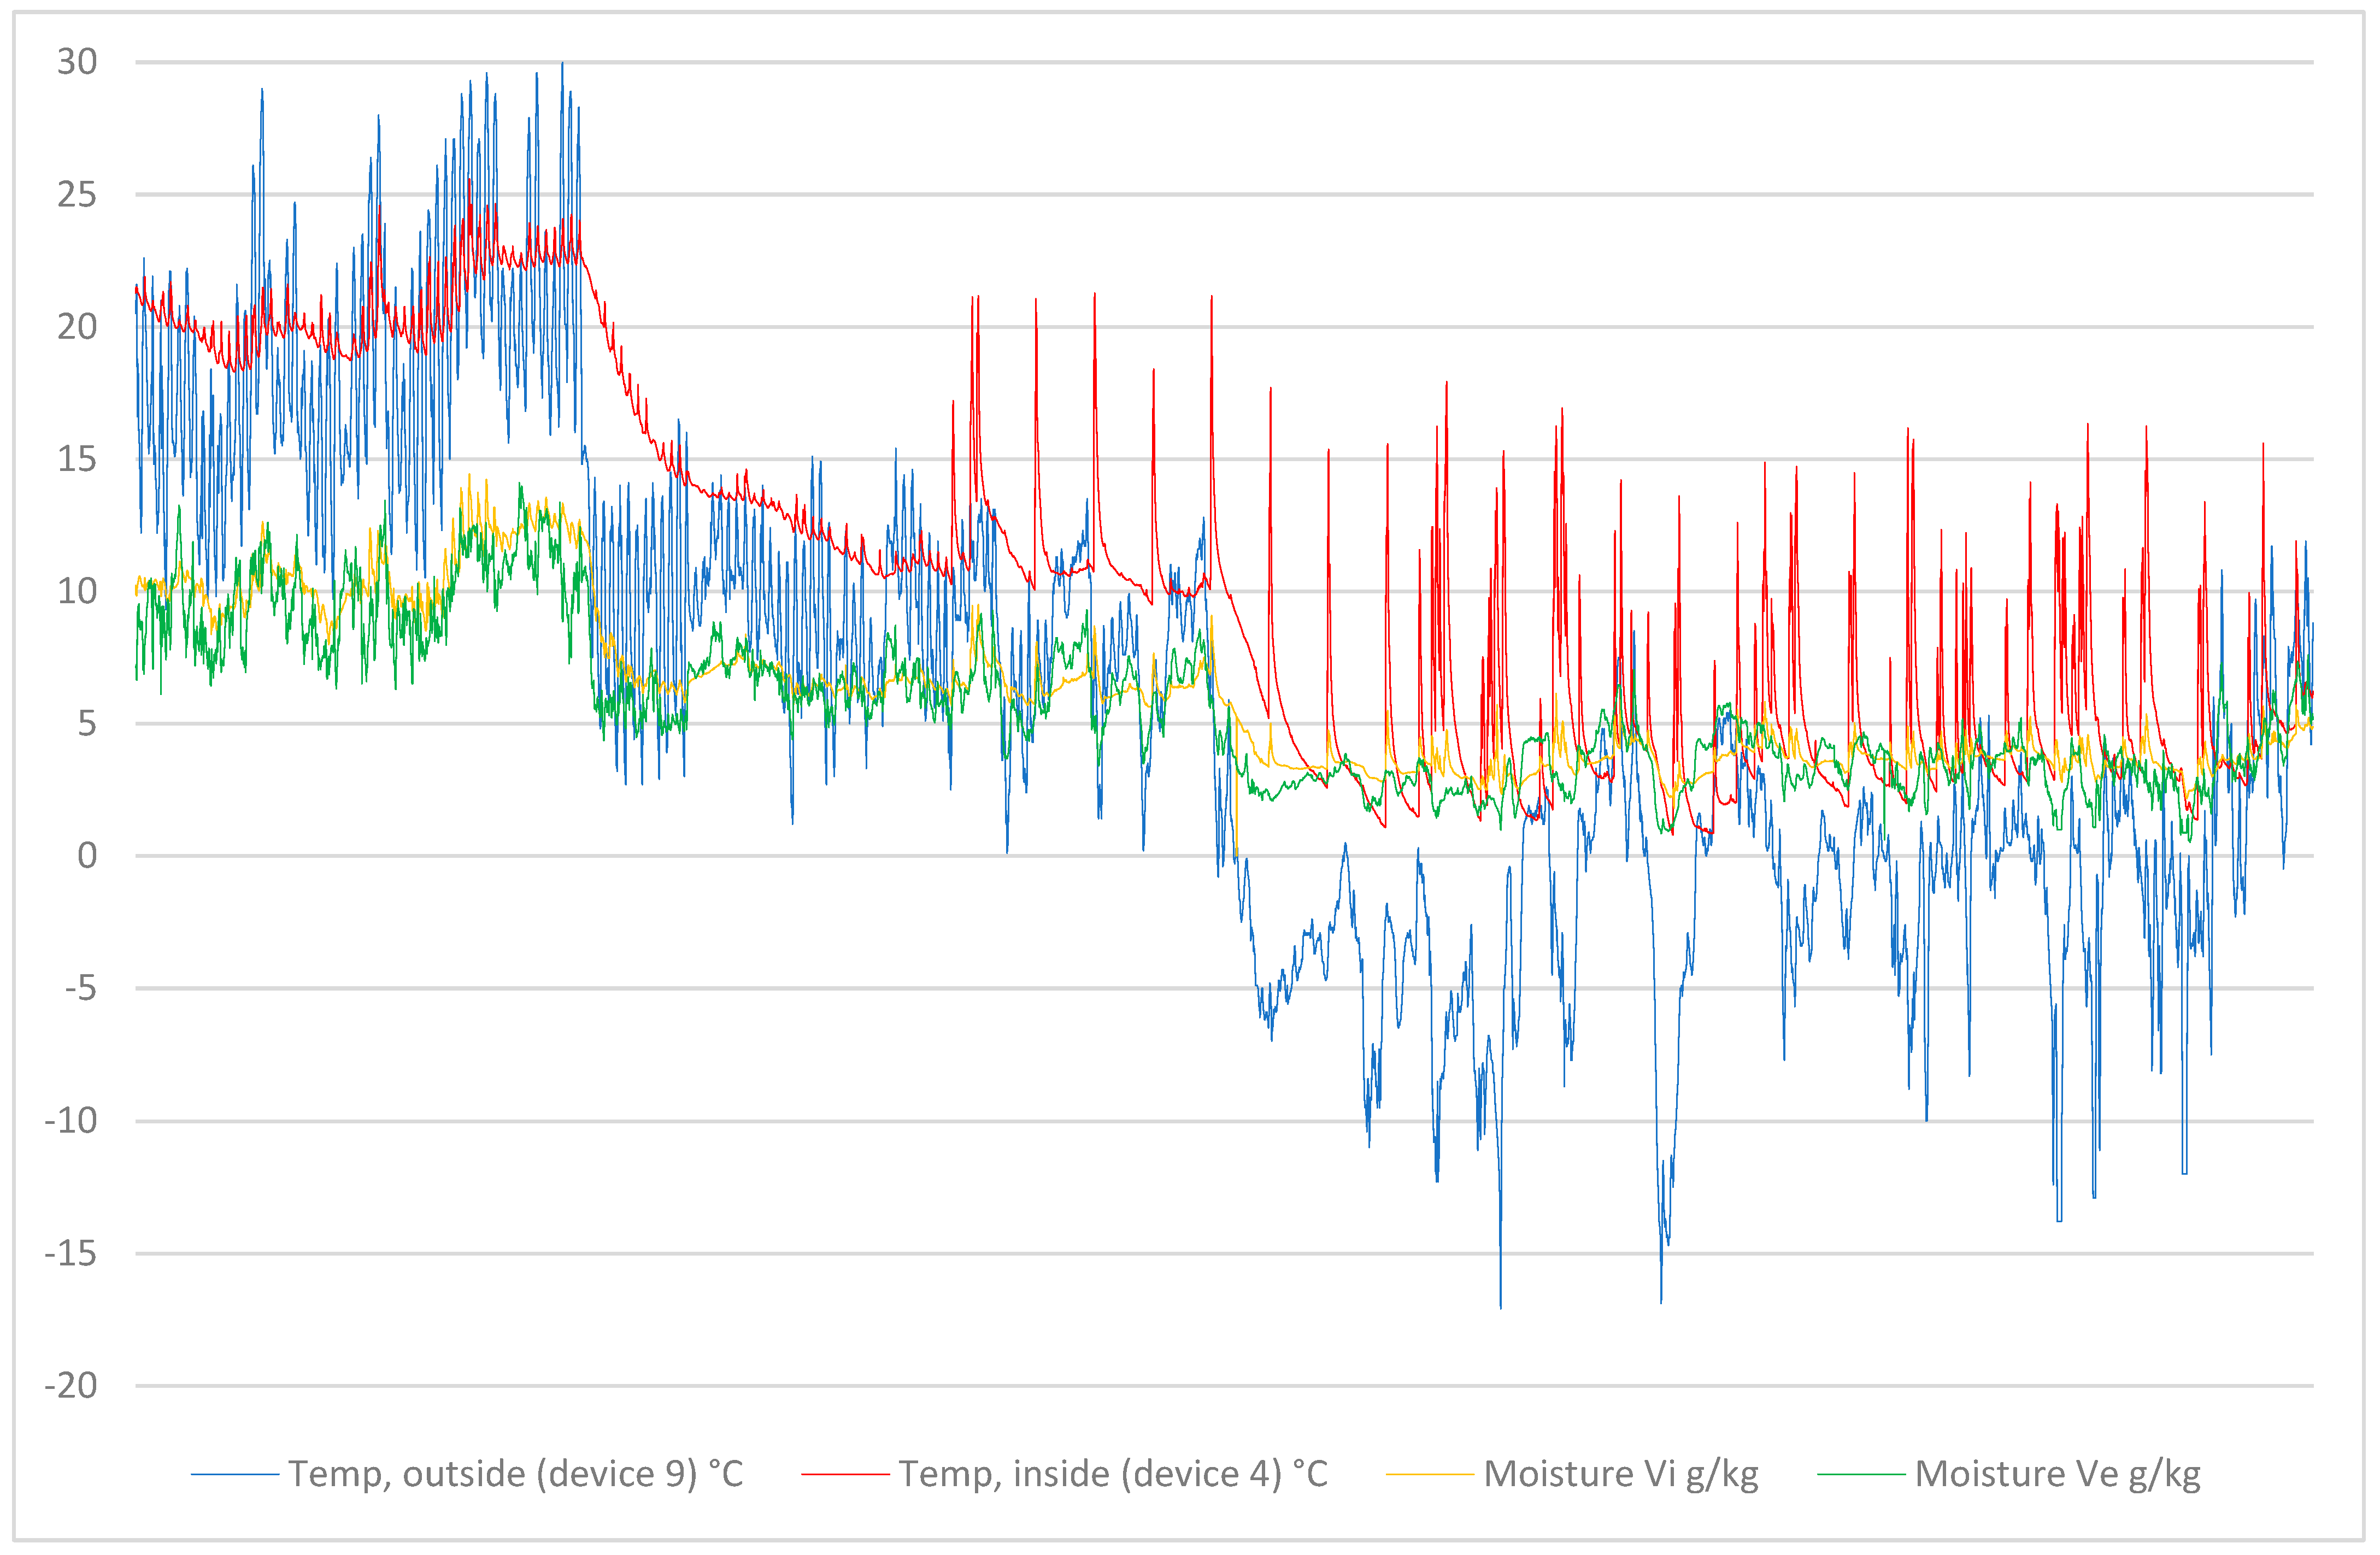
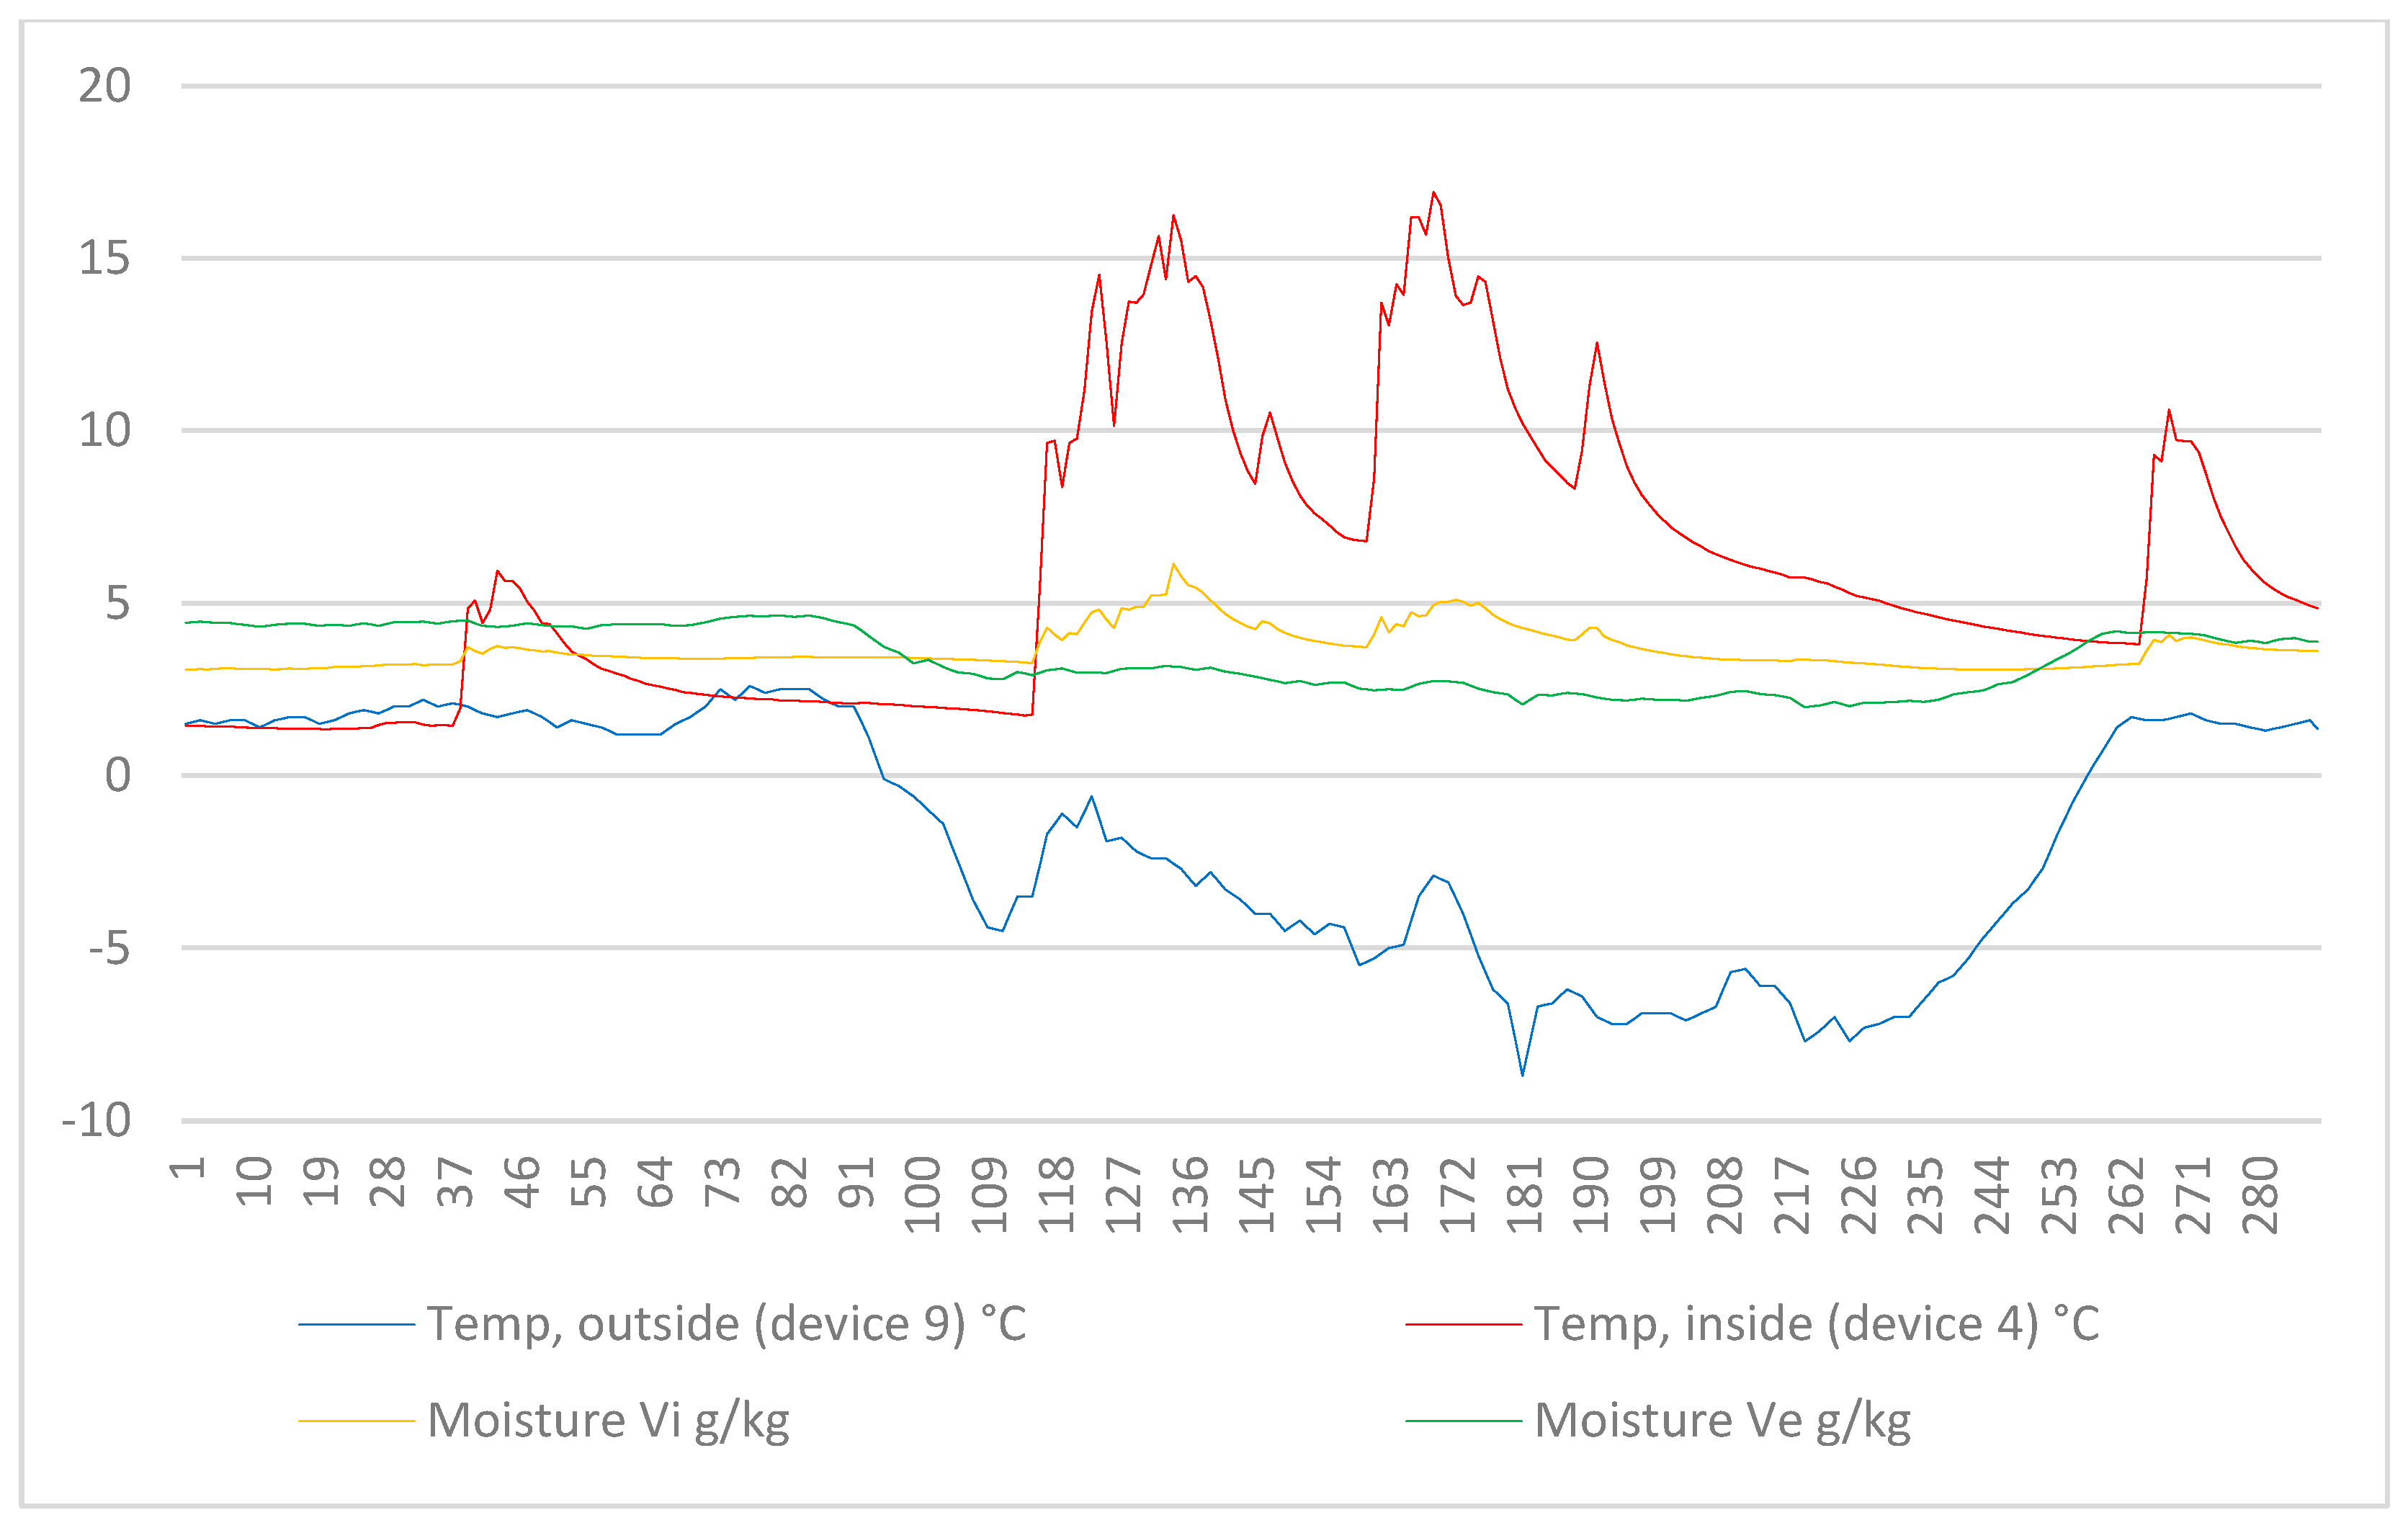
4.1. Temperature in the Krimulda Church

| Date Time, GMT+02:00 | Temp, °C (No 5) | Temp, °C (No 8) | Temp, °C (No 2) | Temp, °C (No 3) | Temp, °C (No 7) | Temp, °C (No 6) | Temp, °C (No 4) | Temp, °C (No 1) | Temp, °C (Outside) | |
|---|---|---|---|---|---|---|---|---|---|---|
| 2/4/2023 | 06:30:00 a.m. | 2.4 | 2.1 | 2.4 | 2.4 | 2.1 | 2.1 | 12.2 | 4.0 | −3.6 |
| 2/4/2023 | 07:00:00 a.m. | 5.5 | 2.9 | 8.7 | 7.8 | 2.1 | 3.7 | 11.9 | 26.9 | −3.5 |
| 2/4/2023 | 07:30:00 a.m. | 6.2 | 3.9 | 9.5 | 9.0 | 2.1 | 4.9 | 14.5 | 22.0 | −3.9 |
| 2/4/2023 | 08:00:00 a.m. | 8.5 | 5.1 | 13.2 | 12.0 | 3.7 | 6.4 | 16.2 | 32.6 | −4.2 |
| 2/4/2023 | 08:30:00 a.m. | 8.7 | 5.5 | 12.7 | 11.7 | 4.9 | 6.8 | 12.9 | 30.6 | −4.8 |
| 2/4/2023 | 09:00:00 a.m. | 7.9 | 5.7 | 12.5 | 11.7 | 6.4 | 6.9 | 10.5 | 28.0 | −5.8 |
| 2/4/2023 | 09:30:00 a.m. | 11.37 | 6.4 | 16.1 | 14.3 | 6.8 | 8.0 | 9.40 | 45.9 | −6 |
| 2/4/2023 | 10:00:00 a.m. | 12.2 | 7.6 | 17.4 | 15.7 | 6.9 | 9.4 | 8.8 | 39.8 | −6.5 |
| 2/4/2023 | 10:30:00 a.m. | 8.9 | 7.0 | 13.1 | 12.3 | 8.1 | 8.0 | 8.3 | 22.5 | −6.8 |
| 2/4/2023 | 11:00:00 a.m. | 7.4 | 6.2 | 10.4 | 10.0 | 9.4 | 6.8 | 7.8 | 16.6 | −7.5 |
| 2/4/2023 | 11:30:00 a.m. | 6.7 | 5.7 | 9.3 | 9.1 | 8.0 | 6.2 | 7.5 | 14.0 | −8.2 |


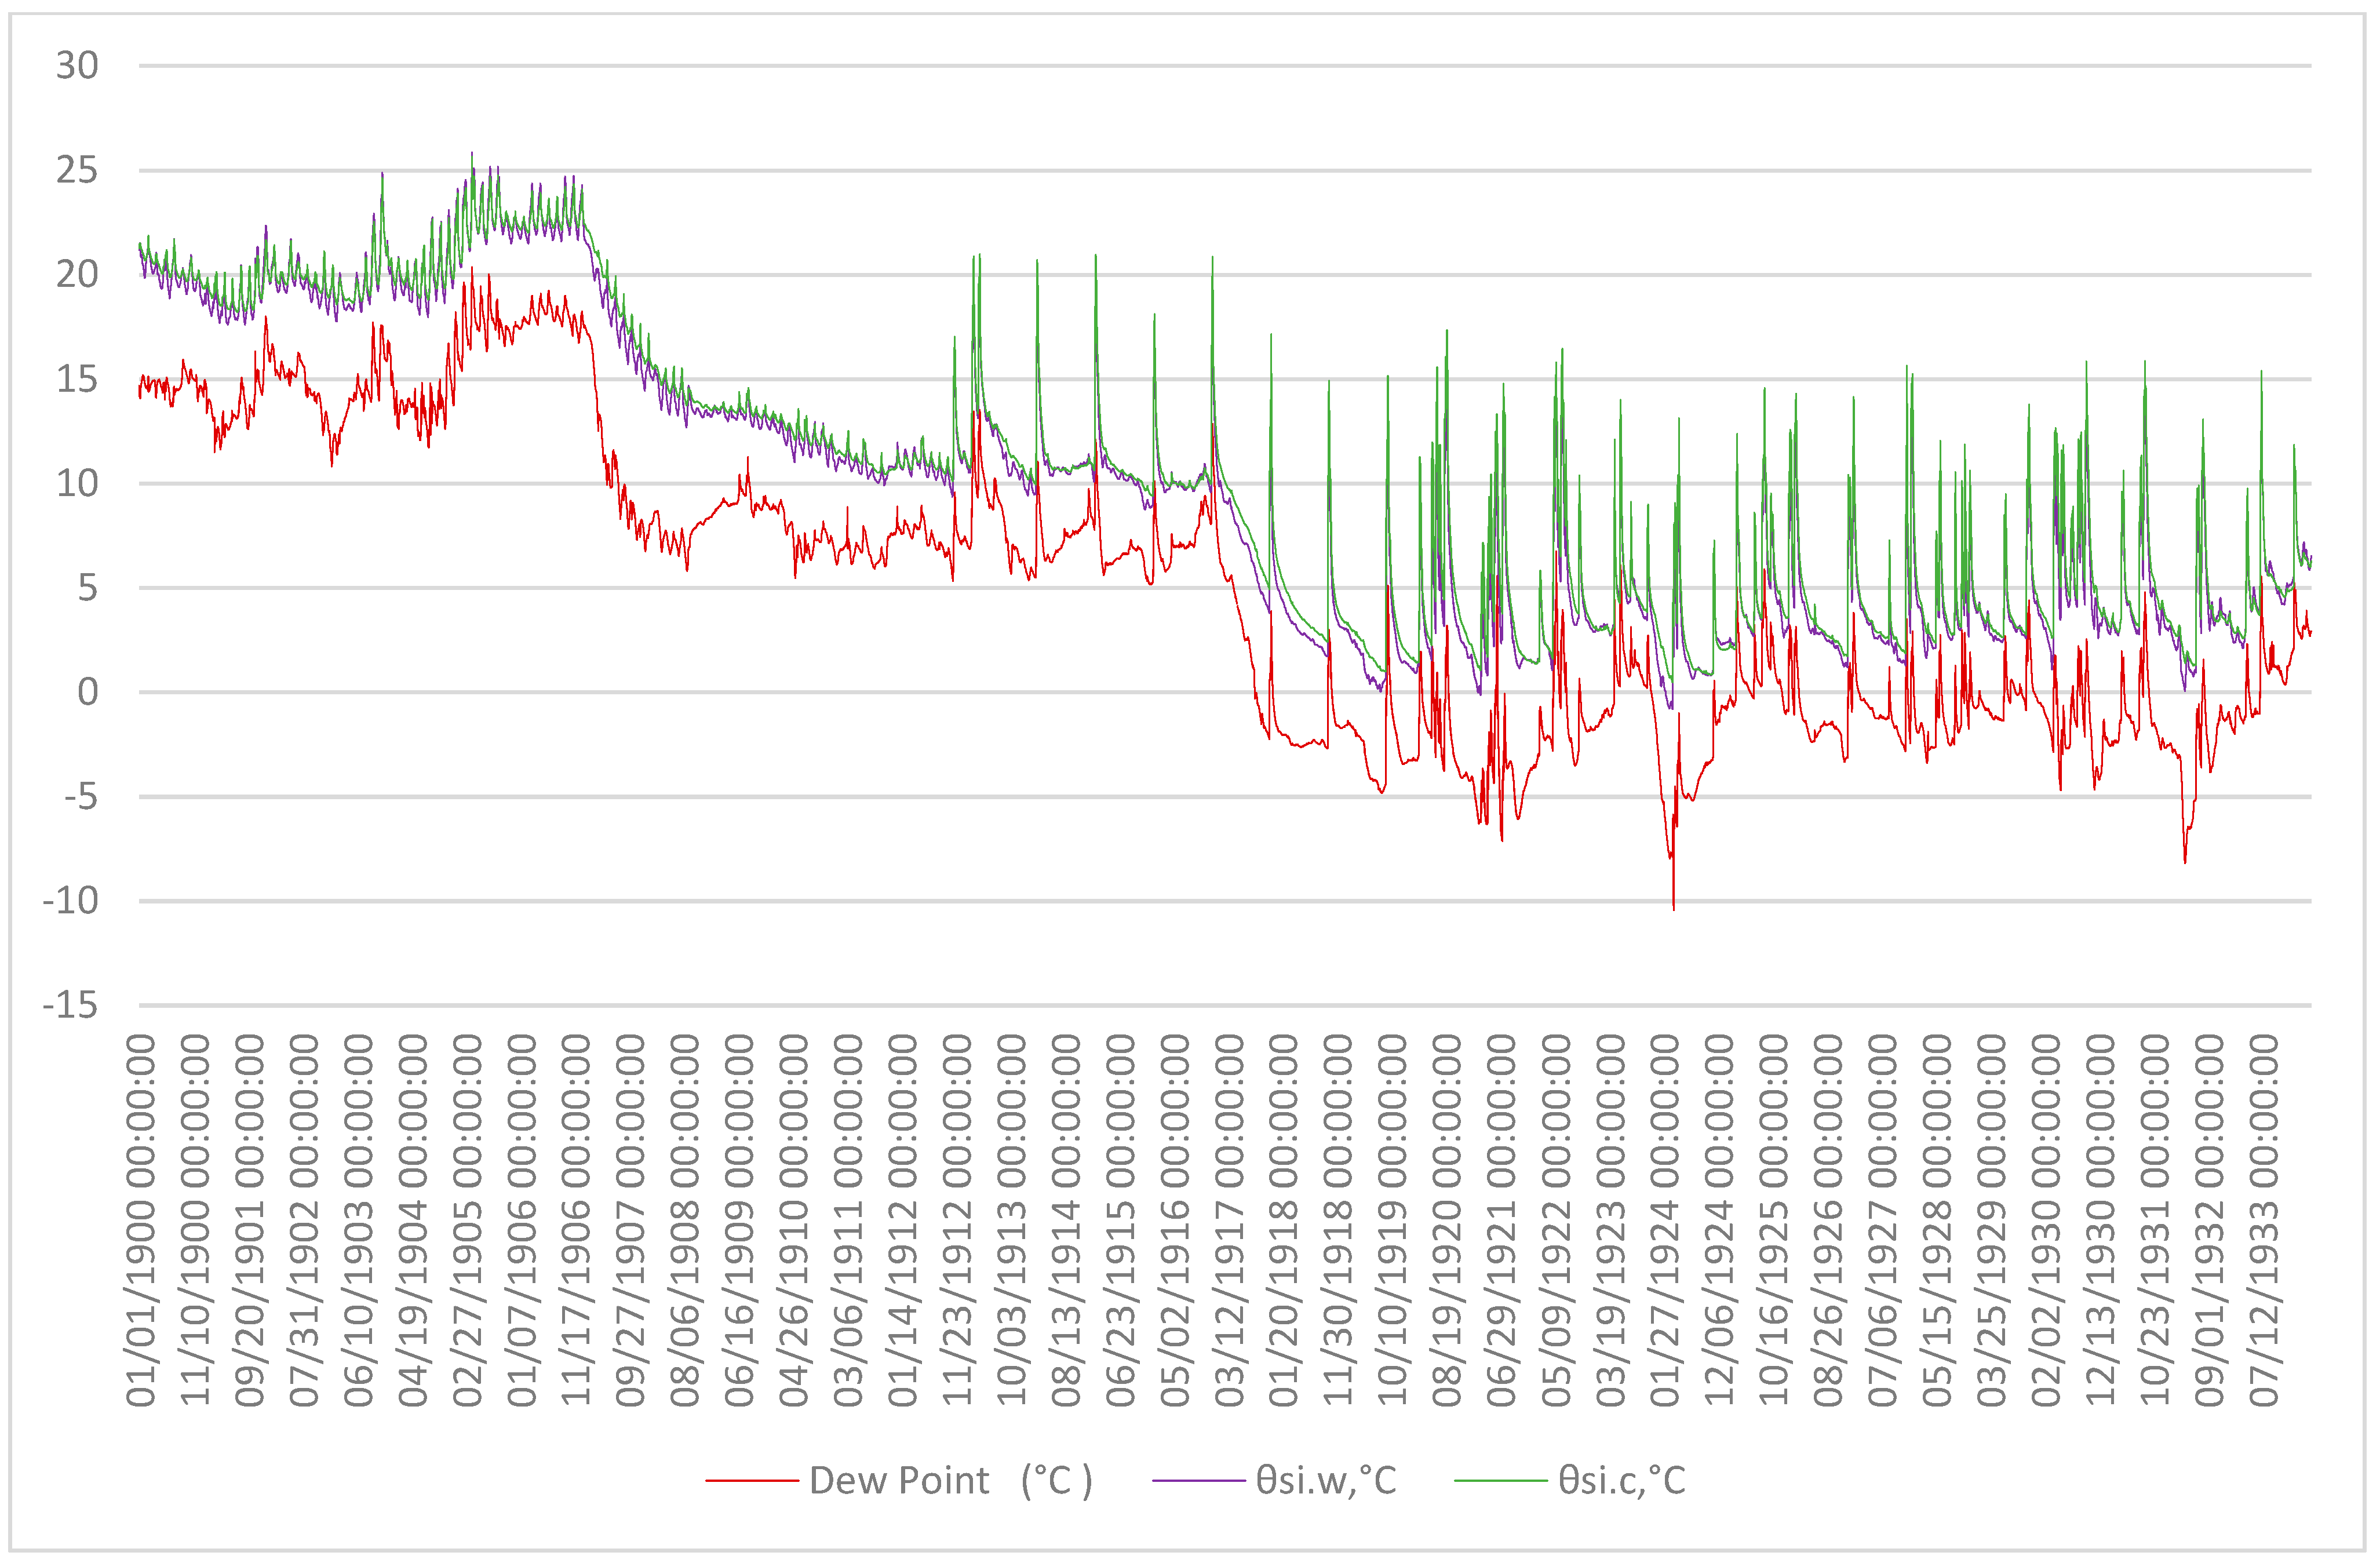
4.2. Moisture in the Krimulda Church


5. Conclusions
Author Contributions
Funding
Institutional Review Board Statement
Informed Consent Statement
Data Availability Statement
Conflicts of Interest
References
- Metals, M.; Lesinskis, A.; Turauskis, K. Control of Indoor climate of Historical cult buildings. E3S Web Conf. 2021, 246, 01005. [Google Scholar] [CrossRef]
- LVS EN 15759-1; Conservation of Cultural Property—Indoor Climate—Part 1: Guidlines for Heating Churches, Chapels and Places of Worship. Latvian Standard: Riga, Latvia, 2012.
- Metals, M.; Palcikovskis, A.; Borodinecs, A.; Lesinskis, A. Typology of Latvian Churches and Preliminary Study on Indoor Air Temperature and Moisture Behavior. Buildings 2022, 12, 1396. [Google Scholar] [CrossRef]
- Hayati, A. Measurements and modeling of airing through porches of a historical church. Sci. Technol. Built Environ. 2018, 24, 270–280. [Google Scholar] [CrossRef]
- Muñoz González, C.; León Rodríguez, A.L.; Suárez Medina, R.; Ruiz Jaramillo, J. Effects of future climate change on the preservation of artworks, thermal comfort and energy consumption in historic buildings. Appl. Energy 2020, 276, 115483. [Google Scholar] [CrossRef]
- Vuerich, E.; Malaspina, F.; Barazutti, M.; Georgiadis, T.; Nardino, M. Indoor measurements of microclimate variables and ozone in the church of San Vincenzo (Monastery of Bassano Romano—Italy): A pilot study. Microchem. J. 2008, 88, 218–223. [Google Scholar] [CrossRef]
- Varas-Muriel, M.; Fort, R.; Martínez-Garrido, M.; Zornoza-Indart, A.; López-Arce, P. Fluctuations in the indoor environment in Spanish rural churches and their effects on heritage conservation: Hygro-thermal and CO2 conditions monitoring. Build. Environ. 2014, 82, 97–109. [Google Scholar] [CrossRef]
- Zemitis, J.; Borodinecs, A.; Geikins, A.; Kalamees, T.; Kuusk, K. Ventilation System Design in Three European Geo Cluster. Energy Procedia 2016, 96, 285–293. [Google Scholar] [CrossRef][Green Version]
- Sovetnikov, D.; Baranova, D.; Borodinecs, A.; Korniyenko, S. Technical problems in churches in different climatic conditions. Constr. Unique Build. Struct. 2018, 64, 20–35. [Google Scholar] [CrossRef]
- Napp, M.; Kalamees, T. Energy use and indoor climate of conservation heating, dehumidification and adaptive ventilation for the climate control of a mediaeval church in a cold climate. Energy Build. 2015, 108, 61–71. [Google Scholar] [CrossRef]
- Mihincau, D.C.; Ilies, D.C.; Koroleva, Y.; Herman, G.V. The study of indoor microclimate on wooden churches to be included among Oradea’s representative sights. GeoJ. Tour. Geosites 2019, 26, 737–750. [Google Scholar] [CrossRef]
- Samek, L.; De Maeyer-Worobiec, A.; Spolnik, Z.; Bencs, L.; Kontozova, V.; Bratasz, Ł.; Kozłowski, R.; Van Grieken, R. The impact of electric overhead radiant heating on the indoor environment of historic churches. J. Cult. Herit. 2007, 8, 361–369. [Google Scholar] [CrossRef]
- Schellen, H.L.; Huijbregts, Z.; van Schijndel, A.W.M.; Kramer, R.P. The use of COMSOL to explore flooding and rising water problems related to heritage. In Proceedings of the 2015 Comsol Conference in Grenoble, Grenoble, Switzerland, 14–16 October 2015. [Google Scholar]
- Vella, R.C.; Martinez, F.J.R.; Yousif, C.; Gatt, D. A study of thermal comfort in naturally ventilated churches in a Mediterranean climate. Energy Build. 2020, 213, 109843. [Google Scholar] [CrossRef]
- Hnilica, O.; Bichlmair, S.; Plášek, J. Indoor climate in Jesuit church of holy name of Jesus in Telc. E3S Web Conf. 2019, 111, 03056. [Google Scholar] [CrossRef]
- Iñigo, A.; García-Talegón, J.; Vicente-Palacios, V.; Vicente-Tavera, S. Canonical Biplot as a tool to detect microclimates in the inner and outer parts of El Salvador Church in Seville, Spain. Measurement 2019, 136, 745–760. [Google Scholar] [CrossRef]
- Anaf, W.; Schalm, O. Climatic quality evaluation by peak analysis and segregation of low-, mid-, and high-frequency fluctuations, applied on a historic chapel. Build. Environ. 2019, 148, 286–293. [Google Scholar] [CrossRef]
- De Vita, M.; Rotilio, M.; Marchionni, C.; De Berardinis, P. Architectural Heritage Indoor Comfort after Retrofit Works: The Case Study of S. Vito Church in L’Aquila, Italy. Sustainability 2023, 15, 8239. [Google Scholar] [CrossRef]
- Poljak, M.; Ponechal, R. Microclimatic Monitoring—The Beginning of Saving Historical Sacral Buildings in Europe. Energies 2023, 16, 1156. [Google Scholar] [CrossRef]
- Bogdan, A.; Chambre, D.; Copolovici, D.M.; Bungau, T.; Bungau, C.C.; Copolovici, L. Heritage Building Preservation in the Process of Sustainable Urban Development: The Case of Brasov Medieval City, Romania. Sustainability 2022, 14, 6959. [Google Scholar] [CrossRef]
- Sola-Caraballo, J.; Rincón-Calderón, J.M.; Rivera-Gómez, C.; López-Martínez, J.A.; Galán-Marín, C. On-Site Risk Assessment Methodology of Historic Timber Structures: The Case Study of Santa Cruz Church. Buildings 2022, 12, 935. [Google Scholar] [CrossRef]
- EN ISO 13788:2013; Hygrothermal Performance of Building Components and Building Elements—Internal Surface Temperature to Avoid Critical Surface Humidity and Interstitial Condensation—Calculation Methods. ISO: Geneva, Switzerland, 2020.
- Alduchov, O.A.; Eskridge, R.E. Improved Magnus’ from Aproximation of Saturation Vapor Pressure. 1997. Available online: http://www.osti.gov/servlets/purl/548871-PjpxAP/webviewable/ (accessed on 14 August 2023).
- ASHRAE. 2021 ASHRAE® Handbook: Fundamentals; ASHRAE: Peachtree Corners, GA, USA, 2021. [Google Scholar]
- Zemītis, J. Analysis and Prediction Methods of Indoor Air Quality. 2015, pp. 7–8. Available online: https://www.rtu.lv/writable/public_files/Jurga_Zemisa_darba_kopsavilkums.pdf (accessed on 14 August 2023).


| From | Measurement Type and Device Name | Measuring Period | Location and Description | Point Title | |
|---|---|---|---|---|---|
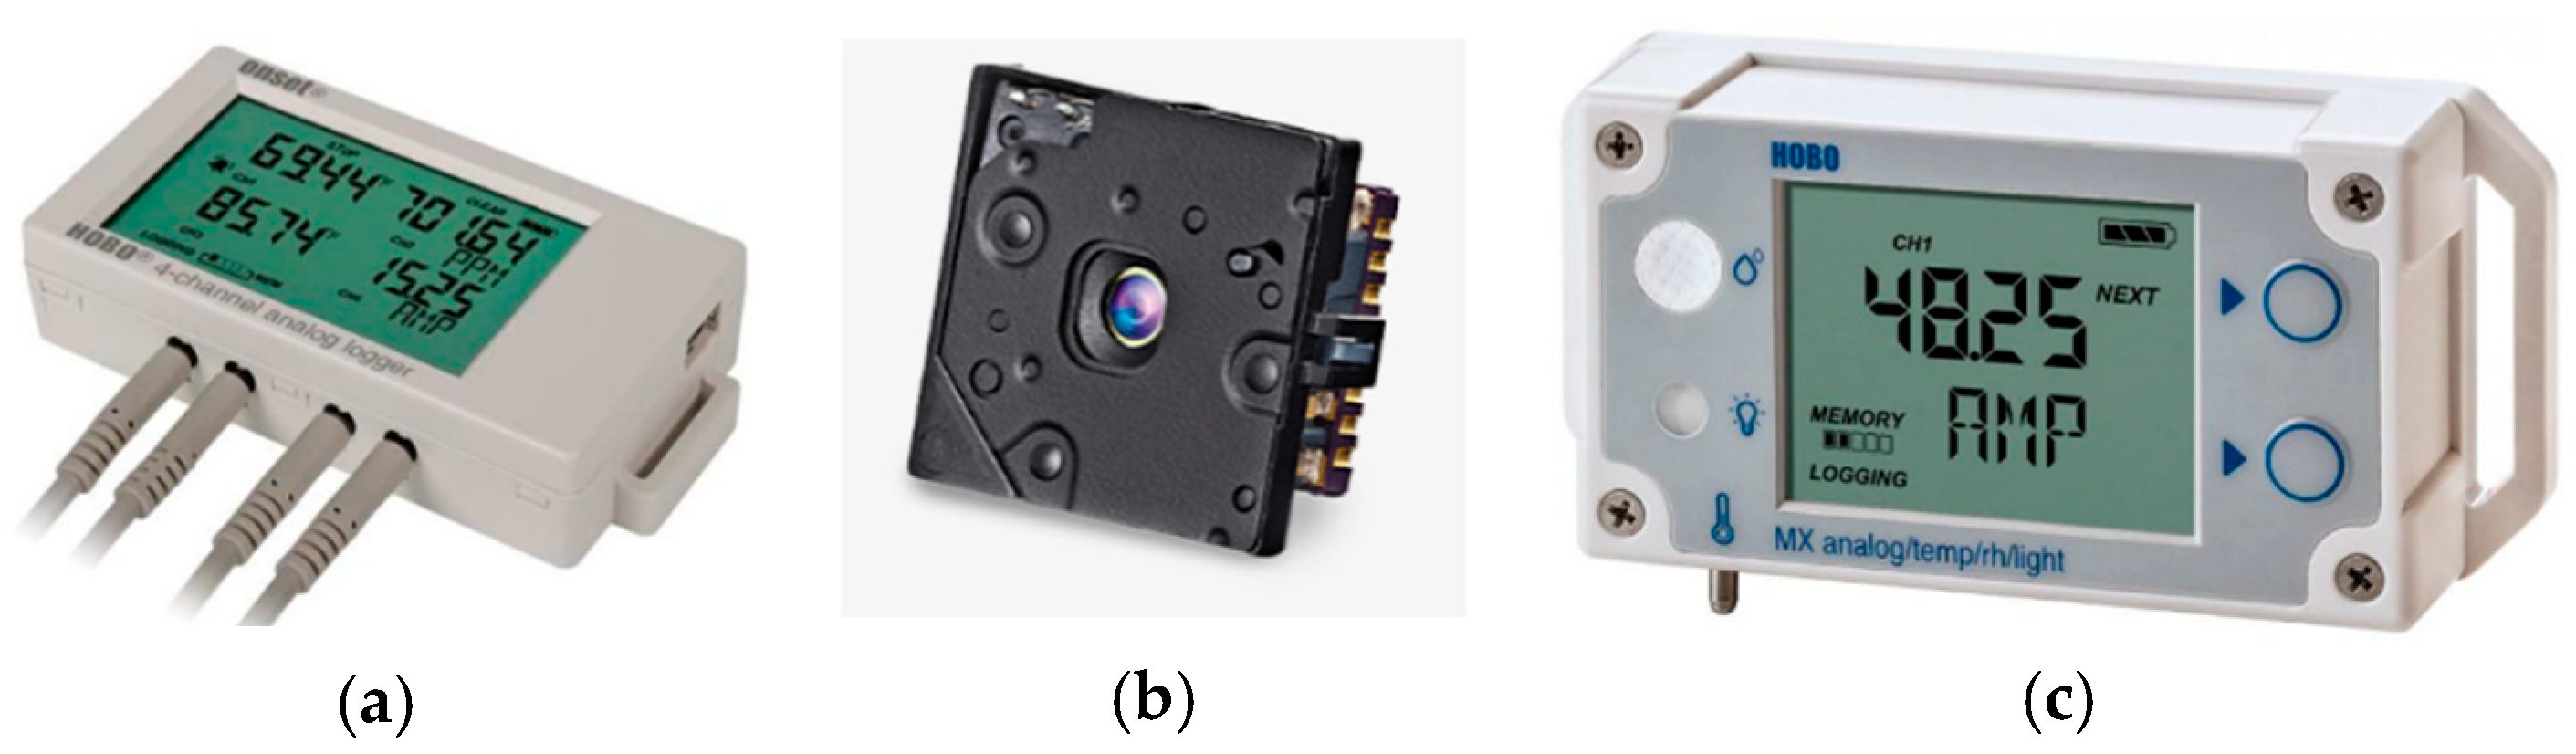
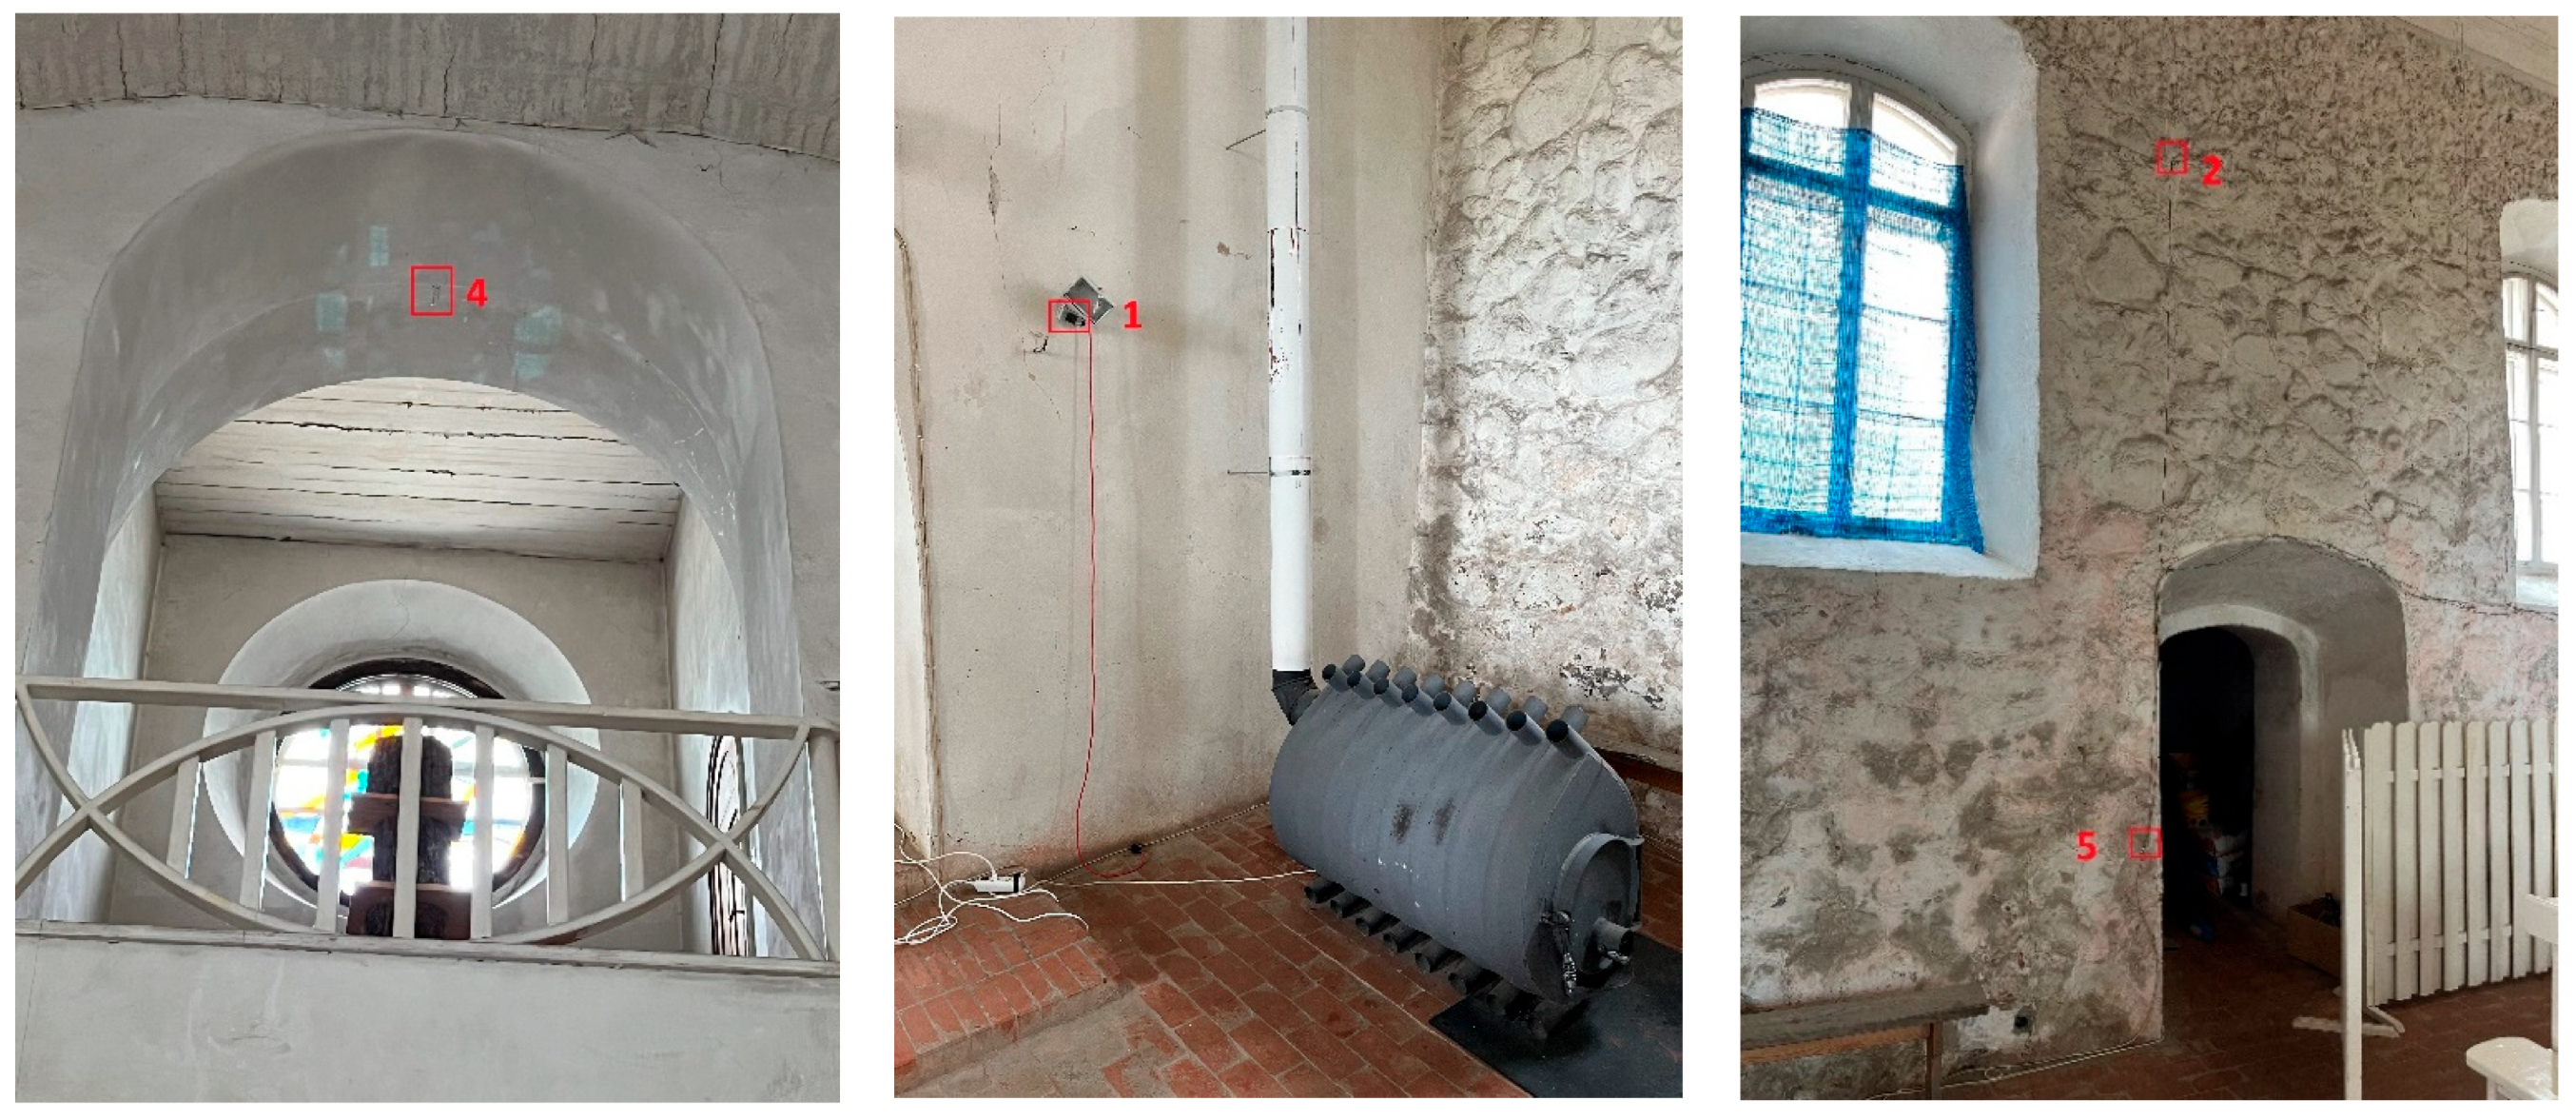
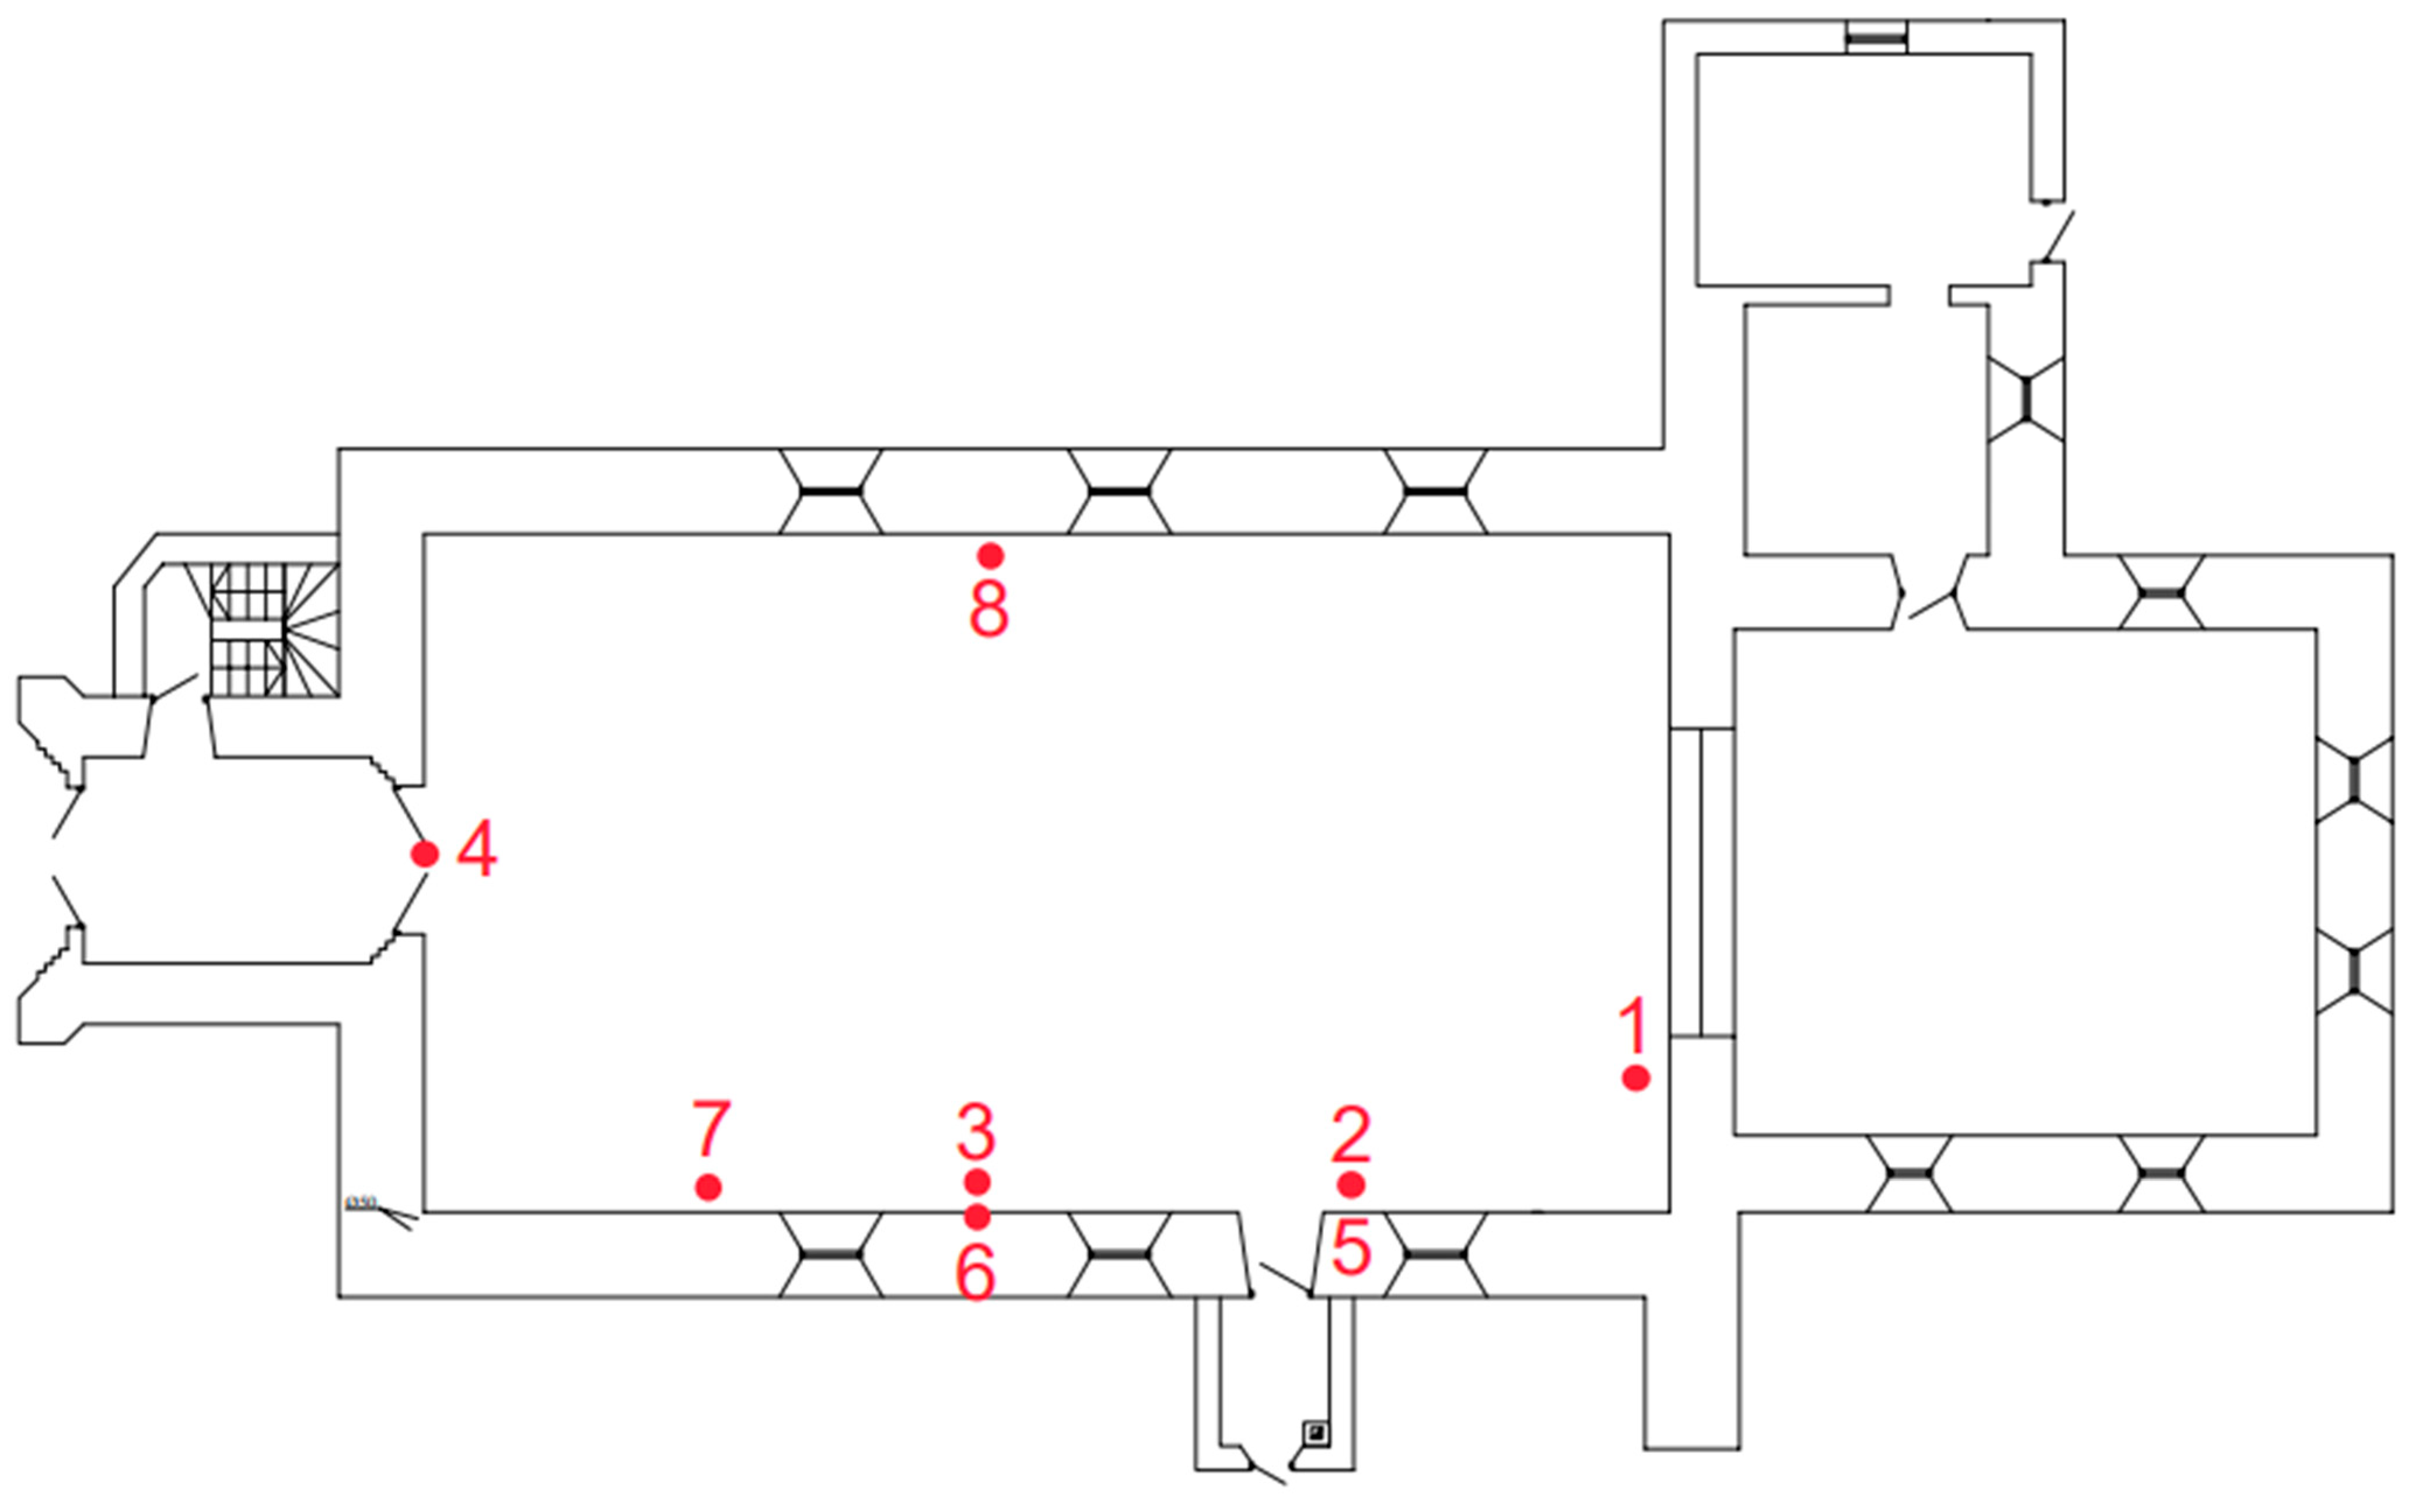
| 1 | Relative humidity, temperature HOBO MX1104 Temp/RH | 12/21/2022 | 2 p.m. | On the eastern partition wall, 2.35 m above the floor, and on the wall 0.82 m away from the metal chimney of the stove | “Stove” |
| 3/25/2023 | 12 p.m. | ||||
| 2 | Temperature HOBO 4—Channel (UX120-006M) | 1/27/2023 | 9 p.m. | On the southern external wall, 4.2 m above the floor and 2.8 m away from the stove | “At the first window” |
| 3/25/2023 | 12 p.m. | ||||
| 3 | Temperature HOBO 4—Channel (UX120-006M) | 1/27/2023 | 9 p.m. | On the southern external wall, between windows, 4.15 m above the floor and 8.5 m away from the stove | Between S windows |
| 3/25/2023 | 12 p.m. | ||||
| 4 | Relative humidity, temperature HOBO MX1104 Temp/RH | 7/7/2022 | 1 a.m. | 8.8 m above the floor, at the centre of the ceiling and the balcony arch | On balcony |
| 3/25/2023 | 12 p.m. | ||||
| 5 | Temperature HOBO 4—Channel (UX120-006M) | 1/27/2023 | 9 p.m. | On the southern external wall, at the corner of the lateral door opening, 0.9 m above the floor and 2.8 m away from the stove | “At the lateral door” |
| 3/25/2023 | 12 p.m. | ||||
| 6 | Relative humidity, temperature HOBO MX1104 Temp/RH | 1/27/2023 | 9 p.m. | On the external northern wall between windows, 2.25 m above the floor and 12.9 m horizontally away from the stove | On N wall |
| 3/25/2023 | 12 p.m. | ||||
| 7 | Relative humidity, temperature HOBO MX1104 Temp/RH | 7/7/2022 | 1 a.m. | On the external southern wall, 2.8 m above the floor and 12.7 m horizontally away from the stove | On S wall |
| 3/25/2023 | 12 p.m. | ||||
| 8 | Temperature HOBO 4—Channel (UX120-006M) | 1/27/2023 | 9 p.m. | In direct contact with the southern wall, 1.95 m above the floor and 8.4 m away from the stove | “S wall” |
| 3/25/2023 | 12 p.m. | ||||
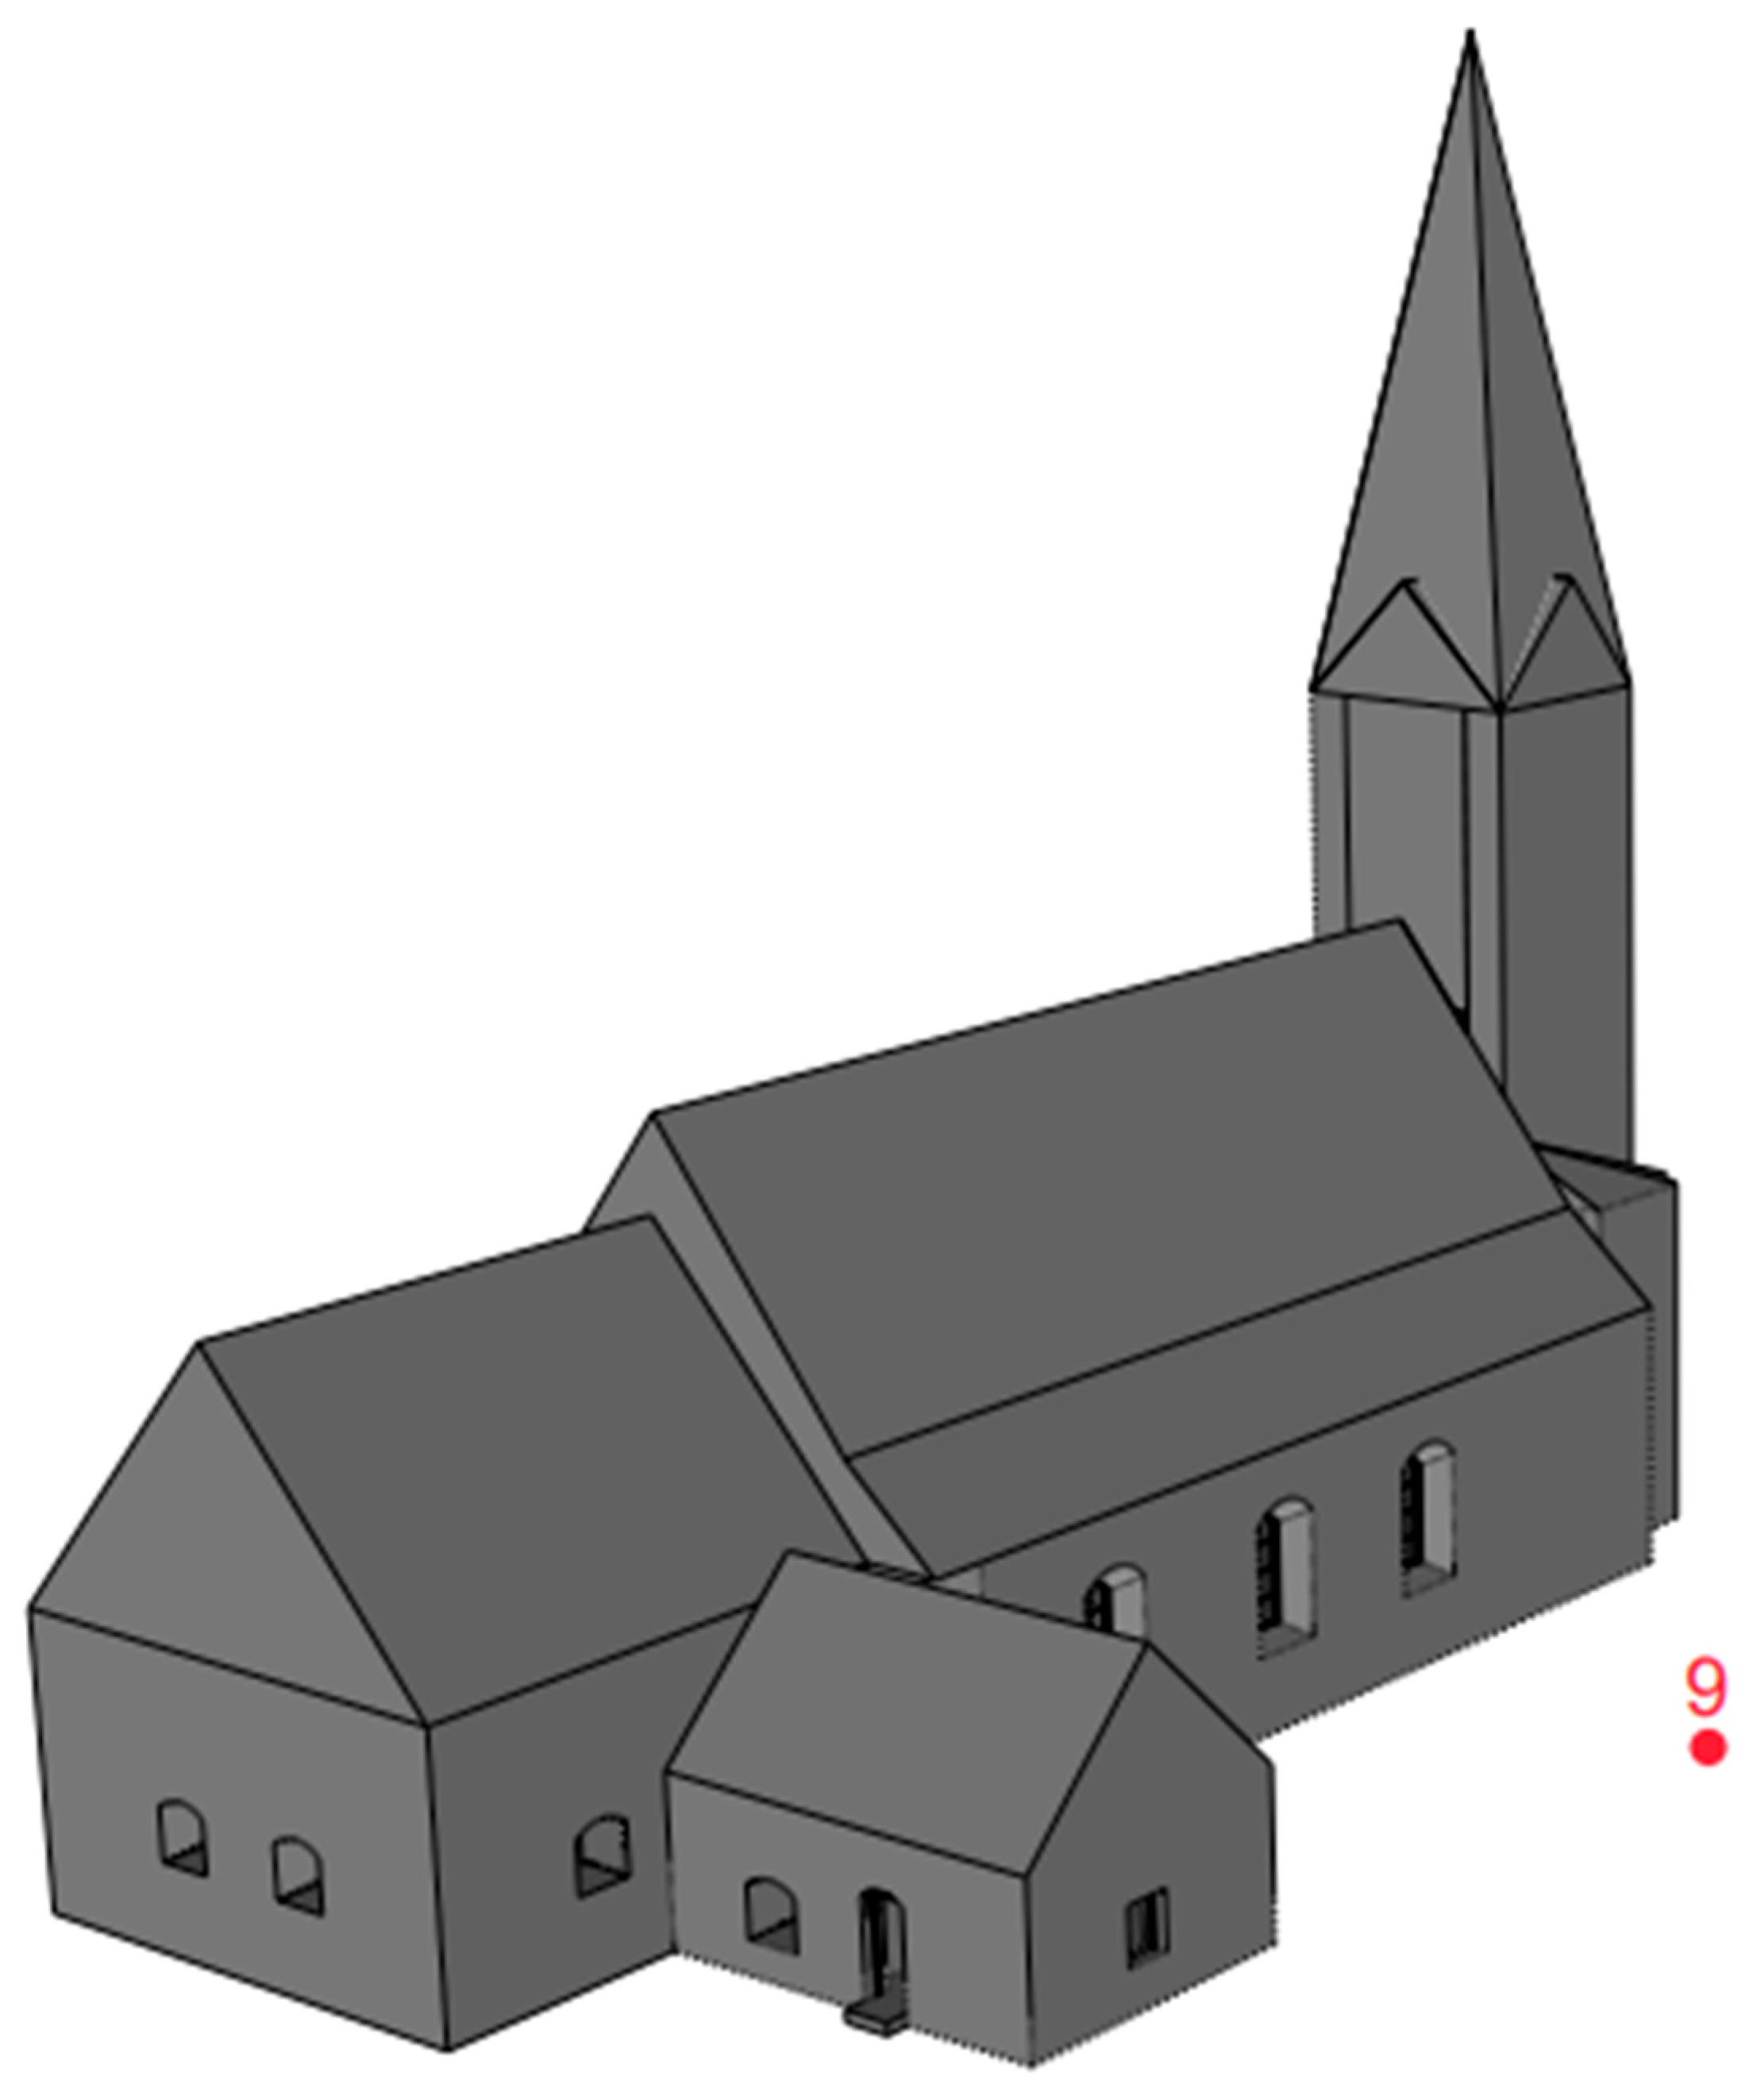
| 9 | Relative humidity, temperature HOBO MX1104 Temp/RH | “Outside” | |||
Disclaimer/Publisher’s Note: The statements, opinions and data contained in all publications are solely those of the individual author(s) and contributor(s) and not of MDPI and/or the editor(s). MDPI and/or the editor(s) disclaim responsibility for any injury to people or property resulting from any ideas, methods, instructions or products referred to in the content. |
© 2023 by the authors. Licensee MDPI, Basel, Switzerland. This article is an open access article distributed under the terms and conditions of the Creative Commons Attribution (CC BY) license (https://creativecommons.org/licenses/by/4.0/).
Share and Cite
Metals, M.; Lesinskis, A.; Borodinecs, A.; Turauskis, K. Preliminary Study on Indoor Air Temperature and Moisture Behaviour in 13th-Century Churches in Latvia. Sustainability 2023, 15, 13965. https://doi.org/10.3390/su151813965
Metals M, Lesinskis A, Borodinecs A, Turauskis K. Preliminary Study on Indoor Air Temperature and Moisture Behaviour in 13th-Century Churches in Latvia. Sustainability. 2023; 15(18):13965. https://doi.org/10.3390/su151813965
Chicago/Turabian StyleMetals, Martins, Arturs Lesinskis, Anatolijs Borodinecs, and Kristaps Turauskis. 2023. "Preliminary Study on Indoor Air Temperature and Moisture Behaviour in 13th-Century Churches in Latvia" Sustainability 15, no. 18: 13965. https://doi.org/10.3390/su151813965
APA StyleMetals, M., Lesinskis, A., Borodinecs, A., & Turauskis, K. (2023). Preliminary Study on Indoor Air Temperature and Moisture Behaviour in 13th-Century Churches in Latvia. Sustainability, 15(18), 13965. https://doi.org/10.3390/su151813965