Article

The Location Choice and Survival of Polluting Firms under Environmental Regulation in Urban Agglomerations of China

1
School of Public Administration, Xi’an University of Architecture and Technology, Xi’an 710055, China
2
School of Public Administration, Central China Normal University, Wuhan 430079, China
*
Author to whom correspondence should be addressed.
Sustainability 2023, 15(18), 13711; https://doi.org/10.3390/su151813711
Submission received: 9 August 2023 / Revised: 6 September 2023 / Accepted: 11 September 2023 / Published: 14 September 2023
(This article belongs to the Section Sustainable Urban and Rural Development)

Abstract

:
There are few studies discussing the relationship between the increasing intensity of environmental regulation in the central cities of urban agglomerations, which is the main method used to solve the problem of regional environmental pollution, with the survival status of polluting firms in different spatial locations. In order to more clearly describe the evolution trend of the spatial distribution of polluting firms and coordinate inter-city environmental regulation policies in a more targeted manner, we examine the impact of polluting firms’ location choice on their survival under the central–periphery spatial structure in national-level urban agglomerations from 1998 to 2013 with the accelerated failure time (AFT) model and Cox proportional hazards (Cox PH) model and using matching data of the Chinese Industrial Enterprise Database and the Chinese Industrial Enterprise Pollution Emission Database. The results find that (1) under the influence of central cities’ environmental regulations, there is likely to be an inverted U-shaped relationship between the survival of polluting firms and their spatial distance from the central cities; (2) the inverted U-shaped relationship is the motivation of the interaction between environmental regulation and market potential, which means increases in the environmental regulation intensity in the central cities of the urban agglomeration will have a negative effect on the survival of polluting firms, and the central cities’ market potential will partially offset the negative impact; (3) the inverted U-shaped relationship is more significant for private firms, and it does not necessarily exist for new entrants. The above results help to provide important policy inspiration for promoting the joint prevention and control mechanism for pollution in urban agglomerations and coordinate the effects of environmental regulation and economic transformation policies between central and peripheral cities.

1. Introduction

China’s urban agglomerations have become a highly sensitive area and the hot topic of environmental pollution, as they account for three-quarters of the country’s economic aggregate and nearly three-quarters of the country’s pollution emissions [1]. The Outline of the National New Urbanization Plan (2021–2035) clearly proposes that urban agglomerations should be used as spatial units to solve regional environmental pollution. With the promulgation of pollution reduction targets in urban agglomerations and the introduction of joint prevention and control policies, the polluting industries in urban agglomerations are shifting from concentration to decentralization. The process of reshaping the industrial spatial structure will inevitably have an impact on micro-enterprise bodies, but more research focuses on polluting industry transfers [2]. As the location choice and survival of polluting firms have gradually become the focus in recent years, the inconsistency of environmental regulation between the central and peripheral cities will inevitably make polluting firms reconsider their locations [3,4]. A clear and rigorous test is still lacking to this day, and we investigate the impact of the underlying factors behind the polluting firms’ location choice and survival based on the “center-periphery” spatial structure. By clarifying the heterogeneous effects of increasing environmental regulation in central cities on the survival of polluting firms in different spatial locations, it will help to correctly grasp the dynamic layout and development of polluting firms, and to accelerate coordinated development of the environmental regulation policies between central and peripheral cities.
Location choice is one of the most important micro-activities for polluting firms [5]. The theory of new economic geography believes that geographical locations and historical advantages are the initial conditions for the formation of firm agglomerations in central cities [6]. Based on accidental or historical factors, some certain regions gain location advantages and become central cities under the influence of path dependence, and they can generate a cumulative effect through the inter-industry correlation and lead to a “lock-in” of the central city’s location under the effect of increasing returns to scale, which ultimately affects the spatial location transfer of firms in reality to a certain extent [7,8]. As they have a special existence in the firm group, polluting firms have not received complete attention in regards to firm location choice theories [9]. Therefore, traditional firm location choice theories do not include environmental regulation factors in the analysis framework, and they believe that market potential is the determining factor of clustering in central cities and can increase the survival possibility of polluting firms located in central cities [10]. However, the reality we see is the uncoordinated environmental regulation in the central and peripheral cities within the urban agglomerations. In this context, traditional theories do not well explain the impact of this lack of coordination on firms’ location strategies.
Regarding the impact of environmental regulation on the firms’ location, its theoretical basis is the “Pollution Haven Hypothesis” and “Porter Hypothesis” [11,12]. The “Pollution Haven Hypothesis” believes that polluting industries tend to withdraw from the pressure of environmental regulation and move to areas with looser environmental regulation. To reduce the cost of environmental governance [13,14], the spatial distribution of polluting firms in China shows strong environmental capacity constraints and government regulation dominance, which further proves the hypothesis [15,16]. The “Porter Hypothesis” holds that appropriate environmental regulations can stimulate firms’ innovation compensation mechanisms and reduce corporate environmental governance costs by stimulating technological innovation [12]. Strict environmental regulation will affect the location choice of polluting firms by affecting regional technological innovation capabilities and labor costs [17]. However, the “Pollution Haven Hypothesis” and “Porter Hypothesis” pay more attention to the role of differences in the intensity of environmental regulations between regions and countries in regards to the firms’ location choice; they cannot fully explain the changes in the firms’ location choice between central cities and periphery cities within a specific region [18]. Moreover, the relevant literature confirms the existence of the above hypothesis based on empirical research and does not include other core factors that determine the firms’ location choice in a unified analysis framework, such as environmental regulation and market potential factors [19].
The current literature on firms’ survival status mainly focuses on foreign competition [20], technological innovation [21], government subsidies [22], and enterprise ownership [23]. There is no doubt that these studies provide useful insights into the reasons for the polluting firms’ survival, but they also ignore the consideration of the relationship between the location choice and survival of polluting firms. Some studies have found that the increases in environmental regulation in provincial central cities will lead to the deterioration of the polluting firms’ living conditions in the “center-periphery” spatial development model under the combined effect of the environmental regulation’s centrifugal force and the market potential’s centripetal force [24]. In other words, the central cities’ market potential will partially offset the negative impact of environmental regulation; there is an inverted U-shaped relationship between the survival of polluting firms and their spatial distance to provincial central cities [25]. Although the relationship between the location choice and survival of polluting firms is further complicated in the context of building regional pollution joint prevention and control mechanisms of urban agglomerations, we still believe that the closer polluting firms are to the central cities, the more likely their survival will be adversely affected by the strengthening of environmental regulations. Considering the impact of central cities’ market potential, the adverse effect may also be nonmonotonic, so we propose the following hypothesis.
Hypothesis (H1): 
Under the influence of environmental regulation in central cities, there is likely to be an inverted U-shaped relationship between the survival of polluting firms and their spatial distance from the central cities.
Hypothesis (H2): 
Increases in the environmental regulation intensity in the central cities of urban agglomerations will have a negative effect on the survival of polluting firms, and the central cities’ market potential will partially offset the negative impact, which is the motivation that leads to the inverted U-shaped relationship.
There are a large number of studies that believe that the heterogeneity of the property rights structure and new entrants have an impact on the relationships between firms’ location choice and survival. Compared with state-owned firms, private firms have a clearer property rights structure and more sufficient market competition. Due to state-owned firms’ property rights characteristics and the soft constraints of the principal-agent, it result in insufficient technical innovation and a lack of competitiveness [26]. Despite the fact that the protection of state-owned firms by local governments will reduce the market share of private firms, private firms also have adaptability and flexibility in their mechanisms, which makes them relocate to a more survivable space in the context of intensifying environmental regulations. Next, incumbents and new entrants are frequently biased in their location choices. Incumbents may have greater transfer costs and constraints than new entrants, and new entrants are actually more productive than incumbents [27]. New entrants are not as competitive as incumbents, and they more likely to exit in response to market-risk shocks [28]. The survival of polluting firms always depends on specific economic and social conditions in the context of increasing environmental regulation. Polluting firms with different property rights or new entrants may have different resource acquisition capabilities and utilization efficiencies, and this leads to another hypothesis:
Hypothesis (H3): 
The inverted U-shaped relationship is more significant for private firms, and it does not necessarily exist for new entrants.
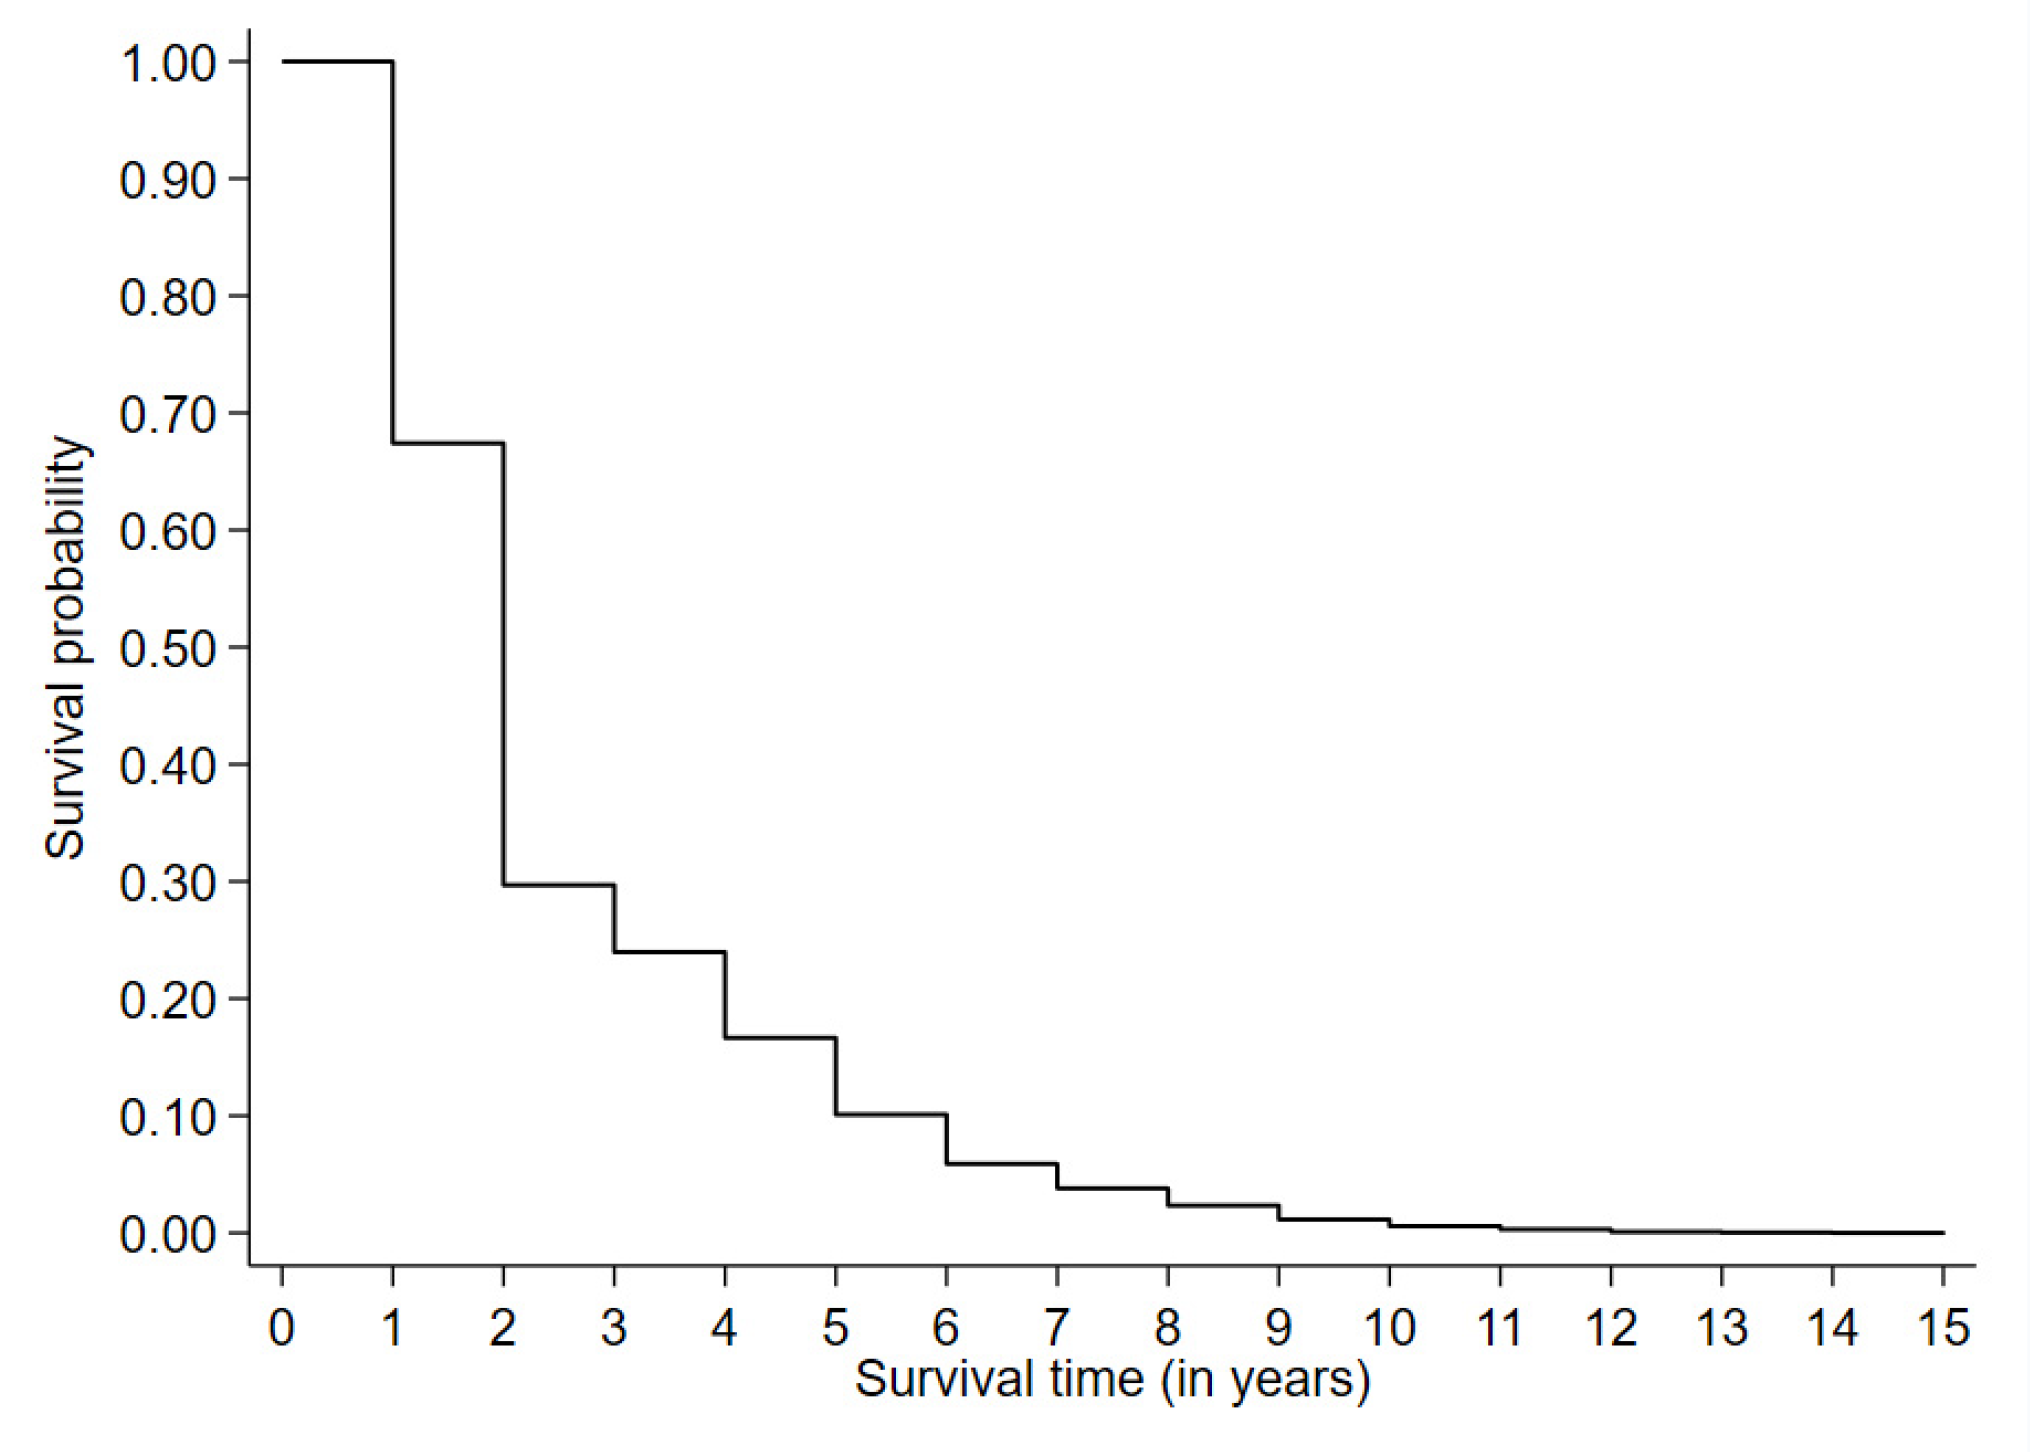
It should be noted that the survival analysis method originated from the field of biology and has now been widely used to study the survival of polluting firms, such as in the accelerated failure time (AFT) model and Cox proportional hazards (Cox PH) model [29,30], but there are still some flaws in the sample selection and data accuracy in actual calculations. First of all, it focuses on new entrants and ignores a large number of incumbent firms when exploring the impact of environmental regulation intensity on firms’ location choice and survival. At the same time, the current research mainly focuses on the entire manufacturing firms and not on polluting firms. Finally, it mainly sets the alternative spaces for firms’ location choice in prefecture-level cities (counties) in existing research, and it can also more accurately reveal the location choice if the specific longitude and latitude information of firms’ locations can be further incorporated into the empirical model.
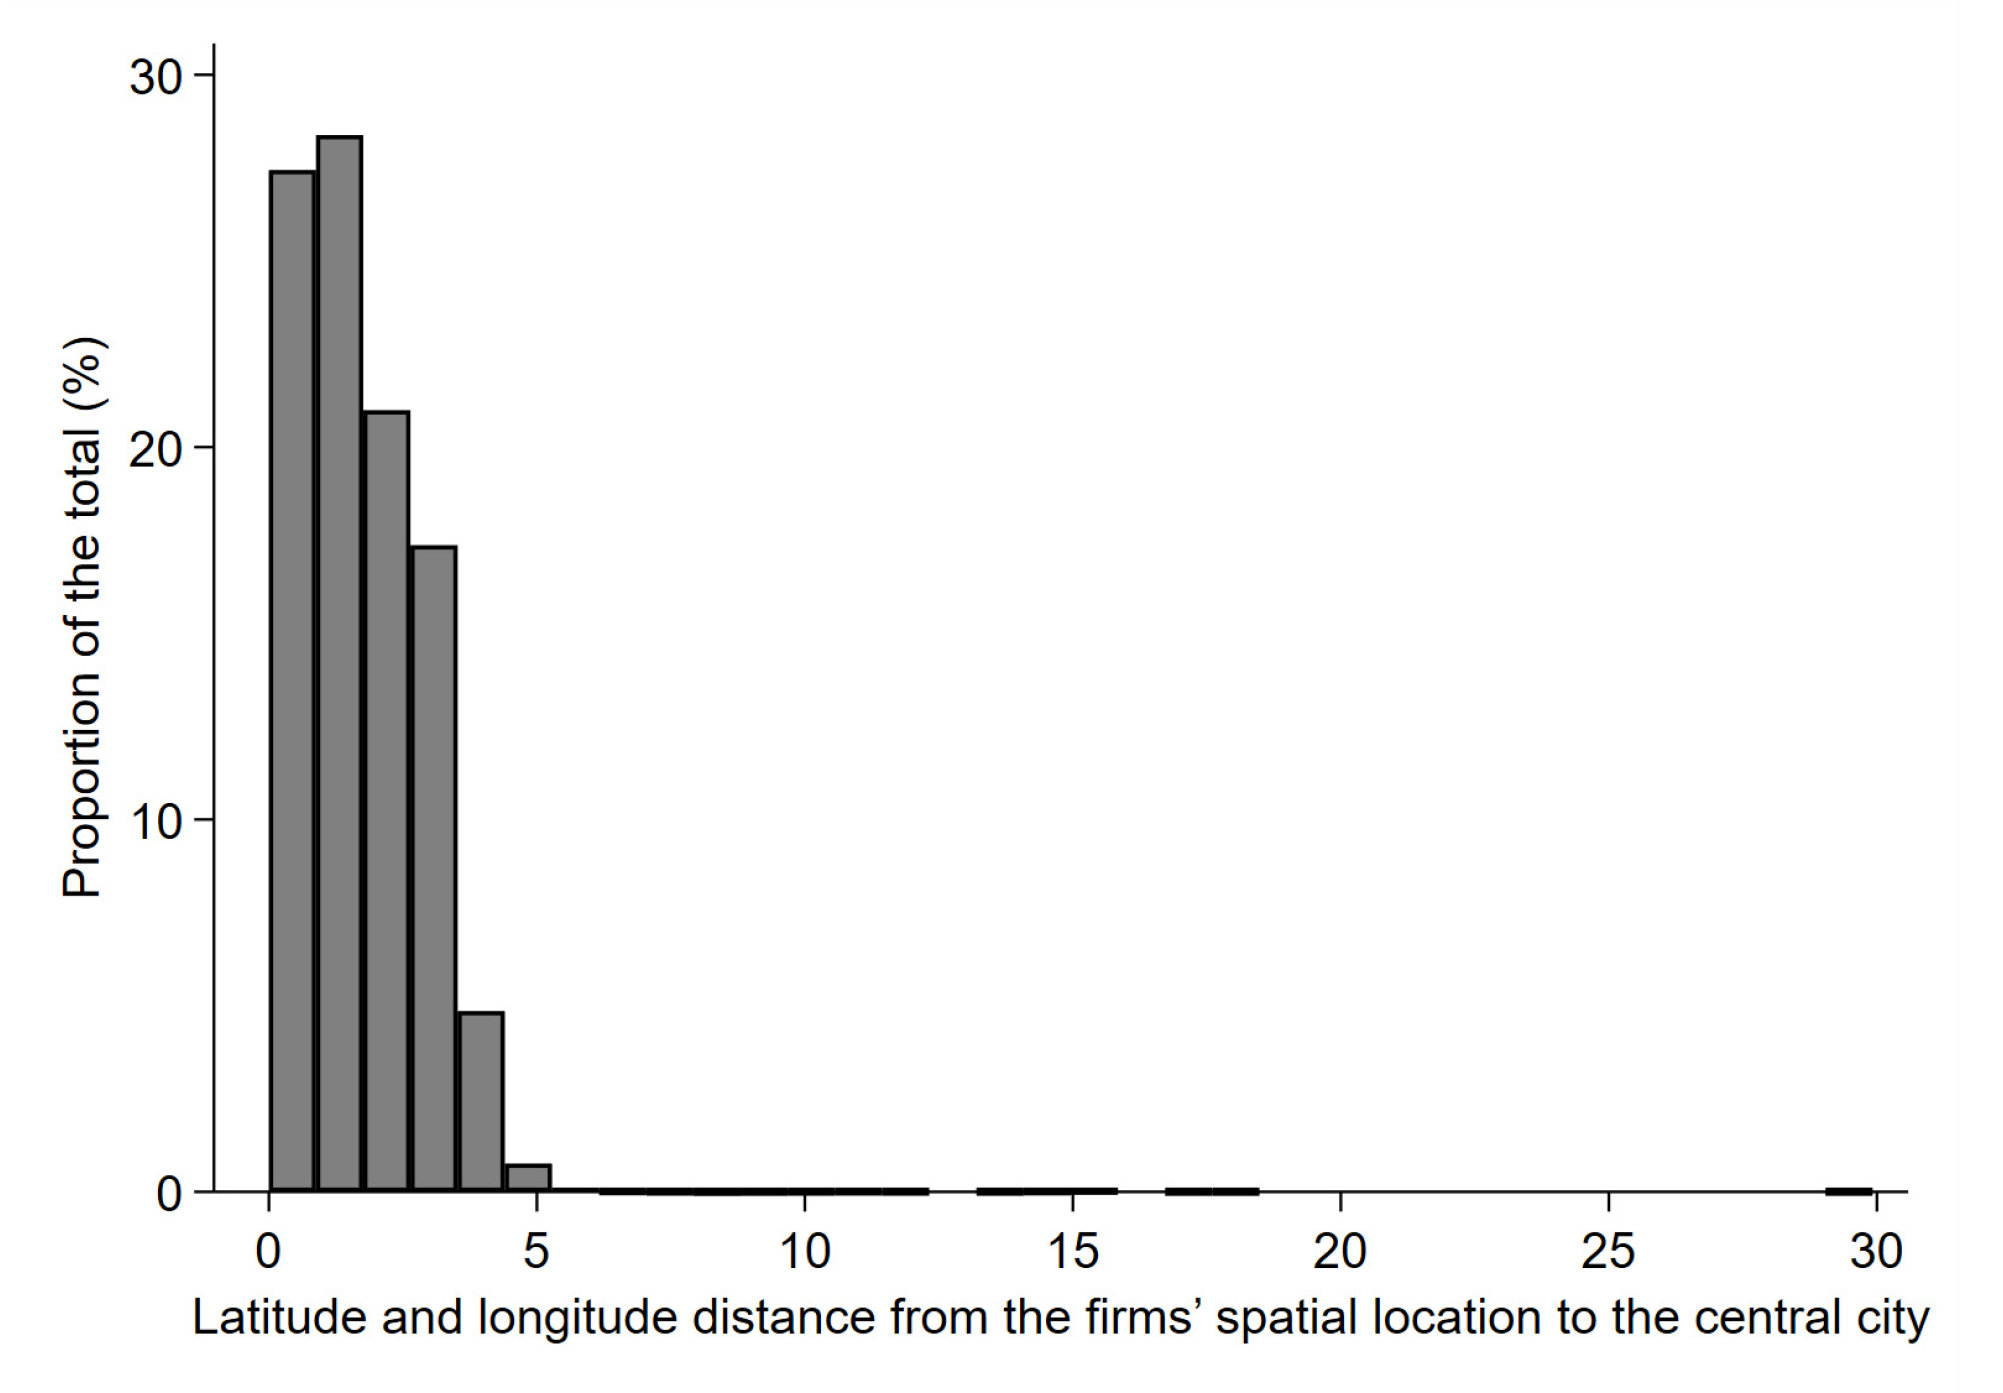
Based on the above analysis, the possible marginal contributions are as follows: (1) By using matching data from the Chinese Industrial Enterprise Database and the Chinese Industrial Enterprise Pollution Emission Database, the research object focused on polluting firms. Meanwhile, this research more accurately depicts the increasing intensity of the environmental regulation in the central cities and its impact on the survival of polluting firms in different locations within urban agglomerations. (2) According to the operating addresses of the sample firms in the matching database, we obtained the longitude and latitude information of all polluting firms’ locations through manual retrieval with the help of a geographic information system (GIS). As the distance from polluting firms to the central cities of urban agglomerations increase, the survival rate of the polluting firms shows a tendency to increase and then decrease. (3) Incorporating environmental regulation variables into the analysis framework, it is further found that the interaction between environmental regulation and market potential is the motivation that leads to the inverted U-shaped relationship, and the heterogeneity of property rights and new entrants is also considered under this framework.
The remainder of this paper is organized as follows. Section 1 introduces the research background and theoretical hypotheses. Section 2 presents the research methodology and data. Section 3 gives the empirical results. Section 4 details the moderating effects and heterogeneity analysis. Discussion of the research themes is offered in Section 5. Section 6 draws conclusions and policy implications.

2. Methods and Data

2.1. Research Sample and Data

The original data are extracted from the matching data from the Chinese Industrial Enterprise Database and the Chinese Industrial Enterprise Pollution Emission Database, while the macro data are extracted from the China City Statistical Yearbook, and the few missing data are filled with the linear interpolation method. The Chinese Industrial Enterprise Pollution Emission Database is compiled by the National Bureau of Statistics on the basis of original data reported by key industrial polluters, which account for more than 85% of the total emissions in each region. The Chinese Industrial Enterprise Database contains all state-owned and private firms with a primary firm income above 5 million CNY. It is worth noting that the data in both databases are currently updated only to 2013. The Chinese Industrial Enterprise Database and the Chinese Industrial Enterprise Pollution Emission Database are matched horizontally and merged vertically according to dimensions such as the legal person code and firm name to obtain the initial sample of polluting firms with information on their operations and pollutant emissions, and the original cross-section data are integrated into unbalanced panel data. Meanwhile, we show the distribution of the sample firms in detail in Table 1. Among them, the Yangtze River Delta urban agglomeration includes 11,022 polluting firms, which accounts for the largest share. In addition, we list only a few industries that account for relatively large numbers of firms, of which the top three belong to the heavy polluting industries. Considering that the location decisions of extractive firms and energy development firms may be constrained by multiple factors, such as resource endowments, these firms are removed and only manufacturing polluting firms are examined, while the 2010 data with significant errors and missing data are also removed.
The threshold standard for industrial firms above the designated size was raised from 5 million to 20 million CNY in annual main business income in 2011, which may cause the survival status of some polluting firms’ that still exist after 2011 to be misjudged as “dead”. In order to maintain the consistency of the sample firms over the examination period, the data for all firms with an annual primary firm income of 20 million CNY or more from 1998 to 2013 were included. Data on industrial firms in 2010 were less utilized due to the lack of critical observations, which we matched and used primarily to identify firm entries and exits, and these observations were omitted from the empirical study. There are data problems, such as missing data and outliers in the Chinese Industrial Enterprise Database. Thus, the sample data were processed before being used to develop the model. First, the sample data with missing or zero values for key indicators were eliminated. Then, partial sample data were eliminated because the firms had fewer than 8 employees or lacked an accounting system. Lastly, the sample data that contradict the accounting rule were removed. In addition, some firms did not continuously appear in the research period due to the influence of statistical caliber, which may affect the accuracy of the survival analysis model, so we deleted such firms.
Due to the unique characteristics of survival data, left- and right-censoring issues must frequently be solved. Given that the sample data range between 1998 and 2013, the growth status of firms founded prior to 1998 is unknown, which is the case with left-censoring. If left-censoring is ignored and 1998 is directly defined as the time when the sample first appeared, this will underestimate the real duration of the firm, so this type of problem needs to be addressed. The sample data comprised firms that opened after 1998, so we take the first full year of survival of the sample firms to be the year after they opened, which is the solution to left-censoring. There is no way to know the survival status of the firms after 2013 when the sample firms appear in 2013, which is the case with right-censoring. Survival analysis models are inherently probabilistic models that may accurately predict changes in individual survival status beyond the sample period, and the selection of specific time points does not have a substantial impact on estimation. Thus, the right-censoring issue can be efficiently resolved. The sample of 31,987 polluting firms was obtained using the treatment above. Figure 1 shows the Kaplan–Meier survival function curve of the sample. We can see the downward trend as time goes by, which means fewer firms can survive with the extension of the research time. The average lifespan of the sample firms is about 2.57 years, and more than 80% of firms will exit within 4 years after establishment.
National-level urban agglomerations are the most developed regions in China and have a clear planning scheme. It is easier to select the central and peripheral cities more accurately and to precisely limit the regional scope of this study. Moreover, it is easier to reflect the comprehensive impact of the environmental regulation intensity of the central cities on the location choice of polluting firms. Meanwhile, regulation and policy mechanisms can have an impact on the development of local industries [31]. The State Council has approved 11 national-level urban agglomerations and they are used as the scope of this paper. Specifically, they are the Beijing–Tianjin–Hebei, Yangtze River Delta, Pearl River Delta, Yangtze River Middle Reaches, Chengdu–Chongqing, Guanzhong Plain, Central Plains, Harbin–Changchun, Lanzhou–Xining, Beibu Gulf, and Hohhot–Baotou–Ordos–Yulin urban agglomerations, which can comprehensively reflect the close connection between the central cities and peripheral cities.

2.2. Variable Selection

1. The spatial distance from the location of the sample firm to the central cities. Using the methodology of Sun and Liang, we create one proxy variable for the spatial distance [32]. Firstly, the particular latitude and longitude position Zk (z1k, z2k) of the sample firms are determined manually, where z1k represents the sample firms’ longitude and z2k represents their latitude. Secondly, Beijing, Shanghai, Guangzhou, Chongqing, Xi’an, Wuhan, Zhengzhou, Harbin, Lanzhou, Hohhot, and Nanning are defined as the central cities of each urban agglomeration based on the urban agglomeration development planning issued by the National Development and Reform Commission. Thirdly, the matching latitude and longitude positions Zj (z1j, z2j) of the central cities are obtained through a manual search, where z1j signifies the longitude and z2j means the latitude. Finally, the spatial latitude and longitude values are derived via the calculation of
H kj = ( z 1 k z 1 j ) 2 + ( z 2 k z 2 j ) 2 .
As shown in Figure 2, we found that 89.93% of the sample firms are densely distributed within 320 km of the central cities. On the one hand, polluting firms did not choose to concentrate on setting up factories in the central cities. On the other hand, polluting firms chose to locate not too far from the central cities even under the constraints of the environmental regulation in the central cities, which shows that polluting firms may still be positively affected by the market potential of the central cities. However, the specific relationship between the location and survival of polluting firms needs further discussion, and the survival analysis model will be used to explain this in detail below.
2. Environmental regulation intensity in the central cities. This indicator is measured in several ways. Firstly, it can be measured with the systematic environment-pollution-related word frequency analysis of city government work reports [33]. It can also be measured using the pollutant removal rate or discharge compliance rate [34] and the amount of investment in industrial pollution treatment [35]. We use the amount of investment in industrial pollution treatment as the proxy variable for the environmental regulation intensity (PGIj) in the central cities, considering the indicator on the effect side is prone to association bias with the survival or exit of polluting firms. The data of the investment amount for industrial pollution treatment is derived from the China Environmental Statistical Yearbook, and the data for some cities are missing from 2011 to 2013. For the missing values, we use the linear interpolation method to supplement. We assume it is inversely proportional to the extent to which polluting firms are affected by the environmental regulation of central cities and their spatial distance from the central cities. For sample firms located at spatial location k within urban agglomeration d, the impact of environmental regulation in the central city j at time point t is as follows:
r e g d k t = l n P G I d j t   /   H d k j
where regdkt represents the effect of environmental regulation in the central city at time t on sample firms at spatial location k within urban agglomeration d; PGIdjt represents the amount of investment in industrial pollution control in central city j at time t for urban agglomeration d; and Hdkj represents the spatial longitude and latitude value from sample firms at spatial location k within urban agglomeration d for the distance to the central city j.
3. Market potential of the central cities. In order to more accurately reveal the direct impact of the market potential of the central cities on the survival status of polluting firms, we describe it using the method as follows [36]:
p o t d k t = l n G D P d j t   /   H d k j
where potdkt is the market potential of the central cities influenced by the sample firms at spatial location k within urban agglomeration d at time t; GDPdjt is the GDP of central city j of urban agglomeration d at time t; and Hdkj is the longitude and latitude value from the sample firms at spatial location k of urban agglomeration d for the distance to the central city j.
Equation (2) is more suitable for revealing the economic motivation behind the location and the survival status of polluting firms in the relatively independent geographical spatial dimension. However, firms’ product demand is not only influenced by the market demand within urban agglomeration in reality but also by the market demand across urban agglomerations. We establish the following proxies for the degree of the market potential’s influence [37]:
p o t d k t = p o t d k t + p o t ( d ) k t = l n G D P d j t H d k j + l n G D P ( d ) j t H ( d ) k j
where p o t ( d ) k t reflects the impact of market demand in the central cities of other urban agglomerations on the sample firms located in d urban agglomeration.
4. Control variables. We set a number of control variables in terms of both individual firm and regional attributes, where individual firm attributes include the firm ownership structure [23], firm export behavior [38], firm production efficiency [39], firm wage burden [40], firm overcapacity [41], firm pollution emissions [42], and firm financing constraints [43]. We describe the nature of firm ownership with state-owned firms represented by 1 and private firms represented by 0 (ownership). The nature of the export (export) is expressed as an export firm with an export delivery value greater than 0 in the current year, with a value of 1 and 0 for other firms. According to Zhang and Ye, we use the SBM directional distance function to measure firms’ production efficiency (tfp), which requires inputs and outputs to be predefined. We establish the number of employees and total assets as inputs, while the total industrial output value and pollutant emissions are used as outputs [44]. The proportions of corporate wages and welfare expenses in the main business income are used to measure the corporate wage burden (burden). Firm overcapacity (density) is mostly caused by excessive capital intensity, so it is measured by the total fixed assets per employee of the firm. We use the arithmetic mean of the main industrial exhaust gas pollutants to measure firms’ pollutant emissions (poll), considering the exhaust gas data are more complete than other pollutants during the sample period. It goes without saying that increased emissions of pollutants have an impact on the environment [45]. The asset–liability ratio (leverage) is used to measure the financing constraints of the firm.
In terms of regional attributes, the processed ratio of the total retail sales of social consumer goods to GDP is used to indirectly measure the market integration index of the urban agglomeration (integ). Given that the survival status of polluting firms is closely related to the changes in the secondary industry, we also use the added value of the secondary industry in each urban agglomeration (structure) as the region control variable. Table 2 shows the statistical characteristics of core variables. We found that the correlation coefficient between any two variables does not exceed 0.4 with a correlation test, indicating that there is no serious problem of multicollinearity between the variables. In addition, we also used the Variance Inflation Factor (VIF) to analyze the multicollinearity of explanatory variables and found that the VIF values were all less than 5, which verified that there was no serious multicollinearity problem among the variables. Meanwhile, the skewness and kurtosis calculations showed that the original data for most of the variables did not conform to the normal distribution.

2.3. Benchmark Models

After decades of exploration, scholars began to widely use the survival analysis method to examine the factors that endanger the survival of firms. In the methods of analyzing firms’ survival, the risk function is commonly used to describe the firms’ survival risk. The Cox proportional hazards model and the accelerated failure time (AFT) model are the two most common continuous time survival models. The Cox proportional hazards model effectively avoids any interference in estimation results caused by the incorrect shape of the risk function and it is popular in survival analysis. Potential risk factors can affect the survival of the individual [46]. In order to conduct the Cox proportional hazards analysis, the proportional risk assumption must be met, which means the risk functions of the various types of covariates must fluctuate in a constant proportion across time. Based on the test method of Schoenfeld residuals, we found the probability values of the Schoenfeld residuals for the spatial distance to the central cities with the location of the firms, and their quadratic terms were 0.007 and 0.081, which violates the proportional hazards assumption. In other words, the preconditions for using the Cox proportional hazards model were not met. In addition, the AFT model is an efficient parametric model that directly estimates the influence of risk factors on survival time. The advantage of the AFT model is that it makes it easy to understand the factors affecting the survival of the firm. The estimated coefficients of each variable represent the impact of each factor on the firm’s survival, with coefficients greater than 0 indicating that the factor delays the firm’s exit and coefficients less than 0 indicating that the factor accelerates the firm’s exit. The AFT model is ultimately selected as the benchmark model. Equation (4) depicts the basic structure of the model, which permits the construction of a linear model, as shown in Equations (5) and (6).
Y = l n T = υ x + z
T = e υ x + z = e υ x × e z
e z = T × e υ x
where T denotes the survival duration time; x is the set of factors affecting the firm survival time; υ is the parameter to be estimated; z denotes the error term and different distribution patterns of the error term determining different regression models. The effect of the AFT model depends on the degree of e υ x change in the survival time T. If e υ x is greater than 1, it means the survival time is accelerated and the firm’s survival status deteriorates when υ x < 0. If e υ x is less than 1, it means the survival time is decelerated and the firm’s survival status improves when υ x > 0. The following econometric model is built to study the relationship between the location of polluting firms and the change in their survival status.
l n T d k = α 0 + α 1 H d k j + α 2 H d k j 2 + α δ C V d k t δ + ε d k t + μ r e g i o n , i n d u s t r y
where Tdk represents the survival time of the polluting firm located at spatial location k in urban agglomeration d, and H d k j represents the spatial distance between the location of the firms and the central city. To determine whether the influence of the polluting firm’s location on survival is nonlinear, the squared term of the geographical distance is also incorporated into the model. C V d k t δ is the δ th control variable at time t, while ε d k t is a random disturbance term. μ r e g i o n , i n d u s t r y represents regional and industry fixed effects. In order to control the possible impact of industry characteristics on the estimation, it generates industry dummy variables according to the two-digit industry codes. At the same time, we also control the regional fixed effects in order to control the inherent differences in socioeconomics among different urban agglomerations.
We also examine the potential motivation of the relationship between the location of polluting firms and their survival status using the following formula:
l n T d k = β 0 + β 1 r e g d k t + β 2 p o t d k t + β 3 r e g d k t × p o t d k t + β δ C V d k t δ + φ d k t + μ r e g i o n , i n d u s t r y
where Tdk denotes the survival time of the polluting firm located at spatial location k in urban agglomeration d; r e g d k t denotes the effect of the central city’s environmental regulation on the polluting firms’ survival status; p o t d k t denotes the effect of the central city’s market potential on the polluting firms’ survival status; r e g d k t × p o t d k t represents the interaction between the central city’s environmental regulation and market potential; C V d k t δ indicates the δ th control variable for the firm at time point t; φ d k t is a random perturbation term; and μ r e g i o n , i n d u s t r y means the regional and industry fixed effects.

3. Empirical Results

3.1. Baseline Results

We control both industry and regional fixed effects for the inherent disparities in sociolect–economic existence among urban agglomerations. Common error term distributions in the AFT model include the Exponential, Weibull, and Lognormal distributions. In determining the proper distribution form, it is typically required to refer to the log likelihood and the Akaike Information Criterion (AIC) value derived from various distribution forms in the AFT model. If the log likelihood is greater and the AIC value is smaller, then the distribution is optimal. Table 3 demonstrates that the Lognormal distribution provides the best performance, so it is used as the baseline regression distribution form in the following analysis.
In accordance with Hypothesis (H1), we conducted regressions by adding the spatial distance variable and its quadratic term. Table 3 presents the regression results for the Exponential, Weibull, and Lognormal distributions in columns (1), (2), and (3), respectively. Regardless of the distribution chosen, the estimated coefficients of the primary term of the spatial distance are significantly positive, and the corresponding quadratic components are significant negative. That means the influence of location choice on survival exhibits a clear inverted U-shaped distribution, and Hypothesis (H1) is validated.
Some of the control variables are consistent with common sense. Rising wages are not conducive to alleviating the survival pressure of the polluting firms while the excessively high asset–liability ratio increases the exit risk of firms to a certain extent. This confirms that maintaining micro-financial health is conducive to realizing the sustainable and healthy development of firms [38]. Also, digital finance has its own regulatory risks, and its integration with the tourism industry requires caution. Contrary to common sense, the results found that the productivity efficiency of firms is significantly negative, indicating that the increase in the intensity of environmental regulation by local governments has not eliminated inefficient firms from the market. The reason is likely to be that there are “non-market” factors to maintain the survival of low-efficiency firms through continuous external support [47]. The results of capital intensity are nonsignificant. And the results of ownership are considerably positive, indicating that state-owned firms have a lower exit risk than private firms. Based on the regression results of export, we found export-oriented firms are relatively well adapted to survive. This is probably because export-oriented firms can gain access to advanced technology and management practices, so upgrading technology is conducive to easing the pressure on the survival of polluting firms [48]. Increased levels of market integration can significantly reduce the survival pressure on polluting firms, perhaps because the strengthening of economic ties can facilitate capital inflows and factor outflows from newcomer cities. To a large extent, this capital inflow is the result of the low-quality economy of overcapacity in the central cities. The polluting firms may be relocating to the new cities because they were previously evicted for failing to meet the environmental standards of the original cities. In the Lognormal distribution, the regression coefficient of the secondary industry in urban agglomeration is notably positive, which shows that it can reduce the pressure on polluting firms to survive when the proportion of the secondary industry is greater.

3.2. Motivation Analysis of the Relationship between the Location and Survival of Polluting Firms

Due to concerns about possible co-linearity between the level of economic development and the intensity of environmental regulation in the central cities, we decentralize the two variables. To account for the inherent socioeconomic inequalities among urban agglomerations, we still control industry and regional fixed effects. In columns (1), (3), and (5) of Table 4, we can find the results of the impact of the environmental regulation of the central cities on polluting firms’ survival status separately. In columns (2), (4), and (6), the results are all significantly negative, no matter which kind of cumulative probability distribution the hypothetical model obeys, which shows the negative impact of environmental regulations on firms’ survival can be reversed as the market potential of the central cities increases. Hypothesis (H2) is confirmed.

3.3. Robustness

3.3.1. Testing for Omitted Variables Bias

Theoretically, both the environmental regulation and market potential in the central cities are macroeconomic factors that have no linkage bias with firms’ survival status. In order to rule out inconsistent estimation results resulting from the omission of crucial individual heterogeneity variables throughout the regression process, we address the omission problem with the IV-2SLS method and the introduction of nonobservable heterogeneity.
Firstly, the key findings are retested using the IV-2SLS method, by estimating the current period variables using the first-order lag term of the core explanatory variables in the first step and regressing the firm survival time using the predicted values from the first step regression [49,50]. As shown in columns (1) and (2) of Table 5, the estimated coefficient of environmental regulation is significantly negative. Secondly, nonobservable heterogeneity is immediately incorporated into the regression process of the survival analysis model under the assumption that nonobservable heterogeneity follows the Gamma distribution. The results indicate that the probability value of the variance in individual heterogeneity is zero and refute the original assumption of no heterogeneity. However, as shown in columns (3) and (4), the possible omission of individual heterogeneity does not significantly alter the main findings of the original estimates. Hypothesis (H2) remains valid.

3.3.2. Other Robustness Tests

This part will test the robustness of the results from the replacement of the survival analysis model, the sample, and the core variables.
Firstly, the Cox proportional hazards model was used. Although the baseline model did not pass the Schoenfeld residual test that the individual risk ratio does not change over time, we still use the Cox proportional hazards model to estimate the sample again, considering that the Cox model does not make any restrictive assumptions on the distribution of the baseline risk. It needs to be further explained that the AFT model explains the survival probability, while the Cox model explains the failure probability, so the direction of action of the two models is opposite. Columns (1) and (2) of Table 6 give the estimated results of the Cox model, which show that the main conclusion of the inverted U-shaped relationship between the firms’ location and their survival remains unchanged.
Secondly, we eliminate polycentric urban agglomerations. The Yangtze River Delta, Pearl River Delta, Chengdu–Chongqing, and Harbin–Changchun urban agglomerations have obvious polycentric spatial structure characteristics [51,52]. Considering that polycentric structures can break the assumption of monocentric structures of the traditional “central-periphery” spatial model, the four urban agglomerations are excluded from the sample and the original results of key findings are not changed from column (3) and (4) of Table 6.
Finally, we make substitutions for two key variables, which are the distance from the firm to the central cities and the environmental regulation intensity. Considering that we focus on urban agglomerations as the independent geographical space, the spatial scale is relatively large, and the difference in spherical distances on the same longitude caused by different latitudes cannot be ignored. Thus, the spherical distance between the two places is computed using latitude and longitude data and the geodist command of the Stata16.0 software, which serves as the proxy variable for the geographical distance between the location of the sample firms and the central cities. We reconstruct the environmental regulation intensity indicator with the following specific construction steps [33]: (1) the annual government work reports of the central cities are manually collected; (2) we process the text of the government’s work reports using word segmentation; (3) the frequency of environment-related words is counted, and their proportion to the total word frequency of the government’s work reports is calculated; (4) the environmental regulation intensity indicator is reconstructed. We selected the specific environment-related words, which include not only specific pollutants such as sulfur dioxide, carbon dioxide, PM10, and PM2.5 but also environmental protection behaviors, such as environmental protection, emission reduction, etc. Due to the difficulty of data collection and compilation, it should be emphasized that the environmental word frequency data we collected ranged from 2000 to 2013, with the few missing values supplemented with the linear interpolation method. The results in columns (5) and (6) suggest that the main results remain generally stable when the core variables are substituted. Consequently, both the estimates of the shape of the relationship between firms’ location choice and survival and the interpretation of its drivers are basically consistent with the previous results, indicating that the results of the previous analysis are robust. Hypotheses (H1) and (H2) are validated.

4. Moderating Effects and Heterogeneity Analysis

4.1. Tests for the Moderating Effects of Market Potential

The firms’ actual product demand is more likely to be affected by the dual effects of both intra-urban agglomeration and cross-urban agglomeration markets, so it is important to employ Equations (3) and (8) once more to assess the potential moderating influence of market potential [53]. Although this treatment departs from the assumptions of the monocentric theory, the findings are closer to the economic reality after taking the cross-urban agglomeration market demand into account. Table 7 indicates that an increased market potential has a negative impact on the overall survival of polluting firms due to the polycentric effect. Since places with a high market potential are usually economically developed areas, the operating costs faced by firms are higher and the risk of exit is higher [36]. Even taking into account the cross-urban agglomeration factor, the increase in market potential can still alleviate the survival pressure brought by the urban environmental regulation of the central cities.

4.2. Analysis of Heterogeneity of Property Rights and New Entrants

4.2.1. Property Rights Heterogeneity

According to the ownership of firms, we divide the sample into state-owned firms and private firms and estimate them separately. Columns (1) and (3) of Table 8 show the impact of location choice on the survival rates of state-owned firms and private firms, respectively. The impact of location on the survival of private firms is obviously in the inverted U-shaped distribution, while the location of state-owned firms has no significant impact on the survival. From columns (2) and (4), the impact of environmental regulation on the survival of state-owned firms and private firms is significantly negative, and the offsetting effect of the market potential of the central cities is only significant for private firms. Hypothesis (H3) is still validated.

4.2.2. Heterogeneity of New Entrants

We categorize the sample based on whether the firm is a new entrant, assigning a value of 1 to ent when the firm is a new entrant and 0 otherwise [28]. The specific results are reported in columns (1) and (2) of Table 9. Specifically, we define the firm as a “new entrant” when it first appears in the current year and as an “existing firm” in the following year if it is still in existence. It can be found that the location of new entrants has a significantly positive impact on the survival in column (1). The farther the new entrants are located from the central cities, the more conducive it is to alleviate the survival pressure of firms. According to column (2), the impact of the environmental regulation of the central cities on the survival of new entrants is significantly negative, but it is not significant when the market potential offsets the negative impact of environmental regulation. Compared with incumbent firms, environmental regulations have a greater inhibitory effect on the survival of new entrants. Hypothesis (H3) is confirmed.

5. Discussion

In recent years, regional economic plans, such as the “Beijing-Tianjin-Hebei Coordinated Development Plan” and the “Yangtze River Economic Belt Development Plan”, have focused on environmental pollution joint prevention and control mechanisms, which are placed in a prominent position in the regional economic coordinated development strategy. However, they are still an important issue that needs to be faced to promote the construction of ecological civilization through institutional and mechanism innovation, along with the question of how to avoid focusing on norms and ignoring implementation and form a multiparty joint governance force between local governments in different regions on a practical level. There are currently relatively few studies on the location and survival of polluting firms in regards to increases in the environmental regulation intensity in central cities within urban agglomerations. The results of this paper not only provide new insights into the impact of environmental regulations on the location choice and survival of firms but also provide valuable insights for urban agglomeration planning.
At present, the literature mainly focuses on the relationship between environmental regulations and the location choice of polluting firms. There are few studies that have combined environmental regulation with the survival of polluting firms, and there are insufficient attentions to the survival methods of polluting firms with the change in location choice between central cities and periphery cities within a specific region. This paper further broadens the perspective of empirical research on the survival of polluting firms. In addition, polluting firms are different from ordinary firms; that is to say, the best location choice for the better survival of polluting firms can be investigated under the combined effect of the centrifugal force of environmental regulations and the centripetal force of market potential, by incorporating the core factors that determine the location of firms into a unified analysis framework, such as environmental regulation factors and market potential.
In order to ensure the sustainability, fairness, and openness of the collaborative governance between central cities and peripheral cities within urban agglomerations, it should be strengthened with vertical management in environmental protection and governance from a central government, which could reduce the incoordination of environmental regulations by local governments based on their own interests. It should also establish normalized collaboration mechanisms, such as a pollution prevention and control leading group to coordinate from a higher level, which could promote collaboration to a greater extent, integrate and optimize cooperation between relevant governments, and achieve regional collaboration goals. Finally, it could improve the effectiveness of law enforcement and supervision through the latest scientific and technological means, such as the digital supervision of pollution sources during the collaboration process.
The long-term effects of environmental regulation on the survival of polluting firms and the likelihood of transition to clean practices should be emphasized. The above results show that polluting firms can survive better in the middle position of the center–periphery spatial structure under the interaction between environmental regulation and market potential. The location choice of polluting firms is the result of individual rational choices based on self-interest considerations. Environmental governance coordination could be ultimately achieved through economic development synergy and support clean development by increasing the trickle-down nature of economic development dividends in central cities and the spillover nature of economic structural transformation, narrowing the development level and economic structure gap between central cities and periphery cities and reducing the over-reliance on highly polluting industries in the economic development process of peripheral cities.
The ecological and green development of urban agglomerations in Western countries is mainly achieved through strict legislation, industrial structure upgrades, and regional coordinated governance. For example, urban agglomerations in central and southern England use planning legislation to control ecological space. The Great Lakes urban agglomeration in North America has achieved joint regional environmental governance cooperation between the United States and Canada, and it has also established a special coordination and supervision agency to promote environmental governance. Therefore, enhancing the coordination of environmental regulation policies among cities is particularly important for the environmental governance of urban agglomerations, which is also of reference significance for the regional collaborative governance of urban agglomerations in other countries.

6. Conclusions and Policy Implications

Based on the current environmental pollution problems brought about by the development of urban agglomerations in China, the relationship between the location and survival of polluting firms becomes more important when a large number of polluting industries appear to transfer from concentration to divergence. Using the data of 31,987 polluting firms in 11 national-level urban agglomerations in China from 1998 to 2013 under the central–periphery spatial structure, we examine the impact of polluting firms’ location choice on their survival with the survival analysis method and found the following: (1) Under the influence of environmental regulation in central cities, there is an inverted U-shaped relationship between polluting firms’ survival and their spatial distance to central cities. (2) Increases in environmental regulation intensity in the central cities will have a negative effect on the survival of polluting firms, and the positive effect of market potential on the survival of the firms will be relatively limited if the location is too far from the central cities.
Therefore, polluting firms can survive better in the middle position of the center–periphery spatial structure under the interaction between environmental regulation and market potential. (3) The inverted U-shaped relationship is more significant for private firms, and it does not necessarily exist for new entrants.
The above findings bring a lot of important enlightenments. First of all, it is necessary to continue to deepen the joint prevention and control mechanism of regional pollution and enhance the coordination of environmental regulation policies between the central cities and peripheral cities. For a long time, most of the local governments have focused on the central cities, while the regulation of the surrounding cities is obviously weaker than the central cities. Although a series of measures have been taken to increase the intensity of environmental regulation, such as raising environmental protection standards and shutting down relocated polluting firms, the actual effect of governance does not seem to be significant. The reason is that the exit speed of polluting firms in the periphery cities obviously lags behind the central cities, which leads to the asynchronous progress of emission reduction among cities in the region. This further shows that the central cities should play a synergistic and exemplary role, and the peripheral cities should also benchmark the R&D investment and environmental regulations of the central cities. It is difficult for the above measures to achieve results through the actions of a single city; all cities must participate in joint prevention and control mechanisms to solve the problem. The construction of urban agglomerations should coordinate the environmental regulation policies between cities, and the problem of industrial pollution can be fundamentally rectified.
Second, we must pay attention to the spatial reshaping effect of environmental regulation intensity on the economic spatial distribution pattern. Under the central–periphery spatial structure, the lag in the exit progress of polluting firms may aggravate the duality of the central–periphery economy. In order to prevent relatively underdeveloped areas from become environmental sanctuaries, it is necessary not only to examine the effects of pollution control and emission reduction policy but also to pay attention to their reshaping of the regional economy. To formulate more diversified and combined guiding policies between central and peripheral cities, as well as between environmental regulation and economic transformation policy effects, it is important to strengthen industrial cooperation and to form a situation of “you’re a part of me, I’m a part of you”, thereby achieving the Pareto improvement of the environment.
Finally, the heterogeneity of the property rights structure and new entrants should be fully considered when governments formulate environmental regulation policies. Private firms are more sensitive to changes in environmental regulation intensity; they may choose to locate in peripheral cities where they can obtain more living space. Therefore, it is necessary to suppress the accompanying effects of pollution through precise policies and strengthen the production supervision of private firms, which can standardize the clean production and operation of firms. In the face of environmental regulatory constraints, new entrants are more likely to exit the market. Therefore, local governments must strictly control the tangible “helping hand” while improving the coordination of environmental regulation policies. Only in this way can polluting firms be forced to improve living conditions through pollution control and emission reduction.
The limitations of this paper are the following points. First of all, we mainly focus on the spatial geographical characteristics of economic activities when exploring the relationship between the spatial distance of polluting firms from central cities, environmental regulations, and the survival time at the regional level. In future research, we can try to set the research perspective at the industry level and focus on the connections between organizational factors, which could provide more complete reference suggestions for the government to adjust environmental regulation policies in a targeted manner. Secondly, we only observed the relationship between the location choice and survival status of polluting firms from 1998 to 2013. As the database is updated, it is still necessary to estimate more carefully the relationship between the location choice and survival status of polluting firms in recent years. Finally, we can further examine the influence of changes in the production efficiency of polluting firms in different locations on their survival according to the Porter hypothesis.

Author Contributions

Conceptualization, Z.L. and Z.Z.; methodology, Z.L. and S.Z.; visualization, S.Z.; validation, Z.L. and S.Z.; writing—original draft, Z.L. and S.Z.; resources, Z.L. and Z.Z.; data curation, Z.Z. and S.Z.; formal analysis, Z.L. and S.Z.; supervision, Z.Z.; writing—review and editing, S.Z. and Z.Z. All authors have read and agreed to the published version of the manuscript.

Funding

This work was financially supported by the National Natural Science Foundation of China (Grant numbers 72074175, 72174071, and 71774066).

Institutional Review Board Statement

Not applicable.

Informed Consent Statement

Not applicable.

Data Availability Statement

Data will be made available on request.

Conflicts of Interest

The authors declare that the research was conducted in the absence of any commercial or financial relationships that could be construed as potential conflicts of interest.

References

  1. Fang, C. Important progress and future direction of studies on China’s urban agglomerations. J. Geogr. Sci. 2015, 25, 1003–1024. [Google Scholar] [CrossRef]
  2. Dai, Q.; Yang, J.; Zhang, X.; Hu, S. Transfer characteristics, patterns and mechanisms of polluting enterprises and industries. Geogr. Res. 2020, 39, 1511–1533. [Google Scholar] [CrossRef]
  3. Condliffe, S.; Morgan, O.A. The effects of air quality regulations on the location decisions of pollution-intensive manufacturing plants. J. Regul. Econ. 2009, 36, 83–93. [Google Scholar] [CrossRef]
  4. Shen, J.; Liu, W.; Wei, Y.D. The Impact of Environmental Regulation on the Spatial Pattern Evolution of Pollution-intensive Enterprises in Foshan City: An Empirical Study Based on 2004 to 2013 Economic Census Data. Sci. Geogr. Sin. 2019, 39, 1972–1981. [Google Scholar] [CrossRef]
  5. Petrakis, E.; Xepapadeas, A. Location decisions of a polluting firm and the time consistency of environmental policy. Resour. Energy Econ. 2003, 25, 197–214. [Google Scholar] [CrossRef]
  6. Fujita, M.; Thisse, J.-F. Economics of Agglomeration: Cities, Industrial Location, and Regional Growth; Cambridge University Press: Cambridge, UK, 2002. [Google Scholar]
  7. Martin, R.; Sunley, P. Paul Krugman’s Geographical Economics and Its Implications for Regional Development Theory: A Critical Assessment. Econ. Geogr. 1996, 72, 259–292. [Google Scholar] [CrossRef]
  8. Jedwab, R.; Kerby, E.; Moradi, A. History, Path Dependence and Development: Evidence from Colonial Railways, Settlers and Cities in Kenya. Econ. J. 2017, 127, 1467–1494. [Google Scholar] [CrossRef]
  9. Cai, H.; Zhong, C.; Han, J. Upgrade of Transportation Infrastructure and Location Selection of Polluting Enterprises. China Ind. Econ. 2021, 10, 136–155. [Google Scholar] [CrossRef]
  10. Becker, R.; Henderson, V. Effects of Air Quality Regulations on Polluting Industries. J. Political Econ. 2000, 108, 379–421. [Google Scholar] [CrossRef]
  11. Walter, I.; Ugelow, J. Environmental policies in developing countries. AMBIO 1979, 8, 102–108. [Google Scholar]
  12. Porter, M.E.; van der Linde, C. Toward a New Conception of the Environment-Competitiveness Relationship. J. Econ. Perspect. 1995, 9, 97–118. [Google Scholar] [CrossRef]
  13. Böhringer, C.; Balistreri, E.J.; Rutherford, T.F. The role of border carbon adjustment in unilateral climate policy: Overview of an Energy Modeling Forum study (EMF 29). Energy Econ. 2012, 34, S97–S110. [Google Scholar] [CrossRef]
  14. Cai, H.; Chen, Y.; Gong, Q. Polluting thy neighbor: Unintended consequences of China’s pollution reduction mandates. J. Environ. Econ. Manag. 2016, 76, 86–104. [Google Scholar] [CrossRef]
  15. Wu, H.; Guo, H.; Zhang, B.; Bu, M. Westward movement of new polluting firms in China: Pollution reduction mandates and location choice. J. Comp. Econ. 2017, 45, 119–138. [Google Scholar] [CrossRef]
  16. Tang, C.; Dou, J. The Impact of Heterogeneous Environmental Regulations on Location Choices of Pollution-Intensive Firms in China. Front. Environ. Sci. 2021, 9, 799449. [Google Scholar] [CrossRef]
  17. Peng, N.; Zhang, X. The impact of environmental regulations on the location choice of newly built polluting firms: Based on the perspective of new economic geography. Environ. Sci. Pollut. Res. 2022, 29, 59802–59815. [Google Scholar] [CrossRef]
  18. Cai, H.; Han, J.; Zhong, T. The Emission Reduction Effect of Firm Relocation—With Discussions on the Pollution Heaven Hypothesis and Porter Hypothesis. Econ. Perspect. 2022, 11, 90–106. [Google Scholar]
  19. Howell, A. Picking ‘winners’ in space: Impact of spatial targeting on firm performance in China. J. Reg. Sci. 2020, 60, 1025–1046. [Google Scholar] [CrossRef]
  20. Wang, Y. Exposure to FDI and new plant survival: Evidence in Canada. Can. J. Econ. 2013, 46, 46–77. [Google Scholar] [CrossRef]
  21. Zhang, D.; Zheng, W.; Ning, L. Does innovation facilitate firm survival? Evidence from Chinese high-tech firms. Econ. Model. 2018, 75, 458–468. [Google Scholar] [CrossRef]
  22. Zhang, D.; Xu, G. Does Government Subsidy Affect Firm Survival? Evidence from Chinese Manufacturing Firms. Emerg. Mark. Financ. Trade 2019, 55, 2628–2651. [Google Scholar] [CrossRef]
  23. Ferragina, A.M.; Mazzotta, F. FDI spillovers on firm survival in Italy: Absorptive capacity matters! J. Technol. Transf. 2014, 39, 859–897. [Google Scholar] [CrossRef]
  24. Xu, Z.; Liu, C. Grey-edge Effect of Environmental Regulation. Financ. Trade Econ. 2020, 41, 145–160. [Google Scholar] [CrossRef]
  25. Xu, Z.; Yin, X.; Wang, X. Polluting Firms’ Location and Survival. J. World Econ. 2020, 43, 122–145. [Google Scholar] [CrossRef]
  26. Minh, P.N.T.; Farhad, T.H.; Anh, T.C.; Naoyuki, Y.; Ju, K.C. Performance Differential between Private and State-owned Enterprises: An Analysis of Profitability and Solvency. Emerg. Mark. Financ. Trade 2021, 57, 3913–3928. [Google Scholar] [CrossRef]
  27. Foster, L.; Haltiwanger, J.; Syverson, C. Reallocation, Firm Turnover, and Efficiency: Selection on Productivity or Profitability? Am. Econ. Rev. 2008, 98, 394–425. [Google Scholar] [CrossRef]
  28. Jin, X.; Zhang, W. Financial Market Structure and Firm Survival. China Econ. Stud. 2019, 3, 108–121. [Google Scholar] [CrossRef]
  29. Li, D.; Lu, Y.; Wu, M. Industrial agglomeration and firm size: Evidence from China. Reg. Sci. Urban Econ. 2012, 42, 135–143. [Google Scholar] [CrossRef]
  30. Boyer, T.; Blazy, R. Born to be alive? The survival of innovative and non-innovative French micro-start-ups. Small Bus. Econ. 2014, 42, 669–683. [Google Scholar] [CrossRef]
  31. Kozlova, M.; Huhta, K.; Lohrmann, A. The interface between support schemes for renewable energy and security of supply: Reviewing capacity mechanisms and support schemes for renewable energy in Europe. Energy Policy 2023, 181, 113707. [Google Scholar] [CrossRef]
  32. Sun, C.; Liang, J. Locating Nearer, Exporting Closer: Spatial Adjacency and Corporate Expansion of Export Markets. J. World Econ. 2020, 43, 99–122. [Google Scholar] [CrossRef]
  33. Chen, Z.; Kahn, M.E.; Liu, Y.; Wang, Z. The consequences of spatially differentiated water pollution regulation in China. J. Environ. Econ. Manag. 2018, 88, 468–485. [Google Scholar] [CrossRef]
  34. Dong, B.; Gong, J.; Zhao, X. FDI and environmental regulation: Pollution haven or a race to the top? J. Regul. Econ. 2012, 41, 216–237. [Google Scholar] [CrossRef]
  35. Cole, M.A.; Elliott, R.J.R.; Okubo, T. Trade, environmental regulations and industrial mobility: An industry-level study of Japan. Ecol. Econ. 2010, 69, 1995–2002. [Google Scholar] [CrossRef]
  36. Zhou, H.; Yu, Z.; Yang, Z. Accessibility, Agglomeration and New Firm Location: Micro Evidence from Chinese Manufacturing. China Econ. Q. 2015, 14, 1393–1416. [Google Scholar] [CrossRef]
  37. Fujita, M.; Krugman, P.; Venables, A.J. The Spatial Economy: Cities, Regions, and International Trade; The MIT Press: Cambridge, MA, USA, 1999. [Google Scholar]
  38. Görg, H.; Spaliara, M.-E. Financial Health, Exports and Firm Survival: Evidence from UK and French Firms. Economica 2014, 81, 419–444. [Google Scholar] [CrossRef]
  39. Colombelli, A.; Krafft, J.; Quatraro, F. Properties of knowledge base and firm survival: Evidence from a sample of French manufacturing firms. Technol. Forecast. Soc. Change 2013, 80, 1469–1483. [Google Scholar] [CrossRef]
  40. Wei, T.; Ma, L. A Research on the Impact of the Social Security Payment Burden on the Survival Risk of Chinese Enterprises. J. Financ. Econ. 2019, 45, 112–126. [Google Scholar] [CrossRef]
  41. Zhou, C. How Does Capital Intensity Affect the Relationship between Outward FDI and Productivity? Micro-evidence from Chinese Manufacturing Firms. Emerg. Mark. Financ. Trade 2020, 57, 4004–4019. [Google Scholar] [CrossRef]
  42. Xu, Z.; Li, R. Polluters’ Survival Pathway: An Investigation and Rethink on “Too Polluted to Fail”. J. Financ. Econ. 2019, 45, 84–96+153. [Google Scholar] [CrossRef]
  43. Stucki, T. Success of start-up firms: The role of financial constraints. Ind. Corp. Change 2014, 23, 25–64. [Google Scholar] [CrossRef]
  44. Zhang, Z.; Ye, J. Decomposition of environmental total factor productivity growth using hyperbolic distance functions: A panel data analysis for China. Energy Econ. 2015, 47, 87–97. [Google Scholar] [CrossRef]
  45. Orton, F.; Roberts-Rhodes, B.; Whatley, C.; Tyler, C.R. A review of non-destructive biomonitoring techniques to assess the impacts of pollution on reproductive health in frogs and toads. Ecotoxicol. Environ. Saf. 2023, 262, 115163. [Google Scholar] [CrossRef] [PubMed]
  46. Jagannathan, R.; Anand, S.; Hogan, J.; Mandal, S.; Kondal, D.; Gupta, R.; Patel, S.A.; Anjana, R.M.; Deepa, M.; Ali, M.K.; et al. Estimated glomerular filtration rate trajectories in south Asians: Findings from the cardiometabolic risk reduction in south Asia study. Lancet Reg. Health Southeast Asia 2022, 6, 100062. [Google Scholar] [CrossRef] [PubMed]
  47. Wang, W.; Liu, X. Why Do Zombie Firms Survive for a Long Time. China Ind. Econ. 2018, 10, 61–79. [Google Scholar] [CrossRef]
  48. Bratti, M.; Felice, G. Are Exporters More Likely to Introduce Product Innovations? World Econ. 2012, 35, 1559–1598. [Google Scholar] [CrossRef]
  49. Batrancea, L. The Influence of Liquidity and Solvency on Performance within the Healthcare Industry: Evidence from Publicly Listed Companies. Mathematics 2021, 9, 2231. [Google Scholar] [CrossRef]
  50. Batrancea, L. An Econometric Approach on Performance, Assets, and Liabilities in a Sample of Banks from Europe, Israel, United States of America, and Canada. Mathematics 2021, 9, 3178. [Google Scholar] [CrossRef]
  51. Lan, F.; Da, H.; Wen, H.; Wang, Y. Spatial Structure Evolution of Urban Agglomerations and Its Driving Factors in China’s mainland: From the Monocentric to the Polycentric Dimension. Sustainability 2019, 11, 610. [Google Scholar] [CrossRef]
  52. Liu, K.; Wu, Y.; Wang, X.; Wang, C. Impact of spatial structure of urban agglomerations on air pollution in China. China Popul. Resour. Environ. 2020, 30, 28–35. [Google Scholar]
  53. Cai, H.; Zhong, C.; Han, J. Upgrade of Transportation Infrastructure and Siting of Polluting Enterprises: The Case of High-Speed Railway Launch in China. China Econ. 2022, 17, 89–112. [Google Scholar] [CrossRef]
Figure 1. The survival characteristics of sample firms.
Sustainability 15 13711 g001
Figure 2. The spatial distribution characteristics of the sample firms.
Sustainability 15 13711 g002
Table 1. Descriptive distribution of sample.
Urban AgglomerationNumberIndustryNumber
Yangtze River Delta11,022Chemical Products Manufacturing4093
Pearl River Delta3782Textile Industry3852
Central Plains3683Agricultural Food Processing Industry2789
Yangtze River Middle Reaches3552Nonmetallic Mineral Products Industry2162
Beijing–Tianjin–Hebei3453Metal Products Industry1813
Chengdu–Chongqing3134General Equipment Manufacturing1633
Guanzhong Plain983Pharmaceutical Manufacturing1248
Beibu Gulf897Food Manufacturing1089
Harbin–Changchun826Metal Smelting and Processing Industry1069
Hohhot–BaotouOrdos-Yulin414Paper Products Industry764
LanzhouXining241Communication Manufacturing755
Table 2. Descriptive analysis of variables.
VariableUnitObsMeanStd. Dev.MinMaxSkewnessKurtosis
TYear78,1102.571.9681151.6575.920
H-78,1101.7251.163029.3672.22831.404
H2-78,1104.3279.7920862.41943.3833179.282
ownership-78,1100.0120.108019.08183.471
export-78,1100.2830.45010.9651.931
density10,000 RMB/person78,11035.667278.780.00219,278.236.1671734.771
leverage%78,1100.5790.315030.12916.2991279.09
burden%78,1100.0170.04101.3274.97457.533
pollT78,11080.962493.795028,70021.482737.176
tfp-78,1100.0110.0460113.025234.393
integ-78,1101.7510.1811.4972.9132.4169.753
structure%78,1100.4790.0680.2360.697−1.13.303
Table 3. Baseline regression.
VariablesExponential DistributionWeibull DistributionLognormal Distribution
(1)(2)(3)
H0.0565 ***0.0528 ***0.0369 **
(3.090)(2.775)(2.272)
H2−0.00245 ***−0.00245 ***−0.00145 **
(−3.011)(−3.104)(−2.016)
tfp−1.936 ***−1.123 ***−1.509 ***
(−16.79)(−13.82)(−11.72)
ownership0.210 ***0.126 **0.0545
(3.162)(2.229)(1.123)
export0.157 ***0.178 ***0.153 ***
(11.73)(14.08)(12.75)
density1.70 × 10−69.77 × 10−72.42 × 10−7
(0.957)(0.699)(0.145)
burden−0.149−0.693 ***−0.562 ***
(−0.627)(−3.848)(−3.491)
poll8.67 × 10−8 ***1.16 × 10⁻⁷ ***5.66× 10⁻⁸ ***
(4.255)(5.339)(3.233)
leverage−0.0382 ***−0.0334 ***−0.0311 ***
(−3.138)(−2.858)(−2.582)
integ4.198 ***2.305 ***1.359 ***
(22.54)(18.45)(16.40)
structure4.672 ***3.673 ***3.321 ***
(14.19)(14.51)(15.59)
Constant−8.458 ***−4.886 ***−3.157 ***
(−31.11)(−24.52)(−19.06)
Industry fixed effectYesYesYes
Regional fixed effectYesYesYes
Log likelihood−21,335.438−18,791.428−17,214.202
Observations78,11078,11078,110
Note: ***, ** indicate significance at the 1%, 5% levels, respectively. t-statistic values are in parentheses.
Table 4. The motivation of the impact of the location on survival of polluting firms.
VariablesExponential DistributionWeibull DistributionLognormal Distribution
(1)(2)(3)(4)(5)(6)
reg−0.0436 ***−0.231 **−0.0273 ***−0.577 ***−0.0257 **−0.368 ***
(−2.732)(−2.342)(−2.617)(−7.926)(−1.968)(−5.216)
pot 0.0862 0.516 *** 0.317 ***
(0.861) (6.872) (4.410)
reg × pot 0.0051 *** 0.0022 *** 0.0021 ***
(6.373) (2.976) (3.271)
Constant−8.281 ***−8.108 ***−4.743 ***−4.491 ***−3.043 ***−2.906 ***
(−30.70)(−29.86)(−24.23)(−22.55)(−18.70)(−17.66)
Control variablesYesYesYesYesYesYes
Industry fixed effectYesYesYesYesYesYes
Regional fixed effectYesYesYesYesYesYes
Log likelihood−21,332.648−21,322.313−18,791.444−18,763.12−17,214.152−17,199.365
Observations78,11078,11078,11078,11078,11078,110
Note: ***, ** indicate significance at the 1%, 5% levels, respectively. t-statistic values are in parentheses.
Table 5. Test results for omitted variables bias.
VariablesIV-2SLSIntroducing Nonobservable Heterogeneity
(1)(2)(3)(4)
reg−0.395 **−5.713 ***−0.0257 **−0.372 ***
(−1.968)(−5.266)(−2.228)(−5.305)
pot 4.057 *** 0.313 ***
(4.341) (4.392)
reg × pot 0.00203 *** 0.00203 **
(3.271) (2.481)
Constant−2.134 ***0.973−3.043 ***−2.899 ***
(−4.229)(1.226)(−4.691)(−4.500)
Control variablesYesYesYesYes
Industry fixed effectYesYesYesYes
Regional fixed effectYesYesYesYes
Log likelihood−17,214.152−17,199.365−17,214.152−17,199.365
Observations78,11078,11078,11078,110
Note: ***, ** indicate significance at the 1%, 5% levels, respectively. t-statistic values are in parentheses.
Table 6. Results of robustness tests.
VariablesModel ReplacementSample ScreeningVariable Replacement
(1)(2)(3)(4)(5)(6)
H−0.0550 *** 0.0829 *** 0.000378 **
(−2.945) (2.676) (2.370)
H20.00226 *** −0.00525 ** −1.37 × 10⁻⁷ **
(2.768) (−2.432) (−2.043)
reg 0.316 *** −2.094 *** −0.314 ***
(3.195) (−20.62) (−10.24)
pot −0.170 * 2.014 *** 0.474 ***
(−1.685) (19.23) (6.376)
reg × pot 0.00471 *** 0.00250 *** 0.0842 ***
(−5.856) (2.857) (6.202)
Constant −5.383 ***−5.766 ***−3.154 ***−4.759 ***
(−15.07)(−16.38)(−19.10)(−19.79)
Control variablesYesYesYesYesYesYes
Industry fixed effectYesYesYesYesYesYes
Regional fixed effectYesYesYesYesYesYes
Log likelihood−172,614.13−172,602.43−6451.8−6238.65−17,213.93−17,143.18
Observations78,11078,11028,98028,98078,11078,110
Note: ***, **, and * indicate significance at the 1%, 5%, and 10% levels, respectively. t-statistic values are in parentheses.
Table 7. Test of the moderating effect of market potential.
VariablesConsidering Cross-Domain Markets
reg−0.264 ***
(−5.374)
pot−0.272 ***
(−2.993)
reg × pot0.0678 ***
(4.600)
Constant−2.336 ***
(−9.383)
Control variablesYes
Industry fixed effectYes
Regional fixed effectYes
Log likelihood−17,194.075
Observations78,110
Note: *** indicate significance at the 1% levels. t-statistic values are in parentheses.
Table 8. Property heterogeneity.
VariablesState-OwnedPrivate
(1)(2)(3)(4)
H0.116 0.039 **
(0.222) (2.280)
H2−0.021 −0.001 *
(−0.222) (−1.872)
reg −0.825 * −0.409 ***
(−1.712) (−5.289)
pot 0.467 0.345 ***
(0.783) (4.372)
reg × pot 0.0761 0.002 ***
(1.096) (3.321)
Constant1.1021.864−2.789 ***−2.504 ***
(0.647)(1.420)(−15.59)(−14.06)
Control variablesYesYesYesYes
Industry fixed effectYesYesYesYes
Regional fixed effectYesYesYesYes
Log likelihood−65.26−62.83−14,192.83−14,177.66
Observations91491464,91464,914
Note: ***, **, and * indicate significance at the 1%, 5%, and 10% levels, respectively. t-statistic values are in parentheses.
Table 9. New entrant heterogeneity.
Variables(1)(2)
H × ent0.411 **
(2.128)
H2 × ent−0.073
(−1.166)
reg × ent −3.164 *
(−1.934)
pot × ent 3.598 **
(2.113)
reg × pot × ent −0.072
(−1.642)
Constant−3.078 ***−3.078 ***
(−19.01)(−19.02)
Control variablesYesYes
Industry fixed effectYesYes
Regional fixed effectYesYes
Log likelihood−17,213.292−17,212.212
Observations78,11078,110
Note: ***, **, and * indicate significance at the 1%, 5%, and 10% levels, respectively. t-statistic values are in parentheses.
Disclaimer/Publisher’s Note: The statements, opinions and data contained in all publications are solely those of the individual author(s) and contributor(s) and not of MDPI and/or the editor(s). MDPI and/or the editor(s) disclaim responsibility for any injury to people or property resulting from any ideas, methods, instructions or products referred to in the content.

