Article

Optimisation of Anaerobic Digestate and Chemical Fertiliser Application to Enhance Rice Yield—A Machine-Learning Approach

1
Department of Environmental Studies, Siksha-Bhavana, Visva-Bharati, Santiniketan 731235, West Bengal, India
2
Department of Biotechnology, Siksha-Bhavana, Visva-Bharati, Santiniketan 731235, West Bengal, India
3
Department of Biology, York University, Toronto, ON M3J 1P3, Canada
4
Department of ASEPAN Institute of Agriculture, Visva-Bharati, Sriniketan 731236, West Bengal, India
5
Department of Adult, Continuing Education and Extension, Palli-Samgathana Vibhaga, Visva-Bharati, Sriniketan 731236, West Bengal, India
6
School of Chemical and Process Engineering, University of Leeds, Leeds LS2 9JT, UK
*
Author to whom correspondence should be addressed.
These authors contributed equally to this work.
Sustainability 2023, 15(18), 13706; https://doi.org/10.3390/su151813706
Submission received: 19 July 2023 / Revised: 7 September 2023 / Accepted: 11 September 2023 / Published: 14 September 2023

Abstract

:
The present study evaluates the synergistic application of an anaerobic digestate for enhanced rice yield. The study utilised the digestate as a fertiliser with various inoculum-to-substrate (IS) ratios of anaerobic digestion from cow dung and water hyacinth (CW–BF) with combinations of NPK (16-22-22) fertiliser for rice yield optimisation. The outcome of the combined digestate and fertiliser application on rice cultivation was observed in terms of parameters such as the number of tillers, panicle number, panicle length, fertile panicles, and 1000-grain weight. The digestate combination of CW–BF:NPK (3:1:1) resulted in the highest grain yield (7521 kg/hectare) with increased panicle length, test weight, and more filled grains than the other combinations. Moreover, various machine-learning approaches were used to study the efficacy of the different combinations of applied fertiliser (cow dung, water hyacinth, and NPK). The gradient-boosting machine-learning model was appropriate for predicting the modelling based on the measured data. Principal component analysis revealed NPK as the first principal component with high loading values and the digestate as the second principal component, which indicates its crucial role in fertiliser preparation. Therefore, deploying such hybridised fertilisers using the proper statistical analysis and machine-learning approaches can improve rice yield, which would be essential for the socio-economic uplifting of marginal rice farmers.

1. Introduction

Among the cultivated crops, rice is one of the most demanding staple food crops, and its demand is increasing daily due to the rise in the global population [1,2]. Moreover, there is increasing awareness of using organic food and organic fertilisers due to health consciousness, which can reduce synthetic nitrogen (N) and phosphorous (P) requirements for rice production [3], as well as its carbon footprint. One of the major problems in organic farming is productivity and yield, where fertiliser is a crucial factor in the growth and yield of rice [2,4,5], as it is essential for boosting plant growth and crop production. Though chemical fertilisers are high in nutrient content, soluble, and readily accepted by plants [6], the over-application of chemical fertiliser can negatively affect soils [7], pollute water resources, and destroy soil microorganisms and insects, which are very important for the earth [8,9]. So, this study proposes combining organic and inorganic fertiliser applications to increase rice yield.
The production of biogas through anaerobic digestion (AD) to replace fossil fuels using various agricultural waste and weeds such as water hyacinth, Salvinia, Lantana camara, etc. [10,11,12] is increasing these days. Water hyacinth has been utilised both independently and as a constituent of composite feed materials for the production of methane via anaerobic digestion. The efficacy of the anaerobic digestion of water hyacinth is notably contingent upon substrate composition. Its adaptability presents a prospective remedy for addressing a spectrum of challenges inherent to water hyacinth management across diverse geographical regions [13]. AD is an environmentally sustainable solution to mitigate global warming and reduce greenhouse gas and waste generation costs [14], and the byproduct of biogas generation is a digestate rich in nutrients. The digestate is a valuable biofertiliser containing many plants essential nutrients and microorganisms [15]. Due to its high nutrient contents, it can be used as a fertiliser in agriculture [16], thereby reducing the utilisation of chemical fertiliser [17,18,19]. Still, the nutrient element imbalance and component unpredictability are the main issues with biogas digestate [20]. Organic fertiliser also increases the quality and yield of rice and reduces a farmer’s dependency on inorganic fertiliser [21]. The application of organic fertiliser is now in high demand for better rice production at a low cost and to maintain long-term soil health [22]. Organic fertiliser keeps plants healthy by providing essential heavy metals for plant growth, enhancing soil biological activity, improving soil structure and texture, and improving the soil’s organic matter content and water retention capacity [23,24]. It also has disadvantages such as low nutrient content, lower nutrient release rate, and insufficient levels of nutrients required for maximum crop growth. Long-term soil fertility, crop production, and soil microbial richness and diversity was improved by the partial substitution of chemical fertilisers with organic fertilisers [25]. Combining inorganic and organic fertilisers in different ratios enhances the yield [26,27,28,29,30] and can reduce the cost of rice production [31]. However, combined with chemical fertiliser, biogas digestate has faster reactions and is more effective for crop yield [17]. Khan et al. [32] noted that applying 50% chemical fertiliser and 50% biogas slurry increased cob yield by 20%. In 2014, India had approximately 5 million farm-sized biogas plants, producing up up to 10 billion m3 of biogas annually [33], and it has the potential to produce a tremendous amount of digestate. As a substrate, one hectare of water hyacinth digestion produces 8550 m3 of methane and 34 tons of digestate that can replace the NPK application in 1.2 hectares of grain crop [34].
Predicting fertiliser application and water requirements for better crop yield at low cost through machine-learning approaches is a treasure box for “welfare economics” [35]. The leading science of machine learning makes it simple to automate processes by continuously learning from the data to create more accurate predictions [36,37,38]. Machine learning is rapidly developing into a technical panacea for the agriculture sector’s long-standing problems. In addition to supporting other additional domains of agriculture, machine learning considerably benefits the agriculture industry by predicting crop yield [35,39,40,41,42,43].
In this experiment, the main objective was to find the best treatment ratio of biogas digestate and chemical fertiliser (NPK) to maximise the crop yield and substitute the amount of chemical fertiliser used in order to minimise any negative environmental impacts. Thus, the aims of this work included: (1) a hybrid fertiliser, using a mixture of organic and chemical fertilisers, to obtain maximum yield at a low cost; (2) a predictive analysis using a machine-learning model to identify and predict crop yield based on fertiliser application; (3) determining the variance of the dependency of the yield rate upon the input parameters (substrate, inoculum and NPK) via a principal component analysis to reduce the dimensionality of the variable factors. So, the present study is a noble approach to maximise the yield of rice at a low cost by using various machine-learning models such as random forest, gradient boosting, AdaBoost, and tree algorithm modelling to study the dependency of the percentage yield on the input parameters, along with PCA to determine the variance of the dependency of the yield rate upon the input parameters such as substrate, inoculum and NPK.

2. Materials and Methods

The present study was divided into two phases: the preparation of biofertilisers with different compositions followed by their application in a pot culture, and analysing the results to utilise a machine-learning model for further application.

2.1. Preparation of Biofertiliser

The biogas digestate produced after 30 days of anaerobic digestion using cow dung as the inoculum and water hyacinth as the substrate in the ratios of 0.5:1, 1:1, 1.5:1, 2:1, 3:1, 4:1, 5:1, 6:1 and 7:1 (based on volatile solids (VSs)), respectively, were utilised for the preparation of biofertilisers for use in rice fields to enhance yield (Table 1).

2.1.1. Experimental Setup

Pot experiments were carried out from July to November 2020 to investigate the effect of various ratios of biogas digestate on rice growth and yield components (Oryza sativa L.) following the modified experimental design protocol of Hoque et al. [44], with a popular rice line (var. Swarna). The pot experiment was carried out at the experimental site of Visva-Bharati following standard agricultural practices [45] with modifications (23°39′ N latitude, 87°42′ E longitude).

2.1.2. Experimental Design and Treatment

The soil was collected from the agricultural soils of Goalpara, near Visva-Bharati. It was air-dried and then placed in plastic pots (22 cm width, 20 cm depth and 24 cm height) with 6 kg soil for each pot. Twenty-eight-day-old seedlings were transplanted with a single plant per hill in each pot. Up to the booting stage, a 4 cm water depth was maintained in each pot through irrigation, and standard agricultural practices were followed manually throughout the season. The different treatments and amounts of fertiliser used are described in Table 1.
There were twenty treatments with three replicates. The treatments given were the control (without any fertiliser), NPK (only 2 g NPK fertiliser), and to nine pots, 20 g of biogas digestate was applied to each pot marked as 0.5:1 EBF (Eichhornia biofertiliser), 1:1 CW–BF, 1.5:1 CW–BF, 2:1 CW–BF, 3:1 CW–BF, 4:1 CW–BF, 5:1 CW–BF, 6:1 CW–BF and 7:1 CW–BF, along with nine combinations of 11 g of hybrid fertiliser (10 g of CW–BF + 1 g NPK), 0.5:1:1 CW–BF + NPK, 1:1:1 CW–BF + NPK, 1.5:1:1 CW–BF + NPK, 2:1:1 CW–BF + NPK, 3:1:1 CW–BF + NPK, 4:1:1 CW–BF + NPK, 5:1:1 CW–BF + NPK, 6:1:1 CW–BF + NPK and 7:1:1 CW–BF + NPK. These fertilisers were applied three times to each pot after seven days of planting in the pot (50%, 25% in the tillering stage, and the remaining 25% in the panicle-initiation stage).

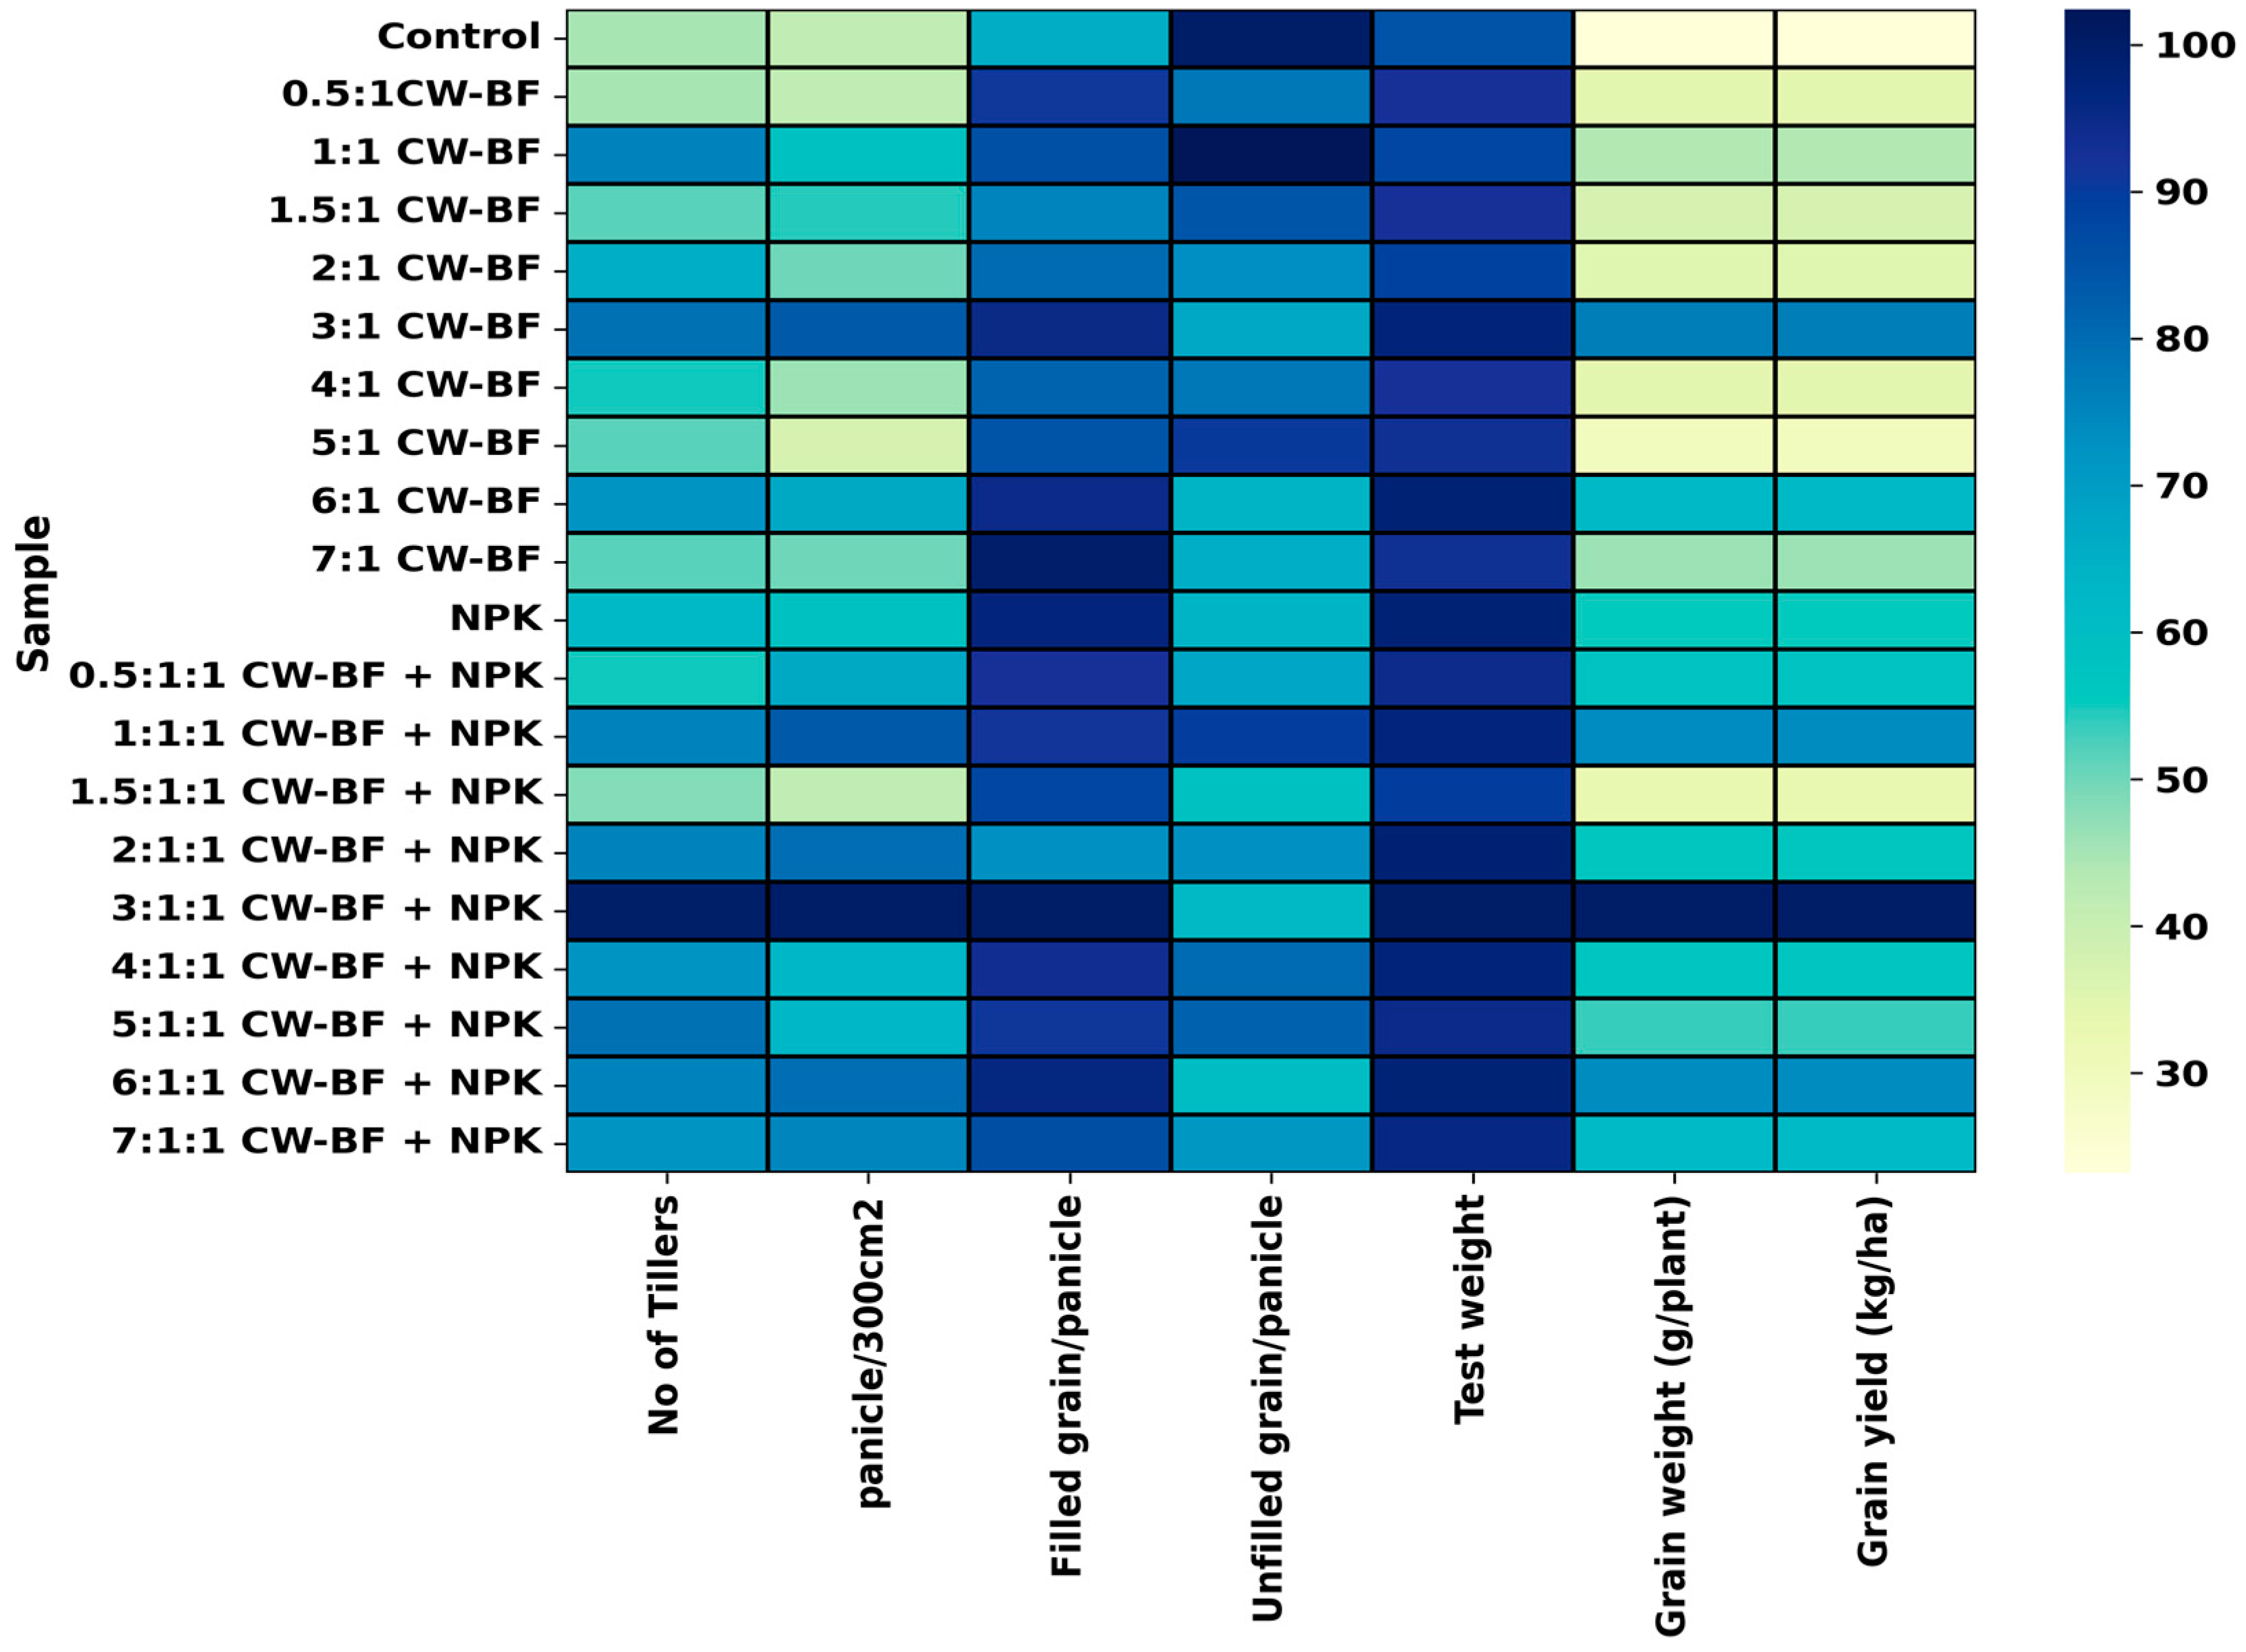
2.1.3. Study on Plant Growth and Yield Parameters

Plant height, tiller numbers, and flag leaf length were measured in triplicate at the flowering stage. Parameters such as the number of effective tillers per plant (NT), number of panicles per plant (NP), panicle length (PL), number of filled grains per panicle (FG/P), number of unfilled grains per panicle (UG/P), and 1000-grain weight (GWt) were measured by the modified method of Hoque et al. [44].

2.2. Statistical Analysis of the Derived Data

2.2.1. Modelling

The experimental phase of this project carefully monitored the yield from the pot cultivation of rice by adjusting the input parameters such as the substrate-to-inoculum ratio and the NPK fertiliser. The net cost of the fertiliser was also taken into account. It should be noted that due to practical constraints, not all possible ratios of the input parameters were tested. A predictive model was constructed to estimate the extent of the yield dependency on these input parameters. The dataset collected from our experimental trials was curated and fed into this model. The dataset was evaluated using various established regression techniques, meta-algorithms, tree algorithms, and machine-learning models, including random forest, gradient boosting and AdaBoost [46]. Each model’s performance was evaluated, and the gradient-boosting model [47] was selected as the most suitable due to its superior performance in terms of the lowest error factors and highest R2 values compared to the other models.
The modelling parameters utilised for the gradient-boosting approach (Sckit-learn) were as follows:
(i)
Number of trees: 100;
(ii)
Learning rate: 0.60, using reproducible training;
(iii)
Growth control:
a.
Limit of depth of individual trees: 3;
b.
Subset splitting threshold: 2;
(iv)
Subsampling (fraction of training instances): 1.00.
A comparative analysis is provided in Table 2, demonstrating that gradient boosting outperformed the other models considered in this study.

2.2.2. Optimisation

An optimisation strategy is vital to achieving maximum yield while minimising cultivation costs. This was implemented via an intersection plot, which helps to pinpoint the optimal yield point at the least possible cost [48]. The optimal yield was identified by mapping the yield rate and NPK levels against various substrate-to-inoculum ratios, which require the minimum input of NPK.
This approach underpins the principle that a reduction in NPK input equates to a reduction in cost, thereby enhancing the yield-to-cost (YC) ratio. Essentially, the lower the quantities of NPK employed, the more financially efficient the process becomes as the YC ratio increases, reflecting a more economic yield.

2.2.3. Principal Component Analysis

To ascertain the extent of dependency of the yield rate on input parameters—biogas digestate (inoculum–substrate) and NPK—a principal component analysis (PCA) was conducted. The purpose of the PCA was to condense the dimensionality of the factors in this study. This analysis was executed utilising Python on the Miniconda 3 platform. Subsequently, the outcomes were scrutinised on the ‘Orange’ platform. This particular PCA focused on three components, with the ‘Yield’ as the target variable. The data were normalised for the PCA analysis during this phase to avoid scale bias. Further in the process, the eigenvectors, eigenvalues, and loading values were also evaluated. This was crucial in identifying the most impactful principal component and the loading value of each parameter, leading to the most significant variability in the first principal component.

3. Results and Discussion

3.1. Optimisation of Biofertiliser

There is currently a dearth of knowledge available on the topic of increasing rice production with the application of bioslurry in combination with chemical fertiliser [49]. The results of the optimised utilisation of biofertiliser and its yield in the present study are depicted in Figure 1. The heatmap demonstrates that the mixed biofertiliser with an NPK ratio of 3:1:1 (CW–BF:NPK) produced the highest rice yield, followed by the CW–BF:NPK ratio of 3:1:0. If converted to yield per hectare, for the biofertiliser IS:NPK ratio of 3:1:1 (CW–BF:NPK), it can be observed that it generated the highest rice yield (7521 kg/hectare), while the biofertiliser with the IS:NPK ratio of 3:1:0 (CW–BF:NPK) produced the second highest rice yield (5764 kg/hectare). This indicates that combining organic and inorganic fertiliser boosts the rice yield and can reduce the dependency on chemical fertiliser for rice production. The combination of organic and inorganic fertilisers in the proper ratio enhancing rice production was previously reported by several researchers [50,51]. However, for sustainable rice production, the adequate management of manure through improving nitrogen use efficiency will be a prerequisite for future food security [52,53]. The maximum value for the number of tillers per plant (NT), panicles per plant (NP), filled grains per panicle (FG/P), test weight and grain weight per panicle was found in the ratio of 3:1:1 (CW–BF:NPK; 9.7 NT, 8 NP, 173 FG/P, 20.53 g and 22.56 g/plant). Unfilled grains per panicle (UG/P) was at a maximum in the control without any fertiliser (70 UG/P) and at a minimum in the 3:1 CW–BF and 6:1 CW–BF (42 UG/P). When utilising the IS ratio of cow dung to WH, Njogu et al. [54] and Bhui et al. [55] observed that 3:1 produced the maximum biogas yield. This indicates that the IS ratio of 3:1 can be utilised for maximum biogas production; at the same time, its bioslurry can also be used to increase rice productivity with NPK. Several authors have noted that a crucial agricultural practice that can enhance soil health and increase productivity involves the regulated and balanced use of organic and chemical fertilisers [56,57].

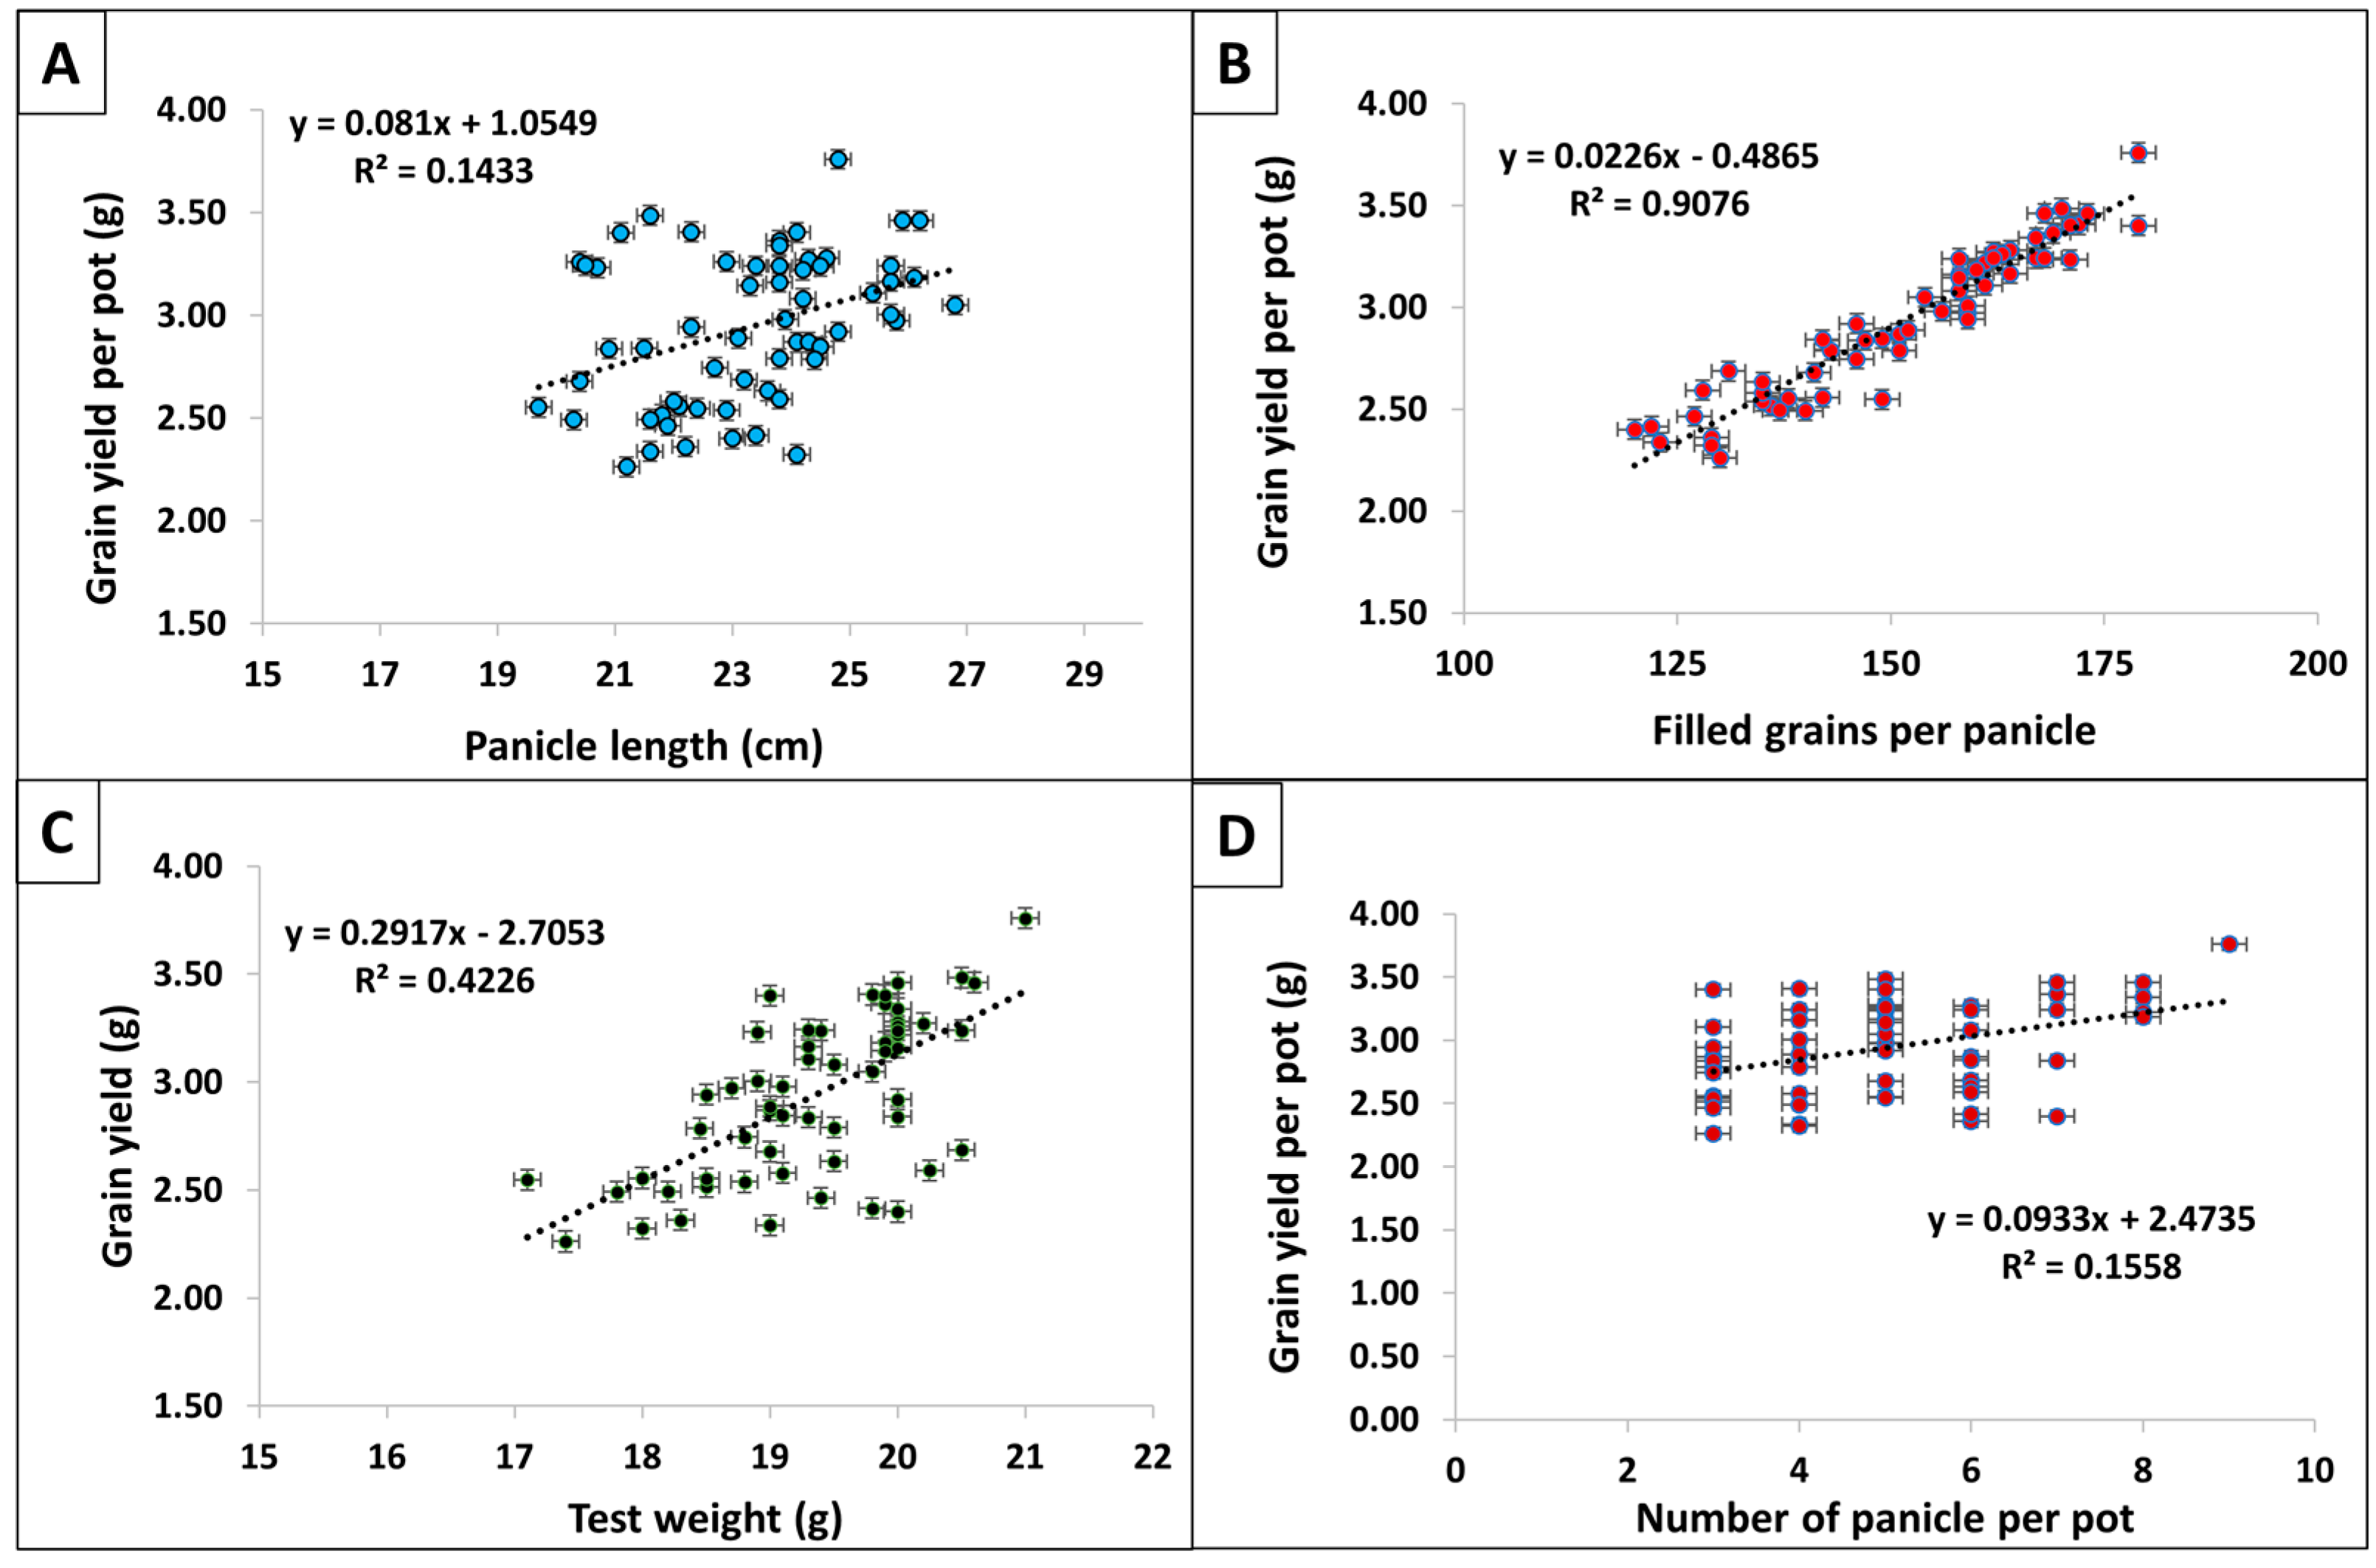
3.2. Simple Regression Analysis between Grain Yield and Yield Attributes of Rice

The number of panicles per plant, length of panicle (cm), filled grains per panicle and test weight (g) revealed significant positive associations with the grain yield of rice (Figure 2). Yoshida [58] observed that NPK assimilated by rice plants during the panicle-initiation phase played a crucial role in the development of panicle primordia, panicle branching, and the establishment of spikelets. The present study observed an increase in grain yield (kg ha−1) with an increasing number of panicles per plant, length of panicle (cm), filled grains per panicle and test weight (g), which revealed that the rice yield is dependent upon different complex traits/yield attributes [59]. For the improvement of yield, the mentioned studied parameters will be crucial factors during rice yield management. So, the filled grains per panicle (Y = 0.0226X − 0.4865, R2 = 0.9076) accounted for a 90.76% variability effect on the grain yield. It has already been reported that an increased number of filled grains has a positive association with the high yield of rice [60]; therefore, the management of those factors that reduce the grain-filling process during grain development is essential for high rice production [61]. Among them, fertiliser is a crucial regulator of grain filling [62]. Therefore, fertiliser management is necessary for a high rice yield. In our study, combining organic and inorganic fertiliser application boosted the rice yield through proper grain filling, and the excess use of inorganic fertiliser can reduce the rice yield [63,64]. Balancing the hybrid/combined fertiliser application is far better for sustainable rice production. However, in the case of the test weight (g) (Y = 0.2917X − 2.7053, R2 = 0.4226), it explained 42.26% of the variability; the number of panicles plant−1 (Y = 0.0933X + 2.4735, R2 = 0.1558) was attributed to 15.58% of the variability; panicle length exerted a 14.33% (Y = 0.081X + 1.0549, R2 = 0.1433) effect on rice yield. Similar results were also observed by Fentie et al. [65], Mohanty et al. [66], Chandra et al. [67], Nayak et al. [68] and Madhavilatha [69]. Hence, increasing the filled grains per panicle, test weight (g), panicles per plant and panicle length directly affect rice’s grain yield (kg ha−1).

3.3. Modelling

To determine the yield rate for varying amounts of NPK and IS ratios, various machine-learning methods including random forest [70], gradient boosting [71], AdaBoost [72], and tree algorithms were applied to the test dataset comprising randomly generated quantities of the inoculum-to-substrate ratio and NPK using 10-fold cross validation amongst 57 data points to estimate the yield [73]. Most literature studies employ gradient-boosting methods because they are simple, efficient, and inexpensive [74]. The model’s performance has also been presented by feeding the actual dataset in the gradient-boosting model to depict the model’s accuracy visually. From the model, it can be inferred that the gradient-boosting model had a high prediction rate (~75%) of rice yield. Thus, this model can be translated to actual-scale rice cultivation (Figure 3). Table 2 displays the test data’s mean average error (MAE), the mean-squared error (MSE), root-mean-squared error (RMSE), R2 values and the outcomes from each machine-learning model. Table 2 demonstrates that the gradient-boosting regression yielded a better R2 value, or the correlation between the predicted and the actual yield in the test set. It achieved nearly 75% correlation, a 4.90 MSE value, 2.21 RMSE value and 1.81 MAE value, outperforming the alternative experimental models. The predicted results validated that the yield rates from random input parameters can be predicted through this model.
Upon analysing the gradient-boosting model for rice yield prediction, it was found that the model accounted for approximately 89.18% of the variation in the rice yield, as indicated by an R2 value of 0.8918 (Figure 3). This is a strong indication of the model’s robustness and its predictive accuracy, demonstrating that the model variables can explain a significant portion of the variability in the actual yield. However, an R2 value, while informative, does not provide a complete picture of a model’s effectiveness. For instance, although not excessively so, the Durbin–Watson test indicated a mild positive autocorrelation in the residuals. While this factor is not a critical issue for predictive models, it could point to some underlying pattern in the prediction errors that the model is not capturing. Additionally, while the residuals appear customarily distributed, which is a positive aspect of the model, computational issues were encountered with the Breusch–Pagan test, possibly suggesting problems with multicollinearity, heteroscedasticity, or other aspects of the model or data. Given these results, while our model performs admirably in predicting rice yield, it is recommended to further investigate the identified potential issues and apply additional diagnostic checks to ensure optimal model performance. Periodic model validation with new data would also be beneficial to ascertain continued predictive accuracy over time.
Previously, studies have investigated the effects of digestate application on crop yield prediction for celery, lettuce, green peppers and other vegetables [75,76,77,78]. For fertiliser recommendations, various data-mining approaches were also reviewed by Jethva et al. [79]. Additional research is required to further investigate the use of machine-learning algorithms in predicting crop yield by applying recommended fertilisers [80].

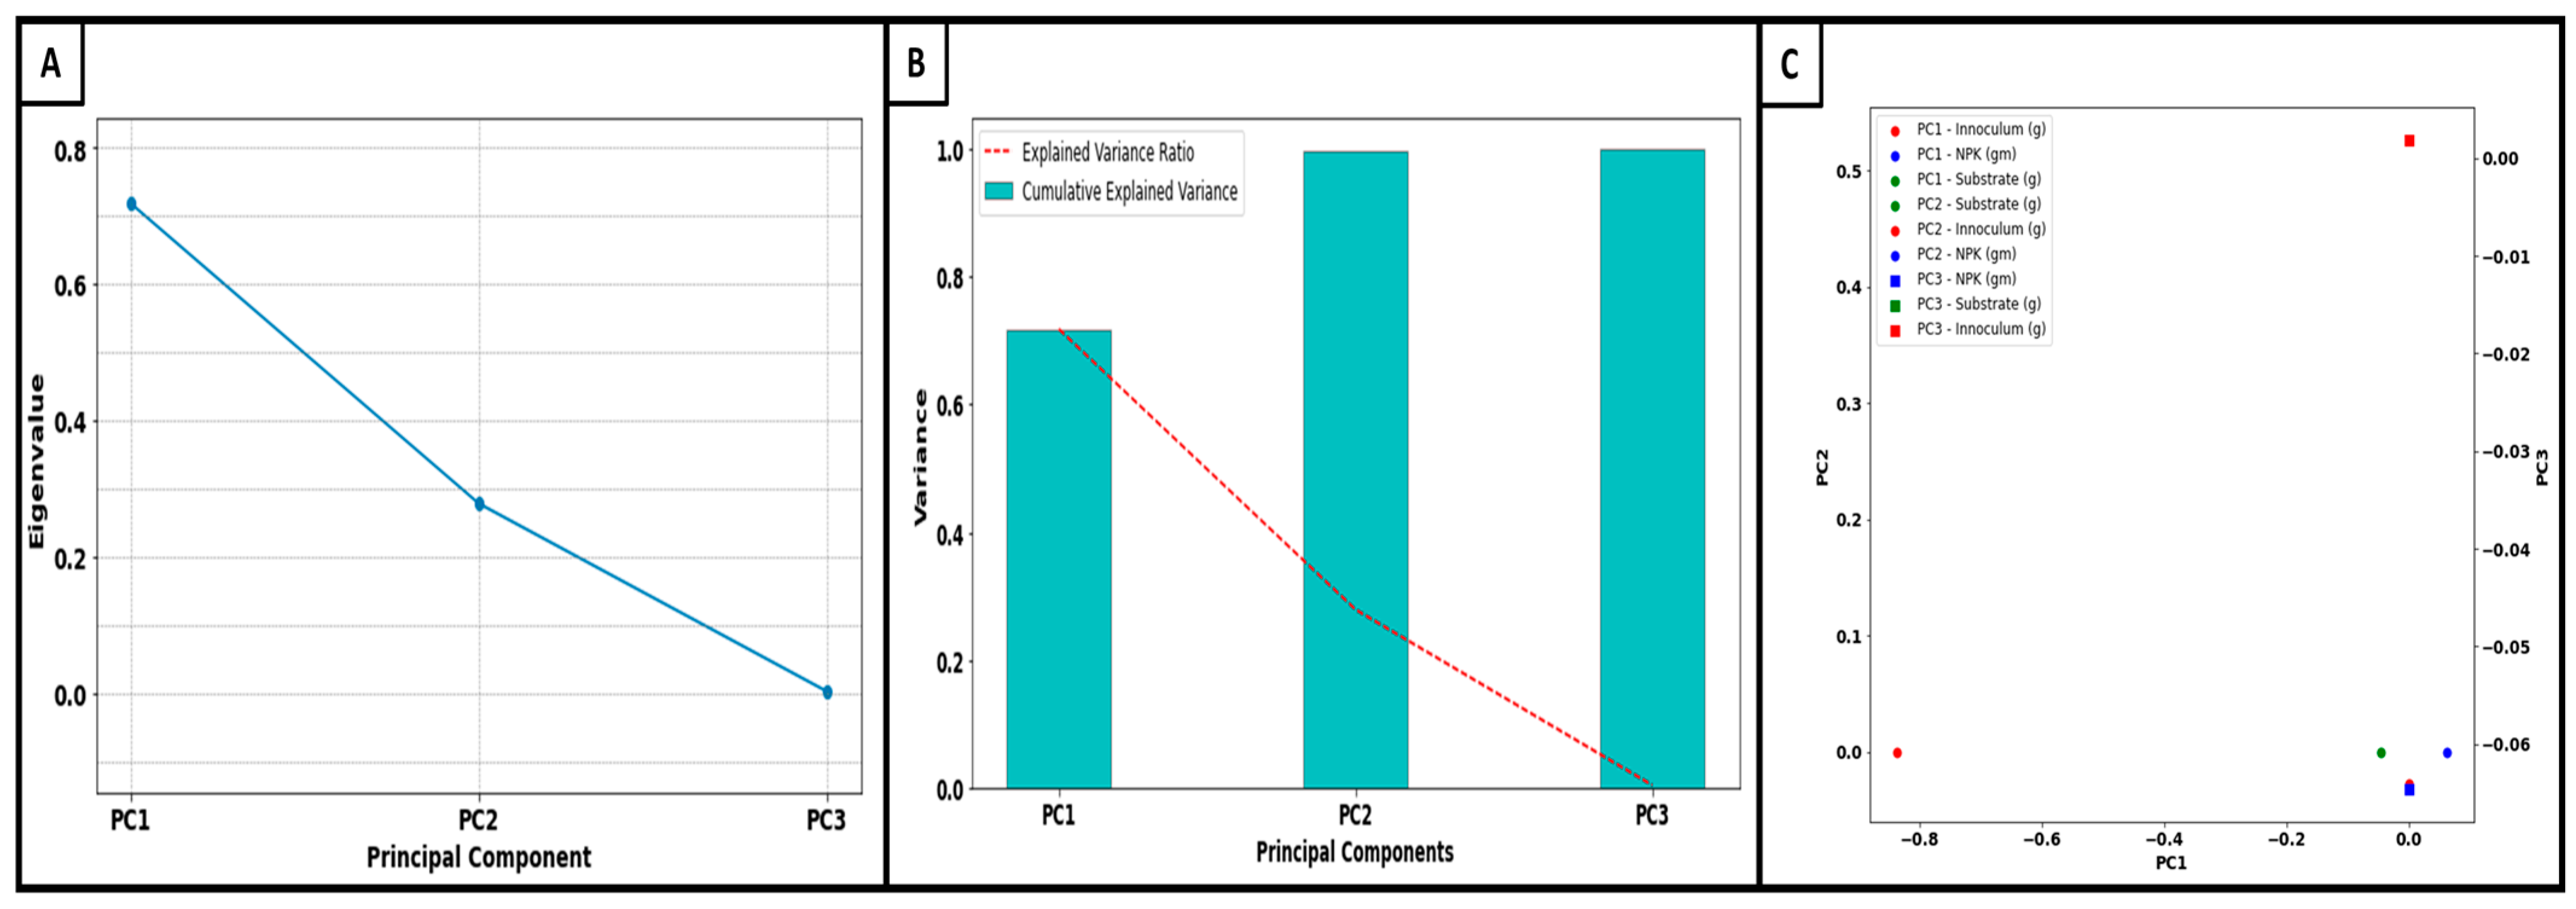
3.4. Principal Component Analysis

The results of the PCA are depicted using a scree plot [81] provided in Figure 4A. From the results, the first principal component alone captured 71.8% of the total variance found in our dataset. The subsequent components, the second and third, accounted for 27.85% and 0.34% of the variance, respectively, as detailed in Figure 4B. When taken together, the first two principal components encapsulated almost 99.66% of the entire dataset’s information. Given the minimal contribution from the third component, any further analysis or prediction endeavours related to ‘Yield’ could focus predominantly on the first two components for a comprehensive understanding.
The first principal component heavily correlated with the ‘Inoculum’ variable. This is evident from its dominant absolute value in the component’s eigenvector, which stands at −0.9955. This critical insight reveals that the ‘Inoculum’ variable played a pivotal role in influencing variations in the yield. The negative coefficient further sheds light on the inverse relationship between ‘Yield’ and ‘Inoculum’, implying that as ‘Inoculum’ values rose, the ‘Yield’ tended to drop, assuming other variables remained constant.
Conversely, the second principal component exhibited a strong positive alignment with the ‘Substrate’ variable, with a value of 0.9956. This alignment highlights the significant influence of the ‘Substrate’ on the ‘Yield’, emphasising their direct positive correlation. As for the third component, although it correlated most with the ‘NPK’ variable (−0.9953), as seen in Table 3, its influence was relatively subdued given its minor contribution to the total variance. Thus, while ‘NPK’ did influence the ‘Yield’, its effect was attenuated when juxtaposed against the pronounced impacts of the ‘Inoculum’ and ‘Substrate’. Given these revelations, upcoming studies may prioritise examining the effects of the ‘Inoculum’ and ‘Substrate’ on the ‘Yield’, as alluded to in Figure 4C.

4. Limitations

The model works well for predicting statistical data, but the results could be more accurate for image data. The model can be improved by providing a better feature selection algorithm that can work equally for image and statistical data. The model must be trained separately for each data set.

5. Conclusions

The study found that using a combination of organic and chemical fertilisers in a 3:1:1 ratio significantly enhanced rice yield at low cost. The gradient-boosting model was able to predict yield with 75% accuracy. PCA analysis showed that the inoculum was the second most crucial component (with 27.85% variation) affecting rice yield and a critical factor in the fertiliser preparation. Additionally, the study found that water hyacinth can generate fertilisers that meet up to half of the total fertiliser requirements for rice plants. The results from the present study contribute to the expanding body of research demonstrating that utilising digestate as a biofertiliser can reduce dependency on expensive imported fertilisers and enhance agricultural production choices in the face of nutrient scarcity.

Author Contributions

Conceptualisation, B.K.S., S.P., S.C. and S.B.; methodology, B.K.S. and S.P.; software, B.K.S. and R.G.; validation, K.P., S.C., A.K.H., N.D., A.B.R. and S.B.; formal analysis, B.K.S., S.P., R.G., A.B., A.K. and A.G.; investigation, B.K.S. and S.P.; resources, B.K.S. and S.P.; data curation, B.K.S., S.P., R.G., A.B., A.K. and A.G.; writing—original draft preparation, B.K.S., S.P., R.G., A.K. and A.G.; writing—review and editing, B.K.S., K.P., S.C., A.K.H., N.D., A.B.R. and S.B.; visualisation, B.K.S., S.P., R.G., A.K. and A.G.; supervision, S.C., A.K.H., A.B.R. and S.B.; project administration, S.C., A.K.H., A.B.R. and S.B.; funding acquisition, S.C., A.K.H., A.B.R. and S.B. All authors have read and agreed to the published version of the manuscript.

Funding

This research was funded by BBSRC, United Kingdom, “Bioenergy, Fertilizer and Clean Water from Invasive Aquatic Macrophytes”, Grant Ref: BB/S011439/1. The APC was funded by the University of LEEDS.

Institutional Review Board Statement

Not applicable.

Informed Consent Statement

Not applicable.

Data Availability Statement

Data will be available on request.

Acknowledgments

The authors appreciate the immense support and technical contribution of Nitu Gupta, a Research Scholar at Tezpur University, in conducting experimental work under this project.

Conflicts of Interest

The authors declare no conflict of interest.

References

  1. Mäder, P.; Fliessbach, A.; Dubois, D.; Gunst, L.; Fried, P.; Niggli, U. Soil fertility and biodiversity in organic farming. Science 2002, 296, 1694–1697. [Google Scholar] [CrossRef] [PubMed]
  2. Ghosh, M.; Devi, A. Assessment of crop growth, soil properties and crop yield in an upland acidic soil with inorganic fertiliser blended with organic amendments in summer rice cropping seasons. Int. J. Recycl. Org. Waste Agric. 2019, 8, 1–9. [Google Scholar] [CrossRef]
  3. Naher, U.A.; Biswas, J.C.; Maniruzzaman, M.; Khan, F.H.; Sarkar, M.I.U.; Jahan, A.; Hera, M.H.R.; Hossain, M.B.; Islam, A.; Islam, M.R.; et al. Bio-organic fertiliser: A green technology to reduce synthetic N and Pfertiliser for rice production. Front. Plant Sci. 2021, 12, 602052. [Google Scholar] [CrossRef] [PubMed]
  4. Singh, B.; Singh, V.K. Fertilizer management in rice. In Rice Production Worldwide, 1st ed.; Chauhan, B.S., Jabran, K., Mahajan, G., Eds.; Springer: Cham, Switzerland, 2017; pp. 217–253. [Google Scholar]
  5. Jagtap, D.N.; Pawar, P.B.; Sutar, M.W.; Jadhav, M.S.; Pinjari, S.S. Response of rice to different fertiliser sources: A mini review. Farming Manag. 2018, 3, 146–152. [Google Scholar]
  6. Kandpal, G. Review on impact of chemical fertilisers on environment. Int. J. Mod. Agric. 2021, 10, 758–763. [Google Scholar]
  7. Singh, B. Are nitrogen fertilisers deleterious to soil health? Agronomy 2018, 8, 48. [Google Scholar] [CrossRef]
  8. Sharma, B.; Vaish, B.; Singh, U.K.; Singh, P.; Singh, R.P. Recycling of organic wastes in agriculture: An environmental perspective. Int. J. Environ. Res. 2019, 13, 409–429. [Google Scholar] [CrossRef]
  9. El-Ghamry, A.; Mosa, A.A.; Alshaal, T.; El-Ramady, H. Nanofertilizers vs. biofertilisers: New insights. Environ. Biodivers. Soil Secur. 2018, 2, 51–72. [Google Scholar]
  10. Sinha, D.; Banerjee, S.; Mandal, S.; Basu, A.; Banerjee, A.; Balachandran, S.; Mandal, N.C.; Chaudhury, S. Enhanced biogas production from Lantana camara via bioaugmentation of cellulolytic bacteria. Bioresour. Technol. 2021, 340, 125652. [Google Scholar] [CrossRef]
  11. Banerjee, A.; Show, B.K.; Chaudhury, S.; Balachandran, S. Biological pretreatment for enhancement of biogas production. In Cost Effective Technologies for Solid Waste and Wastewater Treatment; Elsevier: Amsterdam, The Netherlands, 2022; pp. 101–114. [Google Scholar]
  12. Show, B.K.; Banerjee, S.; Banerjee, A.; GhoshThakur, R.; Hazra, A.K.; Mandal, N.C.; Ross, A.B.; Balachandran, S.; Chaudhury, S. Insect gut bacteria: A promising tool for enhanced biogas production. Rev. Environ. Sci. Biotechnol. 2022, 21, 1–25. [Google Scholar] [CrossRef]
  13. Koley, A.; Bray, D.; Banerjee, S.; Sarhar, S.; Thahur, R.G.; Hazra, A.K.; Mandal, N.C.; Chaudhury, S.; Ross, A.B.; CamargoValero, M.A.; et al. Water Hyacinth (Eichhornia crassipes) A Sustainable Strategy for Heavy Metals Removal from Contaminated Waterbodies. In Bioremediation of Toxic Metal (Loid)s, 1st ed.; CRC Press: Boca Raton, FL, USA, 2022; pp. 95–114. [Google Scholar]
  14. Kainthola, J.; Kalamdhad, A.S.; Goud, V.V. A review on enhanced biogas production from anaerobic digestion of lignocellulosic biomass by different enhancement techniques. Process Biochem. 2019, 84, 81–90. [Google Scholar] [CrossRef]
  15. Coelho, J.J.; Hennessy, A.; Casey, I.; Bragança, C.R.S.; Woodcock, T.; Kennedy, N. Biofertilisation with anaerobic digestates: A field study of effects on soil microbial abundance and diversity. Appl. Soil Ecol. 2020, 147, 103403. [Google Scholar] [CrossRef]
  16. Bonetta, S.; Bonetta, S.; Ferretti, E.; Fezia, G.; Gilli, G.; Carraro, E. Agricultural reuse of the digestate from anaerobic co-digestion of organic waste: Microbiological contamination, metal hazards and fertilising performance. Water Air Soil Pollut. 2014, 225, 2046. [Google Scholar] [CrossRef]
  17. Sürmen, M.; Kara, E. High-Quality Fertilizers from Biogas Digestate. Environ. Clim.-Smart Food Prod. 2022, 319–347. [Google Scholar] [CrossRef]
  18. Abubaker, J.; Cederlund, H.; Arthurson, V.; Pell, M. Bacterial community structure and microbial activity in different soils amended with biogas residues and cattle slurry. Appl. Soil Ecol. 2013, 72, 171–180. [Google Scholar] [CrossRef]
  19. Alburquerque, J.A.; de la Fuente, C.; Ferrer-Costa, A.; Carrasco, L.; Cegarra, J.; Abad, M.; Bernal, M.P. Assessment of the fertiliser potential of digestates from farm and agroindustrial residues. Biomass Bioener. 2012, 40, 181–189. [Google Scholar] [CrossRef]
  20. Yan, L.; Liu, C.; Zhang, Y.; Liu, S.; Zhang, Y. Effects of C/N ratio variation in swine biogas slurry on soil dissolved organic matter: Content and fluorescence characteristics. Ecotoxicol. Environ. Saf. 2021, 209, 111804. [Google Scholar] [CrossRef] [PubMed]
  21. Kakar, K.; Nitta, Y.; Asagi, N.; Komatsuzaki, M.; Shiotsu, F.; Kokubo, T.; Xuan, T.D. Morphological analysis on comparison of organic and chemical fertilisers on grain quality of rice at different planting densities. Plant Prod. Sci. 2019, 22, 510–518. [Google Scholar] [CrossRef]
  22. Myint, A.K.; Yamakawa, T.; Zenmyo, T.; Thao, H.T.B.; Sarr, P.S. Effects of organic-manure application on growth, grain yield, and nitrogen, phosphorus, and potassium recoveries of rice variety Manawthuka in paddy soils of differing fertility. Commun. Soil Sci. Plant Anal. 2011, 42, 457–474. [Google Scholar] [CrossRef]
  23. Lipoth, S.L.; Schoenau, J.J. Copper, zinc, and cadmium accumulation in two prairie soils and crops as influenced by repeated applications of manure. J. Plant Nutr. Soil Sci. 2007, 170, 378–386. [Google Scholar] [CrossRef]
  24. Jenkins, S.N.; Waite, I.S.; Blackburn, A.; Husband, R.; Rushton, S.P.; Manning, D.C.; O’Donnell, A.G. Actinobacterial community dynamics in long term managed grasslands. Antonie Van Leeuwenhoek 2009, 95, 319–334. [Google Scholar] [CrossRef] [PubMed]
  25. Yang, Q.; Zhang, M. Effect of bio-organic fertilisers partially substituting chemical fertilisers on labile organic carbon and bacterial community of citrus orchard soils. Plant Soil 2023, 483, 255–272. [Google Scholar] [CrossRef]
  26. Ferdous, Z.; Ullah, H.; Datta, A.; Anwar, M.; Ali, A. Yield and profitability of tomato as influenced by integrated application of synthetic fertiliser and biogas slurry. Int. J. Veg. Sci. 2018, 24, 445–455. [Google Scholar] [CrossRef]
  27. Hernández, T.; Chocano, C.; Moreno, J.L.; García, C. Use of compost as an alternative to conventional inorganic fertilisers in intensive lettuce (Lactuca sativa L.) crops—Effects on soil and plant. Soil Tillage Res. 2016, 160, 14–22. [Google Scholar] [CrossRef]
  28. Ibukunoluwa Moyin-Jesu, E. Use of different organic fertilisers on soil fertility improvement, growth and head yield parameters of cabbage (Brassica oleraceae L). Int. J. Recycl. Org. Waste Agric. 2015, 4, 291–298. [Google Scholar] [CrossRef]
  29. Singh, R.J.; Ahlawat, I.P.S. Growth behaviour of transgenic cotton with peanut intercropping system using modified fertilisation technique. Proc. Natl. Acad. Sci. India Sect. B Biol. Sci. 2014, 84, 19–30. [Google Scholar] [CrossRef]
  30. Singh, R.J.; Ahlawat, I.P.S.; Kumar, K. Productivity and profitability of the transgenic cotton–wheat production system through peanut intercropping and FYM addition. Exp. Agric. 2013, 49, 321–335. [Google Scholar] [CrossRef]
  31. Moe, K.; Mg, K.W.; Win, K.K.; Yamakawa, T. Combined effect of organic manures and inorganic fertilisers on the growth and yield of hybrid rice (Palethwe-1). Am. J. Plant Sci. 2017, 8, 1022–1042. [Google Scholar] [CrossRef]
  32. Khan, A.A.; Bibi, H.H.; Ali, Z.; Sharif, M.; Shah, S.A.; Ibadullah, H.; Khan, K.; Azeem, I.; Ali, S. Effect of compost and inorganic fertilisers on yield and quality of tomato. Acad. J. Agric. Res. 2017, 5, 287–293. [Google Scholar]
  33. Scarlat, N.; Fahl, F.; Dallemand, J.F.; Monforti, F.; Motola, V. A spatial analysis of biogas potential from manure in Europe. Renew. Sustain. Energy Rev. 2018, 94, 915–930. [Google Scholar] [CrossRef]
  34. Yan, S.; Guo, J.Y. Water Hyacinth: Environmental Challenges, Management and Utilisation; CRC Press: Boca Raton, FL, USA, 2017. [Google Scholar]
  35. Van Klompenburg, T.; Kassahun, A.; Catal, C. Crop yield prediction using machine learning: A systematic literature review. Comput. Electron. Agric. 2020, 177, 105709. [Google Scholar] [CrossRef]
  36. Lingwal, S.; Bhatia, K.K.; Tomer, M.S. Image-based wheat grain classification using convolutional neural network. Multimed. Tools Appl. 2021, 80, 35441–35465. [Google Scholar] [CrossRef]
  37. Ghazvini, M.; Dehghani Madvar, M.; Ahmadi, M.H.; Rezaei, M.H.; El Haj Assad, M.; Nabipour, N.; Kumar, R. Technological assessment and modeling of energy-related CO2 emissions for the G8 countries by using hybrid IWO algorithm based on SVM. Energy Sci. Eng. 2020, 8, 1285–1308. [Google Scholar] [CrossRef]
  38. Ahmadi, M.H.; Ahmadi, M.A.; Nazari, M.A.; Mahian, O.; Ghasempour, R. A proposed model to predict thermal conductivity ratio of Al2O3/EG nanofluid by applying least squares support vector machine (LSSVM) and genetic algorithm as a connectionist approach. J. Therm. Anal. Calorim. 2019, 135, 271–281. [Google Scholar] [CrossRef]
  39. Pant, J.; Pant, R.P.; Singh, M.K.; Singh, D.P.; Pant, H. Analysis of agricultural crop yield prediction using statistical techniques of machine learning. Mater. Today Proc. 2021, 46, 10922–10926. [Google Scholar] [CrossRef]
  40. Peralta, N.R.; Assefa, Y.; Du, J.; Barden, C.J.; Ciampitti, I.A. Mid-season high-resolution satellite imagery for forecasting site-specific corn yield. Remote Sens. 2016, 8, 848. [Google Scholar] [CrossRef]
  41. Liu, B.; Asseng, S.; Müller, C.; Ewert, F.; Elliott, J.; Lobell, D.B.; Martre, P.; Ruane, A.C.; Wallach, D.; Jones, J.W.; et al. Similar estimates of temperature impacts on global wheat yield by three independent methods. Nat. Clim. Change 2016, 6, 1130–1136. [Google Scholar] [CrossRef]
  42. Safa, M.; Samarasinghe, S. Determination and modelling of energy consumption in wheat production using neural networks: “A case study in Canterbury province, New Zealand”. Energy 2011, 36, 5140–5147. [Google Scholar] [CrossRef]
  43. Pahlavan, R.; Omid, M.; Akram, A. Energy input–output analysis and application of artificial neural networks for predicting greenhouse basil production. Energy 2012, 37, 171–176. [Google Scholar] [CrossRef]
  44. Hoque, T.S.; Jahan, I.; Islam, M.R.; Ahmed, M. Performance of different organic fertilisers in improving growth and yield of boro rice. SAARC J. Agric. 2018, 16, 153–166. [Google Scholar] [CrossRef]
  45. Panja, S.; Biswas, R.; Kar, R.K.; Dey, P.C.; Dey, N. Morpho-molecular characterisation of ethnic Bora rice for conservation and breeding. Genet. Resour. Crop Evol. 2023, 70, 1853–1866. [Google Scholar] [CrossRef]
  46. Bonaccorso, G. Machine Learning Algorithms: Popular Algorithms for Data Science and Machine Learning, 2nd ed.; Packt Publishing Ltd.: Birmingham, UK, 2018. [Google Scholar]
  47. Bisong, E. More Supervised Machine Learning Techniques with Scikit-Learn; Apress: Berkeley, CA, USA, 2019; pp. 287–308. [Google Scholar]
  48. Alocilja, E.C.; Ritchie, J.T. The application of SIMOPT2: RICE to evaluate profit and yield-risk in upland-rice production. Agric. Syst. 1990, 33, 315–326. [Google Scholar] [CrossRef]
  49. Ferdous, Z.; Ullah, H.; Datta, A.; Attia, A.; Rakshit, A.; Molla, S.H. Application of biogas slurry in combination with chemical fertiliser enhances grain yield and profitability of maize (Zea mays L.). Commun. Soil Sci. Plant Anal. 2020, 51, 2501–2510. [Google Scholar] [CrossRef]
  50. Noraida, M.R.; Hisyamuddin, M.R.A. The Effect of Different Rate of Biofertilizer on the Growth Performance and Yield of Rice. In Proceedings of the International Conference on Sustainable Agriculture and Biosystem, West Sumatra, Indonesia, 25 November 2020; IOP Publishing: Bristol, UK, 2021; Volume 757, p. 012050. [Google Scholar]
  51. Hindersah, R.; Kalay, A.M.; Talahaturuson, A. Rice yield grown in different fertilizer combination and planting methods: Case study in Buru Island, Indonesia. Open Agric. 2022, 7, 871–881. [Google Scholar] [CrossRef]
  52. Chivenge, P.; Sharma, S.; Bunquin, M.A.; Hellin, J. Improving nitrogen use efficiency—A key for sustainable rice production systems. Front. Sustain. Food Syst. 2021, 5, 737412. [Google Scholar] [CrossRef]
  53. Qiu, H.; Yang, S.; Jiang, Z.; Xu, Y.; Jiao, X. Effect of irrigation and fertilizer management on rice yield and nitrogen loss: A meta-analysis. Plants 2022, 11, 1690. [Google Scholar] [CrossRef] [PubMed]
  54. Njogu, P.; Kinyua, R.; Muthoni, P.; Nemoto, Y. Biogas production using water hyacinth (Eicchornia crassipes) for electricity generation in Kenya. Energy Power Eng. 2015, 7, 209–216. [Google Scholar] [CrossRef]
  55. Bhui, I.; Mathew, A.K.; Chaudhury, S.; Balachandran, S. Influence of volatile fatty acids in different inoculum to substrate ratio and enhancement of biogas production using water hyacinth and salvinia. Bioresour. Technol. 2018, 270, 409–415. [Google Scholar] [CrossRef]
  56. Ferdous, Z.; Datta, A.; Anwar, M. Synthetic pheromone lure and apical clipping affects productivity and profitability of eggplant and cucumber. Int. J. Veg. Sci. 2018, 24, 180–192. [Google Scholar] [CrossRef]
  57. Lal, R. Restoring soil quality to mitigate soil degradation. Sustainability 2015, 7, 5875–5895. [Google Scholar] [CrossRef]
  58. Yoshida, S. Fundamental of Rice Crop Science, 1st ed.; International Rice Research Institute: Los Baños, Laguna, Philippines, 1981; p. 269. [Google Scholar]
  59. Li, R.; Li, M.; Ashraf, U.; Liu, S.; Zhang, J. Exploring the relationships between yield and yield-related traits for rice varieties released in China from 1978 to 2017. Front. Plant Sci. 2019, 10, 543. [Google Scholar] [CrossRef] [PubMed]
  60. Kumar, A.; Taparia, M.; Madapu, A.; Rajalakshmi, P.; Marathi, B.; Desai, U.B. Discrimination of filled and unfilled grains of rice panicles using thermal and RGB images. J. Cereal Sci. 2020, 95, 103037. [Google Scholar] [CrossRef]
  61. Okamura, M.; Arai-Sanoh, Y.; Yoshida, H.; Mukouyama, T.; Adachi, S.; Yabe, S.; Nakagawa, H.; Tsutsumi, K.; Taniguchi, Y.; Kobayashi, N.; et al. Characterization of high-yielding rice cultivars with different grain-filling properties to clarify limiting factors for improving grain yield. Field Crops Res. 2018, 219, 139–147. [Google Scholar] [CrossRef]
  62. Sun, Y.; Wu, Y.; Sun, Y.; Luo, Y.; Guo, C.; Li, B.; Li, F.; Xing, M.; Yang, Z.; Ma, J. Effects of water and nitrogen on grain filling characteristics, canopy microclimate with chalkiness of directly seeded rice. Agriculture 2022, 12, 122. [Google Scholar] [CrossRef]
  63. Fu, P.; Wang, J.; Zhang, T.; Huang, J.; Peng, S. High nitrogen input causes poor grain filling of spikelets at the panicle base of super hybrid rice. Field Crops Res. 2019, 244, 107635. [Google Scholar] [CrossRef]
  64. Zhao, C.; Liu, G.; Chen, Y.; Jiang, Y.; Shi, Y.; Zhao, L.; Liao, P.; Wang, W.; Xu, K.; Dai, Q.; et al. Excessive nitrogen application leads to lower rice yield and grain quality by inhibiting the grain filling of inferior grains. Agriculture 2022, 12, 962. [Google Scholar] [CrossRef]
  65. Fentie, D.B.; Abera, B.B.; Ali, H.M. Association of agronomic traits with grain yield of lowland rice (Oryza sativa L.) genotypes. Int. J. Agric. Sci. 2021, 8, 161–175. [Google Scholar]
  66. Mohanty, N.; Sekhar, M.R.; Reddy, D.M.; Sudhakar, P. Genetic variability and character association of agro-morphological and quality characters in rice. ORYZA-Int. J. Rice 2021, 49, 88–92. [Google Scholar]
  67. Chandra, B.S.; Reddy, T.D.; Ansari, N.A.; Kumar, S.S. Correlation and path analysis for yield and yield components in rice (Oryza sativa L.). Agric. Sci. Dig. 2009, 29, 45–47. [Google Scholar]
  68. Nayak, A.R.; Chaudhury, D.; Reddy, J.N. Correlation and path analysis in scented rice (Oryza satna L.). Indian. J. Agric. Res. 2001, 35, 186–189. [Google Scholar]
  69. Madhavilatha, L. Studies on Genetic Divergence and Isozyme Analysis on Rice (Oryza sativa L). M. Sc. (Ag.). Master’s Thesis, Acharya NG Ranga Agricultural University, Hyderabad, India, 2002. [Google Scholar]
  70. GhoshThakur, R.; Basu, A.; Haque, Z.; Bhattacharya, B.; GonChaudhuri, S.; Balachandran, S. Performance prediction of the Micro Solar Dome in different climatic regions of India from pilot-scale by Random Forest algorithm. Sustain. Energy Technol. Assess. 2022, 52, 102163. [Google Scholar] [CrossRef]
  71. Mariadass, D.A.; Moung, E.G.; Sufian, M.M.; Farzamnia, A. Extreme Gradient Boosting (XGBoost) Regressor and Shapley Additive Explanation for Crop Yield Prediction in Agriculture. In Proceedings of the 12th International Conference on Computer and Knowledge Engineering (ICCKE), Mashhad, Iran, 17–18 November 2022; pp. 219–224. [Google Scholar]
  72. Koduri, S.B.; Gunisetti, L.; Ramesh, C.R.; Mutyalu, K.V.; Ganesh, D. Prediction of crop production using adaboost regression method. J. Phys. Conf. Ser. 2019, 1228, 012005. [Google Scholar] [CrossRef]
  73. Zhang, Y.; Haghani, A. A gradient boosting method to improve travel time prediction. Transp. Res. Part. C Emerg. Technol. 2015, 58, 308–324. [Google Scholar] [CrossRef]
  74. Krauss, C.; Do, X.A.; Huck, N. Deep neural networks, gradient-boosted trees, random forests: Statistical arbitrage on the S&P 500. Eur. J. Oper. Res. 2017, 259, 689–702. [Google Scholar]
  75. Wang, S.R.; Sun, B. Experiment about various concentration methane pool liquid’ effect on off season yamazer’s quality and output. Kezaisheng Nengyuan (Renew. Energy Resour.) 2017, 25, 90–91. [Google Scholar]
  76. Xu, W.H.; Wang, Z.Y.; Quan, Y.M.; Ou, Y.J.; Chen, C.F. Effect of application of biogas slurry on nitrate content and nutrition quality of lettuce and romaine lettuce. Rural Eco-Environ. 2003, 19, 34–37. [Google Scholar]
  77. Zhou, J.L.; Wang, J.X.; Li, S.Z.; Zhang, X. Effects of anaerobic liquid manures on yield and quality of green pepper in organic media culture. Res. Agric. Mod. 2007, 28, 254–256. [Google Scholar]
  78. Liu, W.K.; Yang, Q.C.; Du, L. Soilless cultivation for high-quality vegetables with biogas manure in China: Feasibility and benefit analysis. Renew. Agric. Food Syst. 2009, 24, 300–307. [Google Scholar] [CrossRef]
  79. Jethva, J.M.; Gondaliya, N.; Shah, V. A review on data mining techniques for fertiliser recommendation. Int. J. Sci. Res. Comput. Sci. Eng. Inf. Technol. 2018, 3, 1386–1390. [Google Scholar]
  80. Bondre, D.A.; Mahagaonkar, S. Prediction of crop yield and fertiliser recommendation using machine learning algorithms. Int. J. Eng. Appl. Sci. Technol. 2019, 4, 371–376. [Google Scholar]
  81. Ledesma, R.D.; Valero-Mora, P.; Macbeth, G. The scree test and the number of factors: A dynamic graphics approach. Span. J. Psychol. 2015, 18, E11. [Google Scholar] [CrossRef]
Figure 1. Heatmap of % rice yield by application of different ratios of combined biofertilisers.
Sustainability 15 13706 g001
Figure 2. Relationship between grain yield and other yield attributes of rice: (A) relationship between grain yield and panicle length (cm); (B) relationship between grain yield and filled grains panicle−1; (C) relationship between grain yield and test weight (g); (D) relationship between grain yield and number of panicles pot−1.
Sustainability 15 13706 g002
Figure 3. Analysing the gradient-boosting model for rice yield prediction.
Sustainability 15 13706 g003
Figure 4. Principal component analysis (PCA): (A) scree plot of PCA; (B) variance ratio of PCA; (C) dependency plot.
Sustainability 15 13706 g004
Table 1. Different components of mixed fertiliser applied to pot-cultured rice plant (Inoculum: Substrate: NPK).
Ratio/Different Combinations of RatiosQuantity of Biogas Slurry (g)NPK (g)
Inoculum Substrate
Control000
0.5:1 CW–BF6.4413.560
1:1 CW–BF9.7410.260
1.5:1 CW–BF11.758.240
2:1 CW–BF13.16.890
3:1 CW–BF14.85.190
4:1 CW–BF15.834.170
5:1 CW–BF16.453.550
6:1 CW–BF17.012.990
7:1 CW–BF17.382.620
NPK002
0.5:1:1 CW–BF + NPK3.226.781
1:1:1 CW–BF + NPK4.875.131
1.5:1:1 CW–BF + NPK5.8754.121
2:1:1 CW–BF + NPK6.553.4451
3:1:1 CW–BF + NPK7.42.5951
4:1:1 CW–BF + NPK7.9152.0851
5:1:1 CW–BF + NPK8.2251.7751
6:1:1 CW–BF + NPK8.5051.4951
7:1:1 CW–BF + NPK8.691.311
CW–BF = cow dung–water hyacinth biofertiliser.
Table 2. Comparative Analysis of various machine-learning algorithms for predictive analysis.
ModelMSERMSEMAER2
Gradient Boosting4.902.211.810.75
Random Forest5.882.421.860.70
AdaBoost5.902.431.990.70
Tree5.992.451.830.69
MSE = mean-squared error; RMSE = root-mean-squared error; MAE = mean average error.
Table 3. Principal Component Analysis of Input Parameters.
Principal ComponentsEigenvectors and Loading Values of Dependent VariablesVariance
Substrate (g)Inoculum (g)NPK (g)
PC-1−0.0619−0.99550.07210.718
PC-20.9956−0.0667−0.06520.278
PC-3−0.0697−0.0677−0.99530.003
Disclaimer/Publisher’s Note: The statements, opinions and data contained in all publications are solely those of the individual author(s) and contributor(s) and not of MDPI and/or the editor(s). MDPI and/or the editor(s) disclaim responsibility for any injury to people or property resulting from any ideas, methods, instructions or products referred to in the content.

