
Assessing and Ranking EU Cities Based on the Development Phase of the Smart City Concept


Abstract
:1. Introduction
2. Materials and Methods
3. Results
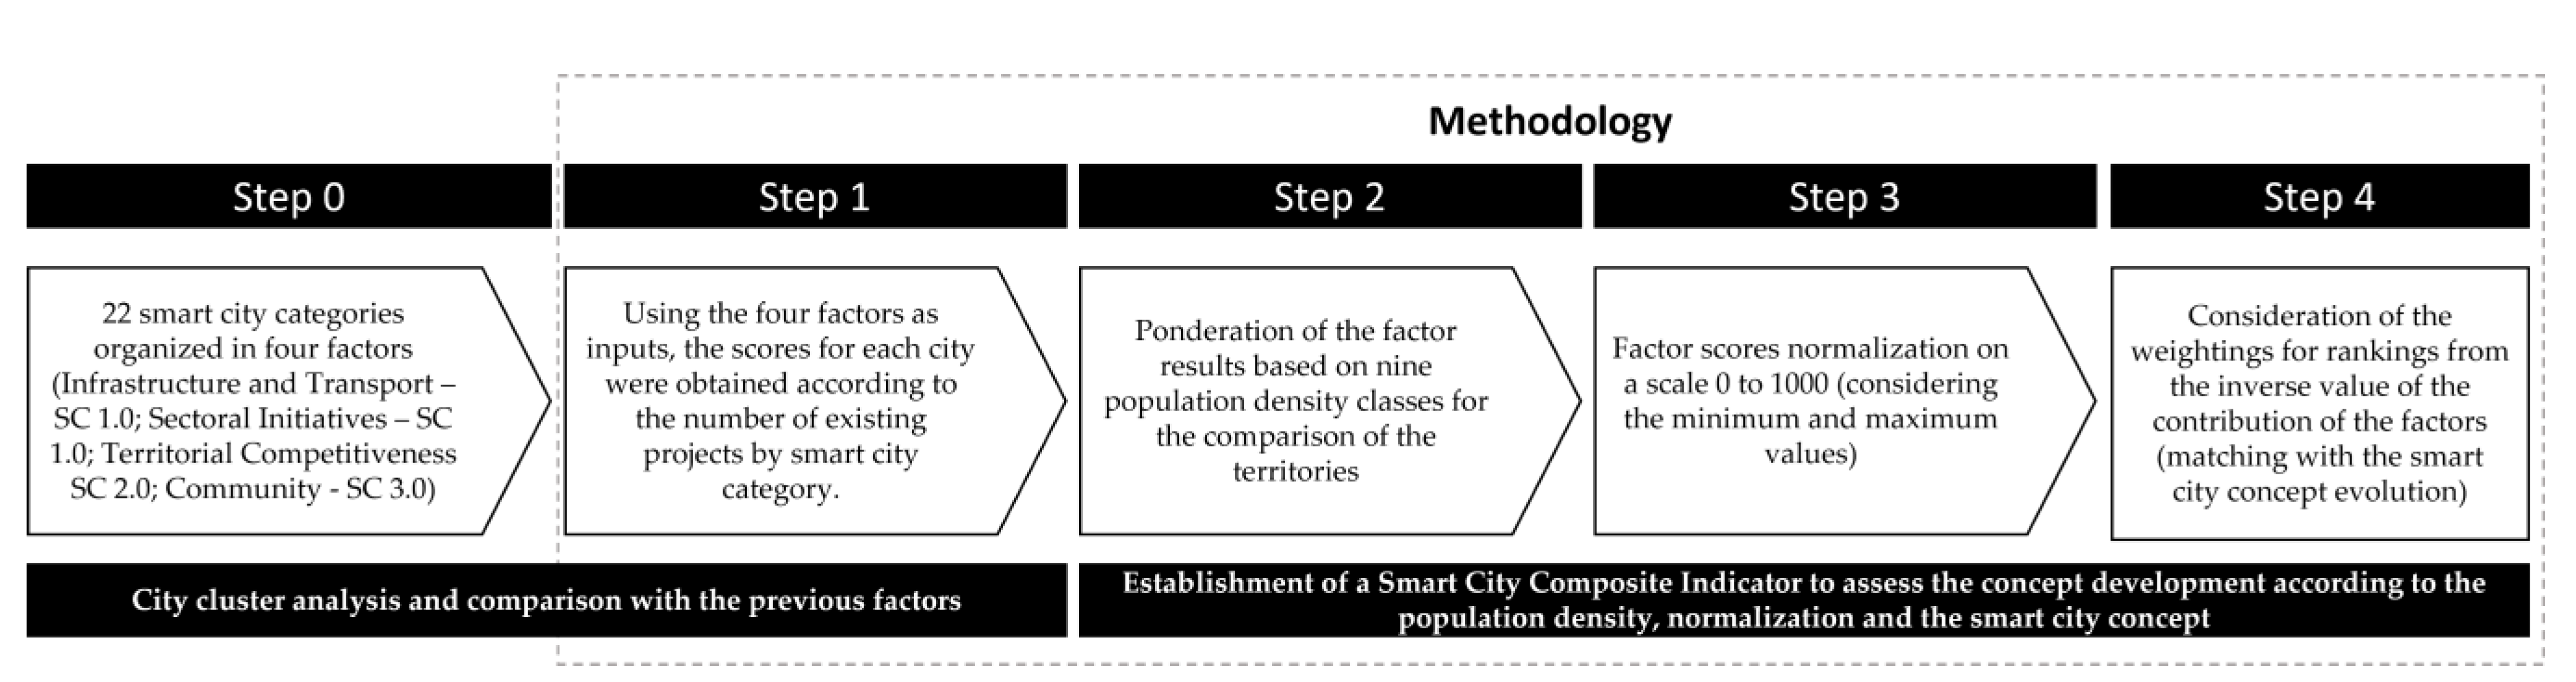
3.1. City Cluster Analysis and Factor Scores
3.1.1. Smart City Categories
- The first factor: infrastructure and transport (waste, water, air, parking, communication networks, traffic, and mobility)—Smart City 1.0.
- The second factor: sectoral initiatives (sports, health, education, and culture)—Smart City 1.0 (extended).
- The third factor: territorial competitiveness (rural and agriculture, logistics, digitalization, economy, and industry)—Smart City 2.0.
- The fourth factor: community (community participation and security and privacy)—Smart City 3.0.
- The number of existing projects in each city by category and factor can be found in Appendix A. Furthermore, Appendix A provides a table with the results of the cities for each of the European Union countries. The data presented from Table A1, Table A2, Table A3, Table A4, Table A5, Table A6, Table A7, Table A8, Table A9, Table A10, Table A11, Table A12, Table A13, Table A14, Table A15, Table A16, Table A17, Table A18, Table A19, Table A20, Table A21, Table A22, Table A23, Table A24, Table A25, Table A26 and Table A27 were organized and structured to give the possibility of comparing cities from the same country and between countries.
3.1.2. Cities Factor Analysis
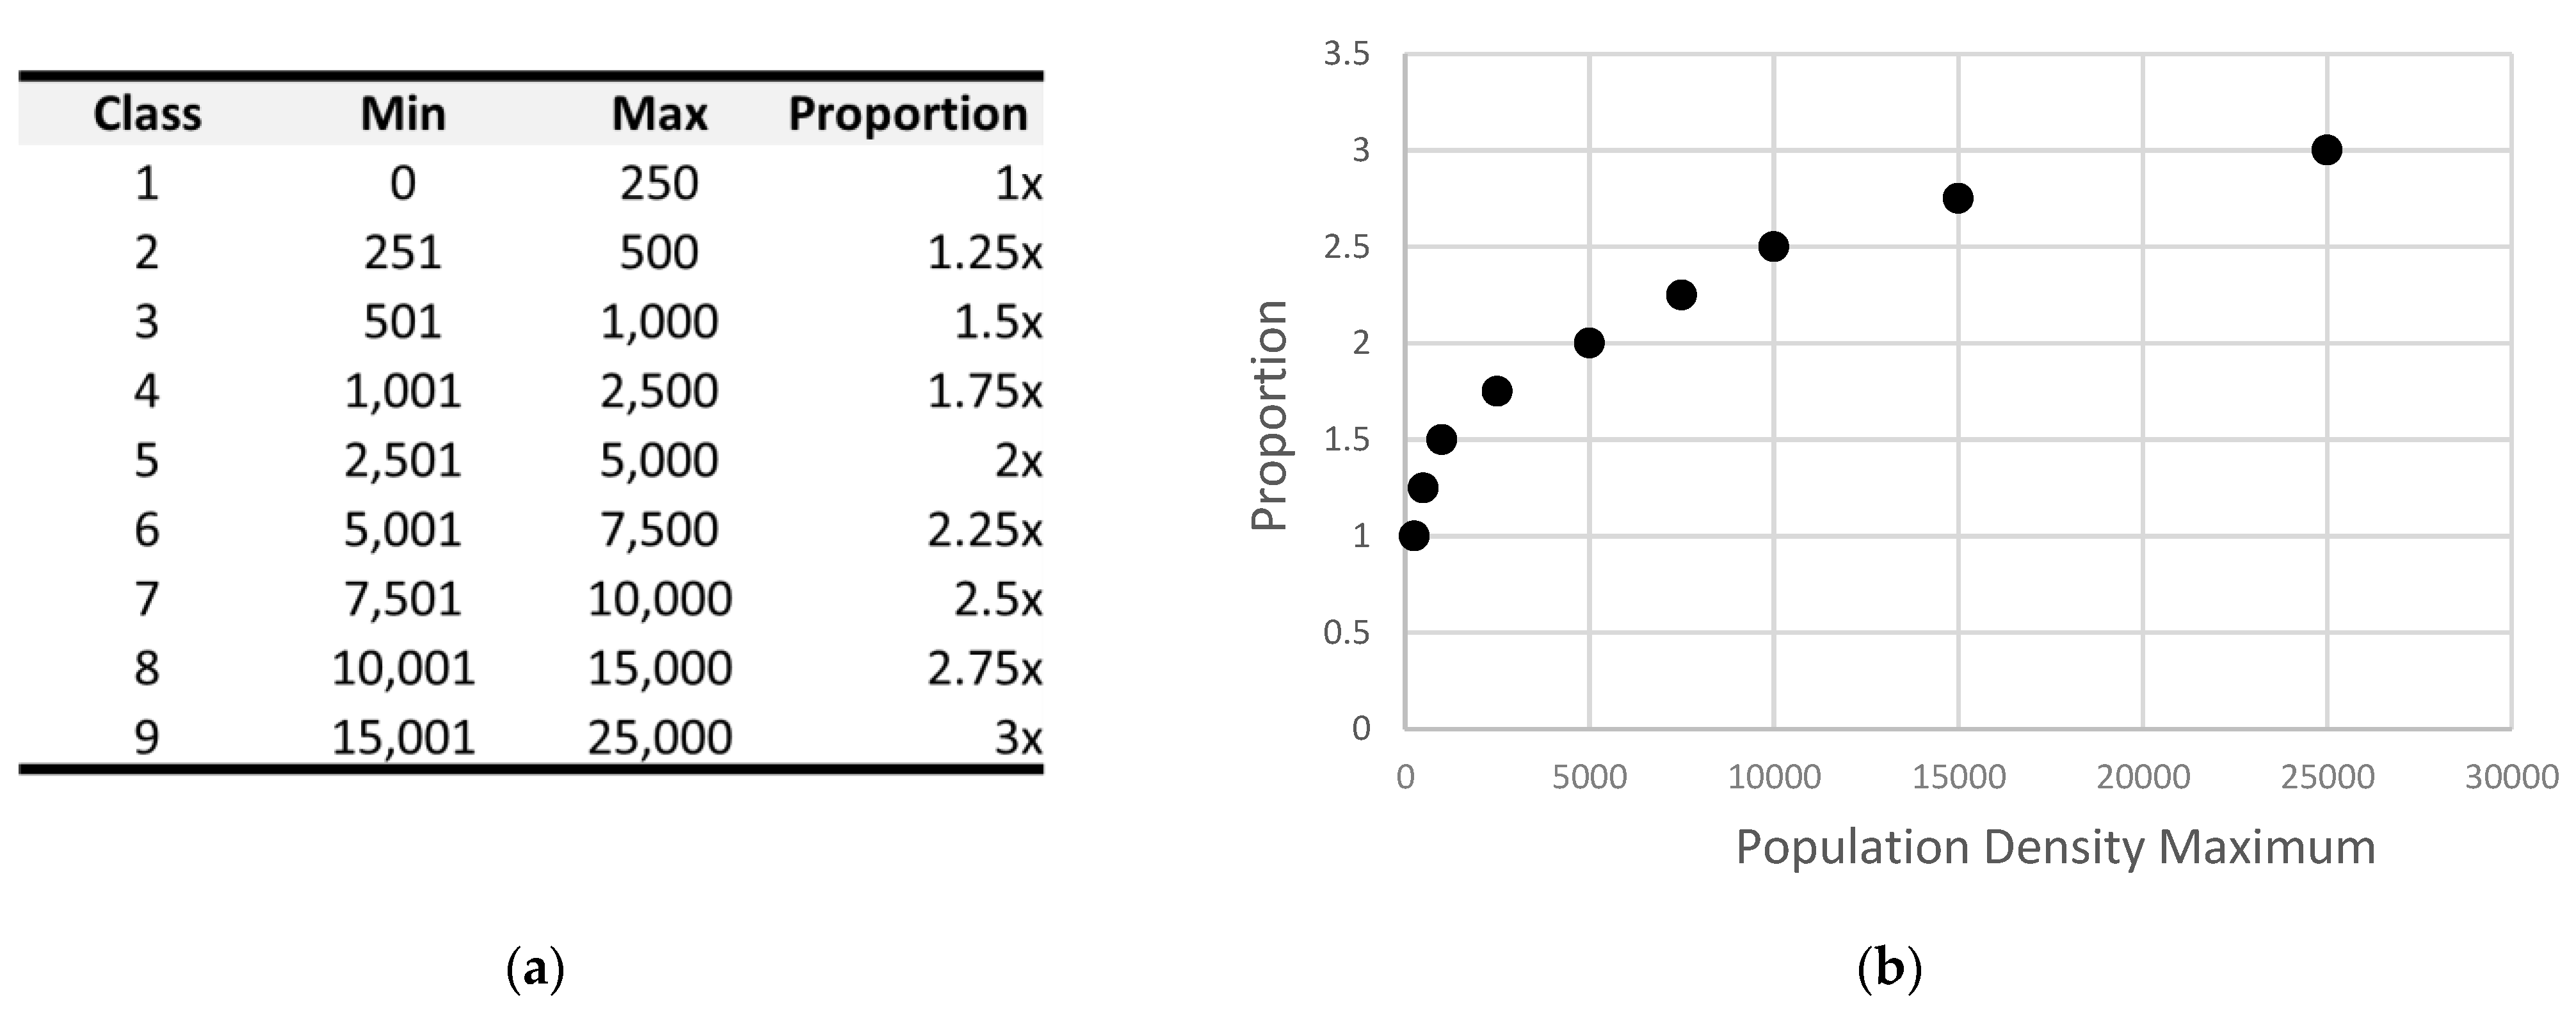
3.2. Population Density as a Proxy of the Socio-Demographic Context
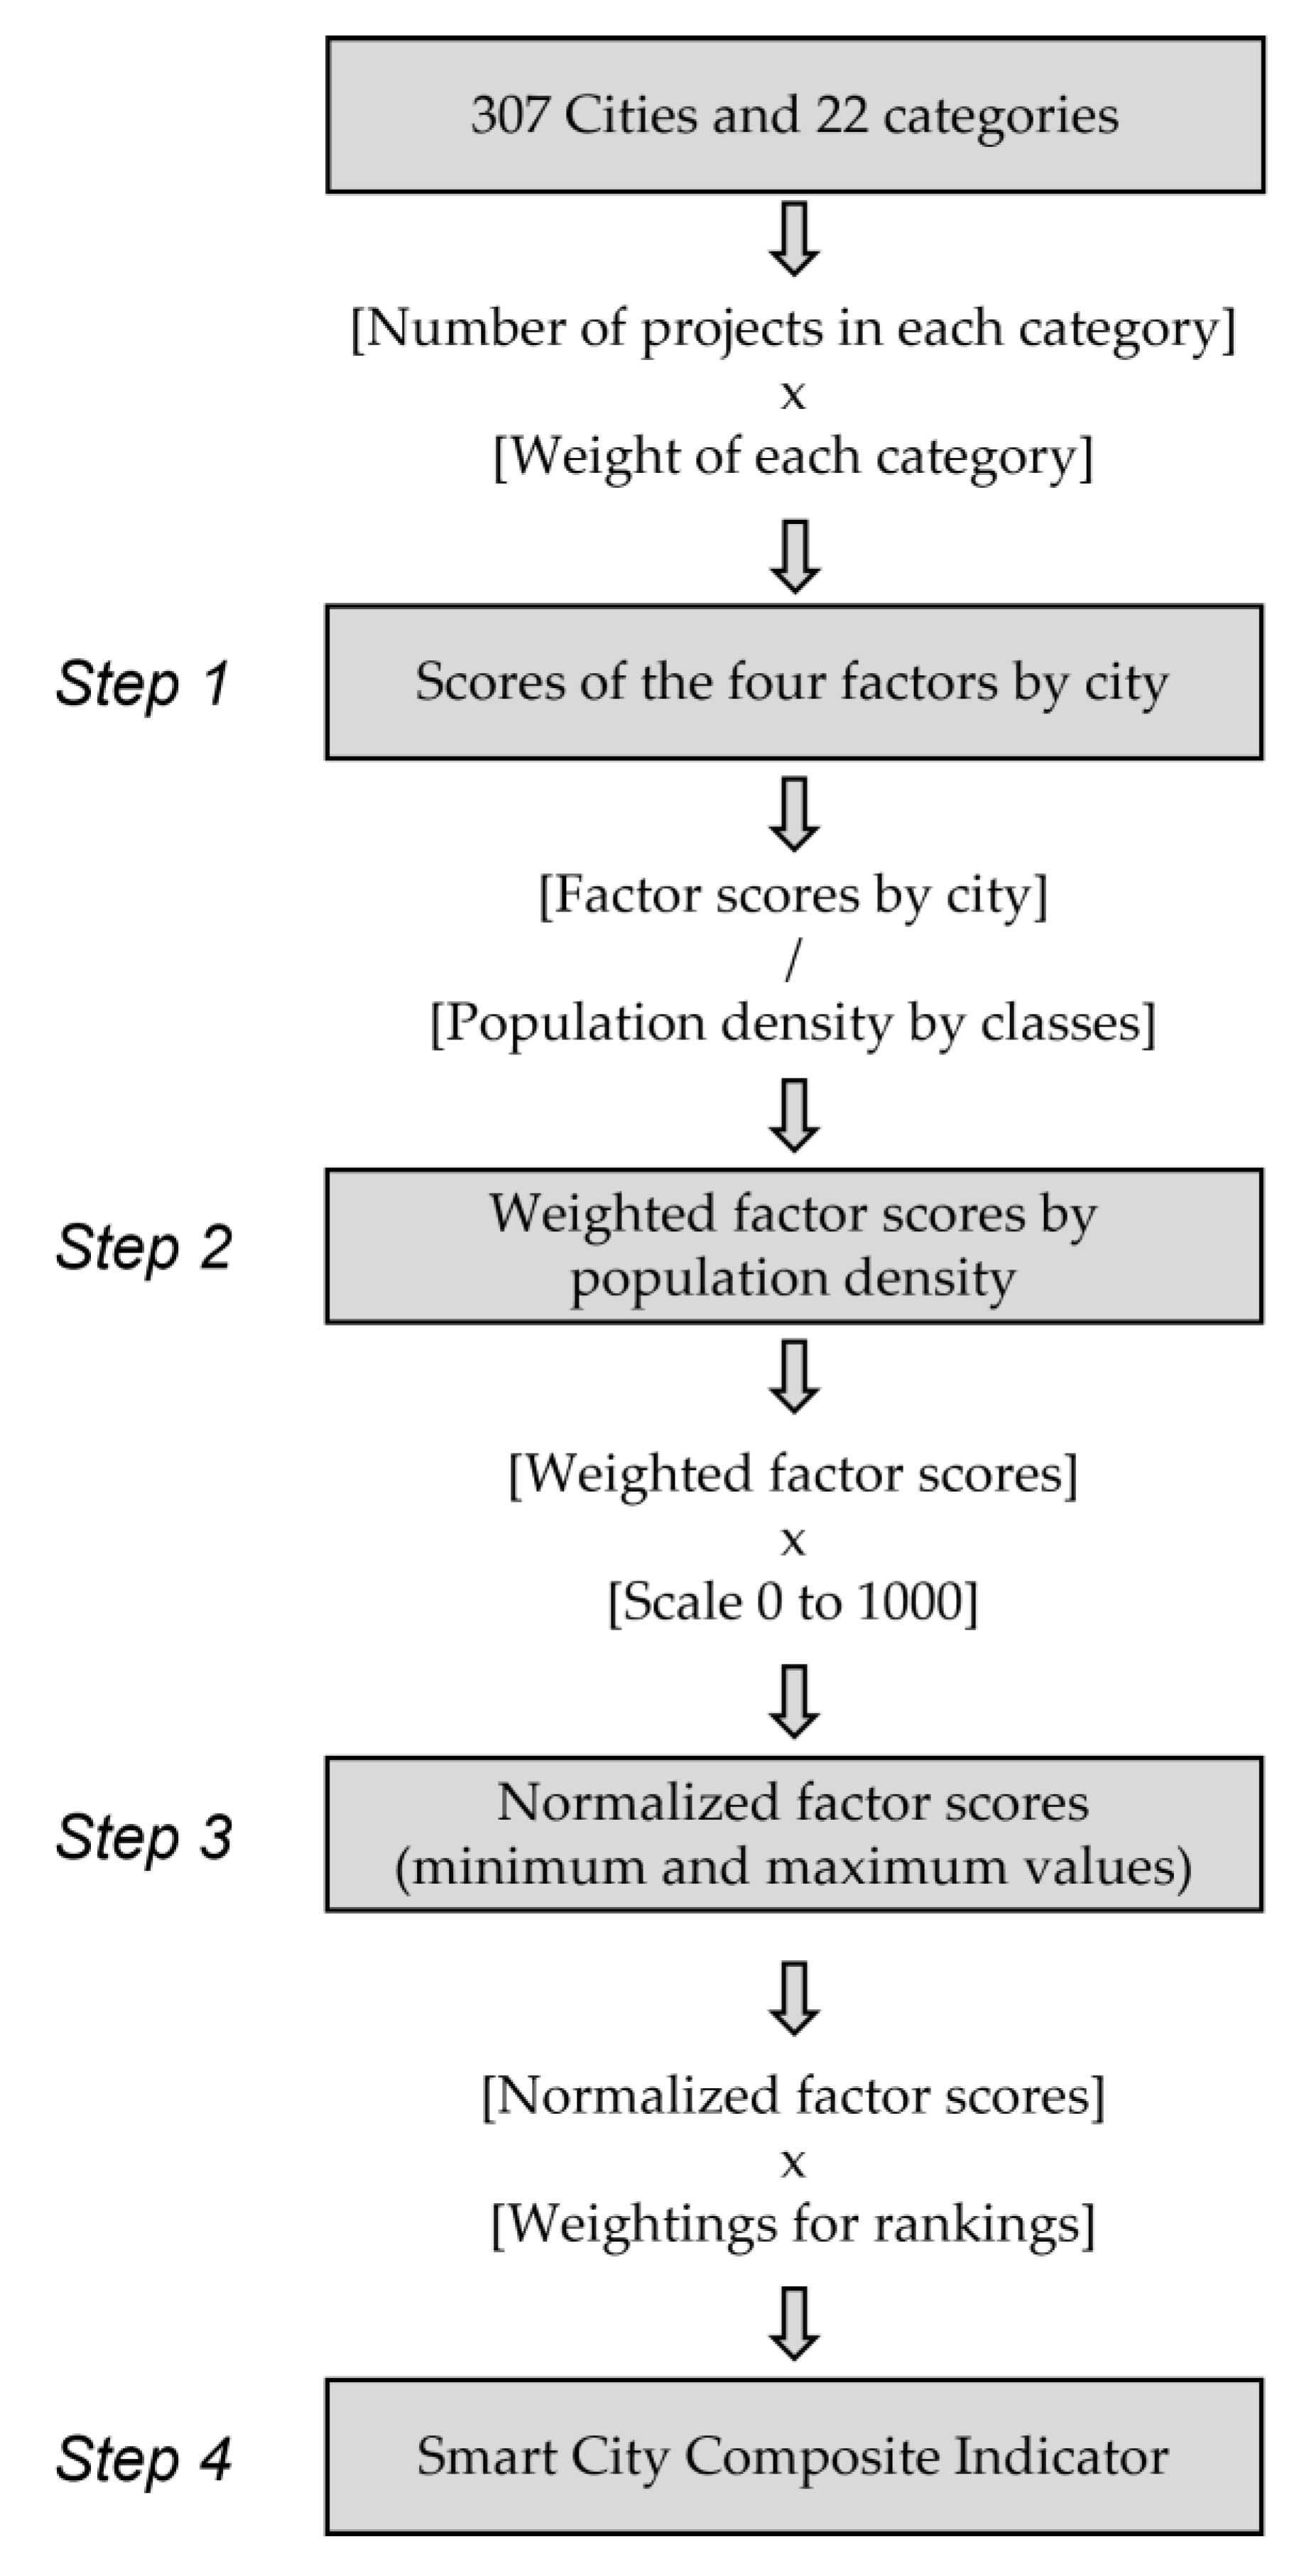
3.3. Normalization of the Factor Scores
3.4. Composite Indicator to Assess the Development Phase of the Smart City Concept
3.5. Smart City Ranking
3.6. The Example of Dublin—Application of the Methodology
4. Discussion
5. Conclusions
Author Contributions
Funding
Acknowledgments
Conflicts of Interest
Appendix A

| Austria | Population | Area (Km2) | A | B | C | D | E | F | G | H | I | J | K | L | M | N | O | P | Q | R | S | T | U | V | Total | Categories |
|---|---|---|---|---|---|---|---|---|---|---|---|---|---|---|---|---|---|---|---|---|---|---|---|---|---|---|
| Graz | 291,134 | 127.5 | 1 | 1 | 4 | 2 | 1 | 9 | 5 | |||||||||||||||||
| Innsbruck | 131,059 | 104.9 | 1 | 1 | 1 | |||||||||||||||||||||
| Linz | 206,537 | 95.99 | 1 | 1 | 1 | |||||||||||||||||||||
| Salzburg | 155,416 | 65.65 | 1 | 1 | 1 | |||||||||||||||||||||
| Vienna | 1,920,949 | 414.6 | 1 | 2 | 2 | 4 | 1 | 1 | 2 | 3 | 1 | 2 | 2 | 1 | 22 | 12 | ||||||||||
| Villach | 63,236 | 134.9 | 1 | 1 | 1 | |||||||||||||||||||||
| Total | 2 | 0 | 2 | 0 | 2 | 4 | 1 | 0 | 1 | 1 | 1 | 9 | 0 | 0 | 5 | 1 | 3 | 0 | 0 | 0 | 2 | 1 | ||||
| Cities | 2 | 0 | 1 | 0 | 1 | 1 | 1 | 0 | 1 | 1 | 1 | 5 | 0 | 0 | 2 | 1 | 2 | 0 | 0 | 0 | 1 | 1 | ||||
| Belgium | Population | Area (Km2) | A | B | C | D | E | F | G | H | I | J | K | L | M | N | O | P | Q | R | S | T | U | V | Total | Categories |
|---|---|---|---|---|---|---|---|---|---|---|---|---|---|---|---|---|---|---|---|---|---|---|---|---|---|---|
| Antwerp | 53,000 | 215 | 4 | 3 | 1 | 1 | 9 | 4 | ||||||||||||||||||
| Brussels | 122,000 | 161.4 | 1 | 1 | 1 | 1 | 4 | 4 | ||||||||||||||||||
| Flanders Region | 6,589,000 | 13,625 | 1 | 1 | 1 | 2 | 1 | 6 | 5 | |||||||||||||||||
| Ghent | 263,703 | 156 | 2 | 1 | 3 | 2 | ||||||||||||||||||||
| Knokke-Heist | 33,086 | 56.4 | 1 | 1 | 1 | |||||||||||||||||||||
| La Louvière | 80,944 | 64.2 | 1 | 1 | 1 | |||||||||||||||||||||
| Leuven | 101,032 | 56.6 | 1 | 1 | 1 | |||||||||||||||||||||
| Leuze | 13,886 | 73.53 | 1 | 1 | 1 | |||||||||||||||||||||
| Liege | 196,296 | 69.4 | 1 | 1 | 1 | |||||||||||||||||||||
| Mons | 95,705 | 147 | 3 | 3 | 1 | |||||||||||||||||||||
| Namur | 111,800 | 176 | 1 | 1 | 1 | |||||||||||||||||||||
| Seraing | 63,787 | 35.3 | 1 | 1 | 1 | |||||||||||||||||||||
| Wallonia Region | 3,648,206 | 16,844 | 2 | 2 | 1 | |||||||||||||||||||||
| Total | 5 | 4 | 4 | 0 | 3 | 0 | 0 | 1 | 0 | 0 | 0 | 1 | 0 | 0 | 4 | 1 | 4 | 1 | 1 | 0 | 5 | 0 | ||||
| Cities | 2 | 2 | 2 | 0 | 2 | 0 | 0 | 1 | 0 | 0 | 0 | 1 | 0 | 0 | 3 | 1 | 3 | 1 | 1 | 0 | 5 | 0 | ||||
| Bulgaria | Population | Area (Km2) | A | B | C | D | E | F | G | H | I | J | K | L | M | N | O | P | Q | R | S | T | U | V | Total | Categories |
|---|---|---|---|---|---|---|---|---|---|---|---|---|---|---|---|---|---|---|---|---|---|---|---|---|---|---|
| Ruse | 147,500 | 543.8 | 1 | 1 | 1 | |||||||||||||||||||||
| Sofia | 1,275,000 | 1349 | 1 | 1 | 2 | 2 | ||||||||||||||||||||
| Varna | 375,000 | 238.5 | 1 | 1 | 1 | |||||||||||||||||||||
| Total | 1 | 0 | 0 | 0 | 0 | 0 | 0 | 0 | 0 | 1 | 0 | 0 | 0 | 0 | 0 | 0 | 2 | 0 | 0 | 0 | 0 | 0 | ||||
| Cities | 1 | 0 | 0 | 0 | 0 | 0 | 0 | 0 | 0 | 1 | 0 | 0 | 0 | 0 | 0 | 0 | 2 | 0 | 0 | 0 | 0 | 0 | ||||
| Croatia | Population | Area (Km2) | A | B | C | D | E | F | G | H | I | J | K | L | M | N | O | P | Q | R | S | T | U | V | Total | Categories |
|---|---|---|---|---|---|---|---|---|---|---|---|---|---|---|---|---|---|---|---|---|---|---|---|---|---|---|
| Bol | 1694 | 23 | 1 | 1 | 1 | |||||||||||||||||||||
| Dubrovnik | 41,671 | 144 | 1 | 1 | 2 | 2 | ||||||||||||||||||||
| Koprivnica | 28,666 | 91.5 | 1 | 1 | 1 | |||||||||||||||||||||
| Osijek | 10,000 | 175 | 1 | 1 | 1 | |||||||||||||||||||||
| Rijeka | 100,000 | 43.2 | 1 | 1 | 1 | |||||||||||||||||||||
| Sisak | 40,185 | 419 | 1 | 1 | 1 | |||||||||||||||||||||
| Split | 161,312 | 79.6 | 1 | 1 | 1 | |||||||||||||||||||||
| Sveti Križ Začretje | 5660 | 40.4 | 1 | 1 | 1 | |||||||||||||||||||||
| Total | 1 | 2 | 1 | 0 | 0 | 0 | 0 | 0 | 0 | 0 | 0 | 2 | 0 | 0 | 0 | 0 | 1 | 0 | 0 | 0 | 2 | 0 | ||||
| Cities | 1 | 2 | 1 | 0 | 0 | 0 | 0 | 0 | 0 | 0 | 0 | 2 | 0 | 0 | 0 | 0 | 1 | 0 | 0 | 0 | 2 | 0 | ||||
| Cyprus | Population | Area (Km2) | A | B | C | D | E | F | G | H | I | J | K | L | M | N | O | P | Q | R | S | T | U | V | Total | Categories |
|---|---|---|---|---|---|---|---|---|---|---|---|---|---|---|---|---|---|---|---|---|---|---|---|---|---|---|
| Limassol | 101,000 | 35.09 | 2 | 1 | 3 | 2 | ||||||||||||||||||||
| Nicosia | 55,014 | 20.08 | 2 | 1 | 1 | 1 | 1 | 6 | 5 | |||||||||||||||||
| Total | 0 | 0 | 2 | 0 | 0 | 0 | 2 | 0 | 0 | 0 | 0 | 1 | 0 | 0 | 0 | 0 | 1 | 0 | 0 | 1 | 1 | 1 | ||||
| Cities | 0 | 0 | 1 | 0 | 0 | 0 | 1 | 0 | 0 | 0 | 0 | 1 | 0 | 0 | 0 | 0 | 1 | 0 | 0 | 1 | 1 | 1 | ||||
| Czech Republic | Population | Area (Km2) | A | B | C | D | E | F | G | H | I | J | K | L | M | N | O | P | Q | R | S | T | U | V | Total | Categories |
|---|---|---|---|---|---|---|---|---|---|---|---|---|---|---|---|---|---|---|---|---|---|---|---|---|---|---|
| Brno | 382,405 | 230.2 | 1 | 2 | 1 | 1 | 1 | 1 | 1 | 1 | 9 | 8 | ||||||||||||||
| Havířov | 70,165 | 32.1 | 1 | 1 | 1 | |||||||||||||||||||||
| Jeseník | 37,709 | 719 | 1 | 1 | 1 | |||||||||||||||||||||
| Karlovy Vary | 293,311 | 3315 | 1 | 1 | 1 | |||||||||||||||||||||
| Karvina | 50,902 | 57.5 | 1 | 1 | 1 | |||||||||||||||||||||
| Lovosice | 8873 | 11.89 | 1 | 1 | 1 | |||||||||||||||||||||
| Moravia Silesian | 1,192,834 | 5427 | 1 | 1 | 1 | |||||||||||||||||||||
| Ostrava | 284,982 | 214 | 1 | 1 | 1 | |||||||||||||||||||||
| Prague | 1,335,084 | 496 | 2 | 1 | 1 | 1 | 1 | 1 | 7 | 6 | ||||||||||||||||
| Uherske Hradiste | 25,001 | 21.3 | 1 | 1 | 1 | |||||||||||||||||||||
| Usti nad Labem | 91,982 | 94 | 1 | 1 | 1 | 3 | 3 | |||||||||||||||||||
| Zdarna | 800 | 10.36 | 1 | 1 | 1 | |||||||||||||||||||||
| Zlín | 74,478 | 1040 | 1 | 1 | 2 | 2 | ||||||||||||||||||||
| Total | 1 | 2 | 4 | 0 | 2 | 5 | 0 | 0 | 1 | 1 | 1 | 1 | 1 | 0 | 3 | 1 | 2 | 1 | 0 | 0 | 3 | 1 | ||||
| Cities | 1 | 1 | 3 | 0 | 2 | 5 | 0 | 0 | 1 | 1 | 1 | 1 | 1 | 0 | 3 | 1 | 2 | 1 | 0 | 0 | 3 | 1 | ||||
| Denmark | Population | Area (Km2) | A | B | C | D | E | F | G | H | I | J | K | L | M | N | O | P | Q | R | S | T | U | V | Total | Categories |
|---|---|---|---|---|---|---|---|---|---|---|---|---|---|---|---|---|---|---|---|---|---|---|---|---|---|---|
| Aalborg | 219,487 | 1144 | 1 | 1 | 1 | 3 | 3 | |||||||||||||||||||
| Aarhus | 352,751 | 468.9 | 2 | 1 | 1 | 1 | 1 | 1 | 1 | 2 | 1 | 1 | 2 | 14 | 11 | |||||||||||
| Copenhagen | 638,117 | 88.25 | 1 | 2 | 3 | 1 | 1 | 8 | 5 | |||||||||||||||||
| Odense | 205,509 | 304.3 | 1 | 1 | 1 | |||||||||||||||||||||
| Region of North Jutland | 590,439 | 7933 | 1 | 1 | 1 | |||||||||||||||||||||
| Sønderborg | 73,831 | 496.6 | 1 | 1 | 2 | 2 | ||||||||||||||||||||
| Total | 3 | 1 | 1 | 1 | 0 | 0 | 2 | 0 | 3 | 1 | 1 | 5 | 1 | 0 | 3 | 0 | 2 | 1 | 1 | 0 | 3 | 0 | ||||
| Cities | 2 | 1 | 1 | 1 | 0 | 0 | 2 | 0 | 2 | 1 | 1 | 3 | 1 | 0 | 2 | 0 | 2 | 1 | 1 | 0 | 2 | 0 | ||||
| Estonia | Population | Area (Km2) | A | B | C | D | E | F | G | H | I | J | K | L | M | N | O | P | Q | R | S | T | U | V | Total | Categories |
|---|---|---|---|---|---|---|---|---|---|---|---|---|---|---|---|---|---|---|---|---|---|---|---|---|---|---|
| Tallinn | 438,341 | 159.4 | 1 | 4 | 5 | 2 | ||||||||||||||||||||
| Tartu | 95,430 | 154 | 1 | 1 | 1 | 1 | 4 | 4 | ||||||||||||||||||
| Total | 0 | 0 | 1 | 0 | 0 | 0 | 0 | 0 | 0 | 0 | 0 | 0 | 0 | 0 | 2 | 1 | 5 | 0 | 0 | 0 | 0 | 0 | ||||
| Cities | 0 | 0 | 1 | 0 | 0 | 0 | 0 | 0 | 0 | 0 | 0 | 0 | 0 | 0 | 2 | 1 | 2 | 0 | 0 | 0 | 0 | 0 | ||||
| Finland | Population | Area (Km2) | A | B | C | D | E | F | G | H | I | J | K | L | M | N | O | P | Q | R | S | T | U | V | Total | Categories |
|---|---|---|---|---|---|---|---|---|---|---|---|---|---|---|---|---|---|---|---|---|---|---|---|---|---|---|
| Espoo | 290,000 | 312.3 | 1 | 1 | 1 | 1 | 4 | 4 | ||||||||||||||||||
| Hämeenlinna | 67,848 | 1785 | 1 | 1 | 1 | |||||||||||||||||||||
| Helsinki | 656,920 | 214.3 | 2 | 1 | 1 | 3 | 4 | 1 | 2 | 14 | 7 | |||||||||||||||
| Lohja | 45,886 | 939.1 | 1 | 1 | 1 | |||||||||||||||||||||
| Oulu | 207,327 | 2971 | 1 | 3 | 1 | 3 | 8 | 4 | ||||||||||||||||||
| Region of Häme | 170,577 | 5199 | 1 | 1 | 1 | |||||||||||||||||||||
| Tampere | 241,009 | 524.9 | 1 | 2 | 1 | 1 | 5 | 4 | ||||||||||||||||||
| Tuusula | 38,783 | 219.5 | 1 | 1 | 1 | |||||||||||||||||||||
| Vaasa | 67,551 | 364.7 | 1 | 1 | 2 | 2 | ||||||||||||||||||||
| Total | 2 | 1 | 1 | 0 | 1 | 6 | 1 | 0 | 0 | 0 | 1 | 1 | 0 | 0 | 5 | 0 | 8 | 0 | 1 | 0 | 8 | 1 | ||||
| Cities | 1 | 1 | 1 | 0 | 1 | 4 | 1 | 0 | 0 | 0 | 1 | 1 | 0 | 0 | 3 | 0 | 4 | 0 | 1 | 0 | 5 | 1 | ||||
| France | Population | Area (Km2) | A | B | C | D | E | F | G | H | I | J | K | L | M | N | O | P | Q | R | S | T | U | V | Total | Categories |
|---|---|---|---|---|---|---|---|---|---|---|---|---|---|---|---|---|---|---|---|---|---|---|---|---|---|---|
| Grenoble | 160,000 | 18.1 | 1 | 1 | 2 | 2 | ||||||||||||||||||||
| Lille | 234,475 | 34.8 | 1 | 1 | 1 | 3 | 3 | |||||||||||||||||||
| Lorraine Region | 23,547 | 2,346,000 | 1 | 1 | 1 | |||||||||||||||||||||
| Lyon | 522,969 | 47.9 | 1 | 1 | 1 | 2 | 1 | 1 | 3 | 10 | 7 | |||||||||||||||
| Marseille | 870,731 | 241 | 1 | 1 | 1 | |||||||||||||||||||||
| Nancy | 105,058 | 15 | 1 | 1 | 1 | 3 | 3 | |||||||||||||||||||
| Nantes | 318,808 | 65.2 | 1 | 1 | 1 | |||||||||||||||||||||
| Nice | 342,669 | 71.9 | 2 | 1 | 3 | 2 | ||||||||||||||||||||
| Paris | 2,165,423 | 106 | 1 | 1 | 1 | 1 | 1 | 5 | 5 | |||||||||||||||||
| Rennes | 220,488 | 50.4 | 1 | 1 | 1 | |||||||||||||||||||||
| Saint-Nazaire | 69,993 | 46.79 | 1 | 1 | 1 | |||||||||||||||||||||
| Total | 2 | 3 | 2 | 0 | 0 | 1 | 5 | 0 | 1 | 0 | 0 | 3 | 0 | 0 | 1 | 2 | 6 | 1 | 0 | 0 | 3 | 1 | ||||
| Cities | 2 | 3 | 2 | 0 | 0 | 1 | 4 | 0 | 1 | 0 | 0 | 3 | 0 | 0 | 1 | 2 | 5 | 1 | 0 | 0 | 1 | 1 | ||||
| Germany | Population | Area (Km2) | A | B | C | D | E | F | G | H | I | J | K | L | M | N | O | P | Q | R | S | T | U | V | Total | Categories |
|---|---|---|---|---|---|---|---|---|---|---|---|---|---|---|---|---|---|---|---|---|---|---|---|---|---|---|
| Augsburg | 295,830 | 146.8 | 1 | 1 | 1 | |||||||||||||||||||||
| Baden-Württemberg | 11,103,043 | 35,748 | 1 | 1 | 1 | |||||||||||||||||||||
| Berlin | 3,664,088 | 891.1 | 2 | 1 | 1 | 1 | 2 | 1 | 8 | 6 | ||||||||||||||||
| Bonn | 330,579 | 141.1 | 2 | 2 | 1 | |||||||||||||||||||||
| Brandenburg | 2,531,071 | 29654 | 1 | 1 | 1 | |||||||||||||||||||||
| Cologne | 1,086,000 | 405.2 | 1 | 1 | 1 | 1 | 4 | 4 | ||||||||||||||||||
| Darmstadt | 159,174 | 122.1 | 1 | 1 | 1 | |||||||||||||||||||||
| Dortmund | 587,696 | 280.7 | 1 | 1 | 2 | 2 | ||||||||||||||||||||
| Düsseldorf | 620,523 | 217.4 | 1 | 1 | 1 | |||||||||||||||||||||
| Erfurt | 213,692 | 269.9 | 1 | 2 | 3 | 2 | ||||||||||||||||||||
| Essen | 582,415 | 210.3 | 1 | 1 | 1 | |||||||||||||||||||||
| Frankfurt | 764,104 | 248.3 | 1 | 1 | 2 | 2 | ||||||||||||||||||||
| Freiburg | 230,940 | 153 | 1 | 1 | 1 | |||||||||||||||||||||
| Hamburg | 1,852,478 | 755.1 | 2 | 1 | 2 | 1 | 1 | 1 | 1 | 2 | 11 | 8 | ||||||||||||||
| Hannover | 536,925 | 204.3 | 1 | 1 | 1 | |||||||||||||||||||||
| Heilbronn | 126,458 | 99.9 | 1 | 1 | 1 | |||||||||||||||||||||
| Herrenberg | 31,465 | 65.71 | 1 | 1 | 1 | |||||||||||||||||||||
| Karlsruhe | 310,000 | 173.4 | 1 | 1 | 2 | 2 | ||||||||||||||||||||
| Leipzig | 595,000 | 297.8 | 1 | 1 | 2 | 2 | ||||||||||||||||||||
| Lübeck | 216,000 | 214.2 | 1 | 1 | 1 | |||||||||||||||||||||
| Ludwigsburg | 93,584 | 43.4 | 1 | 1 | 2 | 2 | ||||||||||||||||||||
| Mainau-Lake Constance | 185 | 0.448 | 1 | 1 | 1 | |||||||||||||||||||||
| Mainz | 218,578 | 97.73 | 1 | 1 | 1 | |||||||||||||||||||||
| Munich | 1,484,226 | 310.7 | 2 | 1 | 1 | 1 | 1 | 6 | 5 | |||||||||||||||||
| Nuremberg | 518,370 | 186.4 | 1 | 1 | 1 | |||||||||||||||||||||
| Regensburg | 153,094 | 80.86 | 1 | 1 | 1 | |||||||||||||||||||||
| Ruhr Valley | 10,680,783 | 4435 | 1 | 1 | 1 | 3 | 3 | |||||||||||||||||||
| Stuttgart | 635,911 | 207.3 | 1 | 1 | 2 | 2 | ||||||||||||||||||||
| Vaihingen | 28,901 | 73.41 | 1 | 1 | 2 | 2 | ||||||||||||||||||||
| Wüstenrot | 6613 | 30.02 | 1 | 1 | 1 | |||||||||||||||||||||
| Total | 4 | 3 | 5 | 1 | 3 | 3 | 4 | 2 | 1 | 2 | 1 | 5 | 1 | 0 | 7 | 3 | 8 | 1 | 5 | 1 | 7 | 0 | ||||
| Cities | 3 | 3 | 4 | 1 | 2 | 3 | 3 | 2 | 1 | 2 | 1 | 5 | 1 | 0 | 6 | 3 | 7 | 1 | 4 | 1 | 6 | 0 | ||||
| Greece | Population | Area (Km2) | A | B | C | D | E | F | G | H | I | J | K | L | M | N | O | P | Q | R | S | T | U | V | Total | Categories |
|---|---|---|---|---|---|---|---|---|---|---|---|---|---|---|---|---|---|---|---|---|---|---|---|---|---|---|
| Athens | 664,046 | 38.96 | 1 | 1 | 1 | 3 | 3 | |||||||||||||||||||
| Elefsina | 29,902 | 36.59 | 1 | 1 | 2 | 2 | ||||||||||||||||||||
| Heraklion | 173,993 | 244.6 | 1 | 1 | 1 | 1 | 1 | 5 | 5 | |||||||||||||||||
| Igoumenitsa | 25,814 | 428.4 | 1 | 1 | 1 | |||||||||||||||||||||
| Island of Kos | 33,388 | 287.2 | 1 | 1 | 1 | |||||||||||||||||||||
| Kavala | 70,501 | 35.13 | 1 | 1 | 2 | 2 | ||||||||||||||||||||
| Korydallos | 63,445 | 4320 | 1 | 1 | 1 | |||||||||||||||||||||
| Lesvos | 86,436 | 1633 | 1 | 1 | 1 | |||||||||||||||||||||
| Mykonos | 10,134 | 105.2 | 1 | 1 | 1 | |||||||||||||||||||||
| Patras | 213,984 | 334.9 | 1 | 1 | 2 | 2 | ||||||||||||||||||||
| Samos Island | 32,977 | 477.4 | 1 | 1 | 1 | |||||||||||||||||||||
| Skiathos | 6088 | 49.9 | 1 | 1 | 1 | |||||||||||||||||||||
| Thessaloniki | 325,182 | 315,196 | 1 | 1 | 2 | 1 | 1 | 6 | 5 | |||||||||||||||||
| Trikala | 81,355 | 607.6 | 1 | 1 | 1 | 1 | 1 | 1 | 2 | 8 | 7 | |||||||||||||||
| Volos | 144,449 | 385.6 | 1 | 1 | 1 | |||||||||||||||||||||
| Total | 5 | 1 | 4 | 0 | 3 | 1 | 3 | 0 | 1 | 1 | 0 | 1 | 0 | 0 | 3 | 0 | 2 | 2 | 0 | 0 | 8 | 1 | ||||
| Cities | 5 | 1 | 4 | 0 | 2 | 1 | 2 | 0 | 1 | 1 | 0 | 1 | 0 | 0 | 3 | 0 | 2 | 2 | 0 | 0 | 7 | 1 | ||||
| Hungary | Population | Area (Km2) | A | B | C | D | E | F | G | H | I | J | K | L | M | N | O | P | Q | R | S | T | U | V | Total | Categories |
|---|---|---|---|---|---|---|---|---|---|---|---|---|---|---|---|---|---|---|---|---|---|---|---|---|---|---|
| Budapest | 1,752,286 | 525.1 | 2 | 1 | 1 | 1 | 1 | 6 | 5 | |||||||||||||||||
| Miskolc | 154,521 | 972.8 | 1 | 1 | 1 | |||||||||||||||||||||
| Szeged | 160,766 | 281 | 1 | 1 | 1 | |||||||||||||||||||||
| Total | 1 | 0 | 0 | 0 | 0 | 0 | 2 | 0 | 0 | 1 | 0 | 1 | 0 | 0 | 0 | 1 | 0 | 0 | 0 | 0 | 1 | 1 | ||||
| Cities | 1 | 0 | 0 | 0 | 0 | 0 | 1 | 0 | 0 | 1 | 0 | 1 | 0 | 0 | 0 | 1 | 0 | 0 | 0 | 0 | 1 | 1 | ||||
| Ireland | Population | Area (Km2) | A | B | C | D | E | F | G | H | I | J | K | L | M | N | O | P | Q | R | S | T | U | V | Total | Categories |
|---|---|---|---|---|---|---|---|---|---|---|---|---|---|---|---|---|---|---|---|---|---|---|---|---|---|---|
| Cork City | 209,655 | 186.7 | 1 | 1 | 1 | |||||||||||||||||||||
| Dublin | 554,554 | 116.6 | 1 | 1 | 1 | 1 | 4 | 1 | 3 | 4 | 2 | 4 | 22 | 10 | ||||||||||||
| Ennis | 25,276 | 19.65 | 1 | 1 | 1 | |||||||||||||||||||||
| Limerick | 94,192 | 59.2 | 1 | 1 | 2 | 2 | ||||||||||||||||||||
| Total | 1 | 1 | 1 | 0 | 0 | 1 | 4 | 0 | 0 | 0 | 1 | 0 | 0 | 1 | 4 | 0 | 4 | 2 | 0 | 0 | 6 | 0 | ||||
| Cities | 1 | 1 | 1 | 0 | 0 | 1 | 1 | 0 | 0 | 0 | 1 | 0 | 0 | 1 | 2 | 0 | 1 | 1 | 0 | 0 | 3 | 0 | ||||
| Italy | Population | Area (Km2) | A | B | C | D | E | F | G | H | I | J | K | L | M | N | O | P | Q | R | S | T | U | V | Total | Categories |
|---|---|---|---|---|---|---|---|---|---|---|---|---|---|---|---|---|---|---|---|---|---|---|---|---|---|---|
| Altavilla Silentina | 6724 | 52 | 1 | 1 | 1 | |||||||||||||||||||||
| Apulia Region | 3,926,931 | 19,363 | 1 | 1 | 1 | |||||||||||||||||||||
| Bagheria | 53,149 | 29.7 | 1 | 1 | 1 | |||||||||||||||||||||
| Bari | 315,000 | 116 | 1 | 2 | 5 | 8 | 3 | |||||||||||||||||||
| Basilicata | 547,579 | 9992 | 1 | 1 | 2 | 2 | ||||||||||||||||||||
| Bay of Pozzuoli | 78,870 | 43.2 | 1 | 1 | 1 | |||||||||||||||||||||
| Bergamo | 119,684 | 38.8 | 1 | 1 | 1 | |||||||||||||||||||||
| Bologna | 394,463 | 141 | 1 | 1 | 1 | 1 | 1 | 2 | 1 | 8 | 7 | |||||||||||||||
| Bolzano | 107,760 | 52.3 | 3 | 3 | 1 | |||||||||||||||||||||
| Brescia | 195,102 | 90.7 | 1 | 2 | 1 | 4 | 3 | |||||||||||||||||||
| Bresso | 26,285 | 3.38 | 1 | 1 | 1 | |||||||||||||||||||||
| Cagliari | 149,474 | 134 | 2 | 3 | 1 | 3 | 1 | 4 | 14 | 6 | ||||||||||||||||
| Calabria Region | 1,877,728 | 15,080 | 1 | 1 | 2 | 2 | ||||||||||||||||||||
| Campania Region | 5,679,759 | 13,595 | 1 | 1 | 1 | 3 | 3 | |||||||||||||||||||
| Catania | 294,298 | 181 | 1 | 1 | 1 | 2 | 1 | 6 | 5 | |||||||||||||||||
| Cesena | 97,254 | 249 | 1 | 1 | 1 | |||||||||||||||||||||
| Cosenza | 65,197 | 37.2 | 1 | 1 | 1 | 3 | 3 | |||||||||||||||||||
| Cuneo | 55,980 | 120 | 1 | 1 | 1 | |||||||||||||||||||||
| Emilia-Romagna Region | 4,445,549 | 22,451 | 1 | 1 | 1 | |||||||||||||||||||||
| Florence | 359,755 | 102 | 1 | 1 | 2 | 1 | 1 | 2 | 8 | 6 | ||||||||||||||||
| Genoa | 558,930 | 239 | 1 | 1 | 1 | 1 | 4 | 4 | ||||||||||||||||||
| Gioia Tauro | 19,970 | 38 | 1 | 1 | 1 | |||||||||||||||||||||
| Glurns/Glorenza | 888 | 13 | 1 | 1 | 1 | |||||||||||||||||||||
| Iglesias | 29,075 | 207.6 | 1 | 1 | 1 | |||||||||||||||||||||
| L’Aquila | 69,941 | 473.91 | 1 | 1 | 1 | 3 | 6 | 4 | ||||||||||||||||||
| Lazio | 5,720,796 | 17203 | 1 | 1 | 1 | |||||||||||||||||||||
| Lecce | 94,000 | 238 | 1 | 1 | 2 | 2 | ||||||||||||||||||||
| Liguria | 1,509,805 | 5418 | 1 | 1 | 1 | |||||||||||||||||||||
| Lombardy Region | 9,966,992 | 23,844 | 1 | 1 | 1 | |||||||||||||||||||||
| Madonna di Campiglio | 700 | 0.73 | 1 | 1 | 1 | |||||||||||||||||||||
| Matera | 60,000 | 388 | 1 | 1 | 1 | |||||||||||||||||||||
| Merano | 40,047 | 26.34 | 1 | 1 | 1 | |||||||||||||||||||||
| Messina | 225,546 | 212 | 1 | 1 | 2 | 2 | ||||||||||||||||||||
| Milan | 1,397,715 | 182 | 2 | 1 | 1 | 3 | 1 | 1 | 3 | 1 | 1 | 3 | 1 | 3 | 21 | 12 | ||||||||||
| Modena | 187,977 | 184 | 1 | 1 | 1 | |||||||||||||||||||||
| Montieri | 1186 | 108.2 | 1 | 1 | 1 | 1 | 4 | 4 | ||||||||||||||||||
| Naples | 922,094 | 117 | 1 | 1 | 1 | |||||||||||||||||||||
| Padova | 209,730 | 92.8 | 2 | 1 | 3 | 2 | ||||||||||||||||||||
| Palermo | 637,885 | 159 | 2 | 1 | 1 | 4 | 3 | |||||||||||||||||||
| Parma | 195,988 | 261 | 1 | 1 | 1 | |||||||||||||||||||||
| Pavia | 71,122 | 62.9 | 1 | 1 | 1 | 2 | 5 | 4 | ||||||||||||||||||
| Pescara | 118,766 | 33.6 | 1 | 1 | 1 | |||||||||||||||||||||
| Piedmont | 4,273,210 | 25,399 | 1 | 2 | 3 | 2 | ||||||||||||||||||||
| Pisa | 89,969 | 187 | 1 | 1 | 2 | 2 | ||||||||||||||||||||
| Prato | 201,410 | 97.6 | 1 | 1 | 2 | 2 | ||||||||||||||||||||
| Rende | 34,511 | 54 | 1 | 1 | 1 | |||||||||||||||||||||
| Rome | 2,770,226 | 1508 | 1 | 1 | 2 | 1 | 5 | 4 | ||||||||||||||||||
| Rovereto | 33,175 | 50 | 1 | 1 | 1 | |||||||||||||||||||||
| Salerno | 129,206 | 59.2 | 1 | 1 | 2 | 2 | ||||||||||||||||||||
| Savona | 58,949 | 65.5 | 5 | 5 | 1 | |||||||||||||||||||||
| Settimo Torinese | 45,495 | 32 | 1 | 1 | 1 | |||||||||||||||||||||
| Siena | 54,195 | 119 | 1 | 1 | 1 | |||||||||||||||||||||
| South Tyrol | 1,078,460 | 13,607 | 1 | 1 | 1 | |||||||||||||||||||||
| Sulcis Iglesiente—Guspinese | 136,345 | 2117.44 | 1 | 1 | 1 | |||||||||||||||||||||
| Sutri | 5055 | 60.85 | 1 | 1 | 1 | |||||||||||||||||||||
| Syracuse | 117,053 | 204 | 1 | 1 | 2 | 2 | ||||||||||||||||||||
| Taranto | 190,717 | 310 | 1 | 1 | 1 | |||||||||||||||||||||
| Terni | 107,982 | 212 | 1 | 1 | 2 | 2 | ||||||||||||||||||||
| Trento | 118,879 | 158 | 2 | 1 | 1 | 1 | 1 | 6 | 5 | |||||||||||||||||
| Trieste | 200,609 | 84.5 | 1 | 1 | 1 | |||||||||||||||||||||
| Turin | 858,205 | 130 | 4 | 2 | 4 | 1 | 1 | 1 | 1 | 1 | 2 | 1 | 3 | 21 | 11 | |||||||||||
| Tuscany Region | 3,668,333 | 22,993 | 1 | 1 | 2 | 2 | ||||||||||||||||||||
| Vallelunga Pratameno | 3844 | 39 | 1 | 1 | 1 | |||||||||||||||||||||
| Venice | 256,083 | 457 | 1 | 1 | 1 | |||||||||||||||||||||
| Total | 12 | 8 | 23 | 1 | 5 | 8 | 6 | 4 | 4 | 17 | 4 | 31 | 4 | 2 | 18 | 7 | 17 | 4 | 3 | 1 | 18 | 0 | ||||
| Cities | 12 | 6 | 16 | 1 | 4 | 3 | 5 | 3 | 4 | 13 | 4 | 19 | 4 | 2 | 14 | 7 | 11 | 4 | 3 | 1 | 10 | 0 | ||||
| Latvia | Population | Area (Km2) | A | B | C | D | E | F | G | H | I | J | K | L | M | N | O | P | Q | R | S | T | U | V | Total | Categories |
|---|---|---|---|---|---|---|---|---|---|---|---|---|---|---|---|---|---|---|---|---|---|---|---|---|---|---|
| Jelgava | 55,517 | 60.6 | 1 | 2 | 3 | 2 | ||||||||||||||||||||
| Riga | 621,120 | 304 | 1 | 1 | 1 | 3 | 3 | |||||||||||||||||||
| Total | 0 | 1 | 1 | 1 | 0 | 0 | 2 | 0 | 0 | 0 | 0 | 0 | 0 | 0 | 0 | 0 | 0 | 0 | 0 | 0 | 1 | 0 | ||||
| Cities | 0 | 1 | 1 | 1 | 0 | 0 | 1 | 0 | 0 | 0 | 0 | 0 | 0 | 0 | 0 | 0 | 0 | 0 | 0 | 0 | 1 | 0 | ||||
| Lithuania | Population | Area (Km2) | A | B | C | D | E | F | G | H | I | J | K | L | M | N | O | P | Q | R | S | T | U | V | Total | Categories |
|---|---|---|---|---|---|---|---|---|---|---|---|---|---|---|---|---|---|---|---|---|---|---|---|---|---|---|
| Kaunas | 298,753 | 157 | 1 | 1 | 1 | |||||||||||||||||||||
| Total | 0 | 0 | 1 | 0 | 0 | 0 | 0 | 0 | 0 | 0 | 0 | 0 | 0 | 0 | 0 | 0 | 0 | 0 | 0 | 0 | 0 | 0 | ||||
| Cities | 0 | 0 | 1 | 0 | 0 | 0 | 0 | 0 | 0 | 0 | 0 | 0 | 0 | 0 | 0 | 0 | 0 | 0 | 0 | 0 | 0 | 0 | ||||
| Luxembourg | Population | Area (Km2) | A | B | C | D | E | F | G | H | I | J | K | L | M | N | O | P | Q | R | S | T | U | V | Total | Categories |
|---|---|---|---|---|---|---|---|---|---|---|---|---|---|---|---|---|---|---|---|---|---|---|---|---|---|---|
| Luxembourg | 124,509 | 51.46 | 1 | 1 | 2 | 2 | 6 | 4 | ||||||||||||||||||
| Total | 0 | 0 | 0 | 0 | 0 | 0 | 0 | 1 | 0 | 0 | 0 | 1 | 0 | 0 | 2 | 0 | 2 | 0 | 0 | 0 | 0 | 0 | ||||
| Cities | 0 | 0 | 0 | 0 | 0 | 0 | 0 | 1 | 0 | 0 | 0 | 1 | 0 | 0 | 1 | 0 | 1 | 0 | 0 | 0 | 0 | 0 | ||||
| Malta | Population | Area (Km2) | A | B | C | D | E | F | G | H | I | J | K | L | M | N | O | P | Q | R | S | T | U | V | Total | Categories |
|---|---|---|---|---|---|---|---|---|---|---|---|---|---|---|---|---|---|---|---|---|---|---|---|---|---|---|
| - | - | - | - | - | ||||||||||||||||||||||
| Total | - | - | - | - | - | - | - | - | - | - | - | - | - | - | - | - | - | - | - | - | - | - | ||||
| Cities | - | - | - | - | - | - | - | - | - | - | - | - | - | - | - | - | - | - | - | - | - | - | ||||
| Netherlands | Population | Area (Km2) | A | B | C | D | E | F | G | H | I | J | K | L | M | N | O | P | Q | R | S | T | U | V | Total | Categories |
|---|---|---|---|---|---|---|---|---|---|---|---|---|---|---|---|---|---|---|---|---|---|---|---|---|---|---|
| Amersfoort | 157,462 | 62.62 | 1 | 1 | 1 | |||||||||||||||||||||
| Amsterdam | 873,338 | 165.5 | 1 | 1 | 2 | 3 | 1 | 2 | 1 | 1 | 4 | 2 | 18 | 10 | ||||||||||||
| Apeldoorn | 164,781 | 339.9 | 1 | 1 | 1 | |||||||||||||||||||||
| Delft | 103,581 | 22.65 | 1 | 1 | 1 | |||||||||||||||||||||
| Den Bosch | 155,490 | 110 | 1 | 1 | 1 | |||||||||||||||||||||
| Eindhoven | 235,691 | 87.66 | 1 | 2 | 3 | 1 | 7 | 4 | ||||||||||||||||||
| Enschede | 159,732 | 140.8 | 2 | 2 | 1 | |||||||||||||||||||||
| Helmond | 92,627 | 53.18 | 1 | 1 | 1 | |||||||||||||||||||||
| Rotterdam | 651,631 | 217.6 | 1 | 2 | 2 | 5 | 3 | |||||||||||||||||||
| Schiedam | 79,297 | 17.82 | 1 | 1 | 1 | |||||||||||||||||||||
| Utrecht | 359,370 | 93.83 | 1 | 1 | 1 | 3 | 3 | |||||||||||||||||||
| Zaanstad | 156,901 | 73.87 | 1 | 1 | 1 | |||||||||||||||||||||
| Total | 1 | 0 | 1 | 0 | 2 | 5 | 3 | 0 | 0 | 1 | 0 | 6 | 0 | 0 | 2 | 1 | 3 | 1 | 1 | 0 | 10 | 5 | ||||
| Cities | 1 | 0 | 1 | 0 | 1 | 3 | 2 | 0 | 0 | 1 | 0 | 5 | 0 | 0 | 1 | 1 | 2 | 1 | 1 | 0 | 5 | 3 | ||||
| Poland | Population | Area (Km2) | A | B | C | D | E | F | G | H | I | J | K | L | M | N | O | P | Q | R | S | T | U | V | Total | Categories |
|---|---|---|---|---|---|---|---|---|---|---|---|---|---|---|---|---|---|---|---|---|---|---|---|---|---|---|
| Bialystok | 296,958 | 102.1 | 1 | 1 | 2 | 2 | ||||||||||||||||||||
| Bydgoszcz | 344,091 | 176 | 1 | 1 | 2 | 2 | ||||||||||||||||||||
| Czestochowa | 217,530 | 159.7 | 1 | 1 | 1 | |||||||||||||||||||||
| Gdańsk | 470,805 | 262 | 1 | 1 | 2 | 2 | ||||||||||||||||||||
| Katowice | 290,553 | 164.6 | 1 | 1 | 1 | |||||||||||||||||||||
| Krakow | 779,966 | 326.9 | 1 | 1 | 2 | 1 | 5 | 4 | ||||||||||||||||||
| Małopolska province | 3,404,863 | 15,108 | 1 | 1 | 1 | |||||||||||||||||||||
| Plock | 118,268 | 88.04 | 1 | 1 | 1 | |||||||||||||||||||||
| Poznań | 532,048 | 261.9 | 1 | 1 | 1 | |||||||||||||||||||||
| Rzeszów | 196,638 | 120.4 | 1 | 1 | 1 | |||||||||||||||||||||
| Sandomierz | 23,193 | 28.69 | 1 | 1 | 1 | |||||||||||||||||||||
| Silesian Province | 4,492,330 | 12333 | 1 | 1 | 1 | |||||||||||||||||||||
| Sosnowiec | 197,586 | 91.06 | 1 | 1 | 1 | |||||||||||||||||||||
| TriCity | 742,432 | 418.18 | 1 | 1 | 2 | 2 | ||||||||||||||||||||
| Warsaw | 1,794,166 | 517.2 | 1 | 4 | 1 | 1 | 1 | 8 | 5 | |||||||||||||||||
| Wroclaw | 641,928 | 292.8 | 1 | 2 | 3 | 2 | ||||||||||||||||||||
| Zabrze | 170,924 | 80.4 | 1 | 1 | 1 | |||||||||||||||||||||
| Zielona Góra | 140,892 | 278.3 | 1 | 1 | 1 | |||||||||||||||||||||
| Żuromin | 8941 | 11.02 | 1 | 1 | 1 | |||||||||||||||||||||
| Total | 2 | 2 | 7 | 1 | 0 | 4 | 1 | 0 | 2 | 0 | 0 | 4 | 0 | 0 | 3 | 0 | 2 | 3 | 0 | 0 | 5 | 0 | ||||
| Cities | 2 | 2 | 4 | 1 | 0 | 4 | 1 | 0 | 2 | 0 | 0 | 3 | 0 | 0 | 3 | 0 | 2 | 3 | 0 | 0 | 4 | 0 | ||||
| Portugal | Population | Area (Km2) | A | B | C | D | E | F | G | H | I | J | K | L | M | N | O | P | Q | R | S | T | U | V | Total | Categories |
|---|---|---|---|---|---|---|---|---|---|---|---|---|---|---|---|---|---|---|---|---|---|---|---|---|---|---|
| Águeda | 46,134 | 335.3 | 3 | 1 | 4 | 2 | ||||||||||||||||||||
| Algarve | 467,495 | 4996 | 1 | 1 | 1 | |||||||||||||||||||||
| Aveiro | 80,880 | 197.5 | 1 | 1 | 1 | 1 | 4 | 4 | ||||||||||||||||||
| Braga | 193,333 | 183.4 | 1 | 1 | 2 | 2 | ||||||||||||||||||||
| Bragança | 34,580 | 1174 | 1 | 1 | 2 | 2 | ||||||||||||||||||||
| Cascais | 214,134 | 97.4 | 1 | 1 | 1 | |||||||||||||||||||||
| Castelo Branco | 52,272 | 1438 | 2 | 2 | 1 | |||||||||||||||||||||
| Cávado | 438,466 | 1246 | 1 | 1 | 1 | |||||||||||||||||||||
| Coimbra | 140,796 | 319.4 | 1 | 1 | 1 | |||||||||||||||||||||
| Covilhã | 46,453 | 555.6 | 1 | 1 | 2 | 2 | ||||||||||||||||||||
| Evora | 53,568 | 1307 | 4 | 1 | 5 | 2 | ||||||||||||||||||||
| Lagoa | 23,718 | 88.3 | 1 | 1 | 1 | |||||||||||||||||||||
| Lisbon | 544,851 | 84.9 | 1 | 1 | 2 | 1 | 1 | 1 | 2 | 3 | 12 | 8 | ||||||||||||||
| Madeira | 251,060 | 313.4 | 1 | 1 | 1 | |||||||||||||||||||||
| Paredes | 84,414 | 156.8 | 1 | 1 | 2 | 2 | ||||||||||||||||||||
| Porto | 231,962 | 41.3 | 1 | 1 | 4 | 2 | 2 | 1 | 1 | 1 | 13 | 8 | ||||||||||||||
| Viana do Castelo | 85,864 | 318.6 | 1 | 1 | 1 | |||||||||||||||||||||
| Total | 1 | 5 | 8 | 0 | 1 | 1 | 6 | 2 | 2 | 6 | 0 | 8 | 1 | 0 | 4 | 2 | 0 | 1 | 1 | 0 | 5 | 1 | ||||
| Cities | 1 | 4 | 6 | 0 | 1 | 1 | 3 | 1 | 2 | 4 | 0 | 5 | 1 | 0 | 4 | 1 | 0 | 1 | 1 | 0 | 3 | 1 | ||||
| Romania | Population | Area (Km2) | A | B | C | D | E | F | G | H | I | J | K | L | M | N | O | P | Q | R | S | T | U | V | Total | Categories |
|---|---|---|---|---|---|---|---|---|---|---|---|---|---|---|---|---|---|---|---|---|---|---|---|---|---|---|
| Alba Iulia | 60,400 | 104 | 1 | 1 | 2 | 2 | ||||||||||||||||||||
| Brasov | 246,200 | 267 | 1 | 1 | 2 | 2 | ||||||||||||||||||||
| Bucharest | 1,819,419 | 238 | 1 | 1 | 1 | 3 | 3 | |||||||||||||||||||
| Cluj | 324,700 | 180 | 1 | 1 | 2 | 2 | ||||||||||||||||||||
| Galati | 227,800 | 246 | 1 | 1 | 1 | |||||||||||||||||||||
| Iasi | 303,000 | 101 | 2 | 2 | 1 | |||||||||||||||||||||
| Oradea | 187,000 | 116 | 1 | 1 | 2 | 2 | ||||||||||||||||||||
| Total | 1 | 1 | 0 | 0 | 0 | 0 | 0 | 1 | 0 | 1 | 1 | 3 | 1 | 0 | 0 | 2 | 0 | 1 | 0 | 0 | 2 | 0 | ||||
| Cities | 1 | 1 | 0 | 0 | 0 | 0 | 0 | 1 | 0 | 1 | 1 | 2 | 1 | 0 | 0 | 2 | 0 | 1 | 0 | 0 | 2 | 0 | ||||
| Slovakia | Population | Area (Km2) | A | B | C | D | E | F | G | H | I | J | K | L | M | N | O | P | Q | R | S | T | U | V | Total | Categories |
|---|---|---|---|---|---|---|---|---|---|---|---|---|---|---|---|---|---|---|---|---|---|---|---|---|---|---|
| Banská Bystrica | 76,018 | 103 | 1 | 1 | 1 | |||||||||||||||||||||
| Bratislava | 475,503 | 368 | 1 | 3 | 1 | 1 | 6 | 4 | ||||||||||||||||||
| Komárno | 32,967 | 103 | 1 | 1 | 1 | |||||||||||||||||||||
| Košice | 229,040 | 244 | 1 | 1 | 1 | |||||||||||||||||||||
| Lučenec | 25,902 | 47.8 | 1 | 1 | 2 | 2 | ||||||||||||||||||||
| Poprad | 49,855 | 63.1 | 1 | 1 | 1 | |||||||||||||||||||||
| Trenčín | 54,740 | 82 | 1 | 1 | 1 | |||||||||||||||||||||
| Žilina | 82,656 | 80 | 2 | 1 | 1 | 1 | 5 | 4 | ||||||||||||||||||
| Total | 1 | 1 | 5 | 1 | 0 | 1 | 0 | 0 | 0 | 3 | 0 | 0 | 0 | 0 | 1 | 0 | 1 | 1 | 0 | 0 | 3 | 0 | ||||
| Cities | 1 | 1 | 2 | 1 | 0 | 1 | 0 | 0 | 0 | 3 | 0 | 0 | 0 | 0 | 1 | 0 | 1 | 1 | 0 | 0 | 3 | 0 | ||||
| Slovenia | Population | Area (Km2) | A | B | C | D | E | F | G | H | I | J | K | L | M | N | O | P | Q | R | S | T | U | V | Total | Categories |
|---|---|---|---|---|---|---|---|---|---|---|---|---|---|---|---|---|---|---|---|---|---|---|---|---|---|---|
| Ljubljana | 294,464 | 275 | 1 | 1 | 1 | 3 | 3 | |||||||||||||||||||
| Logatec | 14,681 | 173 | 1 | 1 | 1 | |||||||||||||||||||||
| Total | 0 | 1 | 1 | 0 | 0 | 0 | 0 | 0 | 0 | 0 | 0 | 0 | 0 | 0 | 0 | 0 | 0 | 1 | 0 | 0 | 0 | 1 | ||||
| Cities | 0 | 1 | 1 | 0 | 0 | 0 | 0 | 0 | 0 | 0 | 0 | 0 | 0 | 0 | 0 | 0 | 0 | 1 | 0 | 0 | 0 | 1 | ||||
| Spain | Population | Area (Km2) | A | B | C | D | E | F | G | H | I | J | K | L | M | N | O | P | Q | R | S | T | U | V | Total | Categories |
|---|---|---|---|---|---|---|---|---|---|---|---|---|---|---|---|---|---|---|---|---|---|---|---|---|---|---|
| Alicante | 337,304 | 201 | 1 | 1 | 1 | 3 | 3 | |||||||||||||||||||
| Ávila | 57,949 | 231 | 1 | 1 | 2 | 2 | ||||||||||||||||||||
| Barcelona | 1,636,732 | 99.1 | 3 | 1 | 4 | 7 | 1 | 1 | 1 | 1 | 4 | 1 | 3 | 2 | 29 | 12 | ||||||||||
| Béjar | 13,403 | 45.74 | 1 | 1 | 1 | |||||||||||||||||||||
| Betanzos | 13,328 | 24.3 | 1 | 1 | 1 | |||||||||||||||||||||
| Bilbao | 346,405 | 41.4 | 1 | 1 | 1 | 1 | 1 | 5 | 5 | |||||||||||||||||
| Cartagena | 216,365 | 558 | 1 | 1 | 2 | 2 | ||||||||||||||||||||
| Castelló de la Plana | 172,589 | 111 | 1 | 1 | 1 | |||||||||||||||||||||
| Coruña | 245,468 | 37.8 | 1 | 1 | 2 | 2 | ||||||||||||||||||||
| Donostia-San Sebastián | 187,415 | 60.89 | 1 | 1 | 1 | |||||||||||||||||||||
| Elda | 52,551 | 45.8 | 1 | 1 | 1 | |||||||||||||||||||||
| Galicia | 2,695,645 | 29,574 | 1 | 1 | 2 | 4 | 3 | |||||||||||||||||||
| Girona | 101,932 | 39 | 1 | 1 | 2 | 2 | ||||||||||||||||||||
| Gran Canaria Island | 865,756 | 1560 | 1 | 1 | 1 | |||||||||||||||||||||
| Granada | 231,775 | 81.1 | 1 | 1 | 2 | 2 | ||||||||||||||||||||
| Guadalajara | 87,064 | 235 | 1 | 1 | 1 | |||||||||||||||||||||
| Huelva | 142,538 | 152 | 1 | 1 | 2 | 2 | ||||||||||||||||||||
| Huesca | 53,429 | 161 | 1 | 1 | 1 | |||||||||||||||||||||
| Jaén | 111,932 | 424 | 1 | 1 | 1 | 3 | 3 | |||||||||||||||||||
| Llíria | 22,796 | 228 | 1 | 1 | 1 | |||||||||||||||||||||
| Madrid | 3,305,408 | 606 | 4 | 1 | 6 | 1 | 2 | 1 | 1 | 1 | 1 | 1 | 3 | 22 | 11 | |||||||||||
| Malaga | 577,405 | 395 | 2 | 1 | 2 | 2 | 1 | 2 | 1 | 4 | 1 | 16 | 9 | |||||||||||||
| Murcia | 460,349 | 886 | 1 | 1 | 1 | 3 | 3 | |||||||||||||||||||
| Navarre | 661,537 | 10,390 | 1 | 1 | 1 | |||||||||||||||||||||
| Oviedo | 217,552 | 187 | 2 | 2 | 1 | |||||||||||||||||||||
| Pamplona | 203,081 | 25.1 | 1 | 1 | 1 | 3 | 3 | |||||||||||||||||||
| Rois | 106,084 | 52.9 | 1 | 1 | 1 | |||||||||||||||||||||
| San Sebastián | 188,102 | 60.9 | 1 | 1 | 2 | 2 | ||||||||||||||||||||
| Sant Cugat del Vallès | 94,012 | 48.2 | 1 | 1 | 1 | |||||||||||||||||||||
| Santander | 172,221 | 36.1 | 1 | 3 | 2 | 2 | 1 | 1 | 2 | 1 | 2 | 15 | 9 | |||||||||||||
| Santiago de Compostela | 97,858 | 220 | 1 | 1 | 2 | 2 | ||||||||||||||||||||
| Seville | 684,234 | 141 | 1 | 1 | 1 | |||||||||||||||||||||
| Soria | 39,398 | 271.8 | 1 | 1 | 1 | |||||||||||||||||||||
| Tarragona | 135,436 | 58.8 | 1 | 1 | 1 | |||||||||||||||||||||
| Valencia | 789,744 | 139 | 2 | 2 | 3 | 1 | 8 | 4 | ||||||||||||||||||
| Valladolid | 297,775 | 197 | 1 | 2 | 2 | 1 | 1 | 7 | 5 | |||||||||||||||||
| Vitoria-Gasteiz | 253,093 | 277 | 1 | 1 | 2 | 1 | 5 | 4 | ||||||||||||||||||
| Zaragoza | 675,301 | 974 | 1 | 1 | 1 | 1 | 4 | 4 | ||||||||||||||||||
| Total | 16 | 12 | 17 | 7 | 8 | 12 | 9 | 4 | 6 | 9 | 2 | 17 | 1 | 0 | 8 | 1 | 9 | 1 | 1 | 1 | 17 | 2 | ||||
| Cities | 12 | 9 | 8 | 5 | 4 | 5 | 7 | 3 | 5 | 7 | 2 | 10 | 1 | 0 | 8 | 1 | 7 | 1 | 1 | 1 | 12 | 1 | ||||
| Sweden | Population | Area (Km2) | A | B | C | D | E | F | G | H | I | J | K | L | M | N | O | P | Q | R | S | T | U | V | Total | Categories |
|---|---|---|---|---|---|---|---|---|---|---|---|---|---|---|---|---|---|---|---|---|---|---|---|---|---|---|
| Eskilstuna | 106,975 | 1100 | 1 | 1 | 1 | |||||||||||||||||||||
| Gothenburg | 583,056 | 448 | 1 | 1 | 2 | 4 | 3 | |||||||||||||||||||
| Karlshamn | 32,402 | 489 | 1 | 1 | 1 | |||||||||||||||||||||
| Linköping | 164,616 | 1428 | 1 | 1 | 1 | |||||||||||||||||||||
| Luleå | 78,549 | 2094 | 1 | 1 | 1 | |||||||||||||||||||||
| Malmö | 347,949 | 157 | 2 | 3 | 5 | 2 | ||||||||||||||||||||
| Örebro | 156,381 | 1373 | 1 | 1 | 1 | |||||||||||||||||||||
| Skellefteå | 72,840 | 6801 | 2 | 1 | 3 | 2 | ||||||||||||||||||||
| Stockholm | 975,551 | 187 | 1 | 1 | 2 | 2 | 2 | 1 | 9 | 6 | ||||||||||||||||
| Uppsala | 233,389 | 2182 | 1 | 1 | 2 | 2 | ||||||||||||||||||||
| Växjö | 94,859 | 1665 | 1 | 1 | 2 | 2 | ||||||||||||||||||||
| Total | 4 | 2 | 1 | 0 | 1 | 2 | 0 | 1 | 0 | 0 | 0 | 9 | 2 | 0 | 2 | 1 | 3 | 0 | 0 | 0 | 2 | 0 | ||||
| Cities | 3 | 1 | 1 | 0 | 1 | 2 | 0 | 1 | 0 | 0 | 0 | 5 | 1 | 0 | 1 | 1 | 3 | 0 | 0 | 0 | 2 | 0 | ||||
Appendix B
| N | City | Country | Projects | Density (People/km2) | Class | Factor 1 | Factor 2 | Factor 3 | Factor 4 | Ranking |
|---|---|---|---|---|---|---|---|---|---|---|
| 1 | Dublin | Ireland | 22 | 4756.038 | 5 | 869 | 1000 | 979 | 1000 | 907 |
| 2 | Vienna | Austria | 22 | 4633.259 | 5 | 898 | 976 | 1000 | 938 | 889 |
| 3 | Turin | Italy | 21 | 6601.577 | 6 | 790 | 855 | 837 | 755 | 742 |
| 4 | Madrid | Spain | 22 | 5454.469 | 6 | 945 | 906 | 792 | 713 | 726 |
| 5 | Barcelona | Spain | 29 | 16515.96 | 9 | 872 | 713 | 738 | 872 | 723 |
| 6 | Aarhus | Denmark | 14 | 752.2947 | 3 | 779 | 923 | 837 | 638 | 714 |
| 7 | Milan | Italy | 21 | 7679.753 | 7 | 691 | 741 | 794 | 655 | 668 |
| 8 | Amsterdam | Netherlands | 18 | 5276.967 | 6 | 635 | 640 | 653 | 840 | 662 |
| 9 | Trikala | Greece | 8 | 133.8957 | 1 | 679 | 698 | 734 | 709 | 656 |
| 10 | Cagliari | Italy | 14 | 1115.478 | 4 | 594 | 970 | 649 | 619 | 646 |
| 11 | Oulu | Finland | 8 | 69.78357 | 1 | 750 | 584 | 521 | 907 | 631 |
| 12 | Helsinki | Finland | 14 | 3065.422 | 5 | 539 | 635 | 733 | 607 | 604 |
| 13 | Antwerp | Belgium | 9 | 246.5116 | 1 | 1000 | 779 | 617 | 584 | 597 |
| 14 | Malaga | Spain | 16 | 1461.785 | 4 | 944 | 831 | 605 | 501 | 572 |
| 15 | Santander | Spain | 15 | 4770.665 | 5 | 815 | 523 | 443 | 577 | 480 |
| 16 | Thessaloniki | Greece | 6 | 1.031682 | 1 | 559 | 503 | 460 | 574 | 473 |
| 17 | Hamburg | Germany | 11 | 2453.288 | 4 | 590 | 485 | 438 | 578 | 464 |
| 18 | Lisbon | Portugal | 12 | 6417.562 | 6 | 382 | 606 | 505 | 336 | 421 |
| 19 | Graz | Austria | 9 | 2283.404 | 4 | 415 | 589 | 526 | 283 | 407 |
| 20 | Evora | Portugal | 5 | 40.98546 | 1 | 409 | 550 | 504 | 305 | 399 |
| 21 | Porto | Portugal | 13 | 5616.513 | 6 | 536 | 490 | 344 | 453 | 388 |
| 22 | L’Aquila | Italy | 6 | 147.5829 | 1 | 586 | 635 | 428 | 259 | 378 |
| 23 | Brno | Czech Republic | 9 | 1661.186 | 4 | 513 | 433 | 388 | 390 | 369 |
| 24 | Tampere | Finland | 5 | 459.1522 | 2 | 262 | 283 | 355 | 502 | 361 |
| 25 | Flanders Region | Belgium | 6 | 483.5963 | 2 | 405 | 430 | 462 | 299 | 360 |
| 26 | Galicia | Spain | 4 | 91.14915 | 1 | 334 | 388 | 433 | 285 | 335 |
| 27 | Eindhoven | Netherlands | 7 | 2688.695 | 5 | 238 | 296 | 306 | 418 | 316 |
| 28 | Berlin | Germany | 8 | 4111.871 | 5 | 359 | 352 | 391 | 285 | 314 |
| 29 | Florence | Italy | 8 | 3527.01 | 5 | 359 | 330 | 356 | 316 | 308 |
| 30 | Águeda | Portugal | 4 | 137.5902 | 1 | 353 | 443 | 405 | 188 | 302 |
| 31 | Stockholm | Sweden | 9 | 5216.85 | 6 | 275 | 470 | 412 | 161 | 298 |
| 32 | Bologna | Italy | 8 | 2797.61 | 5 | 337 | 421 | 351 | 242 | 297 |
| 33 | Catania | Italy | 6 | 1625.956 | 4 | 262 | 322 | 348 | 299 | 295 |
| 34 | Vitoria-Gasteiz | Spain | 5 | 913.6931 | 3 | 253 | 328 | 347 | 294 | 294 |
| 35 | Trento | Italy | 6 | 752.3987 | 3 | 310 | 513 | 388 | 140 | 291 |
| 36 | Lyon | France | 10 | 10,917.93 | 8 | 335 | 284 | 266 | 370 | 286 |
| 37 | Valladolid | Spain | 7 | 1511.548 | 4 | 399 | 266 | 308 | 326 | 284 |
| 38 | Luxembourg | Luxembourg | 6 | 2419.53 | 4 | 247 | 383 | 368 | 191 | 275 |
| 39 | Prague | Czech Republic | 7 | 2691.702 | 5 | 253 | 409 | 356 | 159 | 265 |
| 40 | Warsaw | Poland | 8 | 3468.998 | 5 | 413 | 355 | 283 | 247 | 265 |
| 41 | Bari | Italy | 8 | 2715.517 | 5 | 368 | 413 | 329 | 166 | 262 |
| 42 | Copenhagen | Denmark | 8 | 7230.788 | 6 | 312 | 288 | 367 | 185 | 257 |
| 43 | Savona | Italy | 5 | 899.9847 | 3 | 273 | 379 | 361 | 139 | 255 |
| 44 | Munich | Germany | 6 | 4777.039 | 5 | 227 | 299 | 312 | 210 | 246 |
| 45 | Nicosia | Cyprus | 6 | 2739.741 | 5 | 192 | 160 | 286 | 311 | 245 |
| 46 | Brussels | Belgium | 4 | 755.886 | 3 | 156 | 247 | 321 | 229 | 244 |
| 47 | Bratislava | Slovakia | 6 | 1292.128 | 4 | 337 | 376 | 248 | 198 | 237 |
| 48 | Pavia | Italy | 5 | 1130.715 | 4 | 246 | 295 | 232 | 264 | 236 |
| 49 | Heraklion | Greece | 5 | 711.3369 | 3 | 328 | 267 | 247 | 250 | 234 |
| 50 | Rome | Italy | 5 | 1837.02 | 4 | 237 | 315 | 260 | 219 | 234 |
| 51 | Tallinn | Estonia | 5 | 2749.944 | 5 | 151 | 249 | 331 | 189 | 233 |
| 52 | Budapest | Hungary | 6 | 3337.052 | 5 | 243 | 215 | 182 | 348 | 233 |
| 53 | Tartu | Estonia | 4 | 619.6753 | 3 | 167 | 302 | 336 | 127 | 224 |
| 54 | Krakow | Poland | 5 | 2385.947 | 4 | 249 | 297 | 291 | 165 | 223 |
| 55 | Espoo | Finland | 4 | 928.5943 | 3 | 186 | 300 | 271 | 188 | 223 |
| 56 | Piedmont | Italy | 3 | 168.2432 | 1 | 307 | 319 | 251 | 168 | 216 |
| 57 | Malmö | Sweden | 5 | 2216.236 | 4 | 272 | 289 | 256 | 168 | 211 |
| 58 | Rotterdam | Netherlands | 5 | 2994.628 | 5 | 161 | 155 | 170 | 317 | 204 |
| 59 | Valencia | Spain | 8 | 5681.612 | 6 | 363 | 305 | 229 | 151 | 202 |
| 60 | Žilina | Slovakia | 5 | 1033.2 | 4 | 269 | 242 | 221 | 187 | 196 |
| 61 | Aveiro | Portugal | 4 | 409.519 | 2 | 343 | 197 | 241 | 159 | 187 |
| 62 | Brescia | Italy | 4 | 2151.069 | 4 | 123 | 298 | 276 | 86 | 187 |
| 63 | Zaragoza | Spain | 4 | 693.3275 | 3 | 239 | 177 | 214 | 205 | 187 |
| 64 | Wallonia Region | Belgium | 2 | 216.5879 | 1 | 123 | 256 | 229 | 119 | 174 |
| 65 | Erfurt | Germany | 3 | 791.7451 | 3 | 106 | 152 | 279 | 116 | 170 |
| 66 | Basilicata | Italy | 2 | 54.80174 | 1 | 122 | 117 | 234 | 176 | 169 |
| 67 | Zlín | Czech Republic | 2 | 71.61346 | 1 | 167 | 154 | 137 | 248 | 169 |
| 68 | Campania Region | Italy | 3 | 417.7829 | 2 | 229 | 266 | 174 | 138 | 166 |
| 69 | Cologne | Germany | 4 | 2680.158 | 5 | 145 | 149 | 195 | 186 | 165 |
| 70 | Uppsala | Sweden | 2 | 106.961 | 1 | 174 | 174 | 197 | 164 | 164 |
| 71 | Jaén | Spain | 3 | 263.9906 | 2 | 168 | 307 | 219 | 68 | 164 |
| 72 | Gothenburg | Sweden | 4 | 1301.464 | 4 | 215 | 213 | 207 | 127 | 163 |
| 73 | Covilhã | Portugal | 2 | 83.60871 | 1 | 127 | 172 | 256 | 108 | 163 |
| 74 | Sønderborg | Denmark | 2 | 148.673 | 1 | 142 | 241 | 221 | 101 | 163 |
| 75 | Skellefteå | Sweden | 3 | 10.71019 | 1 | 349 | 258 | 174 | 115 | 160 |
| 76 | Växjö | Sweden | 2 | 56.97237 | 1 | 122 | 175 | 229 | 119 | 159 |
| 77 | Murcia | Spain | 3 | 519.5813 | 3 | 194 | 141 | 122 | 232 | 156 |
| 78 | Vaasa | Finland | 2 | 185.2235 | 1 | 184 | 179 | 164 | 152 | 150 |
| 79 | Aalborg | Denmark | 3 | 191.8593 | 1 | 323 | 227 | 199 | 78 | 149 |
| 80 | Wroclaw | Poland | 3 | 2192.377 | 4 | 142 | 172 | 127 | 182 | 145 |
| 81 | Mons | Belgium | 3 | 651.0544 | 3 | 189 | 235 | 186 | 84 | 144 |
| 82 | Usti nad Labem | Czech Republic | 3 | 978.5319 | 3 | 190 | 172 | 112 | 187 | 143 |
| 83 | Bilbao | Spain | 5 | 8367.271 | 7 | 177 | 198 | 146 | 138 | 142 |
| 84 | Tuscany Region | Italy | 2 | 159.5413 | 1 | 210 | 199 | 154 | 126 | 142 |
| 85 | Genoa | Italy | 4 | 2338.619 | 4 | 206 | 231 | 163 | 100 | 142 |
| 86 | Vaihingen | Germany | 2 | 393.693 | 2 | 72 | 164 | 233 | 71 | 139 |
| 87 | Ljubljana | Slovenia | 3 | 1070.778 | 4 | 109 | 122 | 135 | 185 | 138 |
| 88 | Nice | France | 3 | 4765.911 | 5 | 75 | 96 | 147 | 190 | 138 |
| 89 | Bragança | Portugal | 2 | 29.45486 | 1 | 169 | 249 | 155 | 88 | 137 |
| 90 | Ávila | Spain | 2 | 250.8615 | 1 | 169 | 249 | 155 | 88 | 137 |
| 91 | Calabria Region | Italy | 2 | 124.5178 | 1 | 131 | 73 | 278 | 61 | 136 |
| 92 | Paris | France | 5 | 20428.52 | 9 | 125 | 153 | 171 | 123 | 136 |
| 93 | Ruhr Valley | Germany | 3 | 2408.294 | 4 | 153 | 166 | 165 | 117 | 135 |
| 94 | Dubrovnik | Croatia | 2 | 289.3819 | 2 | 138 | 138 | 156 | 131 | 131 |
| 95 | Bolzano | Italy | 3 | 2060.421 | 4 | 138 | 193 | 182 | 72 | 129 |
| 96 | Alicante | Spain | 3 | 1678.129 | 4 | 135 | 136 | 168 | 110 | 127 |
| 97 | Lecce | Italy | 2 | 394.958 | 2 | 75 | 193 | 200 | 47 | 125 |
| 98 | Utrecht | Netherlands | 3 | 3830.012 | 5 | 114 | 119 | 126 | 156 | 124 |
| 99 | Ghent | Belgium | 3 | 1690.404 | 4 | 179 | 85 | 99 | 189 | 122 |
| 100 | Palermo | Italy | 4 | 4011.855 | 5 | 189 | 184 | 164 | 62 | 120 |
| 101 | Naples | Italy | 4 | 7881.145 | 7 | 129 | 197 | 143 | 76 | 118 |
| 102 | Cosenza | Italy | 3 | 1752.608 | 4 | 162 | 188 | 123 | 98 | 118 |
| 103 | Limassol | Cyprus | 3 | 2878.313 | 5 | 132 | 162 | 124 | 111 | 117 |
| 104 | Riga | Latvia | 3 | 2043.158 | 4 | 173 | 160 | 108 | 124 | 116 |
| 105 | Jelgava | Latvia | 3 | 916.1221 | 3 | 223 | 54 | 81 | 195 | 113 |
| 106 | Sofia | Bulgaria | 2 | 945.1446 | 3 | 114 | 114 | 129 | 109 | 108 |
| 107 | Pisa | Italy | 2 | 481.1176 | 2 | 72 | 240 | 94 | 75 | 107 |
| 108 | Syracuse | Italy | 2 | 573.7892 | 3 | 126 | 115 | 82 | 148 | 106 |
| 109 | Paredes | Portugal | 2 | 538.3546 | 3 | 126 | 115 | 82 | 148 | 106 |
| 110 | Kavala | Greece | 2 | 2006.86 | 4 | 76 | 103 | 112 | 124 | 104 |
| 111 | Alba Iulia | Romania | 2 | 580.7692 | 3 | 59 | 174 | 165 | 21 | 100 |
| 112 | Nancy | France | 3 | 7003.867 | 6 | 108 | 102 | 119 | 97 | 98 |
| 113 | Bonn | Germany | 2 | 2342.87 | 4 | 68 | 145 | 128 | 68 | 98 |
| 114 | Cluj | Romania | 2 | 1803.889 | 4 | 78 | 100 | 103 | 115 | 97 |
| 115 | Terni | Italy | 2 | 509.3491 | 3 | 129 | 128 | 110 | 84 | 96 |
| 116 | Patras | Greece | 2 | 638.9489 | 3 | 141 | 78 | 76 | 140 | 94 |
| 117 | Santiago de Compostela | Spain | 2 | 444.8091 | 2 | 169 | 146 | 109 | 63 | 93 |
| 118 | Hämeenlinna | Finland | 1 | 38.01008 | 1 | 56 | 90 | 132 | 80 | 93 |
| 119 | South Tyrol | Italy | 1 | 79.25773 | 1 | 56 | 90 | 132 | 80 | 93 |
| 120 | Karlshamn | Sweden | 1 | 66.26176 | 1 | 56 | 90 | 132 | 80 | 93 |
| 121 | Moravia Silesian | Czech Republic | 1 | 219.7962 | 1 | 56 | 90 | 132 | 80 | 93 |
| 122 | Leipzig | Germany | 2 | 1997.985 | 4 | 84 | 106 | 103 | 97 | 93 |
| 123 | Ludwigsburg | Germany | 2 | 2156.313 | 4 | 79 | 136 | 123 | 58 | 91 |
| 124 | Padova | Italy | 3 | 2260.022 | 4 | 197 | 145 | 96 | 65 | 90 |
| 125 | Braga | Portugal | 2 | 1054.16 | 4 | 89 | 92 | 94 | 106 | 90 |
| 126 | Region of North Jutland | Denmark | 1 | 74.42821 | 1 | 30 | 53 | 159 | 66 | 89 |
| 127 | Montieri | Italy | 1 | 10.96118 | 1 | 74 | 90 | 62 | 138 | 89 |
| 128 | Korydallos | Greece | 1 | 14.68634 | 1 | 74 | 90 | 62 | 138 | 89 |
| 129 | Region of Häme | Finland | 1 | 32.80958 | 1 | 74 | 90 | 62 | 138 | 89 |
| 130 | Linköping | Sweden | 1 | 115.2773 | 1 | 74 | 90 | 62 | 138 | 89 |
| 131 | Samos Island | Greece | 1 | 69.07625 | 1 | 74 | 90 | 62 | 138 | 89 |
| 132 | Island of Kos | Greece | 1 | 116.2535 | 1 | 74 | 90 | 62 | 138 | 89 |
| 133 | Luleå | Sweden | 1 | 37.51146 | 1 | 74 | 90 | 62 | 138 | 89 |
| 134 | Limerick | Ireland | 2 | 1591.081 | 4 | 66 | 157 | 116 | 47 | 89 |
| 135 | Bydgoszcz | Poland | 2 | 1955.063 | 4 | 80 | 112 | 126 | 60 | 89 |
| 136 | Messina | Italy | 2 | 1063.896 | 4 | 52 | 136 | 141 | 33 | 88 |
| 137 | Lesvos | Greece | 1 | 52.9308 | 1 | 31 | 8 | 22 | 220 | 87 |
| 138 | Lučenec | Slovakia | 2 | 541.8828 | 3 | 134 | 144 | 71 | 87 | 86 |
| 139 | Elefsina | Greece | 2 | 817.2178 | 3 | 154 | 72 | 75 | 120 | 86 |
| 140 | Gdańsk | Poland | 2 | 1796.966 | 4 | 95 | 98 | 99 | 87 | 86 |
| 141 | Cartagena | Spain | 2 | 387.7509 | 2 | 172 | 155 | 70 | 78 | 86 |
| 142 | Granada | Spain | 2 | 2857.891 | 5 | 30 | 57 | 158 | 55 | 86 |
| 143 | Lohja | Finland | 1 | 48.86168 | 1 | 59 | 126 | 111 | 59 | 85 |
| 144 | Karlovy Vary | Czech Republic | 1 | 88.47994 | 1 | 59 | 126 | 111 | 59 | 85 |
| 145 | Mykonos | Greece | 1 | 96.3308 | 1 | 59 | 126 | 111 | 59 | 85 |
| 146 | Iglesias | Italy | 1 | 140.053 | 1 | 59 | 126 | 111 | 59 | 85 |
| 147 | Matera | Italy | 1 | 154.6392 | 1 | 59 | 126 | 111 | 59 | 85 |
| 148 | Tuusula | Finland | 1 | 176.6879 | 1 | 59 | 126 | 111 | 59 | 85 |
| 149 | Wüstenrot | Germany | 1 | 220.2865 | 1 | 59 | 126 | 111 | 59 | 85 |
| 150 | Algarve | Portugal | 1 | 93.57386 | 1 | 59 | 126 | 111 | 59 | 85 |
| 151 | Oviedo | Spain | 2 | 1163.38 | 4 | 90 | 127 | 119 | 48 | 85 |
| 152 | Castelo Branco | Portugal | 2 | 36.35049 | 1 | 265 | 142 | 64 | 73 | 82 |
| 153 | Brasov | Romania | 2 | 922.0974 | 3 | 81 | 189 | 107 | 16 | 82 |
| 154 | Enschede | Netherlands | 2 | 1134.46 | 4 | 111 | 40 | 60 | 143 | 82 |
| 155 | Pamplona | Spain | 3 | 8090.876 | 7 | 101 | 96 | 112 | 58 | 80 |
| 156 | Emilia-Romagna Region | Italy | 1 | 198.0112 | 1 | 60 | 84 | 116 | 63 | 80 |
| 157 | Girona | Spain | 2 | 2613.641 | 5 | 68 | 118 | 107 | 51 | 80 |
| 158 | Brandenburg | Germany | 1 | 85.35344 | 1 | 3 | 24 | 183 | 31 | 79 |
| 159 | Miskolc | Hungary | 1 | 158.8415 | 1 | 29 | 111 | 154 | 9 | 79 |
| 160 | San Sebastián | Spain | 2 | 3088.703 | 5 | 93 | 85 | 60 | 111 | 79 |
| 161 | Stuttgart | Germany | 2 | 3067.588 | 5 | 93 | 85 | 60 | 111 | 79 |
| 162 | Bialystok | Poland | 2 | 2908.501 | 5 | 78 | 59 | 84 | 94 | 76 |
| 163 | Huelva | Spain | 2 | 937.75 | 3 | 140 | 65 | 115 | 53 | 75 |
| 164 | Jeseník | Czech Republic | 1 | 52.44645 | 1 | 78 | 110 | 103 | 42 | 74 |
| 165 | Sisak | Croatia | 1 | 95.90692 | 1 | 78 | 110 | 103 | 42 | 74 |
| 166 | Lorraine Region | France | 1 | 0.010037 | 1 | 78 | 110 | 103 | 42 | 74 |
| 167 | Altavilla Silentina | Italy | 1 | 129.3077 | 1 | 78 | 110 | 103 | 42 | 74 |
| 168 | Sveti Križ Začretje | Croatia | 1 | 140.099 | 1 | 78 | 110 | 103 | 42 | 74 |
| 169 | Leuze | Belgium | 1 | 188.8481 | 1 | 78 | 110 | 103 | 42 | 74 |
| 170 | Vallelunga Pratameno | Italy | 1 | 98.5641 | 1 | 78 | 110 | 103 | 42 | 74 |
| 171 | Eskilstuna | Sweden | 1 | 97.25 | 1 | 78 | 110 | 103 | 42 | 74 |
| 172 | Soria | Spain | 1 | 144.9522 | 1 | 78 | 110 | 103 | 42 | 74 |
| 173 | Iasi | Romania | 2 | 3000 | 5 | 78 | 110 | 103 | 42 | 74 |
| 174 | Ruse | Bulgaria | 1 | 271.2394 | 2 | 44 | 71 | 104 | 64 | 73 |
| 175 | Béjar | Spain | 1 | 293.0258 | 2 | 44 | 71 | 104 | 64 | 73 |
| 176 | Bucharest | Romania | 3 | 7644.618 | 7 | 129 | 105 | 77 | 65 | 73 |
| 177 | Oradea | Romania | 2 | 1612.069 | 4 | 100 | 115 | 50 | 87 | 73 |
| 178 | TriCity | Poland | 2 | 1775.389 | 4 | 108 | 112 | 80 | 55 | 72 |
| 179 | Navarre | Spain | 1 | 63.67055 | 1 | 96 | 34 | 52 | 125 | 71 |
| 180 | Athens | Greece | 3 | 17044.3 | 9 | 85 | 113 | 71 | 63 | 71 |
| 181 | Baden-Württemberg | Germany | 1 | 310.592 | 2 | 22 | 41 | 126 | 53 | 71 |
| 182 | Huesca | Spain | 1 | 331.8571 | 2 | 58 | 71 | 48 | 110 | 71 |
| 183 | Koprivnica | Croatia | 1 | 313.2896 | 2 | 58 | 71 | 48 | 110 | 71 |
| 184 | Lombardy Region | Italy | 1 | 418.0084 | 2 | 58 | 71 | 48 | 110 | 71 |
| 185 | Guadalajara | Spain | 1 | 370.4851 | 2 | 58 | 71 | 48 | 110 | 71 |
| 186 | Silesian Province | Poland | 1 | 364.2528 | 2 | 58 | 71 | 48 | 110 | 71 |
| 187 | Apulia Region | Italy | 1 | 202.8059 | 1 | 92 | 115 | 89 | 42 | 70 |
| 188 | Glurns/Glorenza | Italy | 1 | 68.30769 | 1 | 56 | 148 | 91 | 23 | 69 |
| 189 | Lille | France | 3 | 6737.787 | 6 | 143 | 90 | 104 | 33 | 69 |
| 190 | Igoumenitsa | Greece | 1 | 60.25677 | 1 | 112 | 80 | 58 | 84 | 68 |
| 191 | Örebro | Sweden | 1 | 113.8973 | 1 | 112 | 80 | 58 | 84 | 68 |
| 192 | Llíria | Spain | 1 | 99.98246 | 1 | 112 | 80 | 58 | 84 | 68 |
| 193 | Herrenberg | Germany | 1 | 478.8464 | 2 | 46 | 100 | 87 | 47 | 67 |
| 194 | Dortmund | Germany | 2 | 2093.68 | 4 | 119 | 103 | 76 | 45 | 65 |
| 195 | Liguria | Italy | 1 | 278.6646 | 2 | 47 | 67 | 91 | 50 | 63 |
| 196 | Košice | Slovakia | 1 | 938.6885 | 3 | 36 | 58 | 86 | 53 | 61 |
| 197 | Venice | Italy | 1 | 560.3567 | 3 | 36 | 58 | 86 | 53 | 61 |
| 198 | Sulcis Iglesiente-Guspinese | Italy | 1 | 64.39143 | 1 | 86 | 134 | 44 | 46 | 60 |
| 199 | Sutri | Italy | 1 | 83.07313 | 1 | 86 | 134 | 44 | 46 | 60 |
| 200 | Coimbra | Portugal | 1 | 440.814 | 2 | 61 | 87 | 81 | 33 | 58 |
| 201 | Lazio | Italy | 1 | 332.5464 | 2 | 61 | 87 | 81 | 33 | 58 |
| 202 | Cesena | Italy | 1 | 390.5783 | 2 | 61 | 87 | 81 | 33 | 58 |
| 203 | Cuneo | Italy | 1 | 466.5 | 2 | 61 | 87 | 81 | 33 | 58 |
| 204 | Villach | Austria | 1 | 468.762 | 2 | 61 | 87 | 81 | 33 | 58 |
| 205 | Apeldoorn | Netherlands | 1 | 484.7926 | 2 | 61 | 87 | 81 | 33 | 58 |
| 206 | Knokke-Heist | Belgium | 1 | 586.6312 | 3 | 48 | 59 | 39 | 92 | 58 |
| 207 | Namur | Belgium | 2 | 635.2273 | 3 | 48 | 59 | 39 | 92 | 58 |
| 208 | Poprad | Slovakia | 1 | 790.0951 | 3 | 48 | 59 | 39 | 92 | 58 |
| 209 | Rovereto | Italy | 1 | 663.5 | 3 | 48 | 59 | 39 | 92 | 58 |
| 210 | Salerno | Italy | 2 | 2182.534 | 4 | 124 | 116 | 42 | 47 | 57 |
| 211 | Karlsruhe | Germany | 2 | 1787.774 | 4 | 124 | 116 | 42 | 47 | 57 |
| 212 | Frankfurt | Germany | 2 | 3077.342 | 5 | 64 | 82 | 112 | 0 | 57 |
| 213 | Żuromin | Poland | 1 | 811.343 | 3 | 37 | 82 | 71 | 40 | 56 |
| 214 | Trenčín | Slovakia | 1 | 667.561 | 3 | 37 | 82 | 71 | 40 | 56 |
| 215 | Siena | Italy | 1 | 455.4202 | 2 | 72 | 91 | 70 | 33 | 56 |
| 216 | Volos | Greece | 1 | 374.6084 | 2 | 72 | 91 | 70 | 33 | 56 |
| 217 | Viana do Castelo | Portugal | 1 | 269.5041 | 2 | 72 | 91 | 70 | 33 | 56 |
| 218 | Rende | Italy | 1 | 639.0926 | 3 | 38 | 55 | 75 | 42 | 52 |
| 219 | Taranto | Italy | 1 | 615.2161 | 3 | 0 | 14 | 119 | 21 | 52 |
| 220 | Gioia Tauro | Italy | 1 | 525.5263 | 3 | 18 | 73 | 100 | 6 | 51 |
| 221 | Galati | Romania | 1 | 926.0163 | 3 | 18 | 73 | 100 | 6 | 51 |
| 222 | Betanzos | Spain | 1 | 548.4774 | 3 | 18 | 73 | 100 | 6 | 51 |
| 223 | Rzeszów | Poland | 1 | 1633.206 | 4 | 30 | 49 | 72 | 46 | 51 |
| 224 | Lübeck | Germany | 1 | 1008.403 | 4 | 30 | 49 | 72 | 46 | 51 |
| 225 | Freiburg | Germany | 1 | 1509.412 | 4 | 30 | 49 | 72 | 46 | 51 |
| 226 | Merano | Italy | 1 | 1520.387 | 4 | 30 | 49 | 72 | 46 | 51 |
| 227 | Heilbronn | Germany | 1 | 1265.846 | 4 | 14 | 28 | 88 | 38 | 50 |
| 228 | Helmond | Netherlands | 1 | 1741.764 | 4 | 14 | 28 | 88 | 38 | 50 |
| 229 | Sandomierz | Poland | 1 | 808.4001 | 3 | 56 | 38 | 43 | 74 | 49 |
| 230 | Karvina | Czech Republic | 1 | 885.2522 | 3 | 56 | 38 | 43 | 74 | 49 |
| 231 | Banská Bystrica | Slovakia | 1 | 738.0388 | 3 | 56 | 38 | 43 | 74 | 49 |
| 232 | Cork City | Ireland | 1 | 1122.951 | 4 | 40 | 50 | 32 | 79 | 49 |
| 233 | La Louvière | Belgium | 1 | 1260.81 | 4 | 40 | 50 | 32 | 79 | 49 |
| 234 | Ennis | Ireland | 1 | 1286.31 | 4 | 40 | 50 | 32 | 79 | 49 |
| 235 | Darmstadt | Germany | 1 | 1303.636 | 4 | 40 | 50 | 32 | 79 | 49 |
| 236 | Poznań | Poland | 1 | 2031.493 | 4 | 40 | 50 | 32 | 79 | 49 |
| 237 | Rijeka | Croatia | 1 | 2314.815 | 4 | 40 | 50 | 32 | 79 | 49 |
| 238 | Ostrava | Czech Republic | 1 | 1331.692 | 4 | 15 | 3 | 9 | 126 | 48 |
| 239 | Coruña | Spain | 2 | 6493.862 | 6 | 107 | 66 | 37 | 54 | 47 |
| 240 | Elda | Spain | 1 | 1147.402 | 4 | 31 | 70 | 60 | 34 | 47 |
| 241 | Trieste | Italy | 1 | 2374.071 | 4 | 31 | 70 | 60 | 34 | 47 |
| 242 | Plock | Poland | 1 | 1343.344 | 4 | 31 | 70 | 60 | 34 | 47 |
| 243 | Rois | Spain | 1 | 2005.369 | 4 | 31 | 70 | 60 | 34 | 47 |
| 244 | Komárno | Slovakia | 1 | 320.068 | 2 | 67 | 106 | 34 | 37 | 47 |
| 245 | Grenoble | France | 2 | 8839.779 | 7 | 62 | 71 | 71 | 18 | 47 |
| 246 | Odense | Denmark | 1 | 675.35 | 3 | 62 | 21 | 32 | 84 | 46 |
| 247 | Lovosice | Czech Republic | 1 | 746.2574 | 3 | 59 | 75 | 57 | 28 | 46 |
| 248 | Zielona Góra | Poland | 1 | 506.2594 | 3 | 59 | 75 | 57 | 28 | 46 |
| 249 | Parma | Italy | 1 | 750.9119 | 3 | 59 | 75 | 57 | 28 | 46 |
| 250 | Zdarna | Czech Republic | 1 | 77.22008 | 1 | 96 | 15 | 112 | 0 | 45 |
| 251 | Skiathos | Greece | 1 | 122.004 | 1 | 96 | 15 | 112 | 0 | 45 |
| 252 | Małopolska province | Poland | 1 | 225.3682 | 1 | 96 | 15 | 112 | 0 | 45 |
| 253 | Rennes | France | 1 | 4374.762 | 5 | 25 | 42 | 62 | 40 | 45 |
| 254 | Nantes | France | 1 | 4889.693 | 5 | 25 | 42 | 62 | 40 | 45 |
| 255 | Czestochowa | Poland | 1 | 1362.116 | 4 | 32 | 46 | 63 | 36 | 44 |
| 256 | Prato | Italy | 2 | 2063.627 | 4 | 131 | 103 | 31 | 29 | 44 |
| 257 | Szeged | Hungary | 1 | 572.121 | 3 | 73 | 52 | 36 | 56 | 44 |
| 258 | Settimo Torinese | Italy | 1 | 1421.719 | 4 | 14 | 62 | 85 | 5 | 44 |
| 259 | Seraing | Belgium | 1 | 1806.997 | 4 | 14 | 62 | 85 | 5 | 44 |
| 260 | Havířov | Czech Republic | 1 | 2185.826 | 4 | 14 | 62 | 85 | 5 | 44 |
| 261 | Essen | Germany | 1 | 2769.448 | 5 | 34 | 43 | 27 | 69 | 43 |
| 262 | Schiedam | Netherlands | 1 | 4449.888 | 5 | 34 | 43 | 27 | 69 | 43 |
| 263 | Amersfoort | Netherlands | 1 | 2514.564 | 5 | 34 | 43 | 27 | 69 | 43 |
| 264 | Uherske Hradiste | Czech Republic | 1 | 1173.756 | 4 | 47 | 32 | 36 | 63 | 42 |
| 265 | Katowice | Poland | 1 | 1765.207 | 4 | 47 | 32 | 36 | 63 | 42 |
| 266 | Nuremberg | Germany | 1 | 2780.955 | 5 | 26 | 61 | 52 | 30 | 41 |
| 267 | Bergamo | Italy | 1 | 3084.639 | 5 | 26 | 61 | 52 | 30 | 41 |
| 268 | Saint-Nazaire | France | 1 | 1495.897 | 4 | 42 | 61 | 56 | 24 | 41 |
| 269 | Bagheria | Italy | 1 | 1789.529 | 4 | 42 | 61 | 56 | 24 | 41 |
| 270 | Linz | Austria | 1 | 2151.651 | 4 | 42 | 61 | 56 | 24 | 41 |
| 271 | Salzburg | Austria | 1 | 2367.342 | 4 | 42 | 61 | 56 | 24 | 41 |
| 272 | Zaanstad | Netherlands | 1 | 2124.015 | 4 | 42 | 61 | 56 | 24 | 41 |
| 273 | Osijek | Croatia | 1 | 57.14286 | 1 | 130 | 69 | 28 | 36 | 39 |
| 274 | Bol | Croatia | 1 | 73.65217 | 1 | 130 | 69 | 28 | 36 | 39 |
| 275 | Logatec | Slovenia | 1 | 84.86127 | 1 | 130 | 69 | 28 | 36 | 39 |
| 276 | Modena | Italy | 1 | 1021.614 | 4 | 52 | 18 | 26 | 72 | 39 |
| 277 | Augsburg | Germany | 1 | 2015.191 | 4 | 52 | 18 | 26 | 72 | 39 |
| 278 | Kaunas | Lithuania | 1 | 1902.885 | 4 | 50 | 64 | 48 | 24 | 39 |
| 279 | Split | Croatia | 1 | 2026.533 | 4 | 50 | 64 | 48 | 24 | 39 |
| 280 | Castelló de la Plana | Spain | 1 | 1554.856 | 4 | 50 | 64 | 48 | 24 | 39 |
| 281 | Madeira | Portugal | 1 | 801.0849 | 3 | 55 | 88 | 27 | 31 | 39 |
| 282 | Madonna di Campiglio | Italy | 1 | 958.9041 | 3 | 55 | 88 | 27 | 31 | 39 |
| 283 | Pescara | Italy | 1 | 3534.702 | 5 | 12 | 53 | 73 | 5 | 38 |
| 284 | Hannover | Germany | 1 | 2628.12 | 5 | 12 | 53 | 73 | 5 | 38 |
| 285 | Zabrze | Poland | 1 | 2125.92 | 4 | 61 | 44 | 30 | 48 | 37 |
| 286 | Cávado | Portugal | 1 | 351.8989 | 2 | 75 | 11 | 88 | 0 | 35 |
| 287 | Delft | Netherlands | 1 | 4573.113 | 5 | 45 | 15 | 22 | 63 | 34 |
| 288 | Marseille | France | 1 | 3612.992 | 5 | 45 | 15 | 22 | 63 | 34 |
| 289 | Düsseldorf | Germany | 1 | 2854.292 | 5 | 25 | 71 | 42 | 11 | 33 |
| 290 | Varna | Bulgaria | 1 | 1572.327 | 4 | 46 | 74 | 22 | 26 | 33 |
| 291 | Den Bosch | Netherlands | 1 | 1413.545 | 4 | 46 | 74 | 22 | 26 | 33 |
| 292 | Tarragona | Spain | 1 | 2303.333 | 4 | 46 | 74 | 22 | 26 | 33 |
| 293 | Cascais | Portugal | 1 | 2198.501 | 4 | 63 | 13 | 26 | 55 | 33 |
| 294 | Sant Cugat del Vallès | Spain | 1 | 1950.456 | 4 | 63 | 13 | 26 | 55 | 33 |
| 295 | Liege | Belgium | 1 | 2828.473 | 5 | 53 | 38 | 25 | 42 | 32 |
| 296 | Mainau-Lake Constance | Germany | 1 | 412.9464 | 2 | 102 | 54 | 21 | 29 | 31 |
| 297 | Lagoa | Portugal | 1 | 268.607 | 2 | 102 | 54 | 21 | 29 | 31 |
| 298 | Donostia-San Sebastián | Spain | 1 | 3077.927 | 5 | 40 | 65 | 19 | 23 | 28 |
| 299 | Gran Canaria Island | Spain | 1 | 554.9718 | 3 | 84 | 44 | 16 | 24 | 25 |
| 300 | Innsbruck | Austria | 1 | 1249.371 | 4 | 52 | 7 | 61 | 0 | 24 |
| 301 | Sosnowiec | Poland | 1 | 2169.844 | 4 | 52 | 7 | 61 | 0 | 24 |
| 302 | Bay of Pozzuoli | Italy | 1 | 1825.694 | 4 | 52 | 7 | 61 | 0 | 24 |
| 303 | Leuven | Belgium | 1 | 1785.018 | 4 | 71 | 37 | 13 | 21 | 21 |
| 304 | Regensburg | Germany | 1 | 1893.322 | 4 | 54 | 61 | 10 | 8 | 20 |
| 305 | Bresso | Italy | 1 | 7776.627 | 7 | 35 | 3 | 40 | 0 | 16 |
| 306 | Mainz | Germany | 1 | 2236.55 | 4 | 73 | 1 | 1 | 24 | 11 |
| 307 | Seville | Spain | 1 | 4852.723 | 5 | 64 | 0 | 0 | 21 | 9 |
References
- Angelidou, M. Smart city policies: A spatial approach. Cities 2014, 41, S3–S11. [Google Scholar] [CrossRef]
- Chourabi, H.; Nam, T.; Walker, S.; Gil-Garcia, J.R.; Mellouli, S.; Nahon, K.; Pardo, T.A.; Scholl, H.J. Understanding smart cities: An integrative framework. In Proceedings of the Annual Hawaii International Conference on System Sciences, Maui, HI, USA, 4–7 January 2012; pp. 2289–2297. [Google Scholar]
- Aurigi, A. New technologies, same dilemmas: Policy and design issues for the augmented city. J. Urban Technol. 2006, 13, 5–28. [Google Scholar] [CrossRef]
- Graham, S.; Aurigi, A. Urbanising cyberspace? City 1997, 2, 18–39. [Google Scholar] [CrossRef]
- Van Bastelaer, B. Digital cities and transferability of results. In Proceedings of the 4th EDC Conference on Digital Cities, Salzburg, Austria, 29–30 October 1998; pp. 61–70. [Google Scholar]
- Gibson, R.W.; Kozmetsky, D.V.; Smilor, G. The Technopolis Phenomenon: Smart Cities, Fast Systems, Global Networks; Rowman & Littlefield: Lanham, MD, USA, 1992; Volume 38, pp. 141–143. [Google Scholar]
- Tan, M. Creating the Digital Economy: Strategies and Perspectives from Singapore. Int. J. Electron. Commer. 1999, 3, 105–122. [Google Scholar] [CrossRef]
- Jucevičius, R.; Patašienė, I.; Patašius, M. Digital Dimension of Smart City: Critical Analysis. Procedia Soc. Behav. Sci. 2014, 156, 146–150. [Google Scholar] [CrossRef]
- Dai, H.; Huang, G.; Wang, J.; Zeng, H. Ecotoxicology and Environmental Safety VAR-tree model based spatio-temporal characterization and prediction of O3 concentration in China. Ecotoxicol. Environ. Saf. 2023, 257, 114960. [Google Scholar] [CrossRef]
- Correia, D.; Vagos, C.; Marques, J.L.; Teixeira, L. Fulfilment of last-mile urban logistics for sustainable and inclusive smart cities: A case study conducted in Portugal. Int. J. Logist. Res. Appl. 2022, 2022, 2130211. [Google Scholar] [CrossRef]
- Dai, H.; Huang, G.; Zeng, H.; Yu, R. Haze Risk Assessment Based on Improved PCA-MEE and ISPO-LightGBM Model. Systems 2022, 10, 263. [Google Scholar]
- Cohen, B. The 3 Generations of Smart Cities. 2015. Available online: https://www.fastcompany.com/3047795/the-3-generations-of-smart-cities (accessed on 14 January 2022).
- Trencher, G. Technological Forecasting & Social Change Towards the smart city 2.0: Empirical evidence of using smartness as a tool for tackling social challenges. Technol. Forecast. Soc. Chang. 2019, 142, 117–128. [Google Scholar] [CrossRef]
- Coletta, C.; Evans, L.; Heaphy, L.; Kitchin, R. Creating Smart Cities, 1st ed.; Routledge: London, UK, 2018. [Google Scholar] [CrossRef]
- Correia, D.; Marques, J.L.; Teixeira, L. City@Path: A Collaborative Smart City Planning and Assessment Tool. In Transport Development and Integration; WiT Press: Billerica, MA, USA, 2022; Volume 6, pp. 66–80. [Google Scholar] [CrossRef]
- Janurova, M.; Chaloupkova, M.; Kunc, J. Smart city strategy and its implementation barriers: Czech experience. Theor. Empir. Res. Urban Manag. 2020, 15, 5–21. [Google Scholar]
- Kitchin, R. Getting Smarter about Smart Cities: Improving Data Privacy and Data Security. 2016. Available online: https://api.semanticscholar.org/CorpusID:168484266 (accessed on 14 January 2022).
- Griffiths, H. Smart City Demonstrators: A Global Review of Challenges and Lessons Learned. 2018. Available online: https://cp.catapult.org.uk/wp-content/uploads/2021/01/SMART-CITY-DEMONSTRATORS-A-global-review-of-challenges-and-lessons-learned.pdf (accessed on 14 January 2022).
- Moradi, S. The scientometrics of literature on smart cities. Libr. Hi Tech 2020, 38, 385–398. [Google Scholar] [CrossRef]
- Ingwersen, P.; Serrano-López, A.E. Smart city research 1990–2016. Scientometrics 2018, 117, 1205–1236. [Google Scholar] [CrossRef]
- Dias, G.P. Smart cities research in Portugal and Spain. In Proceedings of the 2018 13th Iberian Conference on Information Systems and Technologies (Cisti), Caceres, Spain, 13–16 June 2018. [Google Scholar]
- Correia, D.; Teixeira, L.; Marques, J.L. Reviewing the State-of-the-Art of Smart Cities in Portugal: Evidence Based on Content Analysis of a Portuguese Magazine. Publications 2022, 9, 49. [Google Scholar] [CrossRef]
- Smékalová, L.; Kučera, F. Smart city projects in the small-sized municipalities: Contribution of the cohesion policy. Sci. Pap. Univ. Pardubic. Ser. D Fac. Econ. Adm. 2020, 28. [Google Scholar] [CrossRef]
- Ruohomaa, H.; Salminen, V.; Kunttu, I. Towards Smart City Concept in Small Cities. Technol. Innov. Manag. Rev. 2019, 9, 5–14. [Google Scholar] [CrossRef]
- Rotună, C.I.; Cîrnu, C.E.; Gheorghi, A. Implementing smart city solutions: Smart city map and city drop. Calitatea Vietii 2017, 28, 313–327. [Google Scholar]
- Kona, A.; Guťan, D.; Horváth, P. Slovak Republic on the way to build smart cities based on KPIs with first Slovak smart city index. Sci. Pap. Univ. Pardubic. Ser. D Fac. Econ. Adm. 2020, 28, 1061. [Google Scholar] [CrossRef]
- Vitkova, L.; Silaci, I. Potential of Culture for Sustainable Urban Development. IOP Conf. Ser. Mater. Sci. Eng. 2019, 603, 032072. [Google Scholar] [CrossRef]
- Lozynskyy, R.; Pantyley, V.; Sawicka, A. The smart city concept in Poland and Ukraine: In search of cooperation opportunities. Bull. Geogr. Socio-Econ. Ser. 2021, 52, 95–109. [Google Scholar] [CrossRef]
- Siokas, G.; Tsakanikas, A.; Siokas, E. Implementing smart city strategies in Greece: Appetite for success. Cities 2020, 108, 102938. [Google Scholar] [CrossRef]
- van Winden, W.; Buuse, D.v.D. Smart City Pilot Projects: Exploring the Dimensions and Conditions of Scaling Up. J. Urban Technol. 2017, 24, 51–72. [Google Scholar] [CrossRef]
- Correia, D.; Marques, J.L.; Teixeira, L. The State-of-the-Art of Smart Cities in the European Union. Smart Cities 2022, 5, 1776–1810. [Google Scholar] [CrossRef]
- Akande, A.; Cabral, P.; Gomes, P.; Casteleyn, S. The Lisbon ranking for smart sustainable cities in Europe. Sustain. Cities Soc. 2019, 44, 475–487. [Google Scholar] [CrossRef]
- Escolar, S.; Villanueva, F.J.; Santofimia, M.J.; Villa, D.; del Toro, X.; López, J.C. A Multiple-Attribute Decision Making-based approach for smart city rankings design. Technol. Forecast. Soc. Chang. 2018, 142, 42–55. [Google Scholar] [CrossRef]
- Giffinger, R. Smart Cities Ranking of European Medium-Sized Cities. 2007, pp. 13–18. Available online: https://repositum.tuwien.at/bitstream/20.500.12708/153435/1/Giffinger-2007-Smart%20cities.%20Ranking%20of%20European%20medium-sized%20cities.%20Fin...-vor.pdf (accessed on 14 January 2022).
- Giffinger, R.; Gudrun, H. Smart cities ranking: An effective instrument for the positioning of the cities? ACE Archit. City Environ. 2010, 4, 7–26. [Google Scholar] [CrossRef]
- Lombardi, P.; Giordano, S.; Farouh, H.; Yousef, W. Modelling the smart city performance. Innov. Eur. J. Soc. Sci. Res. 2012, 25, 137–149. [Google Scholar] [CrossRef]
- Mahizhnan, A. Smart cities: The Singapore case. Cities 1999, 16, 13–18. [Google Scholar] [CrossRef]
- Albino, V.; Berardi, U.; Dangelico, R.M. Smart cities: Definitions, dimensions, performance, and initiatives. J. Urban Technol. 2015, 22, 3–21. [Google Scholar] [CrossRef]
- Eger, J. Smart Growth, Smart Cities, and the Crisis at the Pump A Worldwide Phenomenon. I-Ways J. E-Gov. Policy Regul. 2009, 32, 47–53. [Google Scholar] [CrossRef]
- Thuzar, M. Urbanization in Southeast Asia: Developing Smart Cities for the Future? Reg. Outlook 2011, 96–100. [Google Scholar] [CrossRef]
- Nam, T.; Pardo, T.A. Conceptualizing smart city with dimensions of technology, people, and institutions. In Proceedings of the ACM International Conference Proceeding Series, College Park, MD, USA, 12–15 June 2011; pp. 282–291. [Google Scholar] [CrossRef]
- Caragliu, A.; Del Bo, C.; Nijkamp, P. Smart Cities in Europe. J. Urban Technol. 2009, 18, 65–82. [Google Scholar] [CrossRef]
- Ismagilova, E.; Hughes, L.; Dwivedi, Y.K.; Raman, K.R. Smart cities: Advances in research—An information systems perspective. Int. J. Inf. Manag. 2019, 47, 88–100. [Google Scholar] [CrossRef]
- Pramanik, I.; Lau, R.Y.; Demirkan, H.; Azad, A.K. Smart health: Big data enabled health paradigm within smart cities. Expert Syst. Appl. 2017, 87, 370–383. [Google Scholar] [CrossRef]
- Barrionuevo, J.M.; Berrone, P.; Costa, J.E.R. Smart Cities, Sustainable Progress: Opportunities for Urban Development. IESE Insight 2012, 14, 50–57. [Google Scholar] [CrossRef]
- Kourtit, K.; Nijkamp, P. Innovation: The European Journal of Social Science Research Smart cities in the innovation age. Innov. Eur. J. Soc. Sci. Res. 2012, 25, 93–95. [Google Scholar] [CrossRef]
- Neirotti, P.; De Marco, A.; Cagliano, A.C.; Mangano, G.; Scorrano, F. Current trends in smart city initiatives: Some stylised facts. Cities 2014, 38, 25–36. [Google Scholar] [CrossRef]
- Mohanty, S.P.; Choppali, U.; Kougianos, E. Everything you wanted to know about smart cities: The Internet of things is the backbone. IEEE Consum. Electron. Mag. 2016, 5, 60–70. [Google Scholar] [CrossRef]
- Ahvenniemi, H.; Huovila, A.; Pinto-Seppä, I.; Airaksinen, M. What are the differences between sustainable and smart cities? Cities 2017, 60, 234–245. [Google Scholar] [CrossRef]
- Wolf, J.; Borges, M.; Marques, J.L.; Castro, E. Smarter Decisions for Smarter Cities: Lessons Learned from Strategic Plans. In New Paths of Entrepreneurship Development; Springer: Cham, Switzerland, 2019; pp. 7–30. [Google Scholar]
- Ruohomaa, H.; Ivanova, N.; Podkletnov, D.; Ivanova, K. The socio-technical impact of the current disruptive technologies on the smart city concept realization. In CEUR Workshop Proceedings. 2020, pp. 3–9. Available online: http://www.math.bas.bg/infres/~ivanova/KMI-papers/2019-CEUR-SPb_Workshop-Ruohomaa_et_al.pdf (accessed on 14 January 2022).
- Mosannenzadeh, F.; Vettorato, D. Defining Smart City. A Conceptual Framework Based on Keyword Analysis. TeMA-J. Land Use Mobil. Environ. 2014, 998. [Google Scholar] [CrossRef]
- Angelidou, M. The Role of Smart City Characteristics in the Plans of Fifteen Cities. J. Urban Technol. 2017, 24, 3–28. [Google Scholar] [CrossRef]
- Angelidou, M. Smart cities: A conjuncture of four forces. Cities 2015, 47, 95–106. [Google Scholar] [CrossRef]
- Camboim, G.F.; Zawislak, P.A.; Pufal, N.A. Driving elements to make cities smarter: Evidences from European projects. Technol. Forecast. Soc. Chang. 2019, 142, 154–167. [Google Scholar] [CrossRef]
- Csukás, M.S.; Szabó, R.Z. The many faces of the smart city: Differing value propositions in the activity portfolios of nine cities. Cities 2021, 112, 103116. [Google Scholar] [CrossRef]
- Giest, S. Big data analytics for mitigating carbon emissions in smart cities: Opportunities and challenges. Eur. Plan. Stud. 2017, 25, 941–957. [Google Scholar] [CrossRef]
- Noori, N.; Hoppe, T.; de Jong, M. Classifying pathways for smart city development: Comparing design, governance and implementation in Amsterdam, Barcelona, Dubai, and Abu Dhabi. Sustainability 2020, 12, 4030. [Google Scholar] [CrossRef]
- Ojo, A.; Curry, E.; Janowski, T. Designing next generation smart city initiatives—Harnessing findings and lessons from a study of ten smart city programs. In Proceedings of the ECIS 2014 Proceedings, Proceedings of the 22nd European Conference on Information Systems, Tel Aviv, Israel, 9–11 June 2014. [Google Scholar]
- Phumpiu Chang, P.; Rivera Kuri, J.L. Monterrey Envisioned as a Smart City Developed through International Model Examples; WIT Transactions on Ecology and the Environment. 2014, Volume 191, pp. 51–64. Available online: https://www.witpress.com/elibrary/wit-transactions-on-ecology-and-the-environment (accessed on 14 January 2022).
- Correia, D.; Feio, J.E.; Marques, J.; Teixeira, L. Participatory methodology guidelines to promote citizens participation in decision-making: Evidence based on a Portuguese case study. Cities 2023, 135, 104213. [Google Scholar] [CrossRef]
- Goyal, S.; Sahni, A.; Garg, T. Identification and prioritization of barriers in building smart cities. Int. J. Mech. Eng. Technol. 2018, 9, 819–827. [Google Scholar]
- Jayasena, N.S.; Mallawaarachchi, H.; Waidyasekara, K.G.A.S. A critical review on the drivers and barriers for enabling smart cities. In Proceedings of the International Conference on Industrial Engineering and Operations Management, Toronto, ON, Canada, 23–25 October 2019; pp. 2405–2413. [Google Scholar]
- Luthra, S.; Kumar, S.; Garg, D.; Haleem, A. Barriers to renewable/sustainable energy technologies adoption: Indian perspective. Renew. Sustain. Energy Rev. 2015, 41, 762–776. [Google Scholar] [CrossRef]
- Rana, N.P.; Luthra, S.; Mangla, S.K.; Islam, R.; Roderick, S.; Dwivedi, Y.K. Barriers to the Development of Smart Cities in Indian Context. Inf. Syst. Front. 2019, 21, 503–525. [Google Scholar] [CrossRef]
- Mosannenzadeh, F.; Bisello, A.; Diamantini, C.; Stellin, G.; Vettorato, D. A case-based learning methodology to predict barriers to implementation of smart and sustainable urban energy projects. Cities 2017, 60, 28–36. [Google Scholar] [CrossRef]
- Mosannenzadeh, F.; Di Nucci, M.R.; Vettorato, D. Identifying and prioritizing barriers to implementation of smart energy city projects in Europe: An empirical approach. Energy Policy 2017, 105, 191–201. [Google Scholar] [CrossRef]
- Correia, D.; Teixeira, L.; Marques, J.L. Investigating Smart City Barriers: Contribution of Experts based on a Delphi Analysis. Int. Rev. Spat. Plan. Sustain. Dev. 2022, 10, 179–199. [Google Scholar] [CrossRef] [PubMed]


| Category | F1 | F2 | F3 | F4 | Dimension |
|---|---|---|---|---|---|
| Environment and air quality | 0.757 | 0.409 | 0.287 | 0.344 | Infrastructure and transport |
| Infrastructure and communication networks | 0.869 | 0.356 | 0.156 | 0.149 | |
| Mobility and transportation | 0.626 | 0.579 | 0.425 | 0.171 | |
| Parking | 0.892 | 0.045 | 0.064 | 0.174 | |
| Smart city foundations | 0.778 | 0.151 | 0.255 | 0.394 | |
| Strategy and governance | 0.592 | 0.309 | 0.331 | 0.452 | |
| Traffic | 0.654 | 0.189 | 0.260 | 0.513 | |
| Waste | 0.669 | 0.554 | 0.136 | 0.056 | |
| Water and irrigation | 0.651 | 0.097 | 0.523 | −0.020 | |
| Culture, tourism, and heritage | 0.588 | 0.670 | 0.227 | 0.189 | Sectoral initiatives |
| Education | 0.395 | 0.737 | 0.431 | 0.093 | |
| Energy and lighting | 0.537 | 0.557 | 0.486 | 0.171 | |
| Health and well-Being | 0.246 | 0.738 | 0.528 | −0.088 | |
| Sport | 0.003 | 0.899 | 0.131 | 0.213 | |
| Urban planning | 0.415 | 0.632 | 0.520 | 0.243 | |
| Buildings and housing | 0.227 | 0.562 | 0.708 | 0.037 | Territorial competitiveness |
| Digitization and interoperability | 0.400 | 0.456 | 0.614 | 0.326 | |
| Economy and industry | 0.425 | 0.431 | 0.541 | 0.257 | |
| Logistics | 0.228 | 0.278 | 0.732 | 0.270 | |
| Rural and agriculture | 0.058 | 0.139 | 0.837 | 0.126 | |
| Community, participation, and inclusion | 0.516 | 0.459 | 0.305 | 0.565 | Community |
| Privacy, security, and safety | 0.238 | 0.062 | 0.129 | 0.901 | |
| Eigenvalues | 14.293 | 2.119 | 1.170 | 0.947 |
| F1 | F2 | F3 | F4 | |
|---|---|---|---|---|
| Eigenvalues (Ei, i = 1, …, 4) | 14.293 | 2.119 | 1.170 | 0.947 |
| Inverse value (smart city concept context) (Ei)−1 | 0.067 | 0.472 | 0.855 | 1.056 |
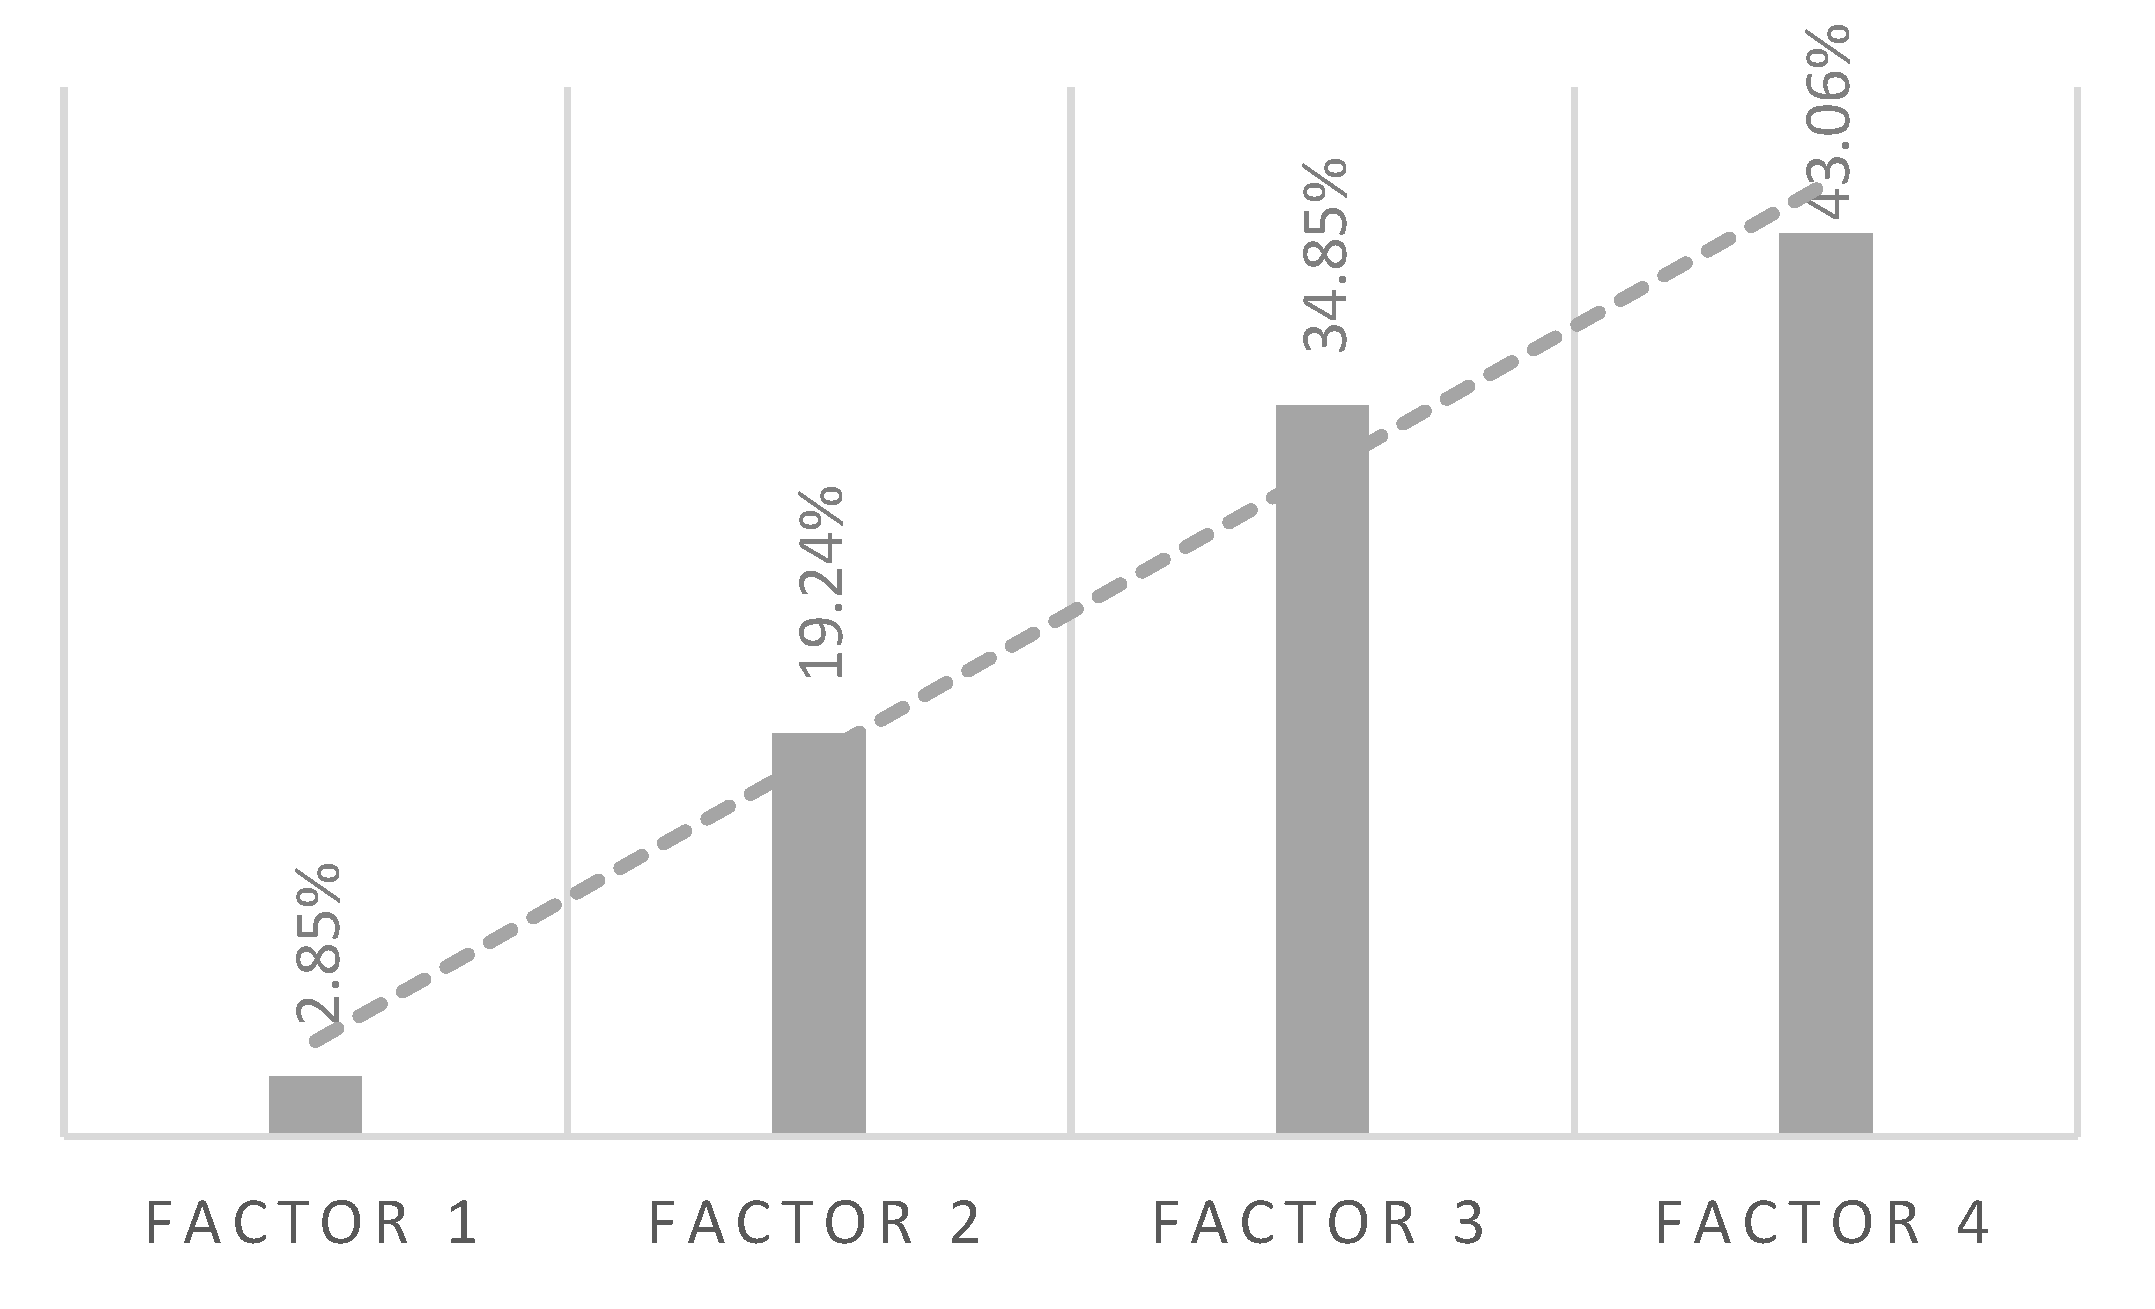
| Weightings for rankings (Wi) | 2.85% | 19.24% | 34.85% | 43.06% |
| Position | City | Country | Projects | Density (People/km2) | Class | Ranking |
|---|---|---|---|---|---|---|
| 1 | Dublin | Ireland | 22 | 4756 | 5 | 907 |
| 2 | Vienna | Austria | 22 | 4633 | 5 | 889 |
| 3 | Turin | Italy | 21 | 6602 | 6 | 742 |
| 4 | Madrid | Spain | 22 | 5454 | 6 | 726 |
| 5 | Barcelona | Spain | 29 | 16,516 | 9 | 723 |
| 6 | Aarhus | Denmark | 14 | 752 | 3 | 714 |
| 7 | Milan | Italy | 21 | 7680 | 7 | 668 |
| 8 | Amsterdam | Netherlands | 18 | 5277 | 6 | 662 |
| 9 | Trikala | Greece | 8 | 134 | 1 | 656 |
| 10 | Cagliari | Italy | 14 | 1115 | 4 | 646 |
| 11 | Oulu | Finland | 8 | 70 | 1 | 631 |
| 12 | Helsinki | Finland | 14 | 3065 | 5 | 604 |
| 13 | Antwerp | Belgium | 9 | 247 | 1 | 597 |
| 14 | Malaga | Spain | 16 | 1462 | 4 | 572 |
| 15 | Santander | Spain | 15 | 4771 | 5 | 480 |
| 16 | Thessaloniki | Greece | 6 | 1 | 1 | 473 |
| 17 | Hamburg | Germany | 11 | 2453 | 4 | 464 |
| 18 | Lisbon | Portugal | 12 | 6418 | 6 | 421 |
| 19 | Graz | Austria | 9 | 2283 | 4 | 407 |
| 20 | Évora | Portugal | 5 | 41 | 1 | 399 |
| 21 | Porto | Portugal | 13 | 5617 | 6 | 388 |
| 22 | L’Aquila | Italy | 6 | 148 | 1 | 378 |
| 23 | Brno | Czech Republic | 9 | 1661 | 4 | 369 |
| 24 | Tampere | Finland | 5 | 459 | 2 | 361 |
| 25 | Flanders Reg. | Belgium | 6 | 484 | 2 | 360 |
| 26 | Galicia | Spain | 4 | 91 | 1 | 335 |
| 27 | Eindhoven | Netherlands | 7 | 2689 | 5 | 316 |
| 28 | Berlin | Germany | 8 | 4112 | 5 | 314 |
| 29 | Florence | Italy | 8 | 3527 | 5 | 308 |
| 30 | Águeda | Portugal | 4 | 138 | 1 | 302 |
| 31 | Stockholm | Sweden | 9 | 5217 | 6 | 298 |
| 32 | Bologna | Italy | 8 | 2798 | 5 | 297 |
| 33 | Catania | Italy | 6 | 1626 | 4 | 295 |
| 34 | Vitoria-Gasteiz | Spain | 5 | 914 | 3 | 294 |
| 35 | Trento | Italy | 6 | 752 | 3 | 291 |
| 36 | Lyon | France | 10 | 10,918 | 8 | 286 |
| 37 | Valladolid | Spain | 7 | 1512 | 4 | 284 |
| 38 | Luxembourg | Luxembourg | 6 | 2420 | 4 | 275 |
| 39 | Prague | Czech Republic | 7 | 2692 | 5 | 265 |
| 40 | Warsaw | Poland | 8 | 3469 | 5 | 265 |
| 41 | Bari | Italy | 8 | 2716 | 5 | 262 |
| 42 | Copenhagen | Denmark | 8 | 7231 | 6 | 257 |
| 43 | Savona | Italy | 5 | 900 | 3 | 255 |
| 44 | Munich | Germany | 6 | 4777 | 5 | 246 |
| 45 | Nicosia | Cyprus | 6 | 2740 | 5 | 245 |
| 46 | Brussels | Belgium | 4 | 756 | 3 | 244 |
| 47 | Bratislava | Slovakia | 6 | 1292 | 4 | 237 |
| 48 | Pavia | Italy | 5 | 1131 | 4 | 236 |
| 49 | Heraklion | Greece | 5 | 711 | 3 | 234 |
| 50 | Rome | Italy | 5 | 1837 | 4 | 234 |
| Ireland | Population | Area (Km2) | A | B | C | D | E | F | G | H | I | J | K | L | M | N | O | P | Q | R | S | T | U | V | Total | Categories |
|---|---|---|---|---|---|---|---|---|---|---|---|---|---|---|---|---|---|---|---|---|---|---|---|---|---|---|
| Dublin | 554,554 | 116.6 | 1 | 1 | 1 | 1 | 4 | 1 | 3 | 4 | 2 | 4 | 22 | 10 |
| Factor | Step 1—Loading Scores | Step 2—Division Density Population | Step 3—Normalization (Scale 0–1000) | Step 4—Weightings for Rankings |
|---|---|---|---|---|
| 1 | 11.222 | 5.611 | 869 | 24.79 |
| 2 | 9.726 | 4.863 | 1000 | 192.36 |
| 3 | 8.688 | 4.344 | 979 | 341.38 |
| 4 | 8.188 | 4.094 | 1000 | 348.54 |
Disclaimer/Publisher’s Note: The statements, opinions and data contained in all publications are solely those of the individual author(s) and contributor(s) and not of MDPI and/or the editor(s). MDPI and/or the editor(s) disclaim responsibility for any injury to people or property resulting from any ideas, methods, instructions or products referred to in the content. |
© 2023 by the authors. Licensee MDPI, Basel, Switzerland. This article is an open access article distributed under the terms and conditions of the Creative Commons Attribution (CC BY) license (https://creativecommons.org/licenses/by/4.0/).
Share and Cite
Correia, D.; Marques, J.L.; Teixeira, L. Assessing and Ranking EU Cities Based on the Development Phase of the Smart City Concept. Sustainability 2023, 15, 13675. https://doi.org/10.3390/su151813675
Correia D, Marques JL, Teixeira L. Assessing and Ranking EU Cities Based on the Development Phase of the Smart City Concept. Sustainability. 2023; 15(18):13675. https://doi.org/10.3390/su151813675
Chicago/Turabian StyleCorreia, Diogo, João Lourenço Marques, and Leonor Teixeira. 2023. "Assessing and Ranking EU Cities Based on the Development Phase of the Smart City Concept" Sustainability 15, no. 18: 13675. https://doi.org/10.3390/su151813675
APA StyleCorreia, D., Marques, J. L., & Teixeira, L. (2023). Assessing and Ranking EU Cities Based on the Development Phase of the Smart City Concept. Sustainability, 15(18), 13675. https://doi.org/10.3390/su151813675