Abstract
Our study focuses on examining the effects of treated wastewater irrigation (TWWI) on agricultural soils in water-scarce regions, with a specific emphasis on the presence and accumulation of polycyclic aromatic hydrocarbons (PAHs). This issue is particularly significant due to its potential threats to environmental security. During our research, we discovered the existence of 16 different PAHs in these soils, which are known to have harmful impacts on ecosystems and human health. The concentration of total PAHs ranged from 163.9 ng g−1 to 9177.4 ng g−1, with 4- and 5-ring PAHs being the most dominant contributors. The PAHs Fluoranthene and Pyrene were found to be the most prevalent in all soil samples. Comparing the PAH concentrations in our research area to those reported in other studies, we observed that the agricultural areas in our study were more contaminated. Through positive matrix factorization (PMF) and diagnostic ratios (DRs) analyses, we identified petroleum combustion, vehicular emissions, as well as coal, grass, or wood combustion as the primary sources of PAH contamination. We also noted a negative correlation between clay, silt, pH, and PAH concentrations, while a significant positive relationship was observed between total organic carbon (TOC), sand, and PAHs. Based on the computed environmental risk index value, the presence of PAHs in the area poses a moderate to high level of ecological risk. TWWI was identified as the main contributor to PAHs in the agricultural soils we studied. Therefore, it is crucial to establish and enforce standards for wastewater reuse in agricultural fields before irrigation takes place.
1. Introduction
The shortage of freshwater and untreated or partially treated wastewater is widespread in the agricultural fields near urban areas [1]. The countries use non-conventional water for agricultural production due to freshwater needs [2]. However, effluents from wastewater treatment plants (WWTPs) could include persistent organic contaminants and heavy metals originating from household and industrial discharges [3,4]. Persistent organic compounds (POPs) have been reported through many studies, and these POPs pose a serious environmental concern. These toxins are capable of migrating from water and soil into various media, including bushes, angles, and food chains. The study suggests that POPs can damage the liver, conception defects, fatal death, cancer, and other chronic abnormalities [5,6] because these can pass from water and soils to different trophic levels in the food chain. Due to their detrimental effects on human health and the environment, organic pollutants have become more of a worry than other types of toxins [7]. Polycyclic aromatic hydrocarbons (PAHs) are a class of persistent organic pollutants composed of numerous aromatic rings consisting of carbon and hydrogen atoms. These organic pollutants are semi-volatile; most of them are toxic and belong to one of the ubiquitous groups of numerous persistent organic compounds [8]. Due to their ability to cause cancer, mutagenesis, and poisoning, PAHs are listed among the top poisons by the United States Environmental Protection Agency (USEPA) [9]. Sixteen specific PAH chemicals have been identified by the USEPA as priority pollutants. Seven PAHs were identified by the International Agency for Research on Cancer (IARC) as probable human carcinogenic pollutants [10]. The species, exposure course, and molecular structure are capable of the harmfulness of PAHs [11]. Two or more aromatic rings are arranged linearly or angularly in PAHs. Based on their molecular weight (MW), they are divided into two categories: low-MW PAHs (LMW PAHs) and high-MW PAHs (HMW PAHs) [12]. Compared to LMW PAHs (3 or lesser ring PAHs), HMW PAHs (4 or higher ring PAHs) are more lipophilic, less volatile, and pose serious risks to humans [13,14]. In several cases, it has been studied that the main source of PAHs is human-initiated, consequential from anthropogenic input through oil spills; partial combustion of wood, lawns, and fossil fuels; urban runoff; industrial wastewater discharges; domestic and industrial emissions; and vehicle exhaust. A considerable amount of PAHs are also released by certain natural processes, including diagenesis, volcanic eruptions, and the Savanah Fire [15,16,17,18]. Attributable to their physicochemical properties, PAHs tend to combine with sediment/mud, air, water, and biota to a different extent [19]. The wastewater treatment facility is well acknowledged as a major source of dangerous contaminants, such as PAHs [20]. Treated wastewater (TWW) quality fluctuates according to the origin of the effluent. Treatment methods are likely to contain many OPs, so they are not effective in completely eliminating trace pollutants from wastewater. Sewage irrigation is a practice that is predominantly found in countries with limited water resources. This method involves using treated wastewater for irrigation purposes, effectively conserving freshwater reserves. However, it is crucial to consider the chemical composition of the wastewater, as it plays a significant role in determining the level of contamination. The presence of hazardous chemicals and pollutants in wastewater can have detrimental effects on the environment and public health. Therefore, careful monitoring and treatment of wastewater are essential to ensure that the practice of sewage irrigation remains sustainable and environmentally friendly. Sewage contains a lot of PAHs, according to numerous studies [21]. Due to their characteristics, high-persistent OPs can easily accumulate in the soil, which serves as the final sink for pollutants introduced by TWW during irrigation [22,23]. The study of PAH concentration in long-term treated wastewater-irrigated agricultural soil is more important because the excessive build-up in agricultural lands can pose a health threat owing to toxicant deposition through the food system [24]. To the best of our knowledge, the PAH load in Central Asian soils has only been described in three published articles [25,26,27]. The study mentioned in the article is of significant importance as it aims to explore the relationship between emissions from different sources and factors such as climatic and meteorological parameters, land use, and soil biogeochemical characteristics in specific locations. By focusing on Jamshedpur City, a major industrial manufacturing center in the state of Jharkhand, East India, this research aims to provide a comprehensive understanding of the presence and distribution of PAHs (polycyclic aromatic hydrocarbons) in the soil of the region. It is home to renowned companies, such as Tata Motors, Tata Steel, and Tata Energy, and boasts one of the most extensive industrial areas in India, known as the Industrial Area of Adityapur. The Adityapur Industrial Area Development Authority—Special Economic Zone (AIADA-SEZ) oversees the operation of this industrial belt. Additionally, within this industrial belt, there are approximately 1200 small-scale and moderate-scale industries. The country’s 36th-largest urban agglomeration (JUA) is Jamshedpur City [28,29]. To manage their wastewater, the industries in Jamshedpur employ wastewater treatment plants. The treated wastewater is subsequently utilized for agricultural purposes and discharged into rivers, which are also utilized by the agricultural lands surrounding the city. While some research on polycyclic aromatic hydrocarbons (PAHs) in the air, water, and sediments of Jamshedpur City has been recently published [28,29,30], there is a lack of detailed information regarding the PAH content in agricultural soils after prolonged irrigation with treated wastewater in these agricultural lands.
Consequently, the goal of this study was to investigate the effects of prolonged irrigation with treated wastewater on the presence of PAHs in soils and the resulting implications on the atmosphere and human health. By investigating this aspect, the research aims to contribute to a better understanding of the potential consequences of utilizing treated wastewater for irrigation in agricultural areas.
2. Material and Methods
2.1. Study Area
The area of study under observation is situated in Jamshedpur (Figure 1). Its surroundings are composed of farmlands irrigated with treated wastewater. The wastewater injected into rivers is also used for irrigation in the farmlands. Five villages were selected, where farmlands were irrigated through the treated wastewater. The villages are Dhanchatni (22°75′ N 86°29′ E), Tuibasa (22°68′ N 86°10′ E), Sarjamda (22°74′ N 86°22′ E), Khairbani (22°73′ N 86°28′ E), and Khursi (22°70′ N 86°29′ E). It is part of East India’s well-organized industrial city, the JSR city (22°47’ N 86°12’ E), particularly in the southern province of Jharkhand. With its highly inhabited districts, Jamshedpur is a center of economic and industrial activity. According to the 2011 census, Jamshedpur has inhabitants of roughly 1.3 million people and a density of 6400 persons per square kilometer, making it one of East India’s busiest towns. Numerous small- and medium-sized businesses, as well as huge businesses like TATA Motors and Tata Iron and Steel Company (TISCO), are housed in the city of Adityapur. Due to their considerable industrial activities and the application of large amounts of treated effluent wastewater to farmlands, the study locations were chosen. Jamshedpur is the 72nd main city and the 36th enormous urban conglomeration in terms of population in all of India.
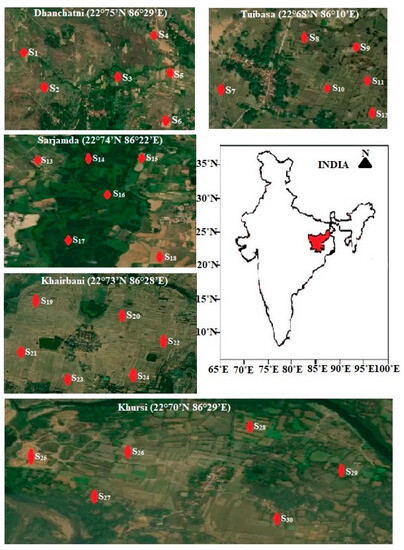
Figure 1.
Agricultural topsoil sampling sites of treated wastewater-irrigated areas.
2.2. Sampling and Pretreatment
The topsoil irrigated with wastewater was collected from November 2020 to January 2021 from farmlands in Jamshedpur and its surrounding areas. The farmlands were irrigated with wastewater and treated wastewater for over 20 years. These are the most industrialized cities in East India. The sampling locations were chosen randomly in the farmlands surrounding the city. Agricultural soil samples were collected from treated wastewater-irrigated farmlands following a predefined random sampling procedure, total (n = 30) (Figure 1). The samples were collected by employing stainless steel scoops at a depth of 0–10 cm, and during sampling, the GPS (Garmin etrex-10) was used for the sample point coordinates. We collected the samples in a composite manner by creating a 4 m × 4 m grid at each sampling point. A total of five samples were stored at each sampling site (including four samples from four corners of the 4 m × 4 m grid and one from the center), and after properly mixing, these were combined to create one representative sample. After thoroughly mixing, the stones, plant rhizomes, and other big debris objects were detached. Afterwards, the collected samples were sheathed in aluminum foil, wrapped in sealed polyethylene bags, and kept in ice bags. When collecting samples, hand protection was used to avoid or prevent any contamination or infection. Eventually, after sampling, the samples were delivered to the research lab within 6 h. Following adequate aeration, the samples were filtered through a 100-mesh sieve after being exposed to dry air for 3 days at room temperature. The correctly sieved samples were held at a temperature of −20 °C before further examination.
2.3. Soil Physicochemical Properties
Using the methods specified in [31,32], the total organic carbon (TOC) content in the treated wastewater-irrigated agricultural soil was calculated using the titrimetric method. After shaking 5 g of air-dried soil in 20 mL of deionized water for 1 min, the pH value was measured using a pH measure (Hach, Inc.,Hanna Equipment’s (India) Pvt. Ltd. Navi Mumbai, Maharashtra type: sension2). The hydrometer technique was used to measure the diffusion of particle size [33]. The physicochemical analysis of soil is based on several variables, including total organic carbon, nitrogen (N), clay (%) (0–2 mm), sand (%) (50–2000 mm), and slit (%) (2–50 mm). The pH results showed that all soil samples were alkaline, and all samples had a modest amount of readily available micronutrients. Many physiochemical measures can be used to study soil quality. Most of the parameters are significantly over or below the permitted range.
2.4. Extraction, Clean-Up, and Assessment of PAHs
The soil samples, each weighing 10 g, underwent sieving and were then blended with anhydrous sodium sulfate. To conduct recovery studies, surrogate standard deuterium-branded PAHs (Chrysene-D12, Naphthalene-D8, Anthracene-D10, and Phenanthrene-D10) were spiked into the agricultural topsoil at a concentration of 200 µg L−1. The samples then underwent a solvent extraction procedure [34]. In this procedure, the samples were subjected to 24 h of soxhlet extraction using a 200 mL mixture of hexane and acetone (v/v 1:1). The solvent was later evaporated using a rotary evaporator (Hei-VAP Core—hand lift model with G1 diagonal glassware). Using a silica gel column clean-up method, the concentrated samples were further purified. For this, 10 g of activated silica gel (60 mesh, Merck) and 5 g of anhydrous Na2SO4 were added to a glass column that was 30 cm long and 3 cm in diameter. A 60 mL mixture of dichloromethane and hexane (1:1 v/v) was used as an eluent to collect the final cleaned fraction. Subsequently, the eluent solvent was condensed to 1 mL using a moderate stream of pure nitrogen. To quantify all analytes, 10 µL of the internal standard hexamethyl benzene was included before analysis.
The agricultural soil samples from the Jamshedpur range were subjected to analysis to detect the presence of the 16 priority pollutant PAHs as defined by the US Environmental Protection Agency (USEPA). These PAHs include Naphthalene (NA), Phenanthrene (Phen), Fluoranthene (Flur), Anthracene (AN), Acenapthylene (ACY), Acenaphthene (AC), Fluorene (Fluo), Chrysene (CHRY), Benzo[g, h, i]perylene (BgP), Pyrene (Pye), Benzo(a)Anthracene (BaA), Benzo(b)Fluoranthene (BbF), Benzo(k)Fluoranthene (BkF), Dibenzo[a, h]anthracene (DBA), Benzo(a)Pyrene (BaP), and Indeno [1,2,3-cd]pyrene (IN).
The analysis was carried out using an Agilent 7890B Gas Chromatograph (GC-FID) equipped with an HP-5 MS capillary column (30 m × 0.32 mm × 0.25 µm) and a 7-inch cage. Each test sample (1 µL) was injected in splitless mode, and high-purity nitrogen gas was used as the carrier gas at a flow rate of 1.83 mL min−1. The initial oven temperature was set at 70 °C for 60 s and then gradually increased at a rate of 5 °C/min until it reached 300 °C. The transmission line and injector temperatures were maintained at 290 °C and 320 °C, respectively. The replicate sample analysis was also performed for each sample. The number of replicates used in the study allows for a better understanding of the statistical analysis and the robustness of the results.
2.5. Quality Assurance
Prior to laboratory analysis, we cleaned all glassware thoroughly using hexane (CAS Number-110-54-3) and deionized water. The chemicals and materials used in this study were of high-performance liquid chromatography (HPLC) quality and were obtained from Merck and JT Baker. Hexamethyl benzene (CAS Number-87-85-4, brand: Sigma Aldrich, St. Louis, MO, USA), deuterium-labeled PAHs (solvents of HPLC grade), and acetonitrile (ID-3697900) were employed as standard solutions for the 16 PAHs. In addition, Chrysene-D12 (CAS Number-1719-03-5), Anthracene-D10 (CAS Number-1719-06-8), Naphthalene-D8 (CAS Number-1146-65-2), and Phenanthrene-D10 (CAS Number-1517-22-2) were used as surrogate standards in the study, along with clear procedural tests, test copies, and tests spiked with surrogate standards.
The stock solution was diluted with acetonitrile (HPLC grade JT Baker) in a stepwise manner to generate a series of nine PAH calibration standards, with concentrations ranging from 1 g L−1 to 15 g L−1. These standards were utilized to construct a calibration curve with 5 data points. To ensure instrument stability, the calibration curve was generated for each standard solution containing the 16 PAHs and was periodically verified using the middle level of the calibration standards. The linearity of the curve, with values ranging from 0.9932 to 0.9980, was found to be within the acceptable limit of r2 0.9900 [35]. The recovery rates of deuterated PAHs (Naphthalene-D8, Phenanthrene-D10, Chrysene-D12, and Anthracene-D10) in soil samples were determined as 61 ± 12%, 82 ± 11%, 81 ± 12%, and 74 ± 10%, respectively.
Similar testing and extraction procedures were used on field and laboratory blanks. The indicated concentration of the target compounds in clean spiked samples was combined with the standard deviation (SD) to determine the method detection limits (MDLs) for the target PAHs. Ten times the SD was chosen as the limits of quantitation (LOQs). The LOQ was in the range of 0.03 to 0.15 g L−1, whereas the LOD was in the range of 0.02 to 0.08 g L−1. The standard deviation for the technique was <12%, and concentrations below the detection limit were regarded as below the quantification limit.
2.6. Risk Assessment
The environmental risk caused by PAHs was calculated considering the toxicity of individual PAHs. The toxicity equivalence factors (TEFs) of USEPA, [36,37,38], were used for determining the toxicity. The TEFs and risk assessment standards (RASs) recommended in [39] were used in this study. Bap (TEF = 1, RAS = 0.1 mg kg−1) was utilized as the reference chemical [40], and additional RASs were computed based on the ratio of Bap to the various PAHs. The ecological threat index was calculated by the mixture of the Nemerow index and ratio procedures using the following formula:
The Q value was used to divide the danger levels of PAHs in soil [40]. Where Q stands for the environmental risk index, ci for individual PAH concentration in agricultural topsoil, si for individual PAH RAS value, and max and avg for the highest and average ci to si ratios, respectively. Specifically, “Q ≤ 1”, “1 < Q ≤ 3”, “3 < Q ≤ 6”, and “Q > 6” are the categories of safe, low risk, medium risk, and high risk.
3. Results and Discussion
3.1. Soil Attributes
The soil characteristics, namely, pH, total organic carbon percentage (TOC%), clay (%), slit (%), and sand percentage, are given in Table 1. These properties are considered to have a vital role in affecting the sorption, mobility, outcome, and spread of PAHs in soil [41]. The soil pH ranged from 7.18 to 9.82, with a mean value of 8.63, suggesting moderate to strongly alkaline soil. TOC plays a vital role in predicting soil contamination with PAHs because it can predict PAH’s adsorption to soil [42]. The percentage of TOC extended from 0.81% to 6.35%, with a mean value of 3.05%. The particle size distribution of soils is also analyzed, which shows the percentage of the slit (%) is maximum in all agricultural topsoil samples. The slit (%) ranged from 48.83% to 73.27%, which shows the maximum percentage of 2–50 µm particle size. After the slit (%), sand (%) is another predominant particle in the soil samples, followed by clay (%) in most of the samples.

Table 1.
Physicochemical properties of agricultural topsoils of treated wastewater-irrigated area.
3.2. PAHs Concentration and Distribution in TWWI Agricultural Topsoil
The selected 16 US EPA priority PAH concentrations (total PAHs) in treated wastewater-irrigated (TWWI) agricultural topsoils were given in Table 2. The concentration of total PAHs in TWWI agricultural soil varied from 163.9 ng g−1 to 9177.4 ng g−1, with a total mean value of 4179.4 ± 2318.7 ng g−1. Hence, the outcomes indicated that the TWWI agricultural soils were heavily contaminated. The concentrations in this area were analogous to those formerly described for WWI soil outlines collected in Beijing and Tianjin (17.8–8357.2 ng g−1) [43,44], and the measured values were higher than those found in the soil samples from Nanjing and Yixing in the Jiangsu region (17.7–717.1 ng g−1) [45] and Hanpu region (23.1–2373.0 ng g−1) [46], China. The total concentration of PAHs in agricultural topsoils of five villages was in the order: Sarjamda > Tuibasa > Khairbani > Dhanchatni > Khursi, respectively (Figure 2). The PAH content in the Sarjamda region was significantly higher compared to other areas where wastewater irrigation occurs, suggesting that the elevated concentration of PAHs in the soils can be attributed to wastewater irrigation [46]. The maximum concentration of Ʃ16PAHs was detected at sampling spot S17 (6975.5 ng g−1) followed by S18 (6823.6 ng g−1), S19 (6579.5 ng g−1), and S20 (6453.1 ng g−1) (Figure 2). The sampling point S29 (1200.5 ng g−1) (Figure 2) was found to be the minimum concentration of Ʃ16PAHs. Since PAH deposition might occur with the suspended particles introduced by TWW, the 16 PAHs are highest in the topsoil [47]. Furthermore, other PAH sources, such as air deposition, are present in the topsoil [48]. Among the 16 PAHs, the four most abundant were Flur (478.3 ± 266.4 ng g−1), Pye (475.7 ± 284.7 ng g−1), BaA (310.9 ± 193.8 ng g−1), and DBA (345.9 ± 211.5 ng g−1) (Figure 3). The Σ LMW PAHs ranged from 93.5 ng g−1 to 2078.8 ng g−1, and Σ HMW PAHs ranged from 70.4 ng g−1 to 7098.6 ng g−1, respectively. Among the LMW PAHs, Phen (277.9 ± 124.2 ng g−1), ACY (269.6 ± 143.9 ng g−1), and Fluo (166.4 ± 72.1 ng g−1) (Figure 3) were dominant. Similar results were also observed in [49], which showed that Phen and Fluo were the leading properties in India’s agricultural soils. Similar results were observed in [50]. The ring-wise distribution of 16 PAHs in the soils of the TWWI region is shown in Figure 4, with the 4-ring PAHs contributing 36.02% of the total PAHs, followed by the 5-ring PAHs with 28.47%, the 3-ring PAHs with 21.32%, the 6-ring PAHs with 11.07%, and the 2-ring PAHs with 3.12%. The LMW PAHs are predominantly in gaseous form and subjected to a means of long-range movement from their origin, which may be inferred from the relatively lower concentration of LMW PAHs and the dominance of HMW PAHs in the agricultural topsoils. HMW PAHs, however, are more likely to deposit quickly and their origin may be related to nearby emission sources [49]. According to the experiential concentrations, the PAH contaminants can be classified into four categories based on their concentration levels: (i) uncontaminated (16 PAHs less than 200 ng g−1), (ii) lightly polluted (200 ng g−1 to 600 ng g−1), (iii) moderately polluted (600 ng g−1 to 1000 ng g−1), and (iv) highly polluted (16 PAHs exceeding 1000 ng g−1) [51]. Based on this classification, agricultural topsoils are considered moderately to severely polluted.
Table 2.
The descriptive statistics for the concentration of PAHs (ng g−1) in the agricultural topsoils of Jamshedpur are presented.
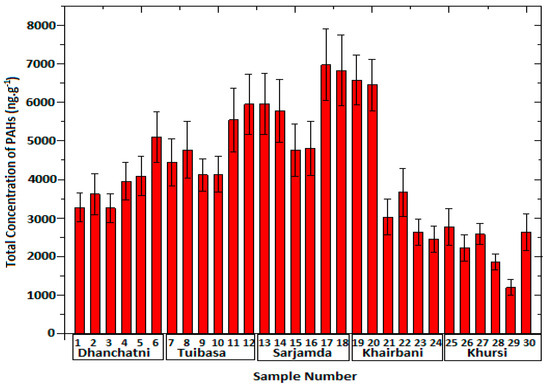
Figure 2.
Total concentration of PAHs (ng g−1) in agricultural topsoils.
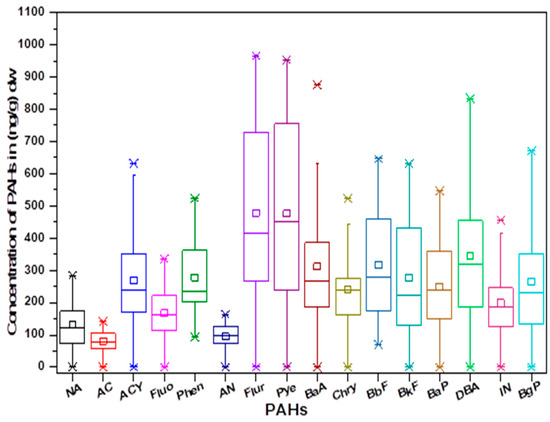
Figure 3.
Concentration of individual PAHs (ng g−1) in agricultural topsoils.
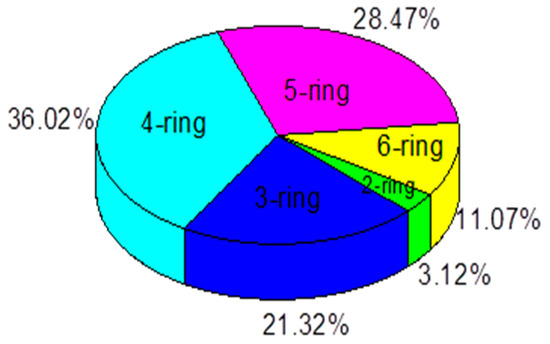
Figure 4.
The ring-wise percentage composition of PAHs.
3.3. Source Apportionment
3.3.1. Diagnostic Ratios (DRs)
To classify the potential source of PAH contamination in soil and lessen ecological uncertainty, diagnostic ratios are frequently used in applications [17,51]. The most significant source comes from organic chemicals that react at high temperatures [52,53]. Two more significant sources of PAHs are the low-temperature evaporation of petroleum and the precipitation of geological dust. Two- or three-ringed PAHs with low molecular weights indicate contaminated gasoline. High-molecular-weight substances (those with more than four rings) have an impact comparable to that of fossil fuels burned at high temperatures [54]. In this study, the molecular ratios of Flur/(Flur + Pye), AN/(AN + Phen), and IN/(IN + BgP) were utilized to determine the likely sources of PAHs in agricultural topsoils (refer to Table 3). A ratio of AN/(AN + Phen) greater than 0.1 indicates a combustion source, while ratios below 0.1 indicate a petroleum origin [17]. The Flur/(Flur + Pye) ratio serves as a critical point to differentiate between petroleum and combustion sources. A ratio less than 0.4 indicates a petroleum source, greater than 0.5 indicates coal, grass, or wood burning, and values between 0.4 and 0.5 indicate petroleum burning. Similarly, the IN/(IN + BgP) ratios below 0.2, above 0.5, and between 0.2 and 0.5 correspond to petroleum, combustion of coal, grass, wood, and petroleum, respectively [53].
Table 3.
The diagnostic ratio values and potential origin of PAHs in agricultural topsoils.
As depicted in Figure 5, 62% of the IN/(IN + BgP) ratios fell within the range of 0.2–0.5, and 34% were greater than 0.5, suggesting the presence of petroleum, coal, grass, or wood combustion. Regarding the AN/(AN + Phen) ratios, 93% of agricultural topsoil samples exhibited values greater than 0.1, indicating a combustion source, while 7% had ratios below 0.1, suggesting a petroleum origin. Moreover, 31% of the Flur/(Flur + Pye) ratios were below 0.4, implying a petroleum source, 17% fell between 0.4 and 0.5, indicating petroleum combustion, and 52% were greater than 0.5, pointing to coal, grass, or wood combustion. The diagnostic ratios showed that the contamination of PAHs in agricultural topsoils, irrigated with treated wastewater, primarily resulted from burning, gasoline combustion, and coal, grass, or forest combustion. However, to better understand the involvement of each PAH origin, a PMF (Positive Matrix Factorization) analysis was conducted on the data sets to identify specific sources and their respective contributions.
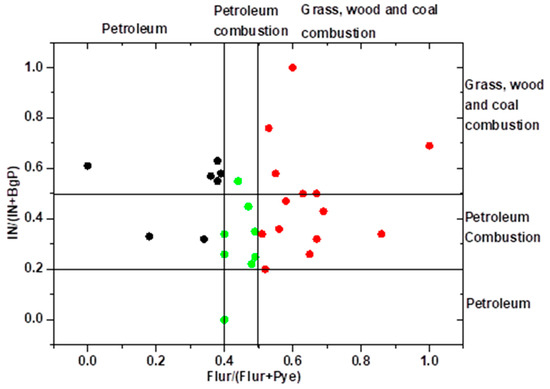
Figure 5.
The diagnostic ratios for source allocation in the treated wastewater-irrigated area.
3.3.2. Positive Matrix Factorization (PMF)
The PMF model (version 5.0) was used to analyze the concentration data sets of 16 PAHs from 30 agricultural topsoil samples collected from the TWWI in agriculture, along with their associated uncertainty values. PMF is a popular and efficient technique [55]. Using the following formula, the uncertainty of specific PAHs for various soil samples was measured:
Furthermore, when the concentration is below the method detection limit (MDL), the uncertainty can be determined using the following calculation:
In this study, the term “concentration” refers to PAHs, while “MDLs” stands for the method detection limits of PAHs. The error fraction was calculated by comparing replicate measurements of each sample. For instance, the error percent was calculated as (C1 C2)/[(C1 + C2)/2]×100% when a sample’s concentration was measured twice and the results were C1 and C2. By taking into account all of the calculated error fractions, a total error part of 19% was achieved. The complete PAH PMF calculations involved 100 bootstrapped base runs, with a random base seed of 58. The signal-to-noise (S/N) ratio ranged from a minimum of 1.4 for NA to a maximum of 5.4 for BbF, with all other PAHs, except NA and AC, having an S/N ratio greater than 2. The PMF analysis analyzed four factors among three to six factors using molecular markers from multiple sources and required a minimum correlation of R = 0.6 [26]. Each run’s results were assessed for stability and consistency using the Q value, residual assessment, and correlation coefficients between the observed and projected concentrations. The average Qtrue value was 544.5, while the average Qrobust value was 649.2. The Fpeak values converged between −0.5 and 1.5. Figure 6 presents the percentage contributions and fractional concentrations of the four factors obtained from the analysis. Additionally, Figure 7 shows the source profiles and contributions of 16 PAHs in agricultural topsoils resulting from the PMF analysis. Factor 1, responsible for 11.7% of all factor contributions, was associated with PAHs, such as Flur, Pye, BbF, Chry, BaA, and BkF, which are typical markers for coal combustion [56,57]. Flur was linked to the burning of biomass, such as grasses and wood [58]. Therefore, factor 1 can be identified as a source of combustion, such as coal, grasses, or wood burning. Factor 2, accounting for 9.4% of all factor contributions, was characterized by Pye, BaP, and BgP. BgP and BaP are associated with PAH emissions from vehicle exhaust, while Pye is primarily obtained from the burning of fossil fuels [59,60]. Factor 2 likely represents a source of petroleum burning. Factor 3, contributing to 50.6% of the total 16 PAHs, was primarily made up of NA, AC, ACY, Phen, Fluo, and AN, which are normally released during the combustion of fossil fuels, coal, and coke [8,54,61,62]. As a result, factor 3 was classified as a combination of sources that burn coal and oil. The five- and six-ring PAHs, BaP, DBA, and IN, accounted for 28.4% of the total measured PAHs and dominated factor 4. While DBA and IN are signs of significant diesel emissions, BgP has been connected to vehicle emissions [54,62,63]. However, factor 4 pointed to a source of burning petroleum. The diagnostic ratio and PMF data showed that substantial sources of contamination in agricultural topsoils irrigated with treated wastewater (TWWI) include petroleum combustion, vehicle emissions, and coal, grassland, or wood burning.
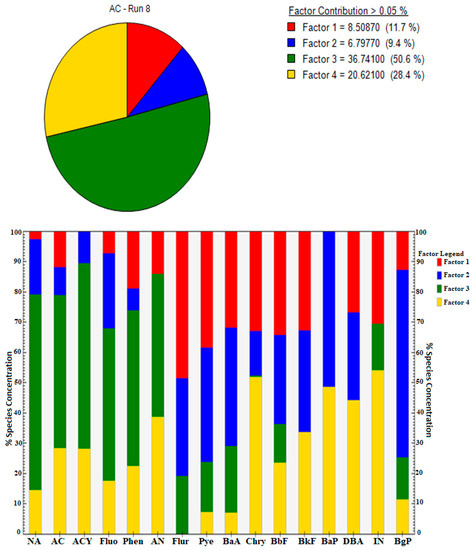
Figure 6.
The PMF model provides information on the percentage contributions and fractional concentrations of four factors.
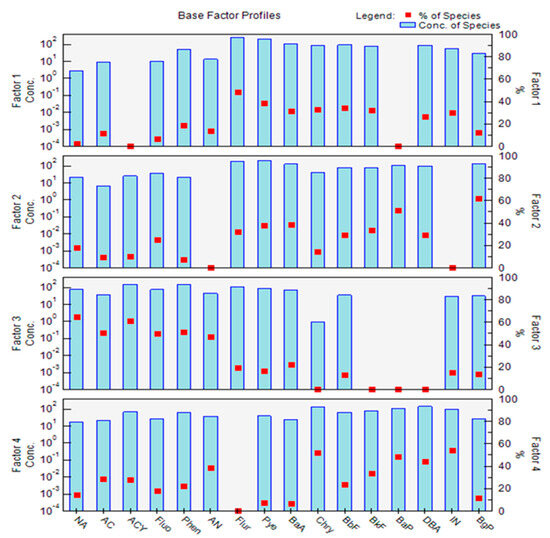
Figure 7.
The source contribution and profiles of PAHs in agricultural topsoils are analyzed and determined.
3.4. Correlation Coefficient Results
The correlation coefficients between PAHs, granularity, pH, and TOC (%) are given in Table 4. From the results, the findings showed that there was a negative correlation of PAHs with pH except for AC, Fluo, and IN. The PAHs show a positive relationship with the percentage of TOC (%), except AC, Fluo, and IN, which may be due to a positive correlation between the pH and polarization of the soil organic matter, which decreases PAHs adsorption into soil organic matter by an increase in pH. Zhao et al. [64] outlined that the TOC is a critical factor in describing the transportation of PAHs in topsoils. The 16 PAHs show a significant positive correlation with TOC (%), except AC, Fluo, and IN. This is due to PAHs’ hydrophobic nature, which combines with the soil organic matter after PAHs enter the soil. Moreover, the PAHs show a negative correlation with clay and slit, whereas a positive correlation with sand.
Table 4.
Related coefficients between PAHs and pH, TOC, and granularity of agricultural topsoils.
3.5. Risk Assessment
The environmental risk assessment shows that the TWWI areas were at low to high risk. The ecological risk index values are given in Table 5, which indicates that the PAHs NA, AC, and Fluo cause low risk, whereas the PAHs ACY, Phen, Flur, and Pye cause medium risk. The HMW PAHs cause high risk in the TWWI agricultural topsoil sampling areas. Thus, this TWWI area poses a high environmental risk due to PAH pollution in agricultural topsoils.
Table 5.
The environmental risk index values for the individual PAHs in agricultural topsoils.
4. Conclusions
This work focused on the contamination, dissemination, possible sources identification, and environmental risk assessment of PAHs from agricultural topsoils sampled directly next to an urban area and irrigated with TWW for many years. Total PAH concentrations varied from 163.9 ng g−1 to 9177.4 ng g−1, with a mean value that was 4179.4 ± 2318.7 ng g−1. The total concentration of PAHs in TWWI areas of five villages was in the order: Sarjamda > Tuibasa > Khairbani > Dhanchatni > Khursi, which indicates the soil accumulation of PAHs by use of wastewater irrigation. The HMW PAHs Flur, Pye, BaA, and DBA were most abundant in all samples. Among the LMW PAHs, Phen, ACY, and Fluo were dominant. The 4-ring PAHs were the main contributors, followed by 5-ring and 3-ring PAHs. The dominance of HMW PAHs is due to their rapid deposition caused by the local emission sources and TWWI in the agricultural fields. From the findings, it is presumed that the agricultural topsoils are considered moderately to severely polluted. The diagnostic ratio and PMF results showed that petroleum combustion, vehicular releases, char, grass, or wood burning were the critical potential sources of contamination. A negative correlation was reported between pH, clay, silt, and PAHs. In this study, the PAHs in TWWI area soils are more concentrated than in most studies in India, mainly due to soil texture differences. Furthermore, a positive correlation was significantly observed between PAHs and TOC. Based on the environmental risk assessment model, the study area possesses a high ecological risk due to PAH pollution in agricultural topsoils. Attention should be given to TWWI regarding the accumulation of persistent organic toxins in agricultural soils.
Author Contributions
Conceptualization, sampling, original writing draft—review and editing, formal analysis, and visualization, S.S.S.; writing—review and editing, investigation, visualization, and data curation, B.A.; funding acquisition and investigation, F.M. and H.A.A.-L.; editing, A.A.S. All authors have read and agreed to the published version of the manuscript.
Funding
The Deputyship for Research and Innovation, “Ministry of Education” in Saudi Arabia funded this research under project no. IFKSUOR3-097-1.
Institutional Review Board Statement
Not applicable.
Informed Consent Statement
Not applicable.
Data Availability Statement
Not applicable.
Acknowledgments
The authors extend their appreciation to the Deputyship for Research and Innovation, “Ministry of Education” in Saudi Arabia for funding this research (IFKSUOR3-097-1).
Conflicts of Interest
The authors declare no conflict of interest.
References
- Wiener, M.J.; Jafvert, C.T.; Nies, L.F. The assessment of water uses and reuse through reported data: A US case study. Sci. Total Environ. 2016, 539, 70–77. [Google Scholar] [CrossRef] [PubMed]
- Song, Y.F.; Wilke, B.M.; Song, X.Y.; Gong, P.; Zhou, Q.X.; Yang, G.F. Polycyclic aromatic hydrocarbons (PAHs), polychlorinated biphenyls (PCBs) and heavy metals (HMs) as well as their genotoxicity in soil after long-term wastewater irrigation. Chemosphere 2006, 65, 1859–1868. [Google Scholar] [CrossRef] [PubMed]
- Singh, K.P.; Mohan, D.; Sinha, S.; Dalwani, R. Impact assessment of treated/untreated wastewater toxicants discharged by sewage treatment plants on health, agricultural, and environmental quality in the wastewater disposal area. Chemosphere 2004, 55, 227–255. [Google Scholar] [CrossRef] [PubMed]
- Wang, Y.; Wang, Z.J.; Ma, M.; Wang, C.X.; Mo, Z. Monitoring priority pollutants in a sewage treatment process by dichloromethane extraction and triolein-semipermeable membrane device (SPMD). Chemosphere 2001, 43, 339–346. [Google Scholar] [CrossRef] [PubMed]
- Graham, M.; Miller, C. Disclosure of toxic releases in the United States. Environment 2001, 43, 9–20. [Google Scholar]
- Mc Ginn, A.P. Reducing our toxic burden. In State of the World: A World Watch Institute Report on Progress toward a Sustainable, Society; Flavin, C., French, H., Gardner, G., Eds.; Norton: New York, NY, USA, 2002; pp. 75–100. [Google Scholar]
- Botwe, B.O.; Kelderman, P.; Nyarko, E.; Lens, P.N.L. Assessment of DDT, HCH and PAH contamination and associated ecotoxicological risks in surface sediments of coastal Tema Harbour (Ghana). Mar. Pollut. Bull. 2017, 115, 480–488. [Google Scholar] [CrossRef]
- Ravindra, K.; Sokhi, R.; Van, G.R. Atmospheric polycyclic aromatic hydrocarbons: Source attribution, emission factors and regulation. Atmos. Environ. 2008, 42, 2895–2921. [Google Scholar] [CrossRef]
- IARC. IARC monographs on the evaluation of the carcinogenic risk of chemicals to humans. Overall Eval. Carcinog. Updat. IAPC Monogr. 1987, 7, 1–42. [Google Scholar]
- Zheng, B.; Wang, L.; Lei, K.; Nan, B. Distribution and ecological risk assessment of polycyclic aromatic hydrocarbons in water, suspended particulate matter and sediment from Daliao River estuary and the adjacent area, China. Chemosphere 2016, 149, 91–100. [Google Scholar] [CrossRef]
- Douben, P.E. PAHs: An Ecotoxicological Perspective; John Wiley & Sons: Hoboken, NJ, USA, 2003. [Google Scholar]
- Abdollahi, S.; Raoufi, Z.; Faghiri, I.; Savari, A.; Nikpour, Y.; Mansouri, A. Contamination levels and spatial distributions of heavy metals and PAHs in surface sediment of Imam Khomeini Port, Persian Gulf, Iran. Mar. Pollut. Bull 2013, 71, 336–345. [Google Scholar] [CrossRef]
- Tavakoly, S.S.; Hashim, R.; Salleh, A.; Rezayi, M.; Mehdinia, A.; Safari, O. Polycyclic aromatic hydrocarbons in coastal sediment of Klang Strait, Malaysia: Distribution pattern, risk assessment and sources. PLoS ONE 2014, 9, e94907. [Google Scholar] [CrossRef] [PubMed]
- Hale, S.E.; Lehmann, J.; Rutherford, D.; Zimmerman, A.R.; Bachmann, R.T.; Shitumbanuma, V.; O’Toole, A.; Sundqvist, K.L.; Arp, H.P.H.; Cornelissen, G. Quantifying the total and bioavailable polycyclic aromatic hydrocarbons and dioxins in biochars. Environ. Sci. Technol 2012, 46, 2830–2838. [Google Scholar] [CrossRef] [PubMed]
- Zakaria, M.P.; Takada, H.; Tsutsumi, S.; Ohno, K.; Yamada, J.; Kouno, E.; Kumata, H. Distribution of polycyclic aromatic hydrocarbons (PAHs) in rivers and estuaries in Malaysia: A widespread input of petrogenic PAHs. Environ. Sci. Technol 2002, 36, 1907–1918. [Google Scholar] [CrossRef] [PubMed]
- Okuda, T.; Okamoto, K.; Tanaka, S.; Shen, Z.X.; Han, Y.M.; Huo, Z.Q. Measurement and source identification of polycyclic aromatic hydrocarbons (PAHs) in the aerosol in Xi’an, China, by using automated column chromatography and applying positive matrix factorization (PMF). Sci. Total Environ. 2010, 408, 1909–1914. [Google Scholar] [CrossRef] [PubMed]
- Tobiszewski, M.; Namiesnik, J. PAH diagnostic ratios for the identification of pollution emission sources. Environ. Pollut. 2012, 162, 110–119. [Google Scholar] [CrossRef] [PubMed]
- Ma, W.L.; Li, Y.F.; Qi, H.; Sun, D.Z.; Liu, L.Y.; Wang, D.G. Seasonal variations of sources of polycyclic aromatic hydrocarbons (PAHs) to a northeastern urban city, China. Chemosphere 2010, 79, 441–447. [Google Scholar] [CrossRef]
- Pérez, F.B.; Viñas, L.; Franco, M.Á.; Bargiela, J. PAHs in the Ría de Arousa (NW Spain): A consideration of PAHs sources and abundance. Mar. Pollut. Bull. 2015, 95, 155–165. [Google Scholar] [CrossRef]
- Peng, X.Z.; Tang, C.; Yu, Y.; Tan, J.; Huang, Q.; Wu, J.; Chen, S.; Mai, B. Concentrations, transport, fate, and releases of polybrominated diphenyl ethers in sewage treatment plants in the Pearl River Delta, South China. Environ. Int. 2009, 35, 303–309. [Google Scholar] [CrossRef]
- Wang, T.; Wang, Y.; Fu, J.; Wang, P.; Li, Y.; Zhang, Q.; Jiang, G. Characteristic accumulation and soil penetration of polychlorinated biphenyls and polybrominated diphenyl ethers in wastewater irrigated farmlands. Chemosphere 2010, 81, 1045–1051. [Google Scholar] [CrossRef]
- Fenet, E.; Mathieu, M.; Mahjoub, O.; Li, Z.; Hillaire-Buys, D.; Casellas, C.; Gomez, E. Carbamazepine, carbamazepine epoxide and dihydroxycarbamazepine sorption to soil and occurrence in a wastewater reuse site in Tunisia. Chemosphere 2012, 88, 49–54. [Google Scholar] [CrossRef]
- Khadhar, S.; Charef, A.; Hidri, Y.; Higashi, T. The effect of long-term soil irrigation by wastewater on organic matter, polycyclic aromatic hydrocarbons, and heavy metals evolution: Case study of Zaouit Sousse (Tunisia). Arab. J. Geosci 2013, 6, 4337–4346. [Google Scholar]
- Graaff, R.H.; Suter, H.C.; Lawes, S.J. Long-term effects of municipal sewage on soils and pastures. J. Environ. Sci Health A 2002, 37, 745–757. [Google Scholar] [CrossRef] [PubMed]
- Bandowe, B.A.M.; Shukurov, N.; Kersten, M.; Wilcke, W. Polycyclic aromatic hydrocarbons (PAHs) and their oxygen-containing derivatives (OPAHs) in soils from the Angren industrial area, Uzbekistan. Environ. Pollut. 2010, 158, 2888–2899. [Google Scholar] [CrossRef] [PubMed]
- Li, J.; Zheng, Y.; Luo, X.; Lin, Z.; Zhang, W.; Wang, X. PAH contamination in Beijing’s topsoil: A unique indicator of the megacity’s evolving energy consumption and overall environmental quality. Sci. Rep. 2016, 6, 33–245. [Google Scholar] [CrossRef]
- Zhao, Z.; Zeng, H.; Wu, J.; Zhang, L. Concentrations, sources and potential ecological risks of polycyclic aromatic hydrocarbons in soils of Tajikistan. Int. J. Environ. Pollut. 2017, 61, 13–28. [Google Scholar] [CrossRef]
- Ambade, B.; Sethi, S.S.; Kumar, A.; Sankar, T.K.; Kurwadkar, S. Health Risk Assessment, Composition, and Distribution of Polycyclic Aromatic Hydrocarbons (PAHs) in Drinking Water of Southern Jharkhand, East India. Arch. Environ. Contam. Toxicol. 2020, 80, 120–133. [Google Scholar] [CrossRef]
- Ambade, B.; Sethi, S.S. Health Risk Assessment and Characterization of Polycyclic Aromatic Hydrocarbon from the Hydrosphere. J. Hazard. Toxic. Radioact. Waste 2021, 25, 05020008. [Google Scholar] [CrossRef]
- Kumar, A.; Ambade, B.; Sankar, T.K.; Sethi, S.S.; Kurwadkar, S. Source identification and health risk assessment of atmospheric PM2.5-bound polycyclic aromatic hydrocarbons in Jamshedpur, India. Sustain. Cities Soc. 2020, 52, 101–801. [Google Scholar] [CrossRef]
- Walkley, A.; Black, C.A. An estimation method for determination of soil organic matter and a proposed modification of the chromic acid titration method. Soil Sci. 1934, 37, 29–33. [Google Scholar] [CrossRef]
- Jackson, M.L. Soil Chemical Analysis; Prentice Hall of India Pvt. Ltd.: New Delhi, India, 1973. [Google Scholar]
- Ashwortha, J.; Keyesa, D.; Kirka, R.; Lessard, R. Standard procedure in the hydrometer method for particle size analysis, Commun. Soil Sci. Plant Anal. 2001, 32, 633–642. [Google Scholar] [CrossRef]
- Zhang, S.; Yao, H.; Lu, Y.; Yu, X.; Wang, J.; Sun, S.; Liu, M.; Li, D.; Li, Y.F.; Zhang, D. Uptake and translocation of polycyclic aromatic hydrocarbons (PAHs) and heavy metals by maize from soil irrigated with wastewater. Sci. Rep. 2017, 7, 12165. [Google Scholar] [CrossRef] [PubMed]
- Adeniji, A.O.; Okoh, O.O.; Okoh, A.I. Petroleum hydrocarbon fingerprints of water and sediment samples of Buffalo River Estuary in the Eastern Cape Province, South Africa. J. Anal. Met. Chem. 2017, 2017, 2629365. [Google Scholar] [CrossRef]
- USEPA (United State Environmental Protection Agency). Provisional Guidance for Quantitative Risk Assessment of Polycyclic Aromatic Hydrocarbons EPA-600/R-93/089; United State Environmental Protection Agency: Research Triangle Park, NC, USA, 1993.
- Halek, F.; Nabi, G.H.; Kavousi, A. Polycyclic aromatic hydrocarbons study and toxic equivalency factor (TEFs) in Tehran, IRAN. Environ. Monit. Assess. 2008, 143, 303–311. [Google Scholar] [CrossRef] [PubMed]
- Wu, B.; Guo, S.; Li, X.; Wang, J. Temporal and spatial variations of polycyclic aromatic hydrocarbons (PAHs) in soils from a typical organic sewage irrigation area. Sci. Total Environ. 2018, 614, 513–520. [Google Scholar] [CrossRef]
- Peng, C.; Chen, W.P.; Liao, X.L.; Wang, M.E.; Ouyang, Z.Y.; Jiao, W.T.; Bai, Y. Polycyclic aromatic hydrocarbons in urban soils of Beijing: Status, sources, distribution and potential risk. Environ. Pollut. 2011, 159, 802–808. [Google Scholar] [CrossRef] [PubMed]
- MEP (Ministry of Environmental Protection of the Reople’s Republic of China). Technical Regulations for National Soil Pollution Assessment; Ministry of Environmental Protection of the Reople’s Republic of China: Beijing, China, 2008.
- Tong, R.; Yang, X.; Su, H.; Pan, Y.; Zhang, Q.; Wang, J.; Long, M. Levels, sources and probabilistic health risks of polycyclic aromatic hydrocarbons in the agricultural soils from sites neighboring suburban industries in Shanghai. Sci. Total Environ. 2018, 616–617, 1365–1373. [Google Scholar] [CrossRef] [PubMed]
- Wang, X.T.; Miao, Y.; Zhang, Y.; Li, Y.C.; Wu, M.H.; Yu, G. Polycyclic aromatic hydrocarbons (PAHs) in urban soils of the megacity Shanghai: Occurrence, source apportionment and potential human health risk. Sci. Total Environ. 2013, 447, 80–89. [Google Scholar] [CrossRef] [PubMed]
- Bu, Q.W.; Zhang, Z.H.; Lu, S.; He, F.P. Vertical distribution and environmental significance of PAHs in soil profiles in Beijing, China. Environ. Geochem. Health 2009, 31, 119–131. [Google Scholar] [CrossRef]
- He, F.P.; Zhang, Z.H.; Wan, Y.Y.; Lu, S.; Wang, L.; Bu, Q.W. Polycyclic aromatic hydrocarbons in soils of Beijing and Tianjin region: Vertical distribution, correlation with TOC and transport mechanism. J. Environ. Sci. 2009, 21, 675–685. [Google Scholar] [CrossRef]
- Ding, A.F.; Pan, G.X.; Li, L.Q. Distribution profiles of polycyclic aromatic hydrocarbons in soils of Nanjing and Yixing city. Environ. Sci Technol. 2010, 33, 115–118. [Google Scholar]
- Xiao, R.; Du, X.M.; He, X.Z.; Zhang, Y.J.; Yi, Z.H.; Li, F.S. Vertical distribution of polycyclic aromatic hydrocarbons (PAHs) in Hunpu wastewater-irrigated area in northeast China under different land use patterns. Environ. Monit Assess. 2008, 142, 23–34. [Google Scholar] [CrossRef] [PubMed]
- Song, Y.F.; Chang, S.J.; Li, L.; Ma, X.J.; Sun, T.H. Accumulation and dynamic change of polycyclic aromatic hydrocarbons (PAHs) in wastewater irrigated soils. Chin. J. Appl. Ecol. 1997, 8, 93–98. (In Chinese) [Google Scholar]
- Weissenfels, W.D.; Klewer, H.J.; Langhoff, J. Adsorption of polycyclic aromatic hydrocarbons (PAHs) by soil particles: Influence on biodegradability and biotoxicity. Appl. Microbiol. Biotechnol. 1992, 36, 689–696. [Google Scholar] [CrossRef]
- Liu, J.J.; Liu, G.J.; Zhang, J.M.; Yin, H.; Wang, R.W. Occurrence and risk assessment of polycyclic aromatic hydrocarbons in soil from the Tiefa coal mine district, Liaoning, China. J. Environ. Monit. 2012, 14, 2634–2642. [Google Scholar] [CrossRef] [PubMed]
- Agarwal, T.; Khillare, P.S.; Shridhar, V.; Ray, S. Pattern, sources and toxic potential of PAHs in the agricultural soils of Delhi, India. J. Hazard. Mater. 2009, 163, 1033–1039. [Google Scholar] [CrossRef] [PubMed]
- Maliszewska-Kordybach, B. Polycyclic aromatic hydrocarbons in agricultural soils in Poland: Preliminary proposals for criteria to evaluate the level of soil contamination. Appl. Geochem. 1996, 1–2, 121–127. [Google Scholar] [CrossRef]
- Cai, C.; Li, J.; Wu, D.; Wang, X.; Tsang, D.C.W.; Li, X.; Sun, J.; Zhu, L.; Shen, H.; Tao, S.; et al. Spatial distribution, emission source and health risk of parent PAHs and derivatives in surface soils from the Yangtze River Delta, eastern China. Chemosphere 2017, 178, 301–308. [Google Scholar] [CrossRef]
- Yunker, M.B.; Acdonald, R.W.; Vingarzan, R.; Mitchell, R.H.; Goyette, D.; Sylvestre, S. PAHs in the Fraser River basin: A critical appraisal of PAH ratios as indicators of PAH source and composition. Org. Geochem. 2002, 33, 489–515. [Google Scholar] [CrossRef]
- Wang, Y.L.; Xia, Z.H.; Liu, D.; Qiu, W.X.; Duan, X.L.; Wang, R.; Liu, W.J.; Zhang, Y.H.; Wang, D.; Tao, S.; et al. Multimedia fate and source apportionment of polycyclic aromatic hydrocarbons in a coking industry city in Northern China. Environ. Pollut. 2013, 181, 115–121. [Google Scholar] [CrossRef]
- Callén, M.S.; Iturmendi, M.; López, J.M. Source apportionment of atmospheric PM2.5-bound polycyclic aromatic hydrocarbons by a PMF receptormodel. Assessment of potential risk for human health. Environ. Pollut. 2014, 195, 167–177. [Google Scholar] [CrossRef]
- Huang, W.; Huang, B.; Bi, X.H.; Lin, Q.H.; Liu, M.; Ren, Z.F.; Zhang, G.H.; Wang, X.M.; Sheng, G.Y.; Fu, J.M. Emission of PAHs, NPAHs and OPAHs from the residential honeycomb coal briquettes combustion. Energy Fuel 2013, 28, 636–642. [Google Scholar] [CrossRef]
- Qin, L.; Han, J.; He, X.; Lu, Q. The emission characteristic of PAHs during coal combustion in a fluidized bed combustor. Energy Source Part A 2014, 36, 212–221. [Google Scholar] [CrossRef]
- Ou, D.; Liu, M.; Cheng, S.; Hou, L.; Xu, S.; Wang, L. Identification of the sources of polycyclic aromatic hydrocarbons based on molecular and isotopic characterization from the Yangtze estuarine and nearby coastal areas. J. Geogr. Sci. 2010, 20, 283–294. [Google Scholar] [CrossRef]
- Cao, Q.; Wang, H.; Chen, G. Source apportionment of PAHs using two mathematical models for mangrove sediments in Shantou coastal zone, China. Estuar. Coast. 2011, 34, 950–960. [Google Scholar] [CrossRef]
- Nguyen, T.C.; Loganathan, P.; Nguyen, T.V.; Vigneswaran, S.; Kandasamy, J.; Slee, D.; Stevenson, G.; Naidu, R. Polycyclic aromatic hydrocarbons in road deposited sediments, water sediments, and soils in Sydney, Australia: Comparisons of concentration distribution, sources and potential toxicity. Ecotox. Environ. Safe 2014, 104, 339–348. [Google Scholar] [CrossRef] [PubMed]
- Khalili, N.R.; Scheff, P.A.; Holsen, T.M. PAH source fingerprints for coke ovens, diesel and, gasoline engines, highway tunnels, and wood combustion emissions. Atmos. Environ. 1995, 29, 533–542. [Google Scholar] [CrossRef]
- Yang, B.; Zhou, L.; Xue, N.; Li, F.; Li, Y.; Vogt, D.R.; Cong, X.; Yan, Y.; Liu, B. Source apportionment of polycyclic aromatic hydrocarbons in soils of Huanghuai Plain, China: Comparison of three receptor models. Sci. Total Environ. 2013, 443, 31–39. [Google Scholar] [CrossRef]
- Wang, J.Z.; Cao, J.J.; Dong, Z.B.; Guinot, B.J.M.; Gao, M.L.; Huang, R.J.; Han, Y.; Huang, Y.; Ho, H.S.S.; Shen, Z. Seasonal variation, spatial distribution and source apportionment for polycyclic aromatic hydrocarbons (PAHs) at nineteen communities in Xi’an, China: The effects of suburban scattered emissions in winter. Environ. Pollut. 2017, 231, 1330–1343. [Google Scholar] [CrossRef]
- Zhao, Z.Y.; Chu, Y.L.; Gu, J.D. Distribution and sources of polycyclic aromatic hydrocarbons in sediments of the Mai po inner deep bay ramsar site in Hong Kong. Ecotoxicology 2012, 24, 1743–1752. [Google Scholar] [CrossRef]
Disclaimer/Publisher’s Note: The statements, opinions and data contained in all publications are solely those of the individual author(s) and contributor(s) and not of MDPI and/or the editor(s). MDPI and/or the editor(s) disclaim responsibility for any injury to people or property resulting from any ideas, methods, instructions or products referred to in the content. |
© 2023 by the authors. Licensee MDPI, Basel, Switzerland. This article is an open access article distributed under the terms and conditions of the Creative Commons Attribution (CC BY) license (https://creativecommons.org/licenses/by/4.0/).