Article

Depressive Symptoms and Associated Factors among Employees in Public Utility Places of Zhejiang Province, China

Department of Environmental Health, Zhejiang Provincial Center for Disease Control and Prevention, 3399 Binsheng Road, Hangzhou 310051, China
*
Author to whom correspondence should be addressed.
Sustainability 2023, 15(18), 13573; https://doi.org/10.3390/su151813573
Submission received: 1 August 2023 / Revised: 5 September 2023 / Accepted: 9 September 2023 / Published: 11 September 2023
(This article belongs to the Special Issue Sustainability in Work Environments: Occupational Health and Safety)

Abstract

:
Depression has been known to adversely influence the working performance of employees. However, compared with physical health, few studies have reported the prevalence of depressive symptoms among employees in workplaces. This study aimed to investigate the current situation and the relationships among the prevalence of depressive symptoms, physical health, social–psychological factors, working conditions, environmental perception, and workplace performance of employees in public utility places in Zhejiang Province, China. A cross-sectional study was conducted during the fourth quarter of 2019. A total of 1232 individuals responded to the survey. Six types of information—sociodemographic characteristics, working conditions, psychosocial factors, four groups of physical symptoms, working performance, and depressive symptoms—were collected. Logistic regression analysis was performed. The survey results showed that the prevalence of depressive symptoms among employees in public utility places in Zhejiang Province was 17.9%. Perceptions of a poor work environment, poor interpersonal relationships, an unfulfilling life, and frequent ocular and general uncomfortable symptoms were associated with a higher risk of depressive symptoms. Strong work ability, fulfilment in life, and taking the initiative to wear or use protective equipment at work were associated with a lower risk of depressive symptoms. The results of this study will provide valuable guidance for the scientific intervention for depressive symptoms among public utility place employees in the future.

1. Introduction

Public utility places are artificial environments comprising public buildings and facilities that provide work, study, entertainment, and social activities for the public. Generally, “public” means sponsored by the government. Here, it means a place with characteristics of a dense population, large personal mobility, and higher contact opportunities [1]. The public utility places in this study belong to the scope that was referred to in the Chinese national health standard [2]. Due to the characteristics of “public” places, public utility places provide a favourable environment for the transmission of infectious diseases, such as COVID-19 [1].
In the past, most of the reports about public utility places focused on monitoring the physical, chemical, and biological indicators of the indoor environment, and the object of health protection was more focused on consumers [3]. However, compared to consumers, employees spend a longer time in public utility places. Moreover, as the creator and sustainer of environmental sanitation, the health of employees in public utility places and the hygiene of the indoor environment are related [4,5]. So, it is also very necessary to pay attention to the health of employees in public utility. Previous reports on the topic of health effects caused by the indoor environment are limited. Some are only concerned about the impact of physical health, while others focus only on emotional disorders or work performance [6,7,8]. Less research has been conducted on all three factors on employees simultaneously in China compared to in developed countries [9]. Psychological health problems may seem silent, but they can gradually damage physical health, eventually leading to a significant decrease in productivity [10]. According to the WHO, depression is the most common type of mental disorder, affecting an estimated 350 million people. Approximately 1 in every 20 individuals worldwide are affected by depression. Globally, depression is ranked as the fourth largest social burden of all diseases in terms of disability-adjusted life years [11,12]. China’s situation is also urgent. Depression has risen to become the second largest disease burden on the mainland since 1990 [13]. It poses a substantial economic burden at individual and societal levels [14], since depression is most common between the ages of 25 and 44, which is the prime working age range [15]. Furthermore, the study scopes of existing reports are also limited, focusing primarily on hospitals and doctors [16], schools and teachers [17], and offices and administrative personnel [18]. Based on the above situation, it is of significant societal relevance to expand the research on the multifaceted effects of different indoor environments on the physical health, depression, and work performance of employees.
According to the concept of disorder diagnosis, depression is a mood disorder characterized by a loss of interest; sleep disturbance; weight change; fatigue; decreased energy; slowness of movement; guilt or feeling that life is meaningless; reduced ability to think, concentrate, and make decisions; and suicidal tendencies [19]. Early detection and treatment are important for recovery from depressive disorders. The later the treatment, the more difficult it is to treat, the higher the possibility of relapse, the greater the damage to social functions, and the more difficult it is to recover. Therefore, the timely recognition of depressive symptoms is essential. In this study, the patient health questionnaire (PHQ-9) scale was used to screen and evaluate depressive symptoms. PHQ 9 is not a diagnostic scale because diagnosing depression is a very complex, comprehensive assessment process that requires a professional psychiatrist. Owing to its good reliability and validity, the PHQ-9 has been widely used in the screening and evaluation of depressive symptoms, and the Chinese version has been verified in China [20,21,22,23,24,25].
In a word, this study aimed to investigate the current situation and the relationships among the prevalence of depressive symptoms, physical health, social–psychological factors, working conditions, environmental perception, and workplace performance of employees in public utility places in Zhejiang Province (Figure 1 and Figure 2). This is a new exploration of the comprehensive mutual influence between the indoor environment and employees of public utility places in Zhejiang Province. It will provide a scientific reference for appropriate interventions for and the feasible prevention of depressive symptoms in employees in public utility places in the future.

2. Materials and Methods

2.1. Data Collection

This cross-sectional study was conducted in the fourth quarter of 2019 in Zhejiang Province, China. A total of 1232 individuals from four cities (Huzhou, Jiaxing, Shaoxing, and Wenzhou) who worked in public utility places responded to the survey. All participants from 232 public utility places provided consent to participate by completing the questionnaire. Public utility places include hotels, indoor swimming pools, indoor public baths, barbershops, beauty salons, and waiting rooms at railway stations. The four cities represent different regions of Zhejiang Province, which is located in eastern China and has a relatively balanced regional economy. A two-stage sampling technique was used to recruit respondents. In the first stage, at least 18 hotels (derived from three different grades according to the star level), 6 indoor swimming pools, 8 indoor public baths, 8 barbershops, 8 beauty salons, and 2 waiting rooms at railway stations were selected using a simple random sampling technique. In the second stage, ten individuals with more than one year of service were selected from every public utility place, or all were recruited for the survey when there were less than ten in the working environment. The sample size was calculated using the software PASS 11, with the parameters as follows: 20% prevalence of depression [26], confidence level (1-alpha) of 0.95, and confidence interval width (two-sided) of 0.05.

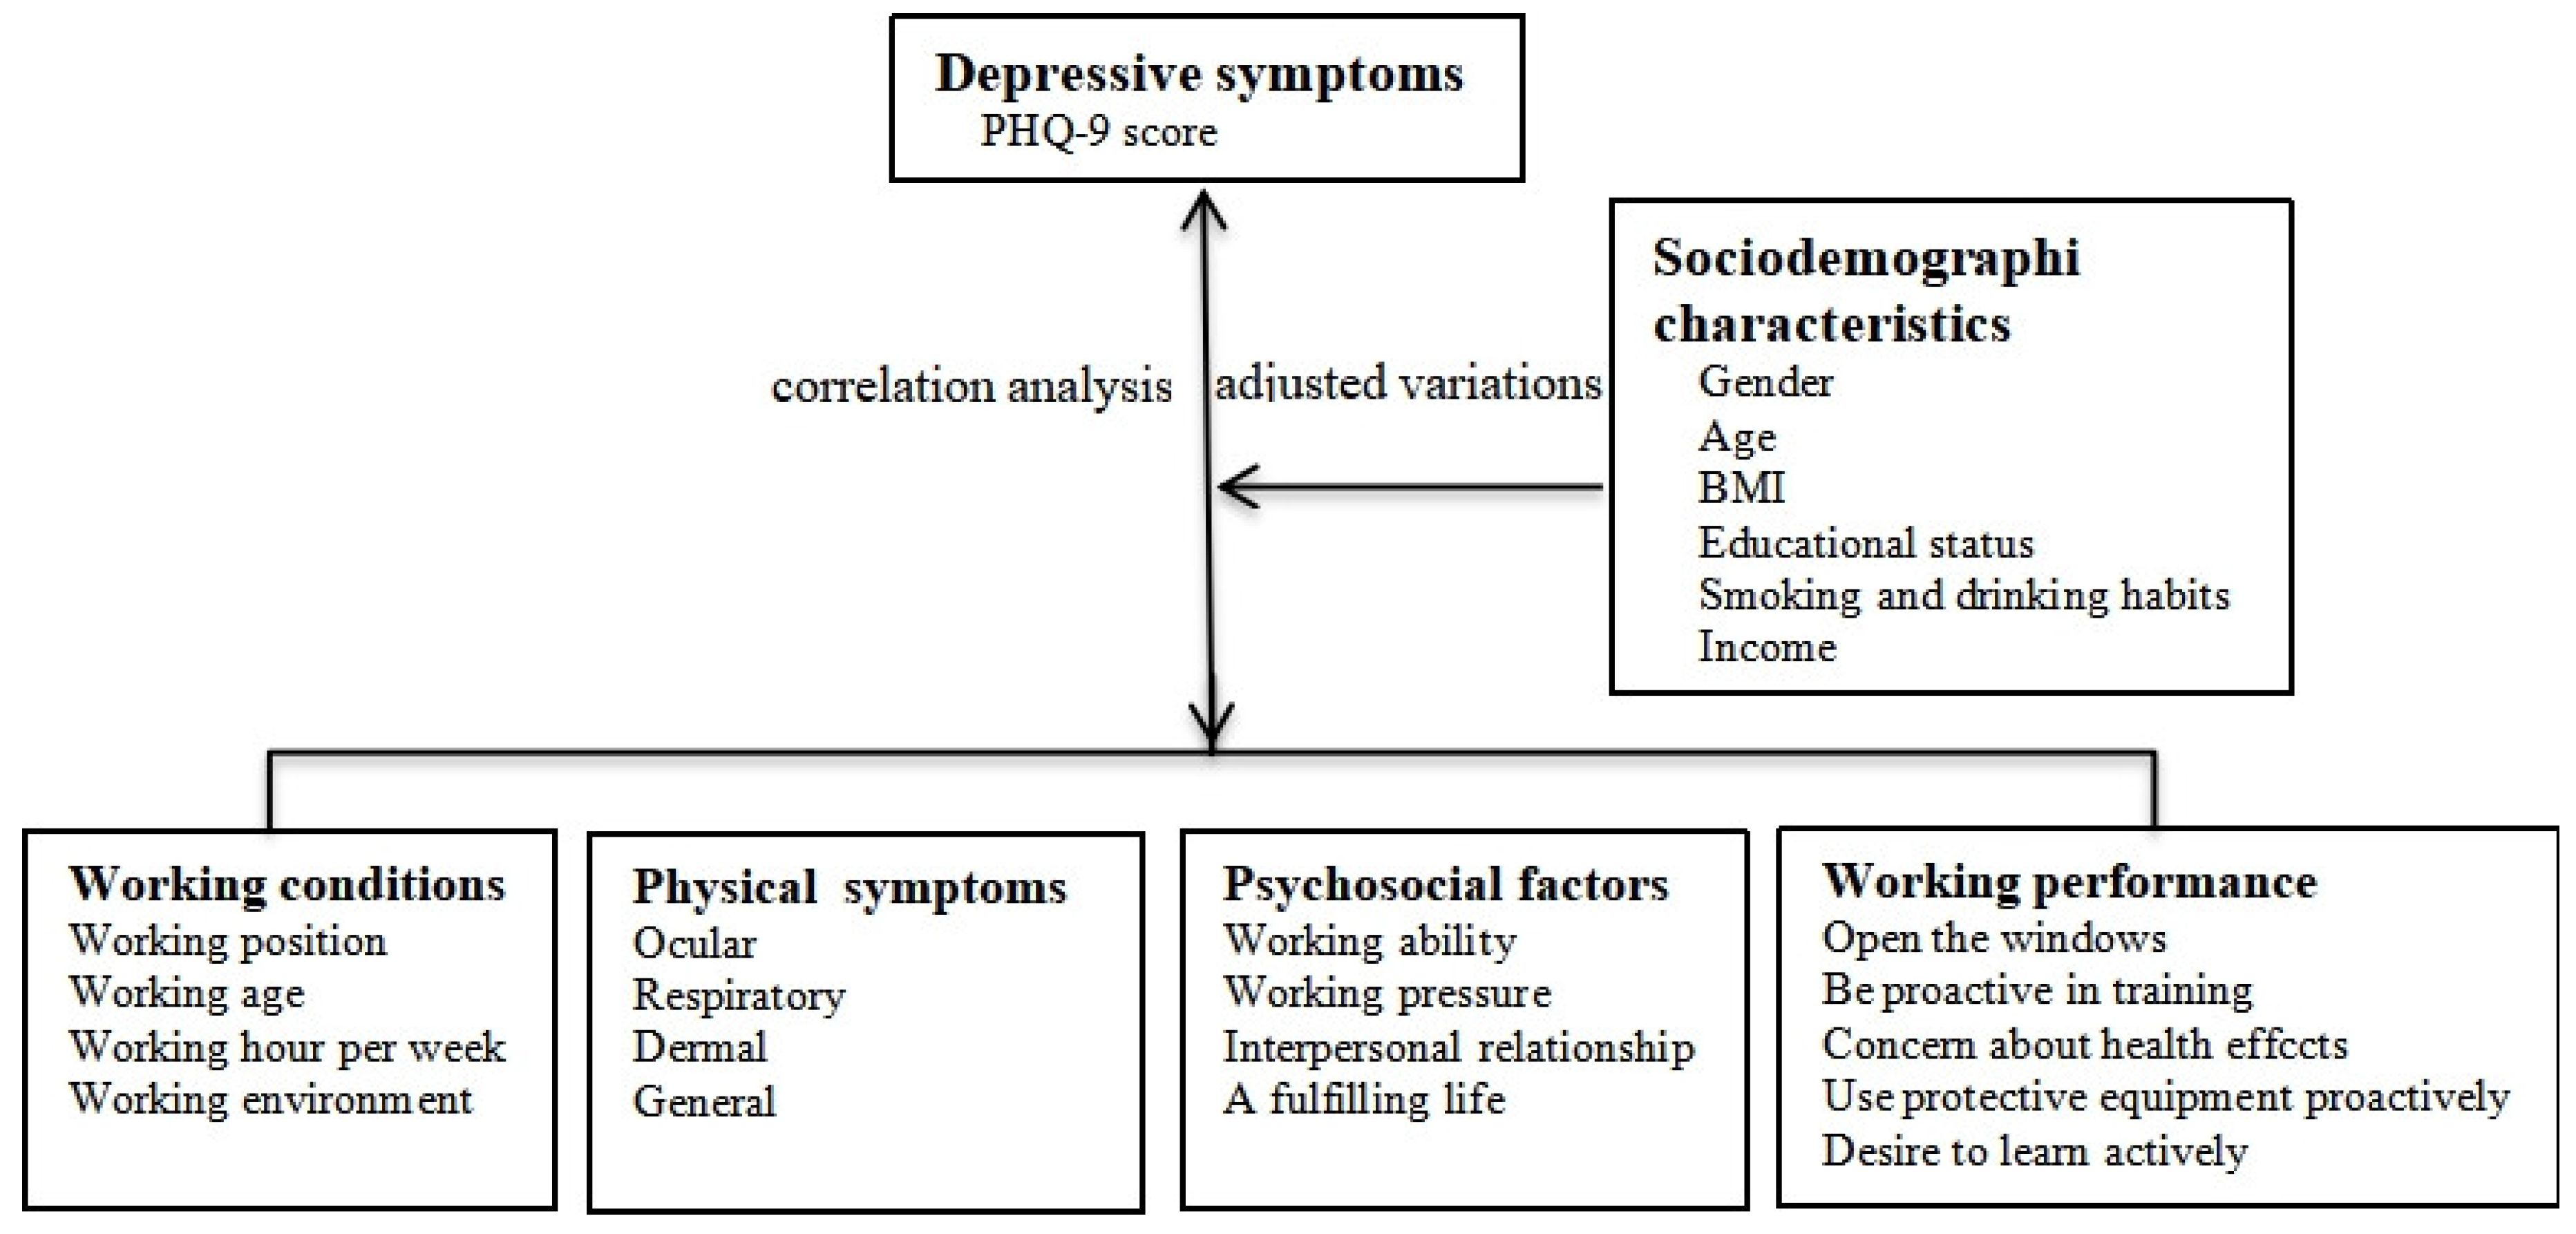
2.2. Self-Assessment Questionnaires

The self-administered questionnaire consisted of six parts: personal characteristics, working conditions, psychosocial factors, four symptom groups, performance, and the PHQ-9 scale.
Questions on personal characteristics and working conditions included age, sex, height, weight, education, income, smoking and drinking status, the job position, working years, working hours per week, and perceived environmental conditions. In this study, height and weight were self-reported rather than measured in the field. Body mass index (BMI) was calculated by using the weight in kilograms divided by squared body length in meters.
Questions on perceived environmental conditions included 13 items: noise, dryness, humidity, temperature perturbation, pungent smell, musty smell, smelly tap water, unclean sanitation facilities, four pests, dusty air, lack of sunlight, disinfectant odour, and poor ventilation. There were 5 options for each answer: (1) always, (2) often, (3) sometimes, (4) occasionally, and (5) never. When analysing, responses were adjusted into dichotomous variables. A response of “often” or “always” was categorized into the “poor” group, and others were categorized into the opposite group. As long as one of the 13 item responses was “always” or “often”, the perceived environmental conditions were qualitatively interpreted as poor.
Questions regarding psychosocial factors included working ability, workload, relationships, and life situations. They were assessed with the following questions: “How do you feel about the workload/work ability/relationships in the last month?” and “Do you have a fulfilling life in the last month?”. The responses of workload were divided into the following categories: very heavy, heavy, average, easy, and very easy. Other items were also divided into five categories: very poor, poor, average, good, and very good. When analysing the results, these five items were adjusted into dichotomous variables according to the following principles: responses of the first three levels were coded and grouped together, and responses of the last two levels were combined.
Four groups of symptoms were surveyed using sick building syndrome (SBS) data obtained from a variety of literature sources: ocular (pinkeye, itching, burning, lacrimation, dry eye, and eyestrain), respiratory (itchy nose, sneeze, runny nose, stuffy, expectorate, dry throat, aphonia, and cough), dermal (dryness, itching, flushed skin, chapped skin, and skin prick) and general (diarrhoea, fever, sore muscle, lumbago and back pain, arthrodynia, dysacusis, tinnitus, stomatitis, fatigue, headache, nausea, drowsiness, and memory lapses). For every symptom, there were five categories of responses, namely, “always”, “often”, “sometimes”, “occasional”, and “never”. The participants who reported experiencing at least one symptom in every group “always” or “often” during the last month were assigned to the category of positive symptom in ocular, respiratory, dermal, or general symptoms.
In terms of performance, we designed five questions for information collection based on the characteristics of the workplace. ① Do you actively open windows for ventilation when working? ② Are you proactive in health knowledge training? ③ Are you concerned about the possible health effects at your location? ④ Do you take the initiative to wear or use protective equipment at work? ⑤ Would you like to learn more about health at your workplace? There were five options for each answer: (1) always, (2) often, (3) sometimes, (4) occasionally, and (5) never. Respondents who chose “often” or “always” were included in the good behaviour category.
Depressive symptoms were assessed using the PHQ-9. The PHQ-9 consists of nine questions related to the key symptoms of depression; each item is scored from 0 to 3, giving a total score of 27 [27], and the Level 4 score is based on the frequency of symptoms within the last two weeks. A score of 0 indicates no symptoms, 1 indicates symptoms occurring for a few days, 2 indicates symptoms occurring for more than seven days, and 3 indicates symptoms almost every day. Items 1, 4, and 9 are the core items in the scale, and any score > 1 (i.e., selections 2 and 3) requires attention. The symptoms in items 1 and 4 represent the core symptoms of depression. Item 9 represents the intention to self-injure. For most analyses, the PHQ-9 score was divided into the following categories of increasing severity: 0–4, 5–9, 10–14, 15–19, and 20 or greater. They suggested the possibility of mild, moderate, moderately severe, or severe depression, respectively. The PHQ-9 has been reported to be a valid measure of depressive symptoms, with scores below 5 almost always signifying the absence of depressive disorder. Following previous papers [9,27,28,29,30], the cut-off point for the objective variable, namely the PHQ-9 score, was 5 points in this study. Cronbach’s alpha was 0.963, and the factor loadings ranged between 0.675 and 0.821. The cumulative variance contribution rate (CVCR) was 0.595, and the correlation coefficients between each item and the total score ranged from 0.377 to 0.848 (p < 0.01), indicating that the scale had good reliability and validity.

2.3. Statistical Analysis

IBM SPSS version 25.0 (IBM Corporation, New York, NY, USA) was used for the analysis. Data with missing values for any variables were excluded from the analysis. Valid data were described and analysed by using frequencies and percentages. We transformed the variables into the classification grades according to the principles described in the Methods section and then performed binary logistic regression analysis on the classification variables [6,9]. In the regression analysis, the dependent variable was depressive symptoms, and others, including sociodemographic characteristics, working conditions, psychosocial factors, symptoms of different systems (ocular, respiratory, dermal, and general), and performance, were the independent variables. Potential risk factors (p < 0.05) from the univariate analyses were included in the multivariate stepwise logistic regression analysis (forward LR), and the p-values for the entry and removal of variables in the stepwise logistic regression model were 0.05 and 0.1, respectively. Two models of multivariate logistic regression were run, depending on whether demographic variables were adjusted or not. The odds ratios and 95% confidence intervals (CIs) were also calculated. Any effect at p < 0.05 was considered significant.

2.4. Ethics

Ethical approval was obtained from the Ethical Review Committee of the National Institute of Environmental Health, Chinese Center for Disease Control and Prevention (approval no. 201821). Written informed consent was obtained from all participants during the study period. Participants were allowed to withdraw from the study at any time. Scores of 5 points or more in the survey were followed by timely feedback face-to-face or via telephone.

3. Results

3.1. Sociodemographic Characteristics of Participants

A total of 1232 questionnaires were collected, and 1184 valid questionnaires were completed after removing invalid questionnaires. The response rate was 96.1%. The participants’ characteristics are shown in Table 1, and their key features are described below.
Among the 1184 participants, 65.8% were female, and the rest were male. More than half of the participants (65.3%) were younger than 40 years of age. Regarding BMI, 12.1% had a score less than 18.5, and 18.9% had a score of 24 or above. Only a few (18.6%) had completed college or university education. Most participants had no history of smoking (86.7%) or alcohol consumption (80.0%). The income level of the participants was as follows: <50,000 CNY/year, 22.80%; 50,000–99,999 CNY/year, 41.1%; and ≥100,000 CNY/year, 36.2%. Of these, only 24.7% held managerial positions. As for the period of working age, most of them had worked for less than 5 years, accounting for 69.3%, and most of them (84.1%) worked more than 40 h weekly.

3.2. Distribution of Depressive Symptoms in the Participants

The PHQ-9 scale was used to assess depressive symptoms in the participants, and the scores are shown in Table 2. Among them, 972 people with scores of 0–4 (no depression) accounted for 82.1%, 162 people with scores of 5–9 (mild depression) accounted for 13.7%, 31 people with scores of 10–14 (moderate depression) accounted for 2.6%, 13 people with scores of 15–19 (moderate to severe depression) accounted for 1.1%, and six people with scores of 20–27 (severe depression) accounted for 0.5%. Taking five as the cut-off point, the total number of people with scores of more than five was 212, accounting for 17.9%.
The scores of each item on the PHQ-9 scale > 1 (i.e., selections 2 and 3) were sorted, and the results show that item 4 appeared most frequently: feeling tired or having little energy (49 people in total, accounting for 4.1%). Item 3 ranked second (trouble falling asleep, staying asleep, or sleeping too much; 48 people, accounting for 4.1%). Items 1 and 7 were tied for third place: little interest or pleasure in doing things and trouble concentrating on things, such as reading the newspaper or watching television, accounting for 3.3% of the 39 participants. Item 9 was at the bottom of the list: thoughts that you would be better off dead or hurting yourself in some way, with 10 participants accounting for 0.84 percent. The core symptoms of items 1, 4, and 9 were endorsed in 69 cases, accounting for 5.8% of the cases.

3.3. Distribution of Various Self-Reported Factors in the Depressive and Non-Depressive Symptom Groups

All distributions of various self-reported factors in the participants are shown in Table 3. The working environment evaluation items consisted of 13 aspects independently reported by the survey respondents. A bad working environment was identified when any of these disadvantages were “always” or “often” present. A total of 368 respondents (31.1%) reported that their working environment was poor. The frequencies of various adverse environmental factors reported to be always or often present are listed in Table A1. The three most adverse environmental factors were noise (72, 6.1%), lack of sunlight (68, 5.7%), and humidity (58, 4.9%).
Regarding physical symptoms, the detection rates of ocular, respiratory, dermal, and general symptoms were 5.9%, 3.5%, 3.0%, and 16.6%, respectively (Table 3). Among the four categories of symptoms, the detection rate of general symptoms was the highest (16.6%), and the top three specific symptoms were low back pain, fatigue, and lethargy (in Table A2).

3.4. Correlation between Depressive Symptoms and Various Factors

A correlation analysis was conducted between the depressive symptoms and various factors, including the sociodemographic characteristics, psychosocial factors, physical symptoms, working conditions, and working performance of the respondents. The results of the univariate analysis are shown in Table 4. The results of the multivariate analysis are presented in Table 5 (Model 1 was unadjusted for personal characteristics, while Model 2 was adjusted for sociodemographic characteristics).
Univariate analysis results (Table 4) showed that age ≥ 40 years, an annual income of more than CNY 100,000, strong working ability, low working pressure, good interpersonal relationships, a fulfilling life, often opening the windows actively for ventilation when working, being often proactive in health knowledge training, being concerned often about the possible health effects from the place of work, taking the initiative often to wear or use protective equipment at work, and desiring to learn more about health related to the workplace were associated with a lower risk of depressive symptoms, i.e., having a PHQ-9 score higher than 5 (OR < 1, p < 0.05). In contrast, a BMI < 18.5, being a university graduate and above, drinking, a poor working environment, poor interpersonal relations, an unfulfilling life, and the presence of discomfort always or often in various systems (ocular, respiratory, dermal, or general symptoms) were associated with a higher risk of depressive symptoms (OR > 1, p > 0.05).
The results of the multivariate analysis (Table 5) showed that, in terms of working conditions, a bad working environment was associated with a higher risk of depressive symptoms (OR = 1.7, 95%CI: 1.1–2.5). With regard to psychosocial factors, poor interpersonal relationships (OR = 14.4, 95%CI: 1.4–150.9) and an unfulfilling life (OR = 9.6, 95%CI: 1.3–71.2) were associated with a risk of depressive symptoms (OR > 1, p < 0.05). In terms of physiological symptoms, ocular (OR = 4.0, 95%CI: 2.0–8.0) and general (OR= 4.8, 95%CI: 3.1–7.3) symptoms with frequent or constant discomfort were associated with a higher risk of depressive symptoms (OR > 1, p < 0.05). Conversely, strong working ability (OR = 0.4, 95%CI: 0.3–0.8), a fulfilling life (OR = 0.5, 95%CI: 0.3–0.9), and taking the initiative to wear or use protective equipment at work (OR = 0.7, 95%CI: 0.5–1.0) were associated with a reduced risk of depressive symptoms (OR < 1, p < 0.05). The results were similar before (Model 1) and after (Model 2) adjusting for sociodemographic characteristics.

4. Discussion

4.1. Distribution of Sociodemographic Characteristics of Employees in Public Utility Places

In this study, most participants were female (65.3%) with a working experience of less than five years. This is consistent with the situation reported in recent years, where the proportion of female employees in public utility places is relatively high and personnel mobility is large [31]. With the rapid development of society, the age structure and educational level of employees working in public utility places have also changed. They are becoming younger and more educated [32]. These all suggest that the pertinence and effectiveness of health interventions in the future will face new requirements and challenges, since they must match the changes in population characteristics. So, it is a continuous process to strengthen the monitoring of and interventions for physical and mental health for the rapidly changing characteristics of public employees.
Most respondents in this research were engaged in frontline work and were primarily service employees (75.3%). Many frontline posts in public utility places do not require very high professional skills. They need more work time rather than complicated skills. So, it is not difficult to understand the relatively higher percentage (84.1%) of employees who worked more than 40 h. Long work does not mean a higher income; more than half of the people (63.9%) earned less than 100,000 CNY/year, and the percentage of employee turnover within 5 years was as high as 69.3. In summary, working in a public utility place may have a screening function for employees. Longer working hours and lower income contributed to depression more in the vulnerable population included under the screening of job requirements. No sex differences in depressive symptoms were observed in this study, which may also have been due to occupational screening.
The association between age, income, education, and depressive symptoms in the results may be due to the following factors: with the increase in age, the economic situation and supportive social resources may become better and better. So, the risk of depressive symptoms decreases. Generally speaking, people with higher education levels have higher career expectations. The realization of self-worth in the service industry may have a greater conflict between ideal and reality, which increases the risk of depressive symptoms. However, a high education level sometimes has a protective effect on depressive symptoms, especially when the job has high competency requirements [33]. So, the interference caused by the screening function of job requirements should be taken into account in the analysis of the results. Different from the psychological mechanisms conjectured by the above three factors, the increased risk of depressive symptoms induced by low BMI and alcohol consumption may be due to the impairment of physiological (immune) function. However, the opposite hypothesis is also probable, and low BMI and alcohol consumption may be a by-product of depressive symptoms [34,35]. This study cannot establish causality.

4.2. Current Status of Depressive Symptoms and the Observed Factors in Public Utility Place Employees

The survey results showed that the prevalence of depressive symptoms among employees in Zhejiang Province’s public utility places was 17.9%, which was similar to the results among the Chinese labour force in 2016 (17.3%) and in-service employees in 2018 (19.3%) studied by Guoying Zhang [26]. Although the prevalence of depressive symptoms among employees of public utility places is lower compared with the elderly and the high-stress occupational groups (44.1–55.2%) [36,37], nearly 20% is still a shocking proportion because these people are the main labour force in society and the spiritual and economic support of a family, and they should be very healthy.
As for physical health, the detection rate of specific physical symptoms was relatively low for the ocular (5.9%), respiratory (3.5%), and dermal systems (3.0%) but not for general symptoms (16.6%). The top three general symptoms were low back pain, fatigue, and lethargy, which is not only consistent with the research reports of other scholars [6,38,39] but also somewhat coincident with the top three symptoms of depression obtained from this survey: Q4, feeling tired or having little energy; Q3, trouble falling asleep, staying asleep, or sleeping too much; and Q1, little interest or pleasure in doing things. Fatigue and lethargy are two original symptoms of the DSM-V diagnostic criteria for depression, but pain attracts our attention. Lumbago and back pain were common symptoms that many people have experienced, but they were easily neglected. However, with the expansion of studies on the relationship between pain and depression, pain, especially persistent chronic pain, has received increasing attention [40,41]. Although it was difficult to conclude that the general symptoms in the survey were not the manifestations of depressive symptoms, this study still suggests that persistent discomfort without an obvious trigger, such as fatigue, lethargy, and pain, is likely an early sign of depression. The self-perception of the working environment reports showed that nearly one-third of the respondents rated their work environment as poor, with at least one reporting confusing environmental distraction to be always or often present. Except an evaluation of the relationship between the overall environmental perception and depressive symptoms, we did not analyse the relationship between the subitems in this study. However, the sorting of uncomfortable environmental factors still showed some interesting information. Noise, lack of sunlight, and environmental humidity were the top three adverse environmental factors, similar to the situation reported by other scholars [6,8,16]. Noise is defined as an undesirable sound. Both the absolute level of sound and personal perception of noise can have various health consequences [42,43]. They not only induce hearing impairment but are also related to non-auditory effects, including mental health, particularly depressive symptoms. As reported, transportation noise level and noise annoyance may jointly and independently influence the risk of depression [44]. According to this result, noise in public utility places may also be inextricably related to depression, probably acting via annoyance, which needs to be further explored in the future. In addition, our results also add to the evidence that a lack of light and humidity are associated with depressive symptoms. This conclusion has been confirmed by some reports [45,46]. Overall, the traditional adverse working environment factors, such as noise, lack of sunlight, and humidity, are still widespread and damaging to human health. It is just that we now need to gradually shift our focus from their physical effects to their mental effects.

4.3. Thinking of Interventions for Depressive Symptoms of Employees in Public Utility Places

An analysis of the association between the study factors and depressive symptoms showed that the perception of a bad work environment, poor interpersonal relationships, an unfulfilling life, and frequent physical symptoms were associated with a higher risk of depressive symptoms. Strong work ability, fulfilment in life, and active work performance were associated with a lower risk of depressive symptoms. These results are consistent with the findings of other reports [30,33]. They can offer great guidance for carrying out depressive symptom interventions in public utility places. Firstly, we need to improve the working environment, such as reducing noise, keeping the air dry, and so on. Secondly, we should also create an inclusive working atmosphere to enhance employee self-efficacy and social support by establishing employee fellowship and offering EAP services. These may be effective intervention measures to reduce the prevalence of depressive symptoms among employees working in public utility places. However, because this was a cross-sectional study, the causal relationship between any factors cannot be deduced. For example, it was difficult to identify whether the physical discomfort and positive health behaviours of the participants in this study were the cause or result of depressive symptoms, but all factors could certainly influence each other. That means the better the physical and mental health of employees in the workplace, the better the completion and performance of work, and the better the service experience and health security in public utility places. A World Health Organization (WHO) report shows that for every USD 1 invested by employers in treating depression and anxiety, USD 4 are returned, suggesting that early identification of and interventions for depressive symptoms can be cost-effective measures [47]. Although mental health promotion and prevention programs have increased globally, only 7% of such initiatives are workplace-based [48]. Our findings provide vital guidance for the monitoring of and interventions for depressive symptoms in public utility places.

4.4. The Limitations of This Study

We have to acknowledge some limitations in this study. The first is that the inclusion criteria of the respondents were not rigorous enough to exclude people who had experienced major life events such as bereavement in the past half a year, which have a serious impact on depressive symptoms. Even though we mainly focused on exploring the correlation between occupational place factors and depressive symptoms, the design of the variables was still not sufficiently comprehensive, and only parts of work-related sociopsychological factors were included. It has been reported that, compared with social and psychological factors, the effect of physical and chemical factors on depression is relatively small; however, they still need to be supplemented in future research. Secondly, because the study used a cross-sectional design, conclusions about statistical associations may not be causal, and reverse causation cannot be ruled out. It was unclear whether passive environmental factors led to depressive symptoms or whether employees with depressive symptoms were more sensitive to perceived passive environmental factors than healthy workers. Thirdly, Zhejiang Province is a province in China with a small gap between the rich and poor; therefore, the participants in this study were only recruited from four cities from the south to the north. However, not all types of public utility places were included. The generalizability of the results may be limited by the representativeness of the participants. In the future, we can consider expanding the area and population range of the respondents for further research. Finally, as both exposures and outcomes were based on self-reports, there may have been reporting bias that led to inflated associations because of common method variance. Strict inclusion and exclusion criteria, cohort studies, increasing objective and comprehensive indicators, including standardized clinical interviews or feedback from others, and using more innovative statistic methods for data analysis and mining are expected to improve the limitations of this study. They could be utilized in future studies.

5. Conclusions

Based on the results of this study, the prevalence of depressive symptoms among employees in public utility places in Zhejiang Province was 17.9%. Perceptions of a poor work environment, poor interpersonal relationships, an unfulfilling life, and frequent ocular and general uncomfortable symptoms were associated with a higher risk of depressive symptoms. Strong work ability, fulfilment in life, and taking the initiative to wear or use protective equipment at work were associated with a lower risk of depressive symptoms. The results of this study provide some related markers for the scientific surveillance of and interventions for depressive symptoms in employees of public utility places in Zhejiang Province. It suggested that we should create a friendly working environment and amicable interpersonal relationships to protect employees from depressive symptoms and improve working performance. Given the limitations of this study, there are uncertainties in the extrapolation of the conclusions. Cohort studies may be a better approach.

Author Contributions

Conceptualization, M.X.; methodology, L.W. and X.L.; formal analysis, X.W., Z.C. and P.T.; investigation, M.X., L.W., X.L. and P.T.; data curation, M.X., L.W. and X.L.; writing—original draft preparation, L.W., X.L. and M.X.; writing—review and editing, L.W., P.T. and M.X.; supervision, X.W., Z.C. and M.X.; project administration, X.W. and Z.C. All authors have read and agreed to the published version of the manuscript.

Funding

This research was funded by the Zhejiang Provincial Project for Medical Research and Health Sciences (grant numbers 2021PY042 and 2020KY515).

Institutional Review Board Statement

The study was conducted in accordance with the Declaration of Helsinki and approved by the Ethical Review Committee of the National Institute of Environmental Health, Chinese Center for Disease Control and Prevention (approval no. 201821).

Informed Consent Statement

Written informed consent was obtained from all participants during the study period. Participants were allowed to withdraw from the study at any time.

Data Availability Statement

The datasets supporting the conclusions of this article are available from the corresponding author upon reasonable request.

Acknowledgments

The authors would like to thank the CDC staff from Huzhou, Jiaxing, Shaoxing, and Wenzhou who conducted the field investigations at the county level. The authors also thank all the participants of this study.

Conflicts of Interest

The authors declare no conflict of interest.

Appendix A

Table A1. Distribution of frequency occurrence of each item in PHQ-9 scale in the participants.
CharacteristicsN (%)
Q4 Feeling tired or having little energy49 (4.1)
Q3 Trouble falling asleep, staying asleep, or sleeping too much48 (4.1)
Q1 Little interest or pleasure in doing things39 (3.39)
Q7 Trouble concentrating on things, such as reading the newspaper or watching television39 (3.3)
Q6 Feeling bad about yourself or that you are a failure, or have let yourself or your family down37 (3.1)
Q5 Poor appetite or overeating32 (2.7)
Q2 Feeling down, depressed, or hopeless25 (2.1)
Q8 Moving or speaking so slowly that other people could have noticed. Or, the opposite, being so fidgety or restless that you have been moving around a lot more than usual20 (1.7)
Q9 Thoughts that you would be better off dead or hurting yourself in some way10 (0.8)
Any one of Q1 or Q4 or Q969 (5.8)
Table A2. Frequency of reports of various environmental adverse factors that were always or often present.
CharacteristicsN (%)
E1 Noise72 (6.1)
E11 Lack of sunlight68 (5.7)
E3 Humidity58 (4.9)
E2 Dryness54 (4.6)
E12 Disinfectant odour49 (4.1)
E13 Poor ventilation49 (4.1)
E5 Pungent smell31 (2.6)
E4 Temperature perturbation29 (2.5)
E10 Dusty air27 (2.3)
E9 The four pests26 (2.2)
E6 Musty smell16 (1.4)
E7 Smelly tap water16 (1.4)
E8 Unclean sanitation facilities12 (1.0)

References

  1. Pan, L.; Wang, J.; Wang, X.; Ji, J.S.; Ye, D.; Shen, J.; Li, L.; Liu, H.; Zhang, L.; Shi, X.; et al. Prevention and control of coronavirus disease 2019 (COVID-19) in public places. Environ. Pollut. 2021, 292, 118273. [Google Scholar] [CrossRef] [PubMed]
  2. GB37487-2019; Hygienic Management Specification for Public Places. National Health Standards: Beijing, China, 2019.
  3. Śmiełowska, M.; Marć, M.; Zabiegała, B. Indoor air quality in public utility environments—A review. Environ. Sci. Pollut. Res. 2017, 24, 11166–11176. [Google Scholar] [CrossRef] [PubMed]
  4. Ragab, M.H.; Alatik, A.M.; el-Sha’abini, M.M.; Othman, A.S. Relationship between indoor environmental physical factors and depression aspects. J. Egypt. Public Health Assoc. 2000, 75, 233–243. [Google Scholar] [PubMed]
  5. LaMontagne, A.D.; Martin, A.; Page, K.M.; Reavley, N.J.; Noblet, A.J.; Milner, A.J.; Keegel, T.; Smith, P.M. Workplace mental health: Developing an integrated intervention approach. BMC Psychiatry 2014, 14, 131. [Google Scholar] [CrossRef] [PubMed]
  6. Dhungana, P.; Chalise, M. Prevalence of sick building syndrome symptoms and its associated factors among bank employees in Pokhara Metropolitan, Nepal. Indoor Air 2020, 30, 244–250. [Google Scholar] [CrossRef] [PubMed]
  7. Nduka, D.O.; Ogunbayo, B.; Ajao, A.; Ogundipe, K.; Babalola, B. Survey datasets on sick building syndrome: Causes and effects on selected public buildings in Lagos, Nigeria. Data Brief 2018, 20, 1340–1346. [Google Scholar] [CrossRef] [PubMed]
  8. Azuma, K.; Ikeda, K.; Kagi, N.; Yanagi, U.; Osawa, H. Evaluating prevalence and risk factors of building-related symptoms among office workers: Seasonal characteristics of symptoms and psychosocial and physical environmental factors. Environ. Health Prev. Med. 2017, 22, 38. [Google Scholar] [CrossRef]
  9. Shiga, K.; Izumi, K.; Minato, K.; Yoshimura, M.; Kitazawa, M.; Hanashiro, S.; Cortright, K.; Kurokawa, S.; Momota, Y.; Sado, M.; et al. Association of work environment with stress and depression among Japanese workers. Work 2022, 72, 1321–1335. [Google Scholar] [CrossRef]
  10. Hsieh, C.-R.; Qin, X. Depression hurts, depression costs: The medical spending attributable to depression and depressive symptoms in China. Health Econ. 2018, 27, 525–544. [Google Scholar] [CrossRef]
  11. WHO. Global Burden of Disease in 2002: Data Sources, Methods and Results; World Health Organization: Geneva, Switzerland, 2002. [Google Scholar]
  12. WHO. Mental Disorders: Fact Sheet. 2016. Available online: http://www.who.int/mediacentre/factsheets/fs396/en/ (accessed on 5 April 2023).
  13. Murray, C.J.L.; Lopez, A. The Global Burden of Disease; Harvard University Press: Cambridge, UK, 1996. [Google Scholar]
  14. Xu, J.; Wang, J.; Wimo, A.; Qiu, C. The economic burden of mental disorders in China, 2005–2013: Implications for health policy. BMC Psychiatry 2016, 16, 137. [Google Scholar] [CrossRef]
  15. Sanderson, K.; Andrews, G. Common Mental Disorders in the Workforce: Recent Findings from Descriptive and Social Epidemiology. Can. J. Psychiatry 2006, 51, 63–75. [Google Scholar] [CrossRef] [PubMed]
  16. Akova, I.; Kiliç, E.; Sümer, H.; Keklikçi, T. Prevalence of sick building syndrome in hospital staff and its relationship with indoor environmental quality. Int. J. Environ. Health Res. 2022, 32, 1204–1219. [Google Scholar] [CrossRef] [PubMed]
  17. Lin, S.; Lipton, E.; Lu, Y.; Kielb, C. Are classroom thermal conditions, lighting, and acoustics related to teacher health symptoms? Indoor Air 2020, 30, 544–552. [Google Scholar] [CrossRef] [PubMed]
  18. Lu, C.-Y.; Tsai, M.-C.; Muo, C.-H.; Kuo, Y.-H.; Sung, F.-C.; Wu, C.-C. Personal, Psychosocial and Environmental Factors Related to Sick Building Syndrome in Official Employees of Taiwan. Int. J. Environ. Res. Public Health 2017, 15, 7. [Google Scholar] [CrossRef] [PubMed]
  19. APA. Diagnostic and Statistical Manual of Mental Disorders, 4th ed.; American Psychiatric Association: Washington, DC, USA, 1994. [Google Scholar]
  20. Sadek, N.; Bona, J. Subsyndromal symptomatic depression: A new concept. Depress. Anxiety 2000, 12, 30–39. [Google Scholar] [CrossRef] [PubMed]
  21. Zhang, J.; Wang, Y.; Xu, J.; You, H.; Li, Y.; Liang, Y.; Li, S.; Ma, L.; Lau, J.T.-F.; Hao, Y.; et al. Prevalence of mental health problems and associated factors among front-line public health workers during the COVID-19 pandemic in China: An effort–reward imbalance model-informed study. BMC Psychol. 2021, 9, 55. [Google Scholar] [CrossRef]
  22. Lai, J.; Ma, S.; Wang, Y.; Cai, Z.; Hu, J.; Wei, N.; Wu, J.; Du, H.; Chen, T.; Li, R.; et al. Factors associated with mental health outcomes among health care workers exposed to coronavirus disease 2019. JAMA Netw. Open 2020, 3, e203976. [Google Scholar] [CrossRef]
  23. Li, L.; Wan, C.; Ding, R.; Liu, Y.; Chen, J.; Wu, Z.; Liang, C.; He, Z.; Li, C. Mental distress among Liberian medical staff working at the China Ebola Treatment Unit: A cross sectional study. Health Qual. Life Outcomes 2015, 13, 156. [Google Scholar] [CrossRef]
  24. Wang, W.; Bian, Q.; Zhao, Y.; Li, X.; Wang, W.; Du, J.; Zhang, G.; Zhou, Q.; Zhao, M. Reliability and validity of the Chinese version of the Patient Health Questionnaire (PHQ-9) in the general population. Gen. Hosp. Psychiatry 2014, 36, 539–544. [Google Scholar] [CrossRef]
  25. Zhang, Y.-L.; Liang, W.; Chen, Z.-M.; Zhang, H.-M.; Zhang, J.-H.; Weng, X.-Q.; Yang, S.-C.; Zhang, L.; Shen, L.-J.; Zhang, Y.-L. Validity and reliability of Patient Health Questionnaire-9 and Patient Health Questionnaire-2 to screen for depression among college students in China. Asia Pacific Psychiatry 2013, 5, 268–275. [Google Scholar] [CrossRef]
  26. Zhang, G.; Cai, C.; Zou, W.; Jing, L.; Wu, S. Depressive symptoms and socioeconomic status among the labor force: Evidence from China’s representative sample. PLoS ONE 2022, 17, e0272199. [Google Scholar] [CrossRef] [PubMed]
  27. Spitzer, R.L.; Kroenke, K.; Williams, J.B. Validation and utility of a self-report version of PRIME-MD: The PHQ primary care study. Primary Care Evaluation of Mental Disorders. Patient Health Questionnaire. JAMA 1999, 282, 1737–1744. [Google Scholar] [CrossRef] [PubMed]
  28. Kroenke, K.; Spitzer, R.L.; Williams, J.B. The PHQ-9: Validity of a brief depression severity measure. J. Gen. Intern. Med. 2001, 16, 606–613. [Google Scholar] [CrossRef] [PubMed]
  29. Kroenke, K. PHQ-9: Global uptake of a depression scale. World Psychiatry 2021, 20, 135–136. [Google Scholar] [CrossRef] [PubMed]
  30. Harvey, S.B.; Glozier, N.; Henderson, M.; Allaway, S.; Litchfield, P.; Holland-Elliott, K.; Hotopf, M. Depression and work performance: An ecological study using web-based screening. Occup. Med. 2011, 61, 209–211. [Google Scholar] [CrossRef] [PubMed]
  31. Oenning, N.S.X.; Ziegelmann, P.K.; de Goulart, B.N.G.; Niedhammer, I. Occupational factors associated with major depressive disorder: A Brazilian population-based study. J. Affect. Disord. 2018, 240, 48–56. [Google Scholar] [CrossRef] [PubMed]
  32. Wei, Z.; Wen, Z.; Dan, L.; Juan, L.; Chu-Zhu, Y. Survey on need of health knowledge among workers in public places in Yuexiu district of Guangzhou. Guide China Med. 2010, 8, 184–186. [Google Scholar] [CrossRef]
  33. Sohn, M.; Choi, M.; Jung, M. Working conditions, psychosocial environmental factors, and depressive symptoms among wage workers in South Korea. Int. J. Occup. Environ. Health 2016, 22, 209–217. [Google Scholar] [CrossRef]
  34. Kim, K.W.; Kim, S.H.; Shin, J.H.; Choi, B.Y.; Nam, J.H.; Park, S.-C. Psychosocial, Physical, and Autonomic Correlates of Depression in Korean Adults: Results from a County-Based Depression Screening Study. Psychiatry Investig. 2014, 11, 402–411. [Google Scholar] [CrossRef]
  35. Churchill, S.A.; Farrell, L. Alcohol and depression: Evidence from the 2014 health survey for England. Drug Alcohol Depend. 2017, 180, 86–92. [Google Scholar] [CrossRef]
  36. Wang, Y.; Zhang, X.; Li, Y.; Gui, J.; Mei, Y.; Yang, X.; Liu, H.; Guo, L.-L.; Li, J.; Lei, Y.; et al. Predicting depressive symptom by cardiometabolic indicators in mid-aged and older adults in China: A population-based cross-sectional study. Front. Psychiatry 2023, 14, 1153316. [Google Scholar] [CrossRef] [PubMed]
  37. Lu, G.; Xiao, S.; He, J.; Xie, W.; Ge, W.; Meng, F.; Yang, Y.; Yu, S.; Liu, R. Prevalence of depression and its correlation with anxiety, headache and sleep disorders among medical staff in the Hainan Province of China. Front. Public Health 2023, 11, 1122626. [Google Scholar] [CrossRef] [PubMed]
  38. Harvey, S.B.; Wessely, S.; Kuh, D.; Hotopf, M. The relationship between fatigue and psychiatric disorders: Evidence for the concept of neurasthenia. J. Psychosom. Res. 2009, 66, 445–454. [Google Scholar] [CrossRef] [PubMed]
  39. Lerner, D.; Adler, D.A.; Chang, H.; Berndt, E.R.; Irish, J.T.; Lapitsky, L.; Hood, M.Y.; Reed, J.; Rogers, W.H. The Clinical and Occupational Correlates of Work Productivity Loss Among Employed Patients with Depression. J. Occup. Environ. Med. 2004, 46 (Suppl. S6), S46–S55. [Google Scholar] [CrossRef] [PubMed]
  40. Zambelli, Z.; Halstead, E.J.; Fidalgo, A.R.; Dimitriou, D. Good Sleep Quality Improves the Relationship Between Pain and Depression Among Individuals with Chronic Pain. Front. Psychol. 2021, 12, 668930. [Google Scholar] [CrossRef]
  41. Hu, Y.; Yang, Z.; Li, Y.; Xu, Y.; Tian, M.; Jiang, N.; Guo, N. Prevalence and Associated Factors of Depressive Symptoms Among Patients with Chronic Low Back Pain: A Cross-Sectional Study. Front. Psychiatry 2021, 12, 820782. [Google Scholar] [CrossRef] [PubMed]
  42. Passchier-Vermeer, W.; Passchier, W.F. Noise exposure and public health. Environ. Health Perspect. 2000, 108, 123–131. [Google Scholar] [CrossRef] [PubMed]
  43. Stansfeld, S.A.; Matheson, M.P. Noise pollution: Non-auditory effects on health. Br. Med. Bull. 2003, 68, 243–257. [Google Scholar] [CrossRef]
  44. Niemann, H.; Bonnefoy, X.; Braubach, M.; Hecht, K.; Maschke, C.; Rodrigues, C.; Robbel, N. Noise-induced annoyance and morbidity results from the pan-European LARES study. Noise Health 2006, 8, 63–79. [Google Scholar] [CrossRef]
  45. Brazienė, A.; Venclovienė, J.; Vaičiulis, V.; Lukšienė, D.; Tamošiūnas, A.; Milvidaitė, I.; Radišauskas, R.; Bobak, M. Relationship between Depressive Symptoms and Weather Conditions. Int. J. Environ. Res. Public Health 2022, 19, 5069. [Google Scholar] [CrossRef]
  46. Li, L.; Liu, H.; Fan, L.; Zhang, N.; Wang, X.; Li, X.; Han, X.; Ge, T.; Yao, X.; Pan, L.; et al. Association of indoor noise level with depression in hotel workers: A multicenter study from 111 China’s cities. Indoor Air 2022, 32, e13172. [Google Scholar] [CrossRef]
  47. Chisholm, D.; Sweeny, K.; Sheehan, P.; Rasmussen, B.; Smit, F.; Cuijpers, P.; Saxena, S. Scaling-up treatment of depression and anxiety: A global return on investment analysis. Lancet Psychiatry 2016, 3, 415–424. [Google Scholar] [CrossRef]
  48. Gray, P.; Senabe, S.; Naicker, N.; Kgalamono, S.; Yassi, A.; Spiegel, J.M. Workplace-Based Organizational Interventions Promoting Mental Health and Happiness among Healthcare Workers: A Realist Review. Int. J. Environ. Res. Public Health 2019, 16, 4396. [Google Scholar] [CrossRef]
Figure 1. Various public utility places in this study.
Sustainability 15 13573 g001
Figure 2. The exploration framework of this study.
Sustainability 15 13573 g002
Table 1. Sociodemographic characteristics of participants (N = 1184).
Variablen(%)
GenderMale405 (34.2)
Female779 (65.8)
Age (year)<40773(65.3)
≥40411(34.7)
BMI<18.5143(12.1)
18.5–23.9817 (69.0)
≥24224(18.9)
Educational statusBelow university level964(81.4)
Graduate and above 220 (18.6)
Do you smokeNo1027(86.7)
Yes157(13.3)
Do you drinkNo947(80.0)
Yes237 (20.0)
Income (×104 CNY/year)<5270 (22.8)
5–9.9486(41.1)
≥10428(36.2)
Table 2. The distribution of different depressive symptoms based on PHQ-9 scale (N = 1184).
Characteristicsn(%)
No depression (0–4)972(82.1)
Mild depression (5–9)162(13.7)
Moderate depression (10–14)31(2.6)
Moderate to severe depression (15–19)13(1.1)
Severe depression (20–27)6(0.5)
Present with depressive symptoms (PHQ 9 scores ≥ 5)212(17.9)
Table 3. Distribution of various self-reported factors in the participants with different depressive symptoms.
VariablesDepressive SymptomsNon-Depressive SymptomsTotal
n(%)n(%)n(%)
Working conditions
Working positionServer167(18.7)725(81.3)892 (75.3)
Manager45(15.4)247(84.6)292 (24.7)
Working age<5149(18.2)671(81.8)820 (69.3)
5–9.936(17.5)170(82.5)206(17.4)
≥1027(17.1)131(82.9)158 (13.3)
Working hours per week<40 h43(22.9)145(77.1)188(15.9)
≥40 h169(17.0)827(83.0)996(84.1)
Working environmentNot bad93(11.4)723(88.6)816(68.9)
Bad119(32.3)249(67.7)368(31.1)
Psychosocial factors
Working abilityWeek6(40.0)9(60.0)15(1.3)
Average91(47.9)99(52.1)190(16.1)
Strong115(11.8)864(88.3)979(82.7)
Working pressureHigh23(47.9)25(52.1)48(4.1)
Average114(33.7)224(66.3)338(28.6)
Low75(9.4)723(90.6)798(67.4)
Interpersonal relationshipPoor12(85.7)2(14.3)14(1.2)
Average86(43.0)114(57.0)200(16.9)
Good114(11.8)856(88.3)970(81.9)
A fulfilling lifeNo16(88.9)2(11.1)18(1.5)
Average83(48.8)87(51.2)170(14.4)
Yes113(11.4)883(88.7)996(84.1)
Physical symptoms
Ocular symptomsOften48(68.6)22(31.4)70(5.9)
Not164(14.7)950(85.3)1114(94.1)
Respiratory symptomsOften29(70.7)12(29.3)41(3.5)
Not183(16.0)960(84.0)1143(96.5)
Dermal symptomsOften19(54.3)16(45.7)35(3.0)
Not193(16.8)956(83.2)1149(97.0)
General symptomsOften106(53.8)91(46.2)197(16.6)
Not106(10.7)881(89.3)987(83.4)
Working performance
Open the windows actively for ventilation when workingOften168(15.8)893(84.2)1061(89.6)
Not44(35.8)79(64.2)123(10.4)
Be proactive in health knowledge trainingOften146(14.7)849(85.3)995(84.0)
Not66(34.9)123(65.1)189(16.0)
Concerned about the possible health effects from the place you work inOften142(14.8)816(85.2)958(80.9)
Not70(31.0)156(69.0)226(19.1)
Take the initiative to wear or use protective equipment at workOften97(12.5)678(87.5)775(65.5)
Not115(28.1)294(71.9)409(34.5)
Desire to learn more about health related to your workplaceFully agree159(16.0)837(84.0)996(84.1)
Not53(28.2)135(71.8)188(15.9)
Table 4. Univariate analysis between various factors and depressive symptoms.
VariablesRefOR (95%CI)p
Sociodemographic characteristics
GenderFemaleMale0.8 (0.6–1.1)0.176
Age≥40 <400.5 (0.4–0.7)0.000
BMI<18.518.5–23.91.5 (1.0–2.4)0.049
≥241.3 (0.9–1.9)0.136
EducationGraduate and aboveBelow university level1.9 (1.3–2.7)0.000
Income5–9.9<50.9 (0.6–1.3)0.514
≥100.6 (0.4–0.9)0.024
SmokingYesNo1.3 (0.9–2.0)0.189
DrinkingYesNo2.2 (1.6–3.1)0.000
Working conditions
Working positionServerManager1.3 (0.9–1.8)0.201
Working age5–9.9<51.0 (0.6–1.4)0.817
≥100.9 (0.6–1.5)0.746
Working hours per week≥40 h<40 h0.7 (0.5–1.0)0.054
Working environmentBadNot3.7 (2.7–5.1)0.000
Psychosocial factors
Working abilityWeakAverage0.7 (0.2–2.1)0.557
Strong0.1 (0.1–0.2)0.000
Working pressureHighAverage1.8 (1.0–3.3)0.057
Low0.2 (0.1–0.3)0.000
Interpersonal relationshipPoorAverage8. (1.7–36.5)0.008
Good0.2 (0.1–0.2)0.000
A fulfilling lifeNoAverage8.4 (1.9–37.6)0.005
Yes0.1 (0.1–0.2)0.000
Physical symptoms
OcularOftenNot12.6 (7.4–21.5)0.000
RespiratoryOftenNot12.7 (6.4–25.3)0.000
DermalOftenNot5.9 (3.0–11.6)0.000
GeneralOftenNot9.7 (6.9–13.7)0.000
Working performance
Open the windows actively for ventilation when workingOftenNot0.3 (0.2–0.5)0.000
Be proactive in health knowledge trainingOftenNot0.3 (0.2–0.5)0.000
Concerned about the possible health effects from the place you work inOftenNot0.4 (0.3–0.5)0.000
Take the initiative to wear or use protective equipment at workOftenNot0.4 (0.3–0.5)0.000
Desire to learn more about health related to your workplaceFully agreeNot0.5 (0.3–0.7)0.000
Note: Values are expressed as crude odds ratio (95% CI). The bolded values indicate the statistically significant association between the variables.
Table 5. Multivariate analysis between various factors and depressive symptoms.
Model 1Model 2
OR (95% CI)pOR (95% CI)p
Working conditions
Working environment (ref = not bad)1.7 (1.1–2.5)0.0101.7 (1.1–2.5)0.008
Psychosocial factors
Working ability (ref = average)
Weak0.1 (0.0–1.0)0.0560.1 (0.0–1.0)0.050
Strong0.4 (0.2–0.7)0.0010.4 (0.3–0.8)0.002
Interpersonal relationship (ref = average)
Poor14.8 (1.4–151.4)0.02314.4 (1.4–1509)0.026
Good0.8 (0.4–1.3)0.3100.7 (0.4–1.2)0.220
A fulfilling life (ref = average)
No8.7 (1.2–62.7)0.0319.6 (1.3–71.2)0.026
Yes0.5 (0.3–0.8)0.0080.5 (0.3–0.9)0.021
Physiological symptoms
Ocular (ref = not often)4.6 (2.4–9.0)0.0004.0 (2.0–8.0)0.000
general (ref = not often)4.2 (2.8–6.4)0.0004.8 (3.1–7.3)0.000
Performance
Taking the initiative to wear or use protective equipment at work (ref = not often)0.6 (0.4–0.9)0.0200.7 (0.5–1.0)0.033
Note: Values are expressed as an adjusted odds ratio (95% CI). Model 1: Working conditions, psychosocial factors, symptoms, and performance (p < 0.05) in univariate analyses were included in multivariate stepwise logistic regression analysis (forward LR). Model 2: Model 1 was adjusted for sociodemographic characteristics The bolded values indicate the significant association between the variables.
Disclaimer/Publisher’s Note: The statements, opinions and data contained in all publications are solely those of the individual author(s) and contributor(s) and not of MDPI and/or the editor(s). MDPI and/or the editor(s) disclaim responsibility for any injury to people or property resulting from any ideas, methods, instructions or products referred to in the content.

