1. Introduction
Many geographic areas are already suffering from severe droughts and water resource shortages due to climate change [
1], particularly affecting irrigation water requirements [
2]. Improving water use efficiency is more than ever an urgent need and entails an effective and sustainable exploitation and management of the irrigation infrastructure [
3]. Furthermore, adopting irrigation practices that do not deplete freshwater or damage aquatic ecosystems is vital for adapting irrigated agriculture to climate change conditions [
4].
Domestic effluents may be one of the adaptation practices because they contain essential nutrients for agricultural crop development, and Treated Wastewater (TWW) reuse may reduce the freshwater demand and groundwater depletion while decreasing effluent discharges into water bodies [
5]. However, the high concentration of salts that characterizes TWW may entail changes in the soil quality ascribable to the soil–water interactions that may lead to long-term soil salinization and yield reduction [
6,
7]. In other words, sequential TWW irrigation seasons may compromise the soil quality, such as by modifying soil infiltration and aeration and reducing root uptake of nutrients [
8]. Moreover, regular TWW irrigation events induce cytotoxicity in plants caused by an excessive uptake of ions and a nutritional imbalance [
9,
10,
11].
Overall, these effects stem from (1) the applied irrigation schedule and (2) the soil hydrological behavior. So far, most of the adopted TWW irrigation management plans are commonly defined according to the irrigation water quality and the conventional crop water requirement estimates, regardless of the soil–water interactions. However, the latter is significantly relevant and necessitates the consideration of soil water content and soil physical properties when selecting the irrigation schedule to be adopted. In addition, the availability of nutrients and the organic matter content in the soil aggregates are affected, which in turn affects the capacity of the soil to retain water, soil water infiltration, transport of nutrients to the roots and drainage processes, and soil fertility.
All the above confers the inevitable necessity to account for the soil hydraulic characteristics and the water–soil dynamics, among other aspects, in TWW irrigation management plans, since they are basically involved in the replenishment of groundwater through deep percolation fluxes and recharge [
12,
13]. For this purpose, accounting for only water quality is no longer enough as the soil, along with water and salts, triggers complex transport processes, giving place to fluxes within and below the root zone that may compromise the plant growth, soil, and groundwater quality [
14].
Research supports that once the irrigation volumes are supplied to the soil, the infiltration and redistribution processes occur and contribute to regulating the water exchange within the soils, plants, and atmospheric system [
15]. Thus, the adopted irrigation management strategy, which defines the frequency and interval of the interventions, does nothing but steadily interfere with the soil–water interactions, modifying the available soil water and the water and salt fate [
16,
17].
Since the soil’s hydraulic properties largely influence the water and salt movement, their assessment is necessary. One example is observed in clay soils, where preferential flows often occur after tillage practices, induce salt transfer below the root zone, and reduce soil volume, contributing to water and nutrient uptake [
18,
19,
20]. In addition, water moving through the soil brings along salts and may generate fluxes beyond the root zone, thus promoting groundwater pollution [
21]. Among the different pollutants, nitrates are a cause of concern, given their capability to move with water [
22,
23].
In detail, water fluxes defined as an oversupply abandoning the root zone may become a potential source of leaching. Therefore, investigating the fate of water and nitrogen is of paramount importance for designing a proper TWW irrigation management plan.
Nonetheless, the task is not simple, as the mechanisms that govern the movement of water and transport of nutrients in the soils are rather complex, depending on physical laws, and are further convoluted by the soil spatial variability. Moreover, the temporal variability of the water supply and the uniformity of distribution by an irrigation system exacerbate the complexity and imply a high performance of the distribution system to enhance water infiltration [
24,
25].
To this end, modeling unsaturated soils may be a worthwhile strategy to adopt [
26,
27], and flow and transport models are the most appropriate to support a thorough plan of irrigation practices with TWW as they consider both water and nitrate fluxes [
28]. Moreover, if the physical-based models are also calibrated with in situ measures, the outputs will be pretty accurate. In this regard, Refs. [
10,
29] observed more robust model results in a citrus orchard irrigated with TWW, where the soil water and salt distribution predictions were compared with detailed numerical analyses. This means that combining modeling and monitoring allows for determining robust outcomes [
30], where the model provides estimates of the water and nitrate fluxes reasonably close to the real conditions’ aftermath of long-term TWW irrigation management, and the field data allow the model to be addressed for reliable predictions. Likewise, considering that the accuracy of the models depends on the outputs’ goodness implies collecting data measurements as well [
31]. For this reason, it is pivotal to collect robust data from large-scale experiments rather than small-scale ones, which are not adequate to detect real TWW risks, as they fail to represent soil variability, which is fundamental for the proper characterization of TWW dynamics.
Based on these considerations, the present research developed and adopted an approach combining monitoring and modeling (MMA) to address irrigation management with TWW, merely based so far on the commonly applied strategies for conventional water. MMA allowed the assessment of model accuracy based on data measurements and enabled the provision of outputs, such as water and nitrogen–nitrate fluxes, nitrogen uptake, and deep percolation. These outputs are fundamental to defining an irrigation schedule with TWW and are difficult and complex to ascertain only from measurements. MMA is permitted to retrieve the evolution of water and nutrient dynamics and detect eventual deep percolation fluxes. These were then used to remodulate irrigated agricultural management [
32,
33].
MMA implies considering (1) soil hydraulic characterization, (2) water infiltration and redistribution process estimation, and (3) soil quality in terms of salinity. Consequently, field techniques to characterize the soil hydraulic properties and measure the soil water content and salt distribution, combined with using a model that provides appropriate estimates of the soil dynamics induced by one irrigation practice rather than another, are integral to the approach.
As previously stated, to account for the long-term effects of TWW use in irrigation, it is essential to consider the soil status since these waters are also rich in nutrients, and their continued use in agriculture may contribute to soil salinization, reduction in nutrient uptake, and the groundwater pollution [
7,
10,
34]. After several irrigation seasons using TWW, mismanagement exposes the crops to stress conditions, such as nutrient deficit, which may become irreversible. Monitoring the soil salinity is also relevant. This supports the definition of TWW irrigation intervals during the growing season, which consequently curbs water oversupply and salt accumulation. In other words, monitoring soil solution electrical conductivity is relevant to the TWW strategy.
Since the salinity impact cannot be represented only by soil solution electrical conductivity measurements, σe, due to the soil water and salt complex processes, the soil nitrogen concentration might be a potential parameter to consider and make more robust irrigation management strategies. However, since the latter is a component rarely predictable with modeling, it can be approximated as the nitrogen content uptake by roots.
Finally, for selecting the best TWW irrigation management strategy, the outputs of the models are often compared with the optimum threshold values, which refer to irrigation with conventional water. However, threshold values must be tailored to the long-term reuse of TWW, resizing them, for example, to include plant nutrient deficiency since it is an unrecoverable condition.
Three components should be considered to identify a robust TWW irrigation schedule that accounts for the effects of a simultaneous source of water and nitrogen on soil and plant quality: soil water content, soil solution electrical conductivity, and leaf nitrogen concentration.
Based on all the above, this research proposes to apply MMA on the citrus plantations in Beit Dajan, Palestine, to estimate the soil water content and nitrogen concentration and enable the improvement of irrigation management strategies with TWW based on adequate threshold values.
More specifically, the 1D vadose zone flow model is used to predict and retrieve the long-term effects of TWW on soil quality from 2019 to 2021 based on the collected spot soil water content and soil quality data measured in 2021. A demand scenario is also built to identify the best TWW irrigation management strategy and define the leaf nitrogen threshold levels.
The deep percolation fluxes, instead, are estimated to predict the endangering of the groundwater quality and thus curb the TWW oversupplies.
The selection of a case study in Palestine stems from multiple factors related to water scarcity due to climate change in a vulnerable area with an evident gap in adaptation [
35] and a complex geopolitical context that limits the use of available groundwater resources and exerts extreme pressure on its use in agriculture [
36,
37]. The study allowed the combination of water and soil quality parameters with crop growth to improve citrus’s long-standing TWW irrigation management. However, the model can be calibrated for other crops and in different areas where water shortages due to climate change pose an existential threat to agriculture.
2. Materials and Methods
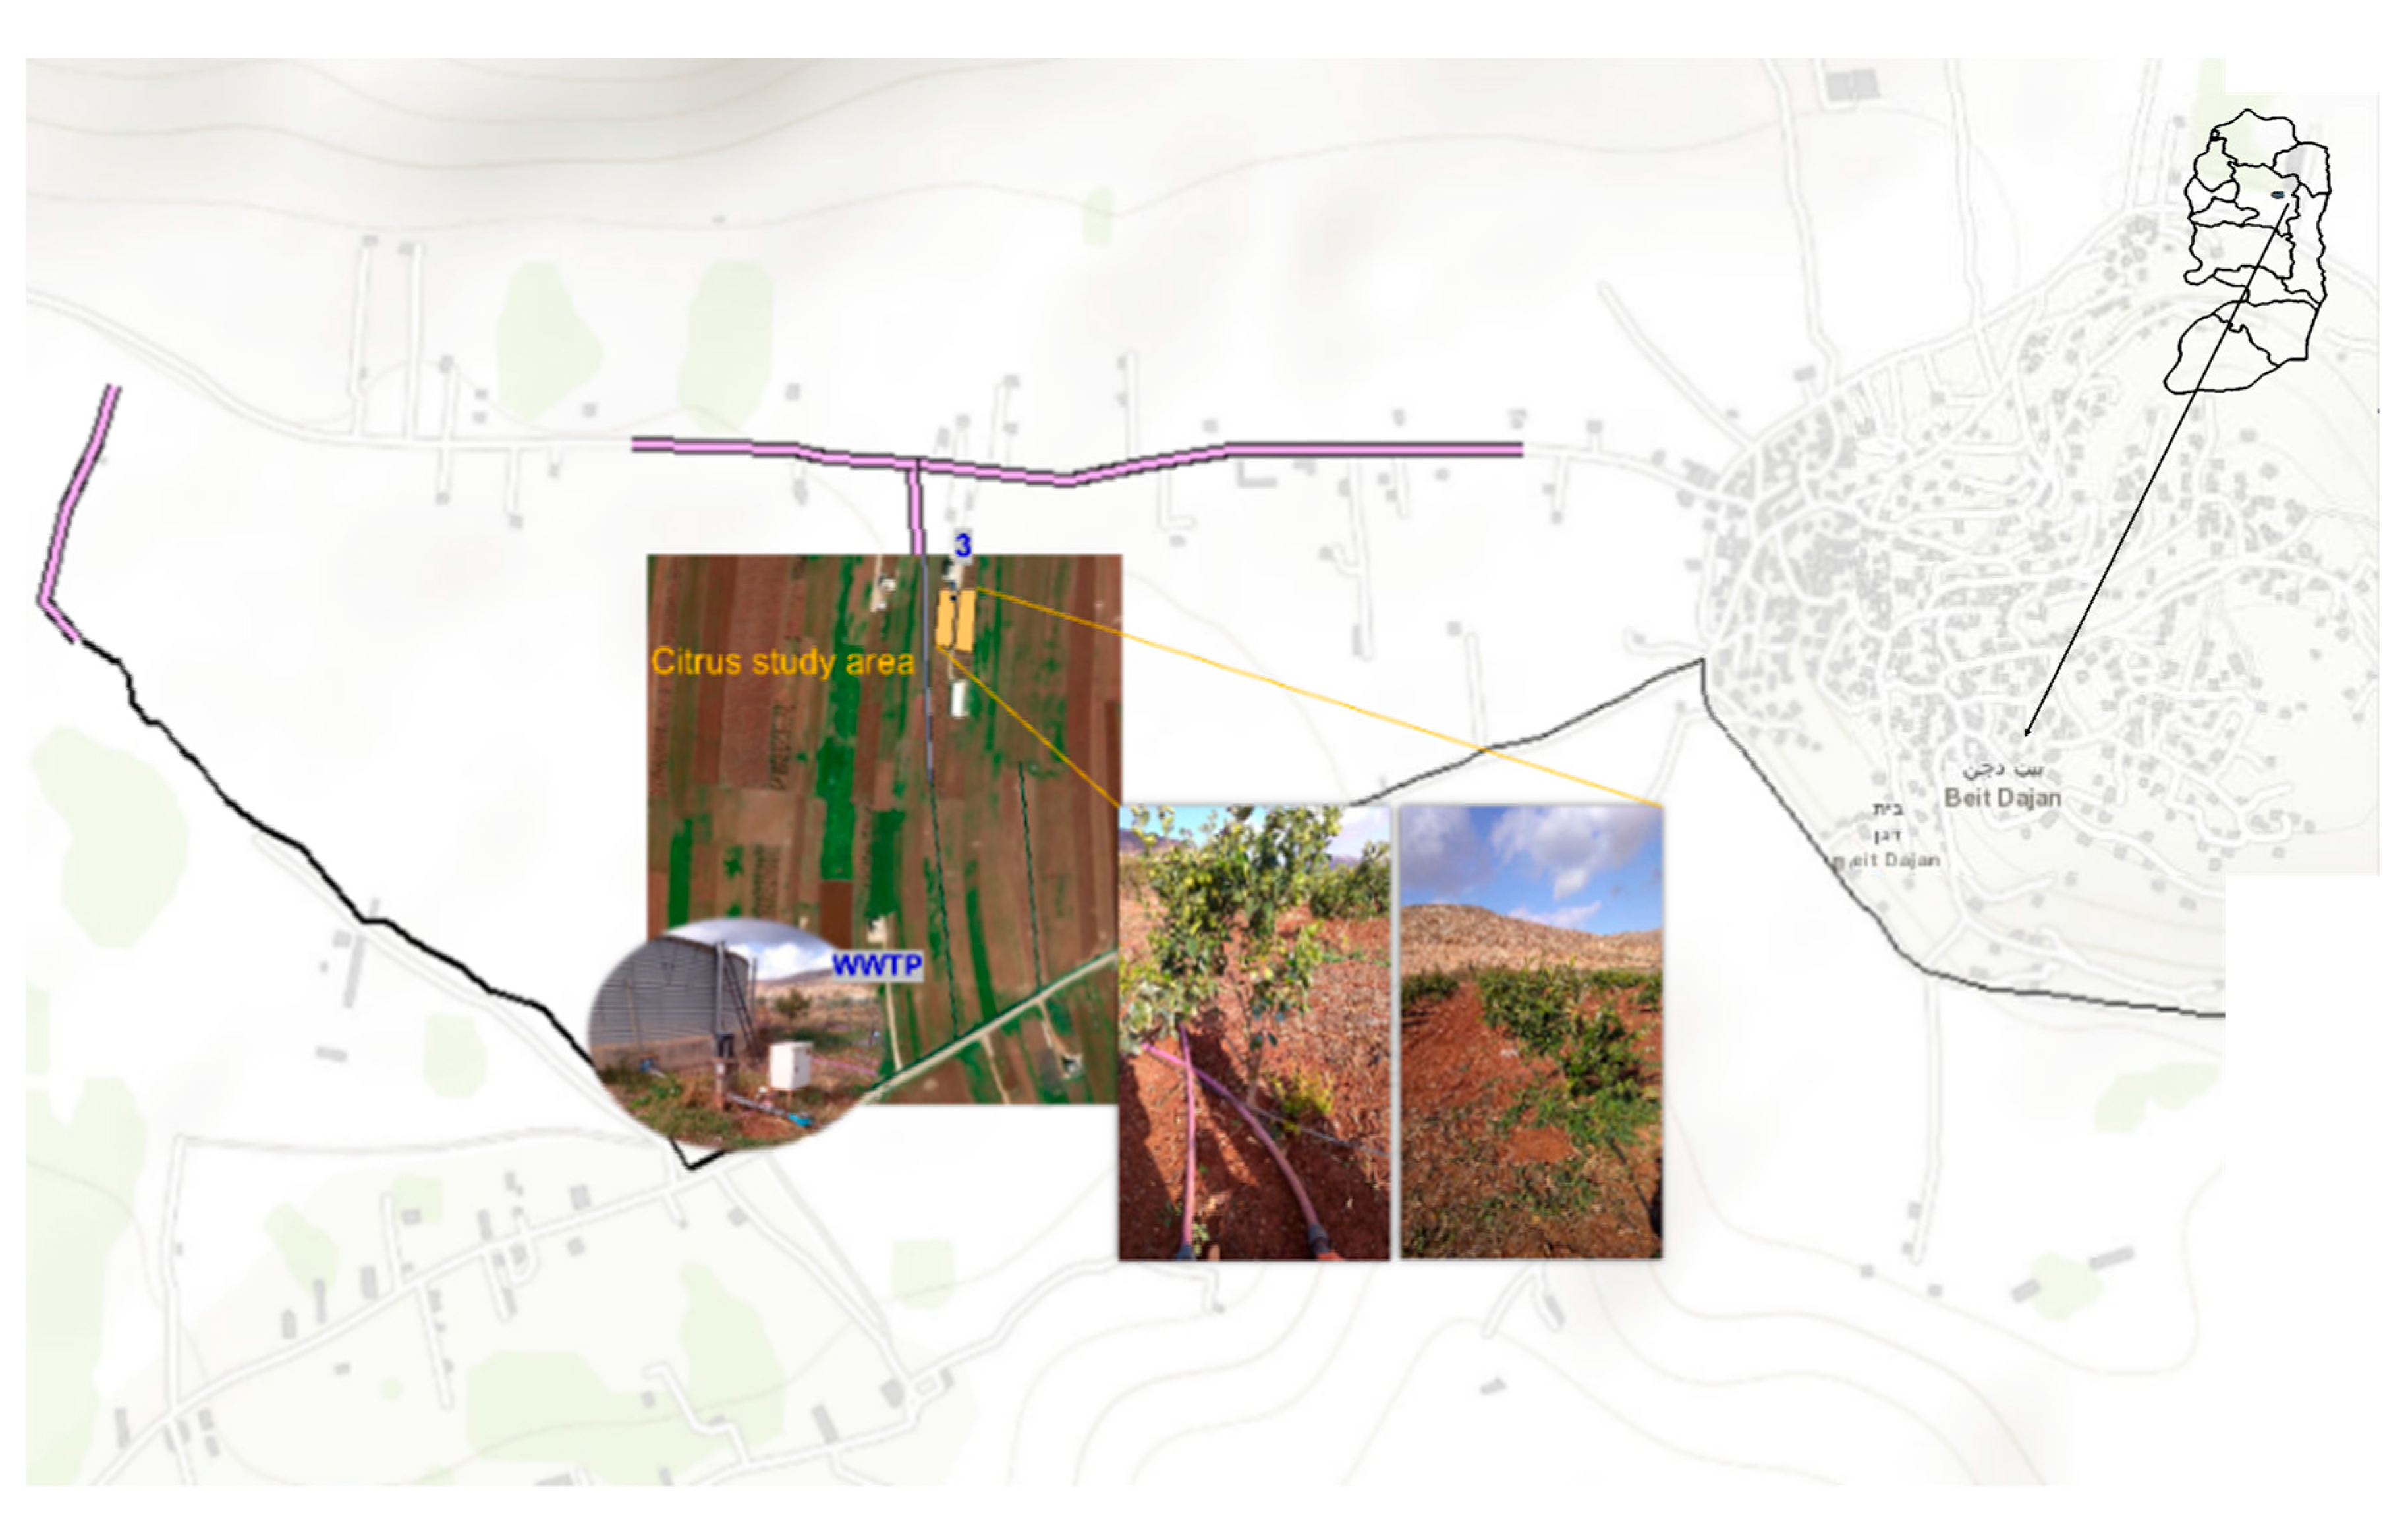
The study area was in Beit Dajan, located 10.74 km east of Nablus Governorate, approximately 80 km away from the Mediterranean Sea (600 m a.s.l). The mean annual rainfall was 343.3 mm, the average annual temperature was 20 °C, and the average annual humidity was approximately 56% [
38].
The selected experimental field (
Figure 1) had a surface area of 0.35 Ha and was cropped with citrus (6 years old), with an estimated water requirement of 750 mm yr
−1. The citrus orchards in the area were irrigated following a 3-day interval with drip systems that consisted of one drip line per tree row with emitters discharging 2 L h
−1 each and spaced 0.25 m apart. The WW treated at the tertiary level was an exclusive resource for irrigation.
The common soil type is Terra Rossa (Xerochrepts, Rhodoxeralfs) according to the USDA classification [
39]. The soil is red-brown and finely textured as clay loam with a percentage distribution of 35, 36.5, and 28.5% among clay, silt, and sand, respectively.
2.1. Monitoring Campaign: Collection of Soil Data
At the beginning of the irrigation season (3 March 2021), a survey allowed us to assess soil quality and hydraulic properties. Samples were collected below and between the two trees at three different depths per spot: 0–25; 25–50, and 50–75 cm. Overall, 6 undistributed soil samples were collected to determine the soil hydraulic properties as well as bulk density (), whereas 6 further campaigns were carried out on 29 April, 25 May, 7 and 28 June, 28 July, and 12 August of the same year to collect disturbed samples.
The data acquired during these campaigns were used to determine the soil water content, soil electrical conductivity, and nitrogen concentration at three depths to calibrate the model and then retrieve the scenarios of two previous years: 2019 and 2020, where soil and crop measurements were not available, and assuming the same soil hydraulic properties and crop characteristics as for 2021.
2.1.1. Soil Hydraulic Properties Estimation
An expeditious field method was used to determine both the water retention curve, h(θ), and the hydraulic conductivity function,
[
40]. The method consisted of estimating soil hydraulic properties based on the soil water infiltration process (the curves are not shown in this paper).
2.1.2. Soil Water Content, Soil Salinity, and Nitrogen Measurements
A series of measurement campaigns were performed to monitor the soil quality below and between two trees at three depths. To estimate the gravimetric water content, soil solution electrical conductivity, and available nitrogen 6 disturbed soil samples were collected. Moreover, many undisturbed samples were collected during the first campaign to determine the bulk density,
(M L
−3), and the corresponding volumetric water content of all samples. Chemical analyses were also performed to determine the concentrations of nitrogen using absorption spectrophotometry. In detail, available nitrogen was determined with an automated segmented flow analyzer using the cadmium reduction method to quantify nitrate-nitrogen [
41] and ammonium-nitrogen. In addition, leaf nitrogen measurements were carried out by collecting 5 leaves from 10 representative trees during 6 field campaigns. The leaf samples were analyzed according to the Kjeldahl method [
42].
2.2. Modeling Soil Water Movement and Solute Transport
HYDRUS-1D software package 4.17 [
27] was used to simulate one-dimensional water and multiple solute movements in variably saturated porous media.
Using the finite element method, HYDRUS-1D numerically solved the Richards equation for unsaturated soils and described the water flow and the advection–dispersion equations. For simplification, it neglects water, solute fluxes, pressure head, and concentration gradients in the horizontal direction.
2.2.1. Water Movement
Richards’ equation describes the soil water flow:
where
is the volumetric soil water content (L
3 L
−3), t is time (T), z is the vertical space coordinate (L), h is the pressure head (L) expressing the potential in terms of the water column’s height, K is the hydraulic conductivity (LT
−1), and S is the sink term accounting for water uptake by plant roots (T
−1).
van Genuchten–Mualem [
43] empirical model was used to determine the unsaturated hydraulic properties of the soil.
In Equation (2), and θr are the saturated and residual water content (cm3 cm−3), respectively; is the soil water content at a given pressure head (h); n and m = 1 − 1/n are shape parameters; is the effective saturation (cm−1) obtained as ; is a parameter that considers the tortuosity; and is the saturated hydraulic conductivity.
2.2.2. Solute Transport
The equations governing the one-dimensional advective-dispersive chemical transport under transient flow in the soil are defined as follows:
where
is the volumetric water content (L
3 L
−3);
,
and
are solute concentrations in the liquid phase (M L
−3), solid phase (M M
−1), and sink term (M L
−3), respectively;
is the soil bulk density (M L
−3);
is the volumetric flux density (L T
−1);
is the hydrodynamic dispersion coefficient (L
2 T
−1);
represents chemical reactions of solutes involved in a sequential first-order decay chain, such as the nitrification of nitrogen forms (M L
−3 T
−1); and subscript
represents the chemical forms as
,
, and
.
The last term in Equation (3) represents a passive root nutrient uptake [
44].
The adsorption and cation exchange, which are relatively complex processes, are considered in the solute transport module of the standard HYDRUS using empirical linear or nonlinear adsorption isotherms. The following linear equation describes the adsorption isotherm that relates
and
in Equation (3):
where
(L
3 M
−1) is the distribution coefficient of the chemical form
k.
2.2.3. Root Water Uptake
A macroscopic approach [
45] was used to determine the sink term,
. It assumes that the rate of the potential transpiration,
(L T
−1), distributed according to the normalized root density function,
(L
−1), over the root zone, and multiplied by,
, the dimensionless stress response function, accounts for osmotic and water stresses [
44,
45,
46]:
where
and
are, respectively, the actual and potential volumes of water taken from a unit volume of soil per unit of time (
), and
is a dimensionless function of the pressure (
) and the osmotic (
) head. Then, by integrating Equation (5) over the roots’ domain
, the actual transpiration rate,
(L T
−1), is derived as
The reduction in the water uptake by the roots induced by water stress,
, was described [
45] in the following model:
where
are the threshold parameters, and the water uptake is at the potential rate when
. It linearly drops off for
, and is null for
. The internal database of HYDRUS-1D provides the soil water pressure head parameters for citrus [
47].
The reduction in the water uptake by the roots induced by salinity stress,
, was described using the threshold and slope functions [
48]. The model was implemented in HYDRUS as follows:
where
is the salinity threshold (dS m
−1) corresponding to the electrical conductivity (
) value below which no reduction in the root water uptake occurs. It is expressed in terms of osmotic head (L),
slope, and
. The slopes determine the decline in root water uptake per unit increase in salinity or osmotic head, above or below the threshold, respectively.
2.3. Data Input
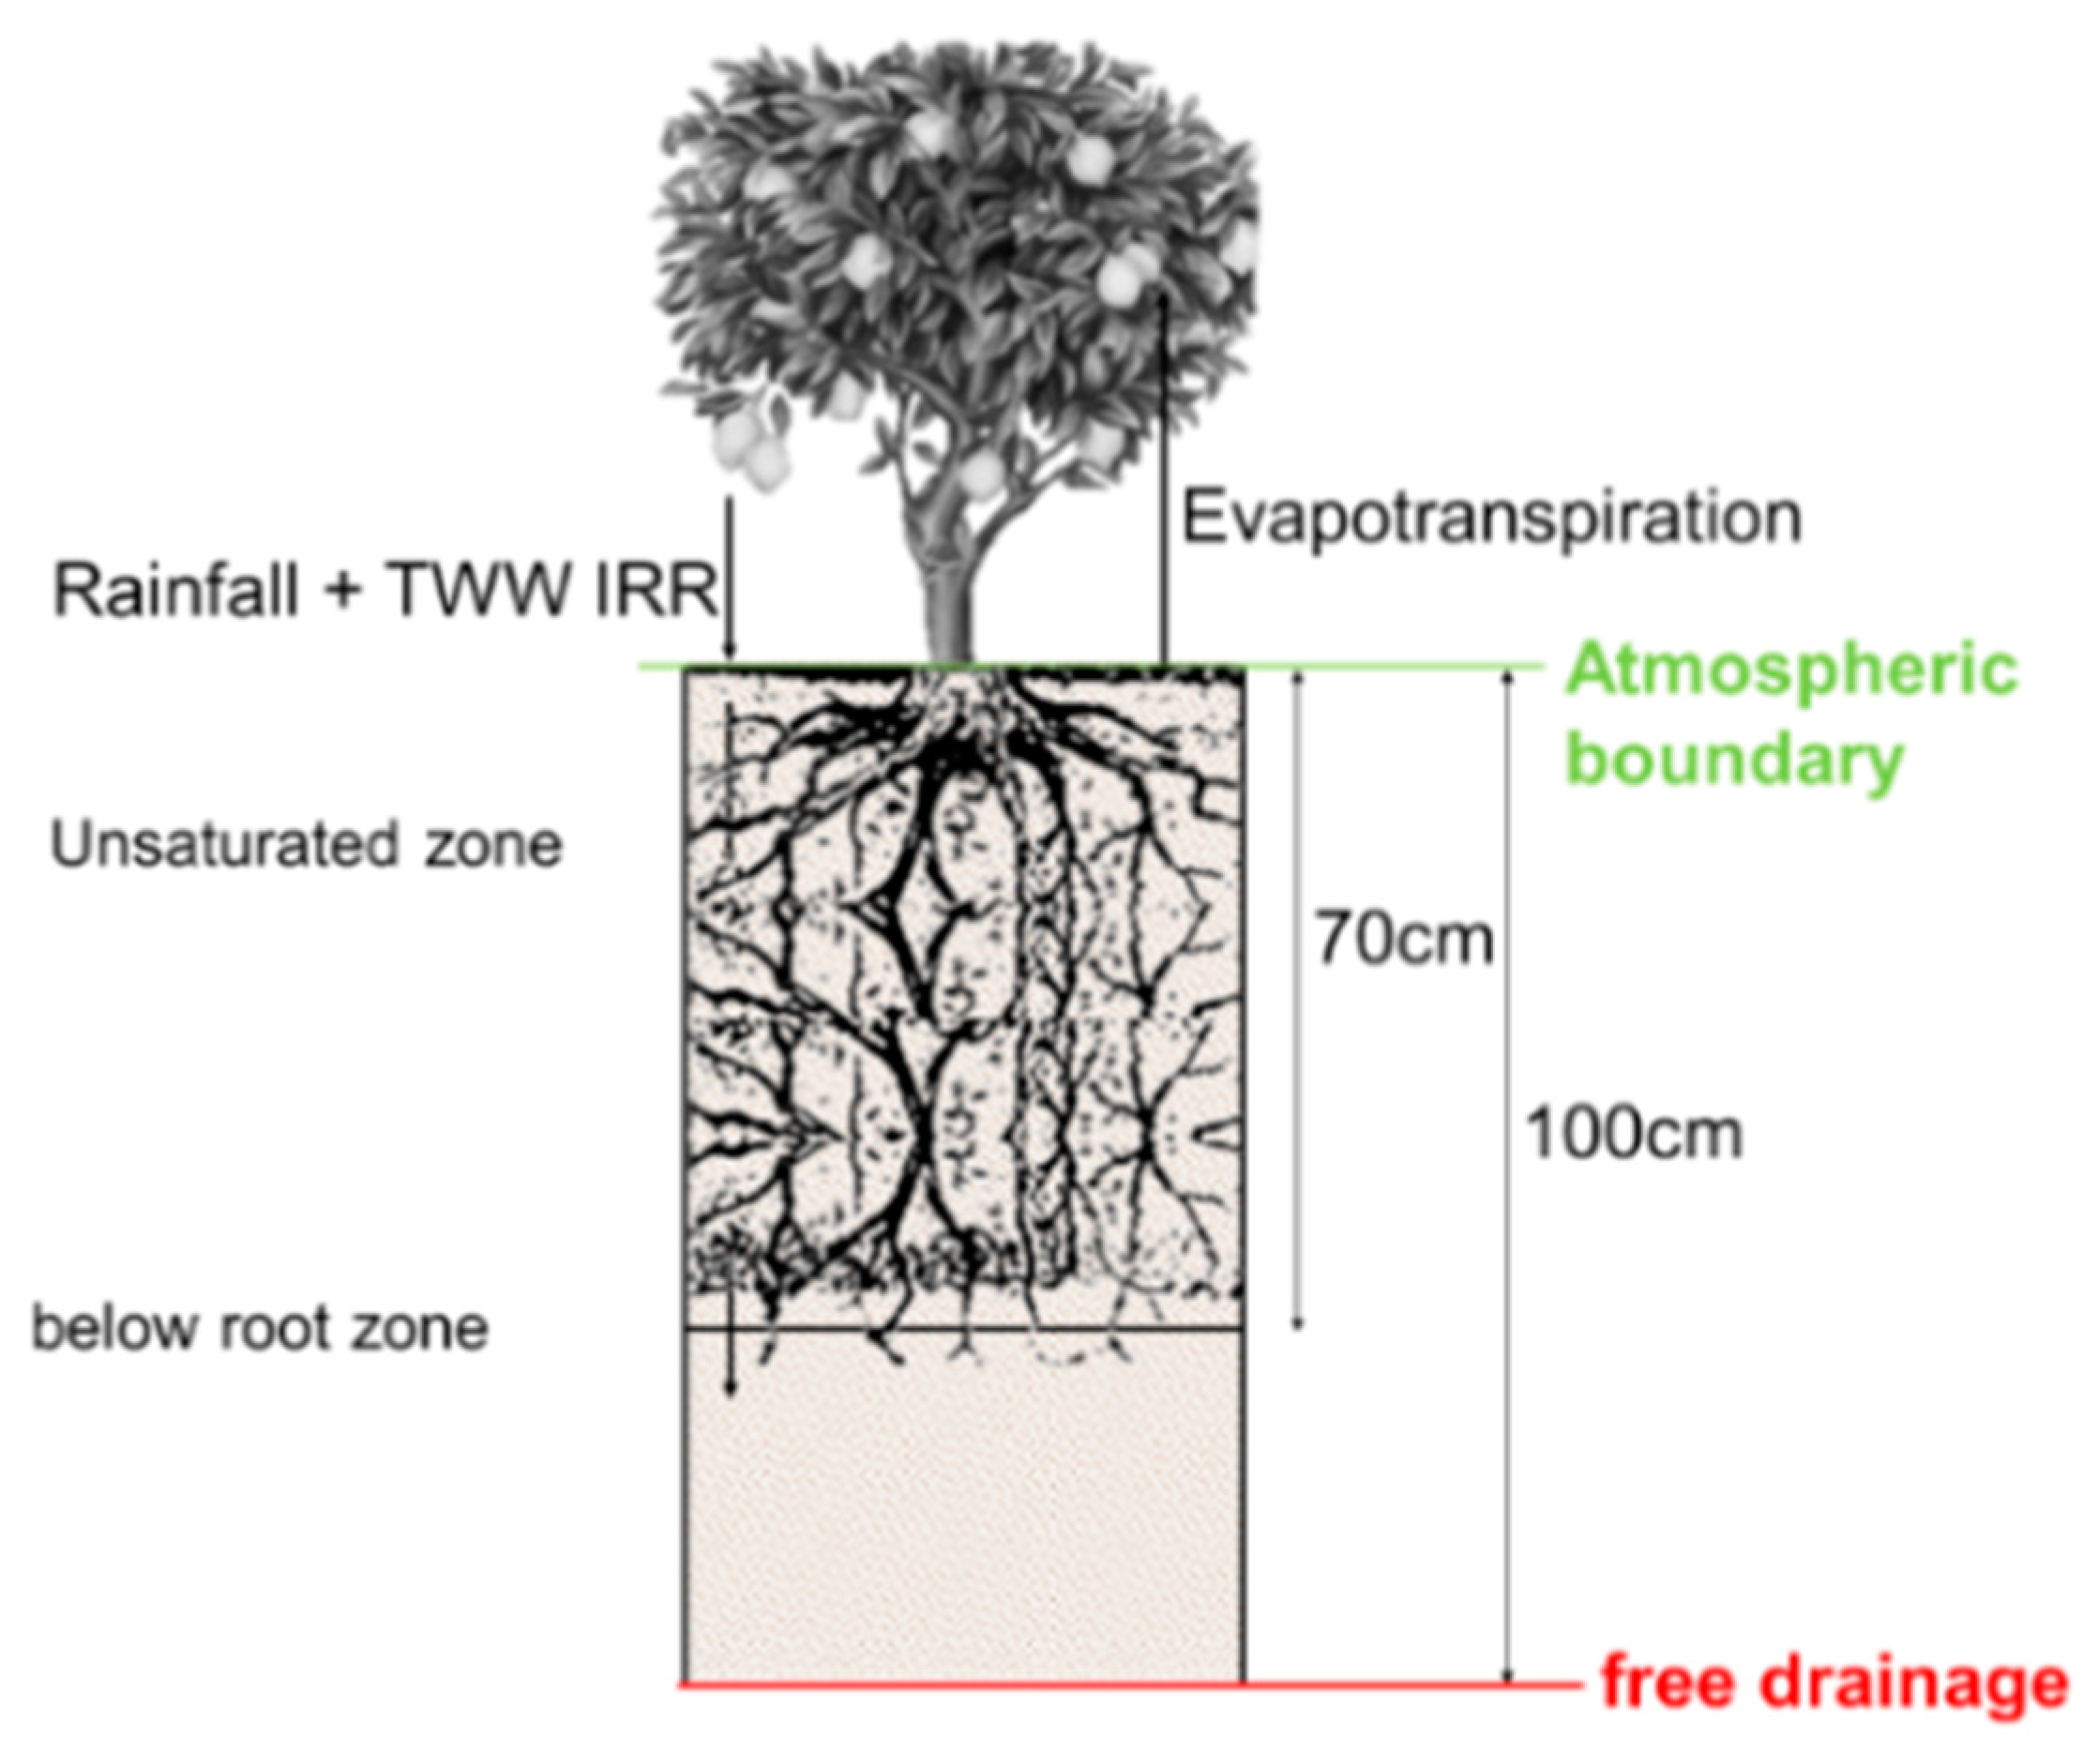
A geometric soil domain depth of 100 cm was set in Hydrus 1D, subdivided into two layers: 0–70 and 70–100 cm to include the variability of the soil hydraulic properties.
Moreover, the following data were inputted:
Daily meteorological data were recorded at the meteorological station in Nablus and averaged for 2010–2021;
Citrus crop coefficients along the developmental stages were collected from the literature;
TWW irrigation volumes applied by the farmers during the irrigation seasons of 2019, 2020, and 2021;
Soil and water quality: initial electrical conductivity (), nitrate, and ammonium, measured in both TWW and soil solution, in addition to soil water content;
Soil hydraulic and hydro-dispersive properties: The former was obtained according to the method described above, whereas the latter was collected from citrus experiments proposed in the literature [
49,
50].
2.4. The Setup
The geometry domain was drawn in terms of the initial, top, and boundary conditions (
Figure 2). The model was run twice to simulate water content, soil solution electrical conductivity,
, nitrogen concentrations, and root water uptake (below and between the two trees), where the average of both outputs was considered to represent the study area. The water fluxes outputs were used to estimate the deep percolation below 75 cm, whereas the root water uptake and soil nitrogen concentrations were used to estimate the leaf nitrogen content. To select the best model demand (M), the acceptable soil solution electrical conductivity values,
, were set in the range of 2.0–2.2 dS m
−1. At the same time, the estimated leaf nitrogen concentrations (LNC) were considered to be the acceptable values that accounted for the citrus nutrient deficit since the threshold values observed under conventional water irrigation were not representative of long-term TWW reuse.
The input modules were prepared to report the following initial conditions parameters: soil solution electrical conductivity (
), nitrate (
), ammonium (
), and initial soil water content (
) at three depths: 25, 50, and 75 cm as listed in
Table 1, while the initial pressure head was assumed uniform along the two soil profiles and set equal to −100 cm.
The boundary conditions were defined at the soil’s top and bottom (
Figure 2). Meteorological data and daily crop evapotranspiration (
) (where daily reference evapotranspiration (
) collected by the Nablus meteorological station and calculated using the Penman-Monteith method [
51] and
values of citrus as per [
51] were considered) were used to define the former, and the free drainage (unitary hydraulic gradient) to set the latter.
The root water uptake was computed using the HYDRUS-1D model and assumed as the fraction,
, of water transpired by the crop and obtained by splitting
daily values into two components (i) crop transpiration (
) and (ii) soil evaporation (
) rates, according to the authors of [
52].
The hydraulic parameters, such as the residual water content
, the saturated water content
, van Genuchten shape parameters (
), and the saturated hydraulic conductivity (
), were obtained as described in
Section 2.1. The estimated soil hydraulic parameters used are listed in
Table 2.
To describe the transport and transformations of
forms, the convection-dispersion equation and the first-order decay chain were used, respectively [
27]. Since ammonium and nitrate were considered as available nitrogen provided by TWW, the adsorption of ammonium to the soil particles and nitrification (
transformation into
and then further into
) were considered as the main reaction processes.
The parameters of solute transport, i.e., dispersity,
, and molecular diffusion coefficient,
,
,
, and
, were initially set based on [
50,
53,
54], and the data are listed in
Table 3. The HYDRUS-1D model, nitrogen-nitrate
and soil solution electrical conductivity
were assumed only in the dissolved phase (adsorption coefficient,
cm
3 d
−1), while nitrogen-ammonium
was assumed to adsorb to the solid phase using a distribution coefficient
of 3.5 cm
3 d
−1.
The initial ammonium and nitrate concentrations were set to a uniform zero concentration according to the authors of [
55]. Mineralization and immobilization processes were neglected [
56]. In this case, the denitrification process can be neglected due to the unsaturated and aerobic conditions in the soil under drip irrigation [
57]. Ref. [
55] states that denitrification losses may be ignored in silty clay, loam, and sandy loam soils where a micro-irrigation system was adopted, which was the case in the present study. Unlimited passive nutrient uptakes were considered for
forms according to the authors of [
27,
50]. The hydro-dispersive parameters are listed in
Table 3.
As for the water supply, irrigation water volumes stemming from the treatment plant and rainfall were accounted for. The TWW irrigation volumes were collected from farmers and then resized following the model demand (M), whereas the rainfall data were collected from the meteorological station, as explained above.
To monitor the TWW quality, three effluent samples were collected monthly from the outlet between 3 March and 30 August 2021, and their physical and chemical properties were analyzed following the Standard Methods of Water and Wastewater Analysis [
58].
Table 4 shows the analysis results as an average of the three collected samples.
Table 4 shows the high values of
(electrical conductivity of water) and ammonium
. In particular, the high concentration of
can be attributed to the high organic matter percentage. Having assumed that the available nitrogen (
) is the sum of
and
, it is evident that
plays a significant role in the soil nitrogen balance. Being positively charged, it is attracted and retained by the soil particles, which may favor either root uptake or fast nitrification. The latter scenario causes acidification of the soil and increases
availability, inducing losses through leaching and denitrification [
59].
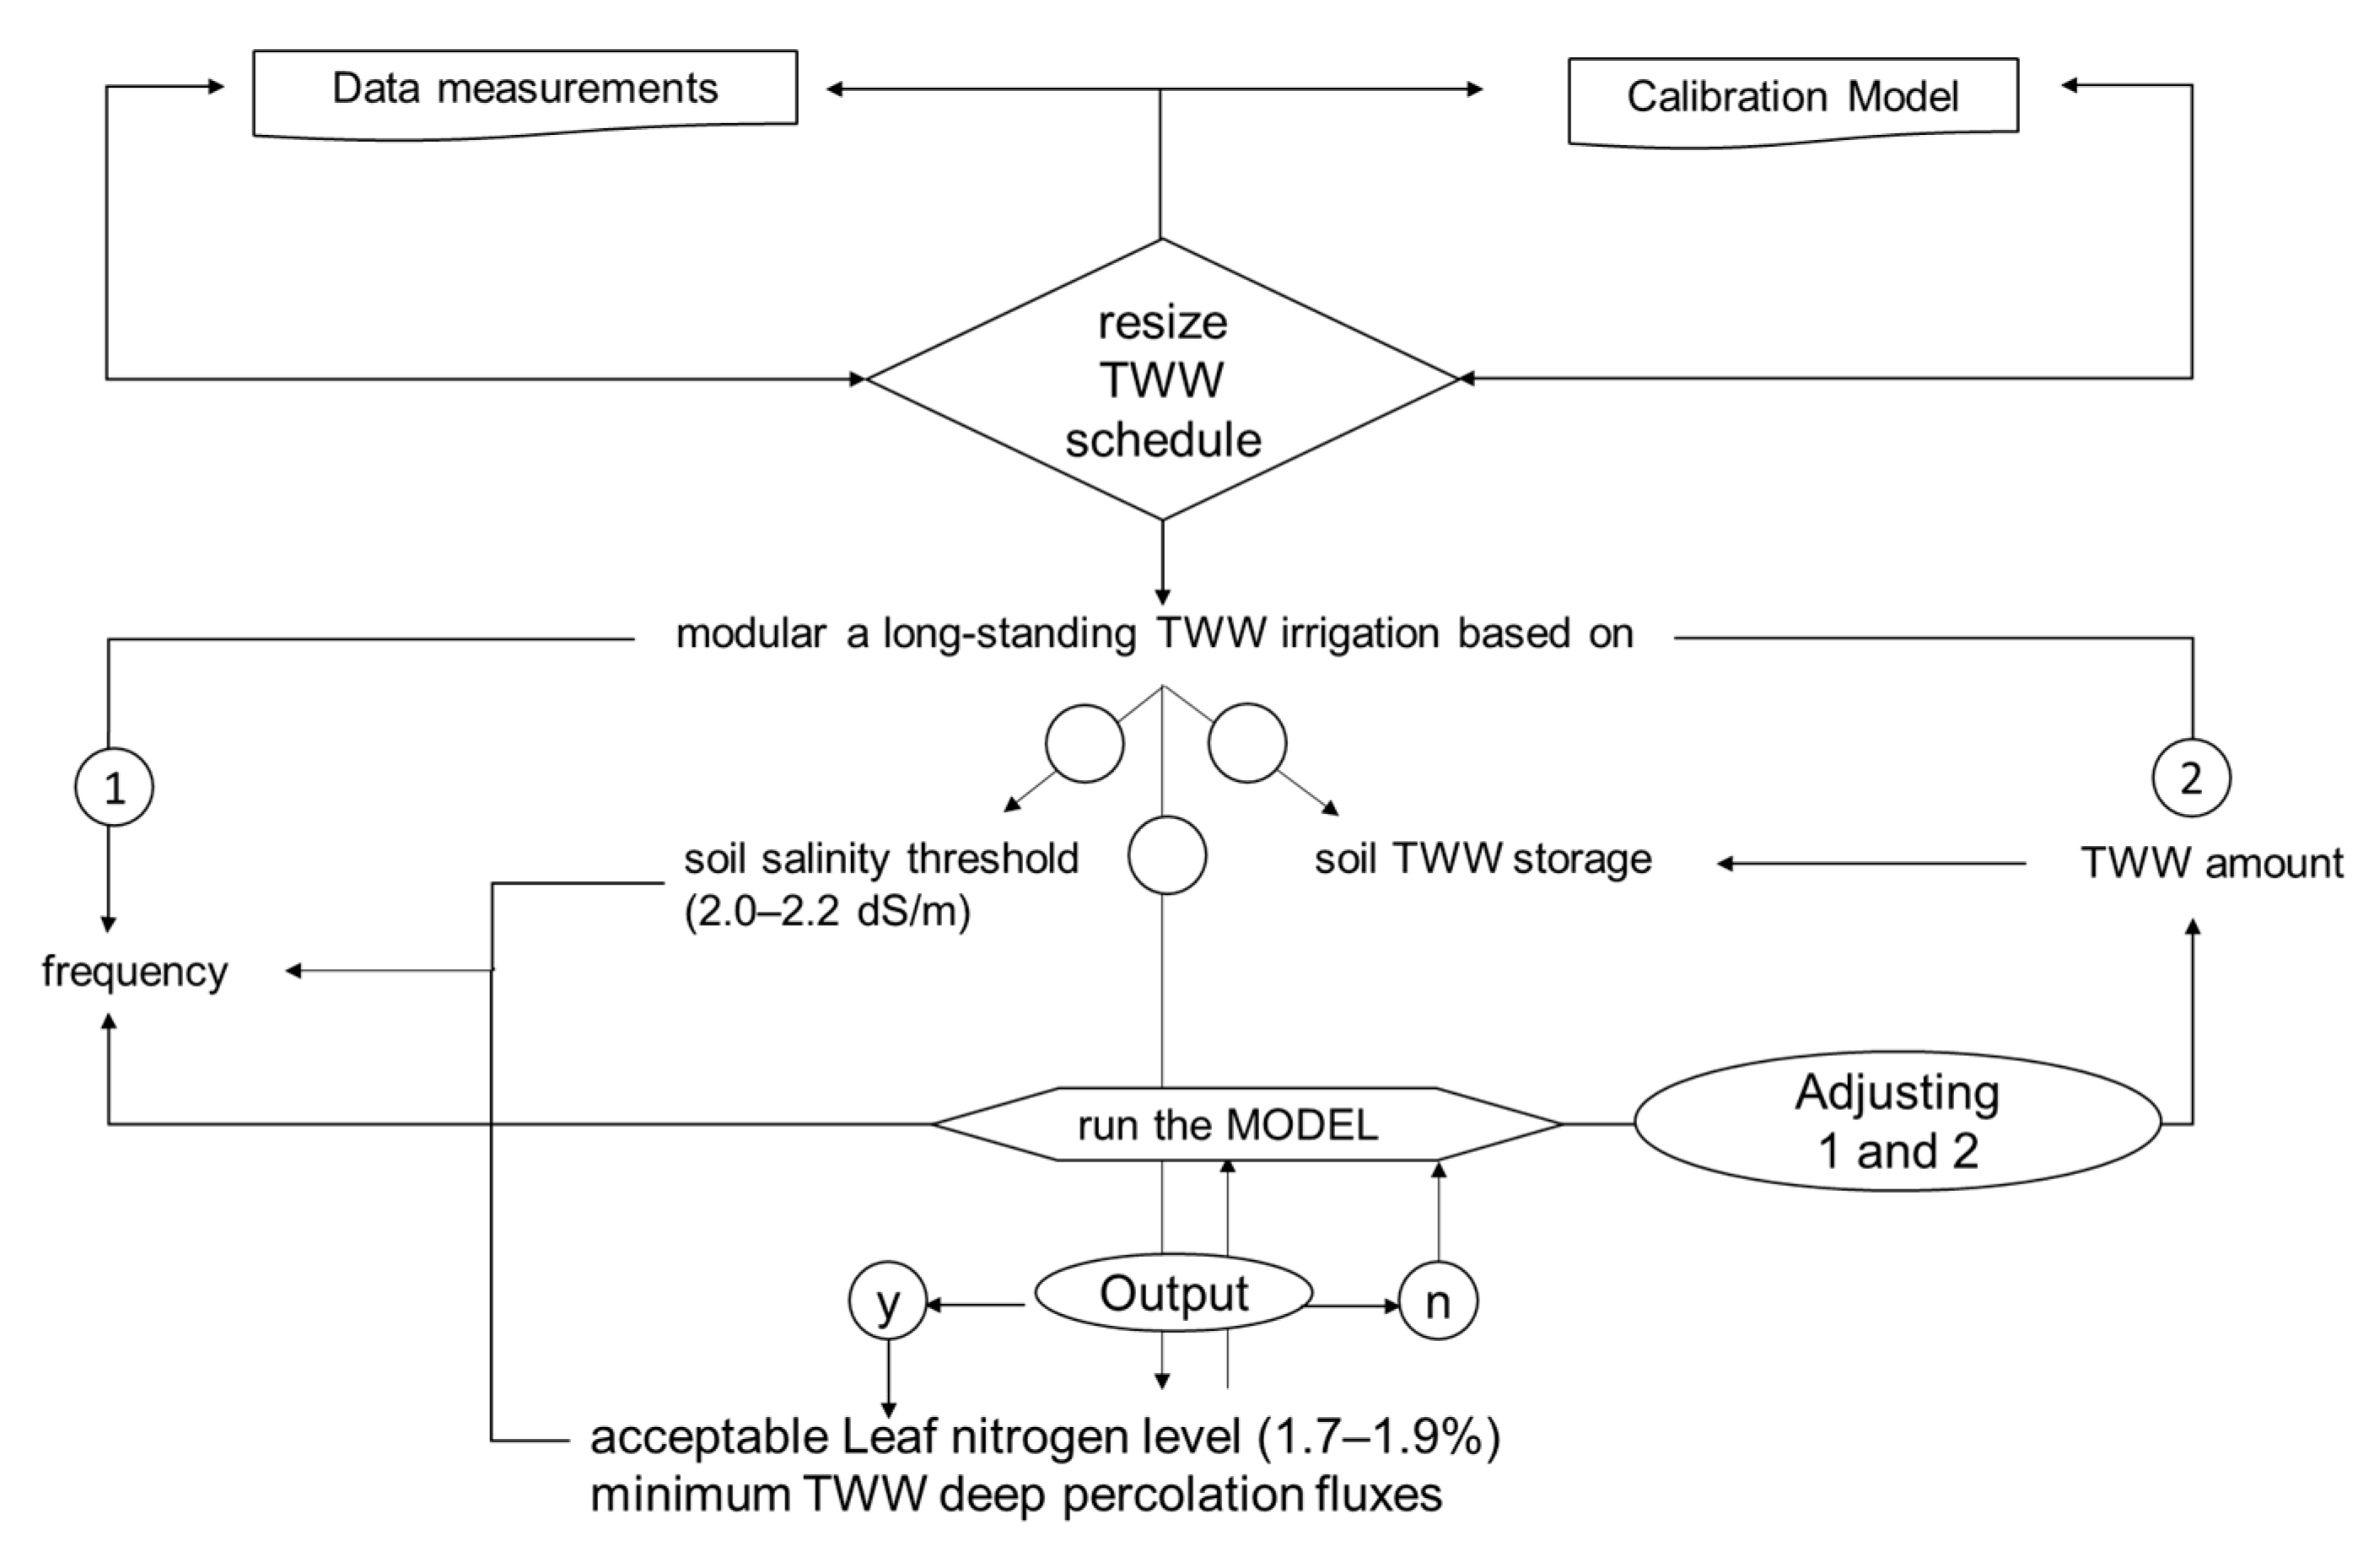
2.5. Modeling Optimal Irrigation Management Strategy with TWW
The demand (M) set in the Hydrus 1D model considered the simultaneous supply of salt and water and adjusted the irrigation frequency accordingly during the growing season. The threshold values of and LNC (measured monthly from March to August 2021) were considered.
In practice, the irrigation frequency was defined based on , while the soil water storage was calculated along the soil profile (0–75 cm) by summing the water content of the 3 compartments to define the irrigation volumes.
A frequency of 4–5 days was scheduled by the demand (M) to reach both an optimum LNC (between 1.7 and 1.9%) and a
, ranging between 2.0 and 2.2 dS m
−1 and assumed as the average soil salt tolerance of the root zone 0–75 cm. A diagram of the applied approach is illustrated in
Figure 3.
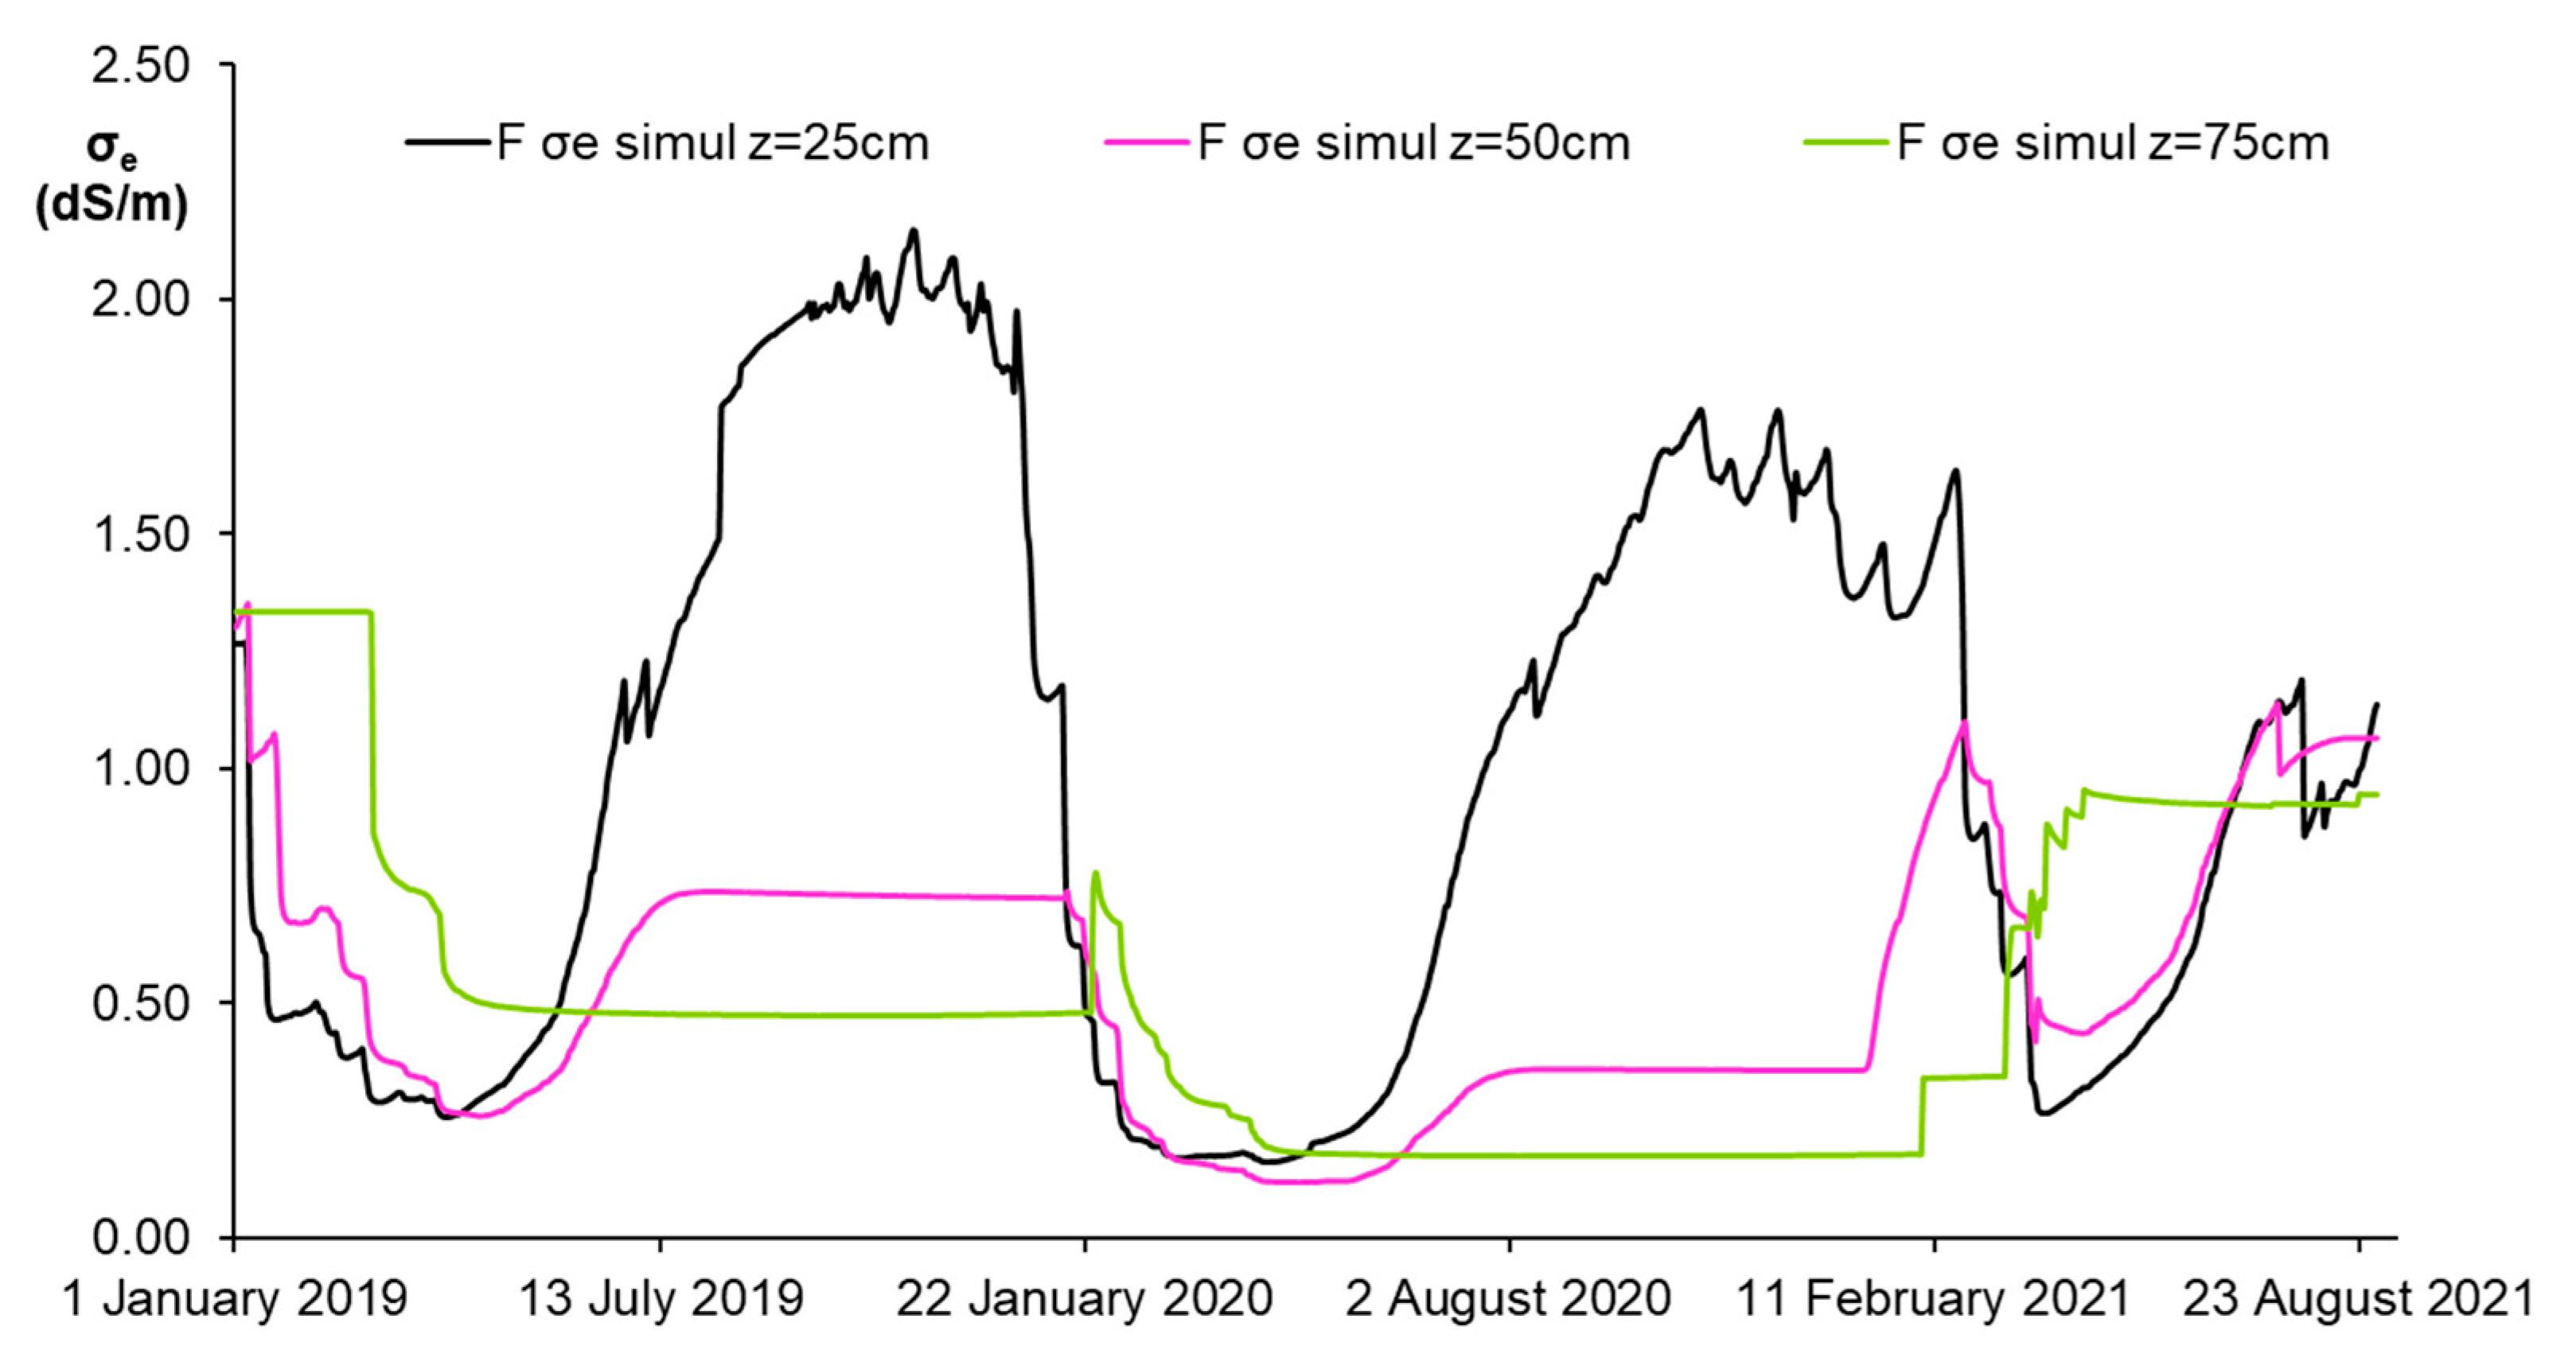
3. Results and Discussion
Six field campaigns (29 April, 25 May, 7 and 28 June, 28 July, and 12 August) were carried out during the citrus irrigation season 2021 to predict the evolution of water and salt behavior using the Hydrus 1D model. The collected data in 2021 allowed the realistic simulation of the field conditions and the reproduction of the soil water and salt movement observed in the field. Once the model was calibrated, the same geometry domain was used to retrieve the soil water and salt fluxes related to the two previous irrigation seasons: 2019 and 2020. The results are shown as a comparison between the farmer (F) and model (M) scenarios.
3.1. Monitoring Phase
The results depicted in the subsequent figures show the trend of water content, , soil solution electrical conductivity, , and soil nitrogen concentrations at three different depths (25, 50, and 75 cm) were obtained as an average of the data collected below and between the two trees.
Available soil nitrogen () was obtained as a sum of the nitrate and ammonium concentrations.
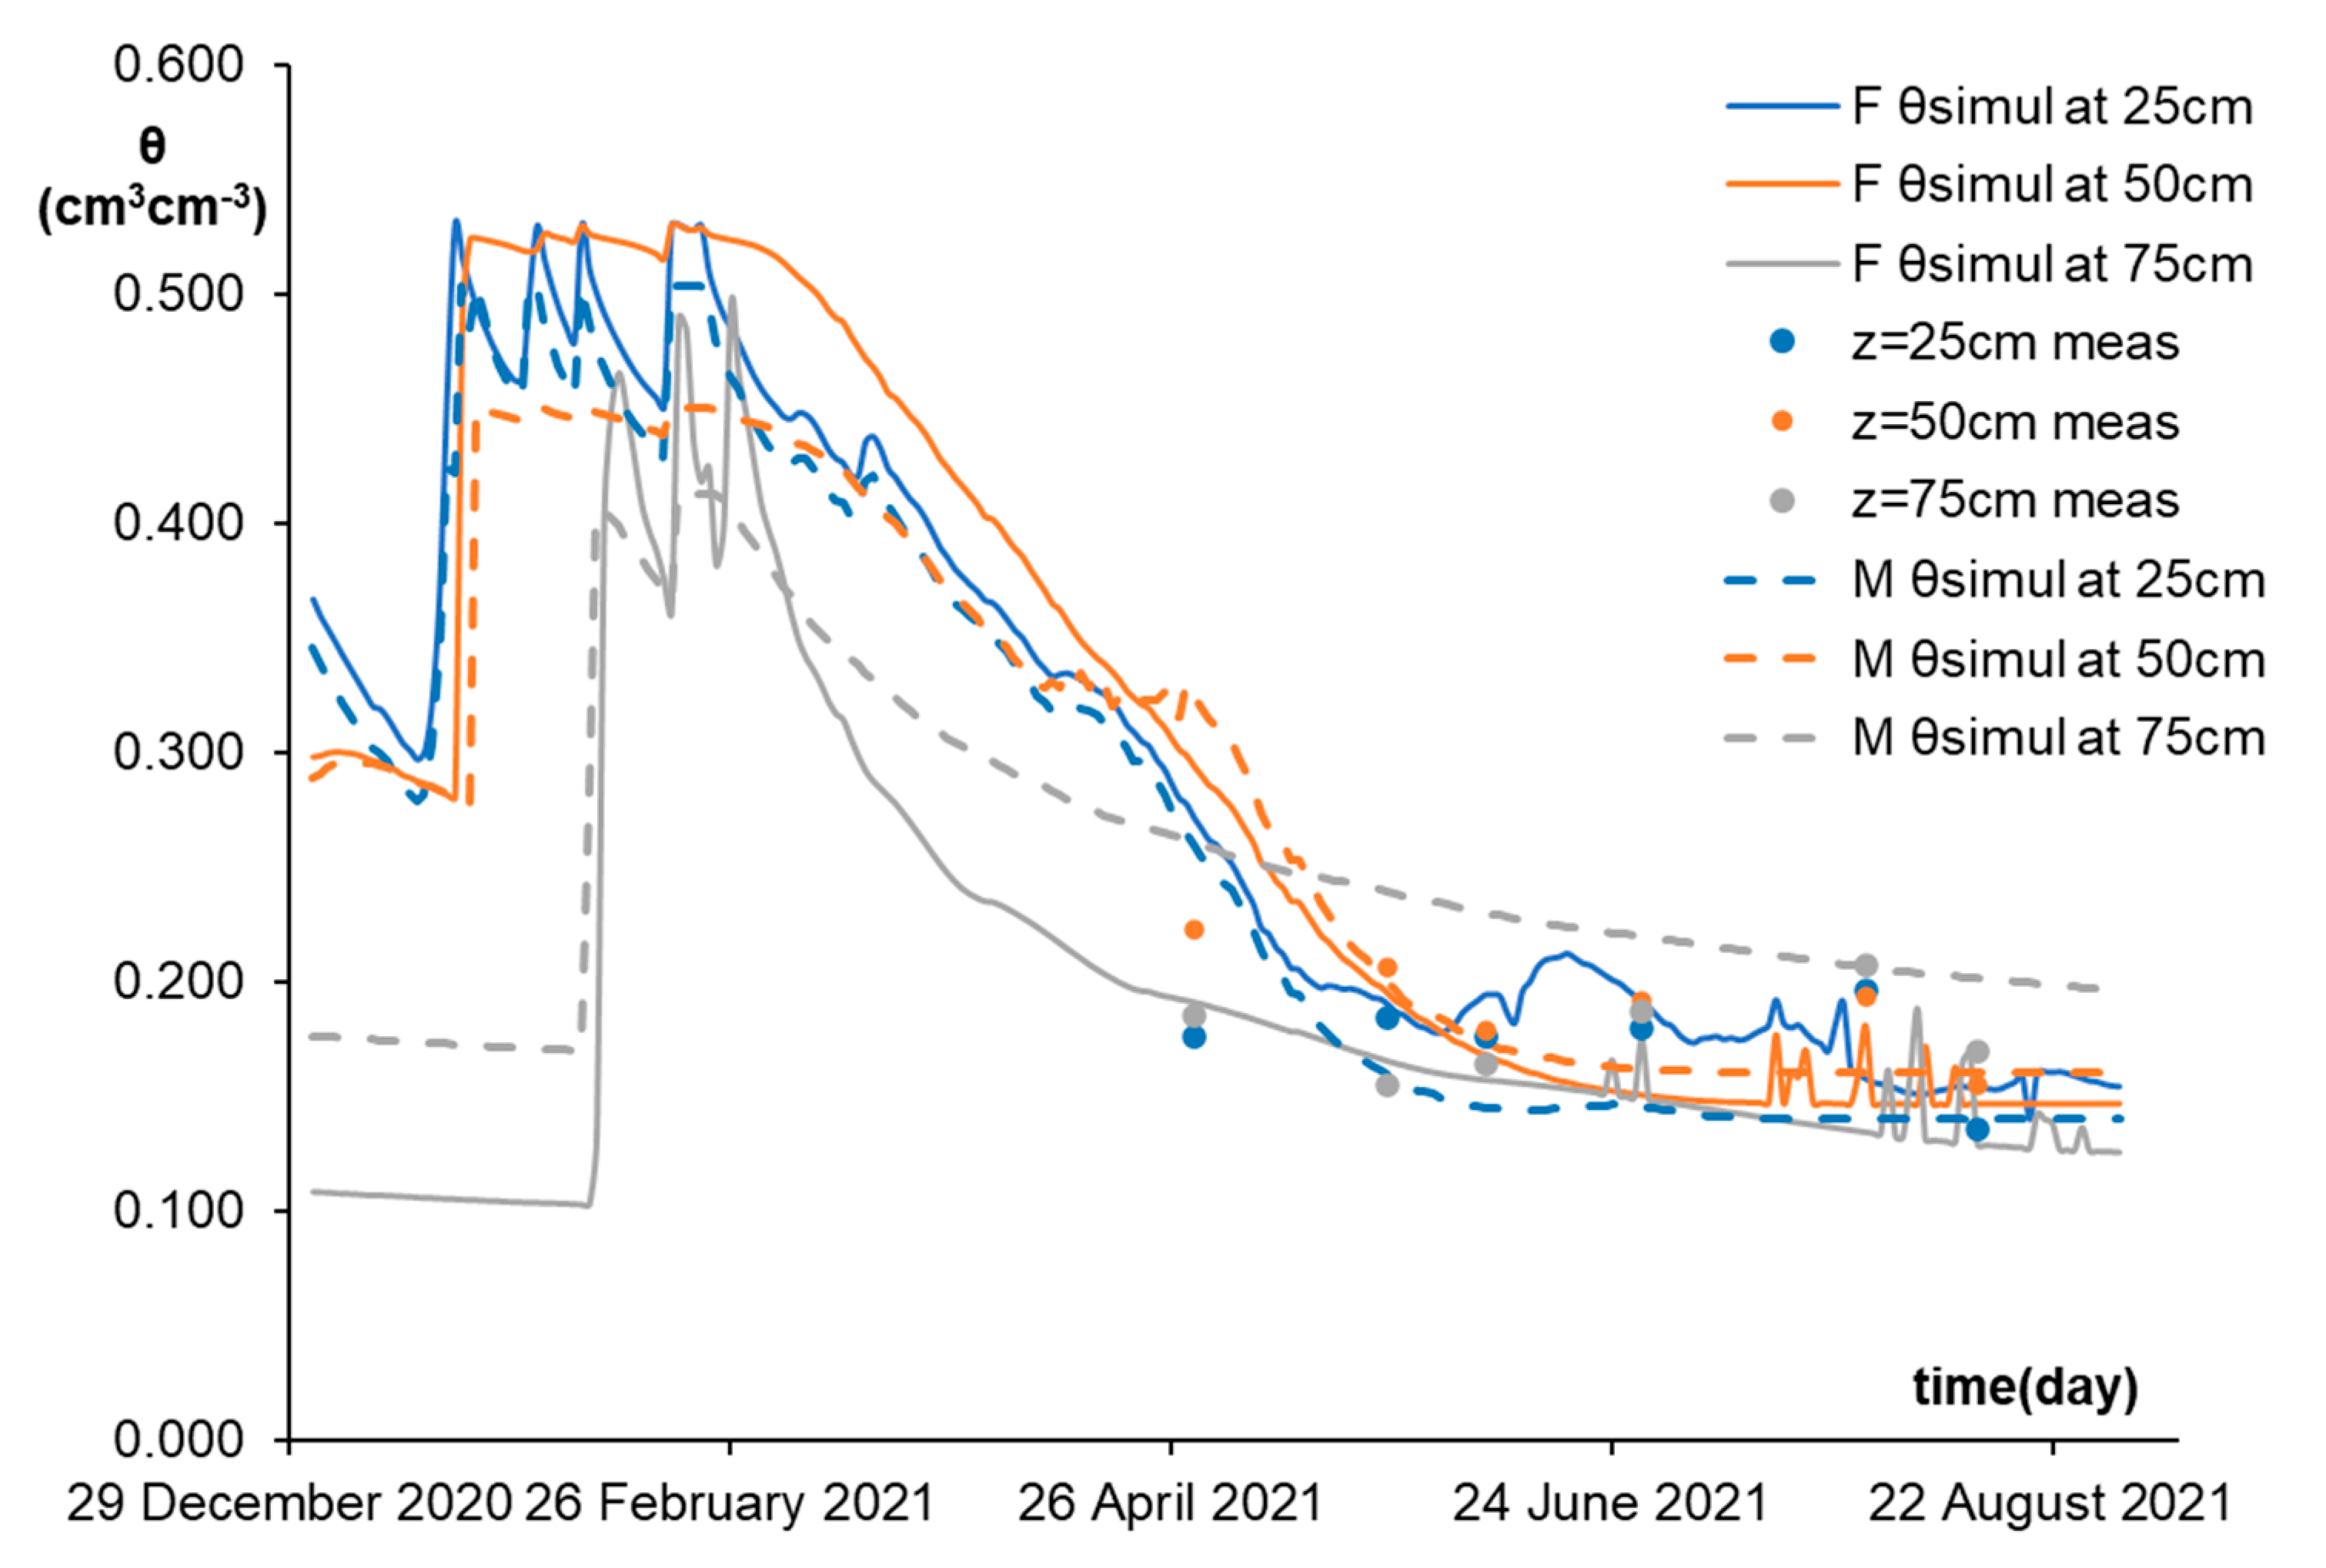
3.1.1. Soil Water Content
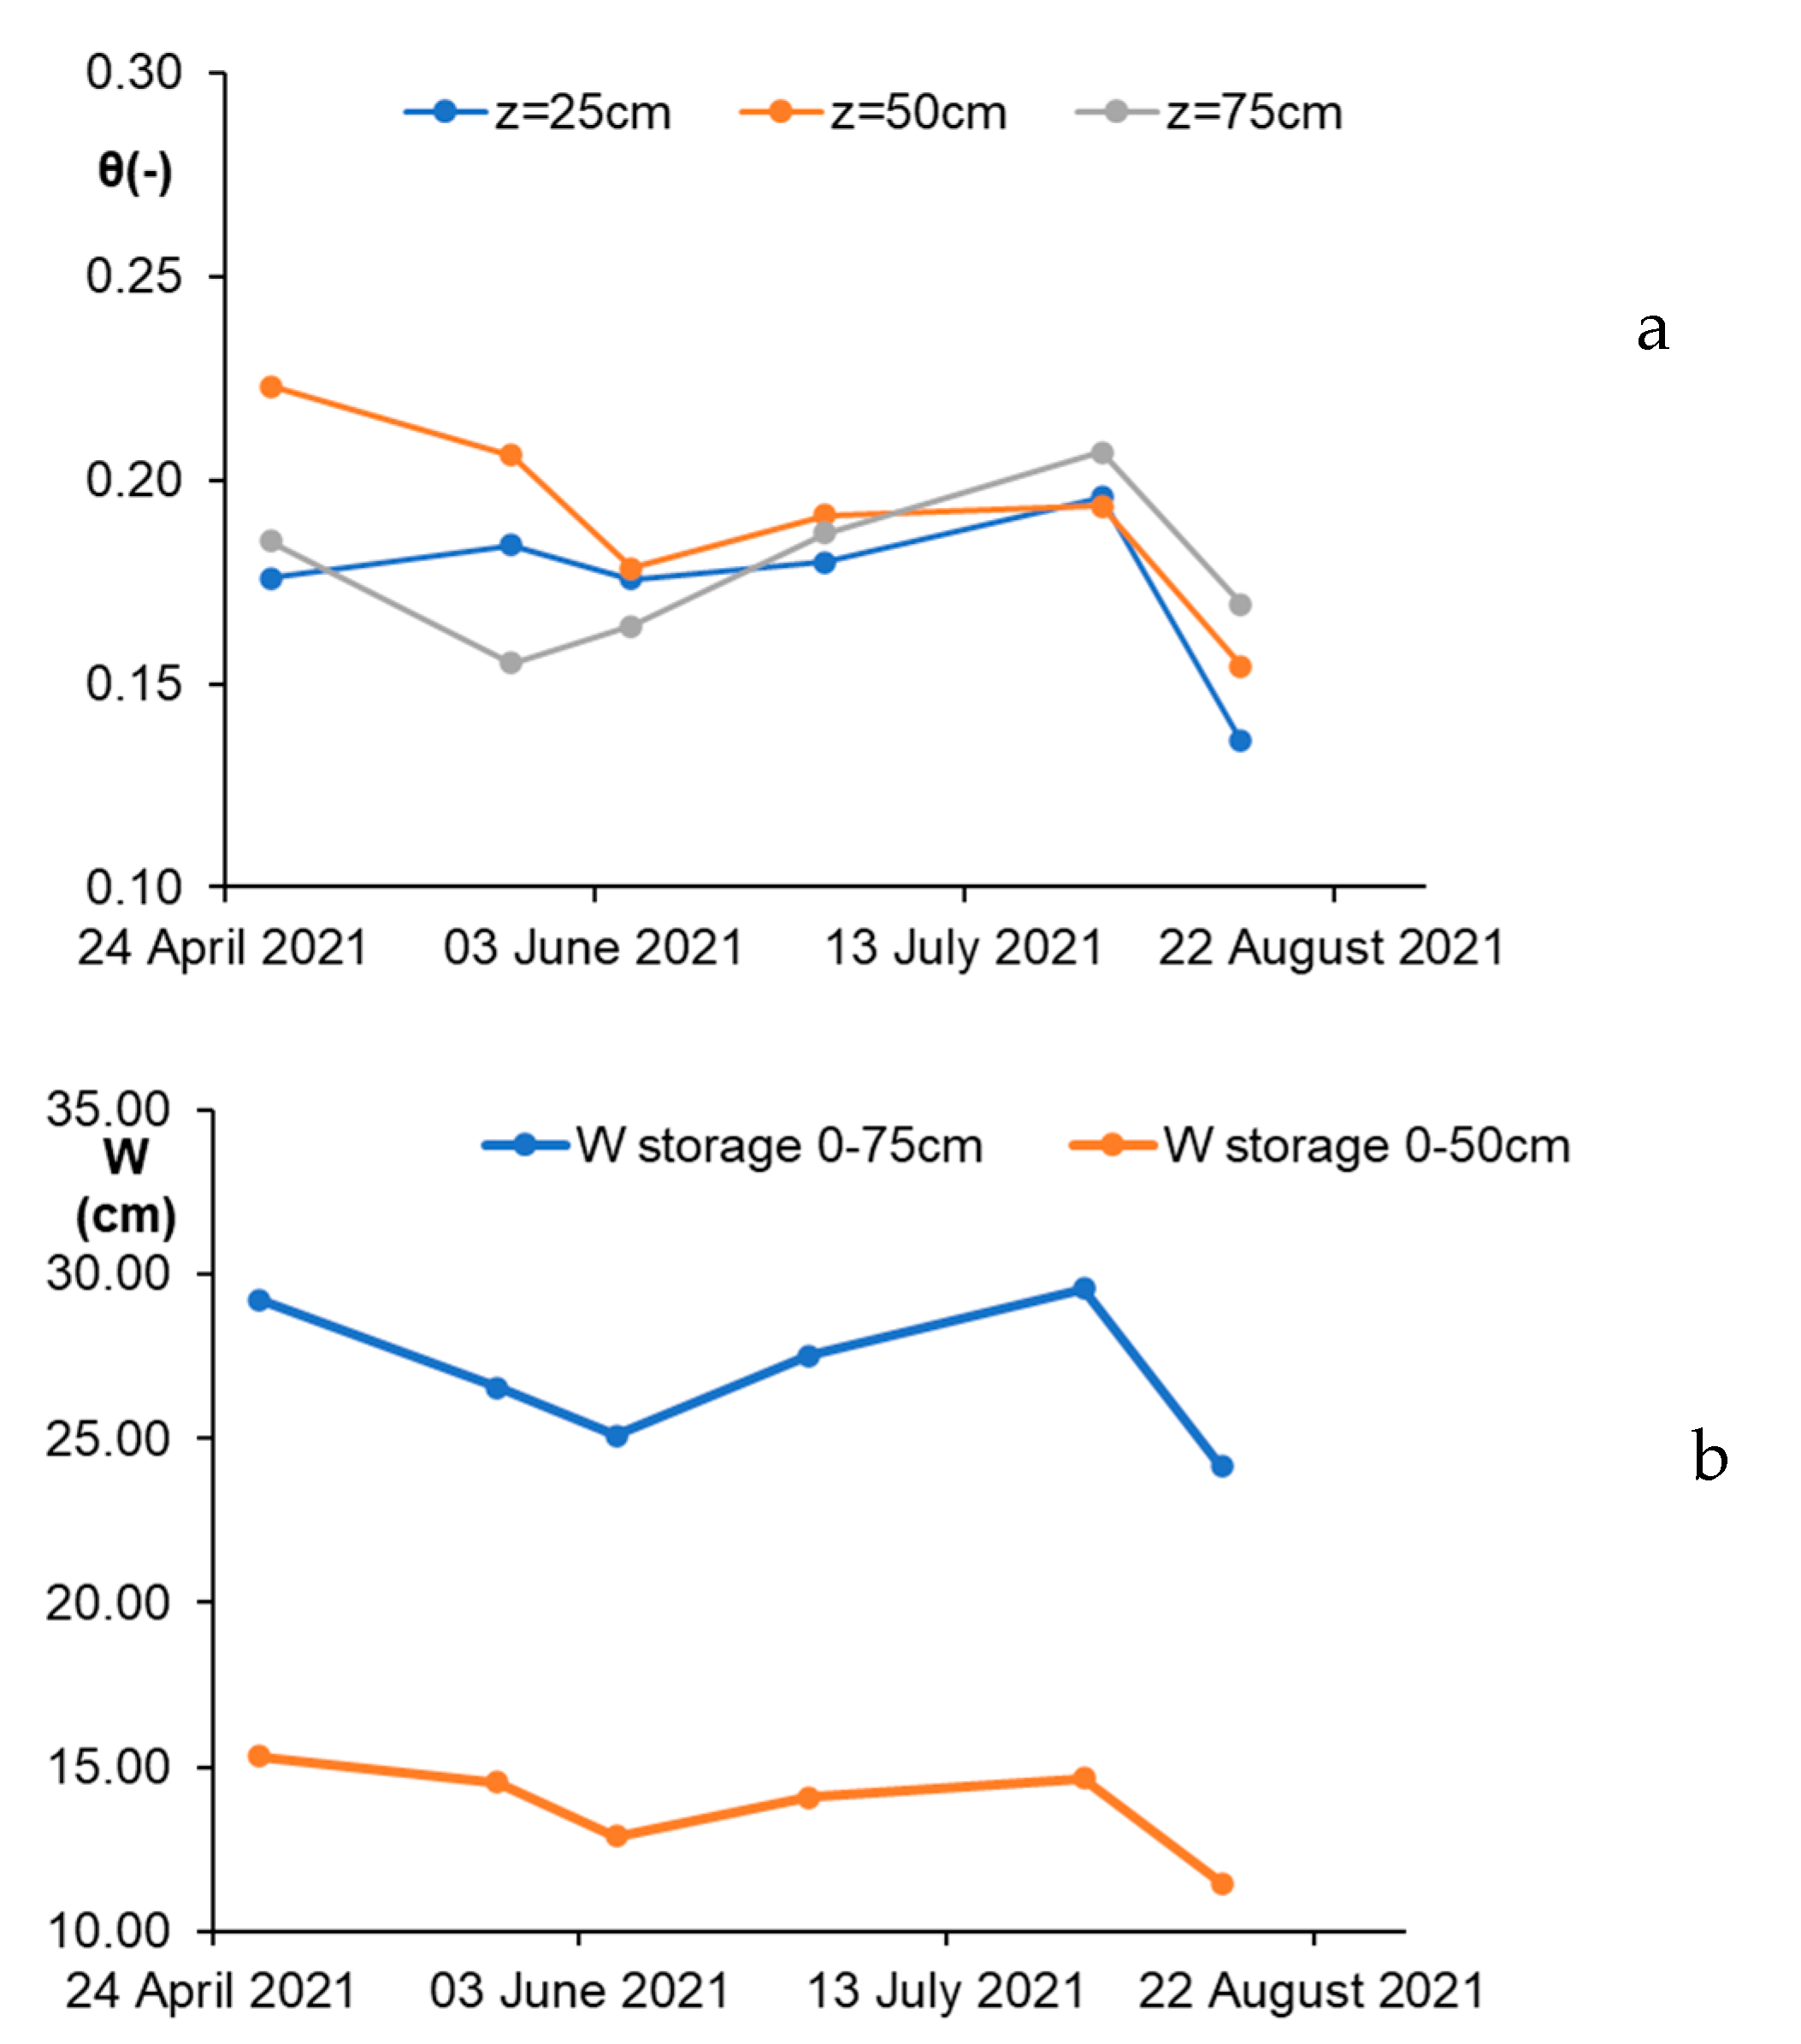
Figure 4 shows the trend of soil water content as per the collected data during the six field campaigns. A fluctuation likely due to a steady sequential TWW irrigation frequency period (every 2–3 days and for 9 months) influencing the soil quality is clearly shown, underlining the relevant impact of the soil hydraulic properties on soil–water dynamics. The case study area, characterized by a fair percentage of clay and loam particles, had a low capacity of the soil to release water. Moreover, the low hydraulic conductivity slows the water movement among and inside the pores, thus affecting the water distribution and availability to the plant. In this regard, the researchers observed that the suspended materials of the TWW, such as salts, can occupy even the spaces surrounding the smaller pores [
60]. This may lead the mesopores to disconnect from the soil matrix, inhibiting any of their contributions to the pore distribution. This relevant soil structure property expresses the amount of water and where the water is distributed. If water is not well allocated among different pore classes, it reduces available water and compromises the roots’ uptake activity. The authors of [
61] showed that the percentage of the soil clay particles and salt content of TWW used for irrigation reduced soil porosity and available water, inducing root uptake stress. In
Figure 4a, the measured water content at the three soil depths shows a slight variability, with values varying between 0.150 and 0.240 and a significant difference observed on 12 August 2021, likely due to the high temperatures recorded in the summer and provoking the quick evaporation of water from the shallow soil layers, without influencing the overall soil water storage (W) 0–75 cm, as shown in
Figure 4b. Moreover, two peaks can be observed in
Figure 4b, with a down-peak recorded on 7 June, showing an overestimation of water demand and greater storage compared to 28 July, where an up-peak likely induced the movement of part of the water below the root zone. This would also explain why a citrus nitrogen deficit was observed; the water storage at 0–50 cm, considered the volume widely explored by active roots, was smaller than that at 0–75 cm. This is due to two main reasons: (1) the roots, while up-taking water, bring salts toward the aerial part of the plant, instigating stress and nutrient deficit over time; (2) the overestimated TWW volumes allow the redistribution of water along the soil profile, not only in the root zone. The low peak recorded on 28 June may be explained by the sequence of TWW irrigation events adopted by the farmer, overestimating the citrus requirements and the fraction of water withheld by the small pores of the clay soil, which is not easily accessible to the plant. It is likely that the water oversupply was redistributed in the deep layers, contributing to the leaching of the salts introduced with TWW through the preferential paths produced by agricultural practices and often manifested in clay soils. This behavior may also be explained by the soil hydraulic conductivity, whose values were collected along the soil profile and are shown in
Table 2. These low values, as discussed above, demonstrate that the soil holds more water in the small pores that are poorly accessible to the plant, causing stress to the roots.
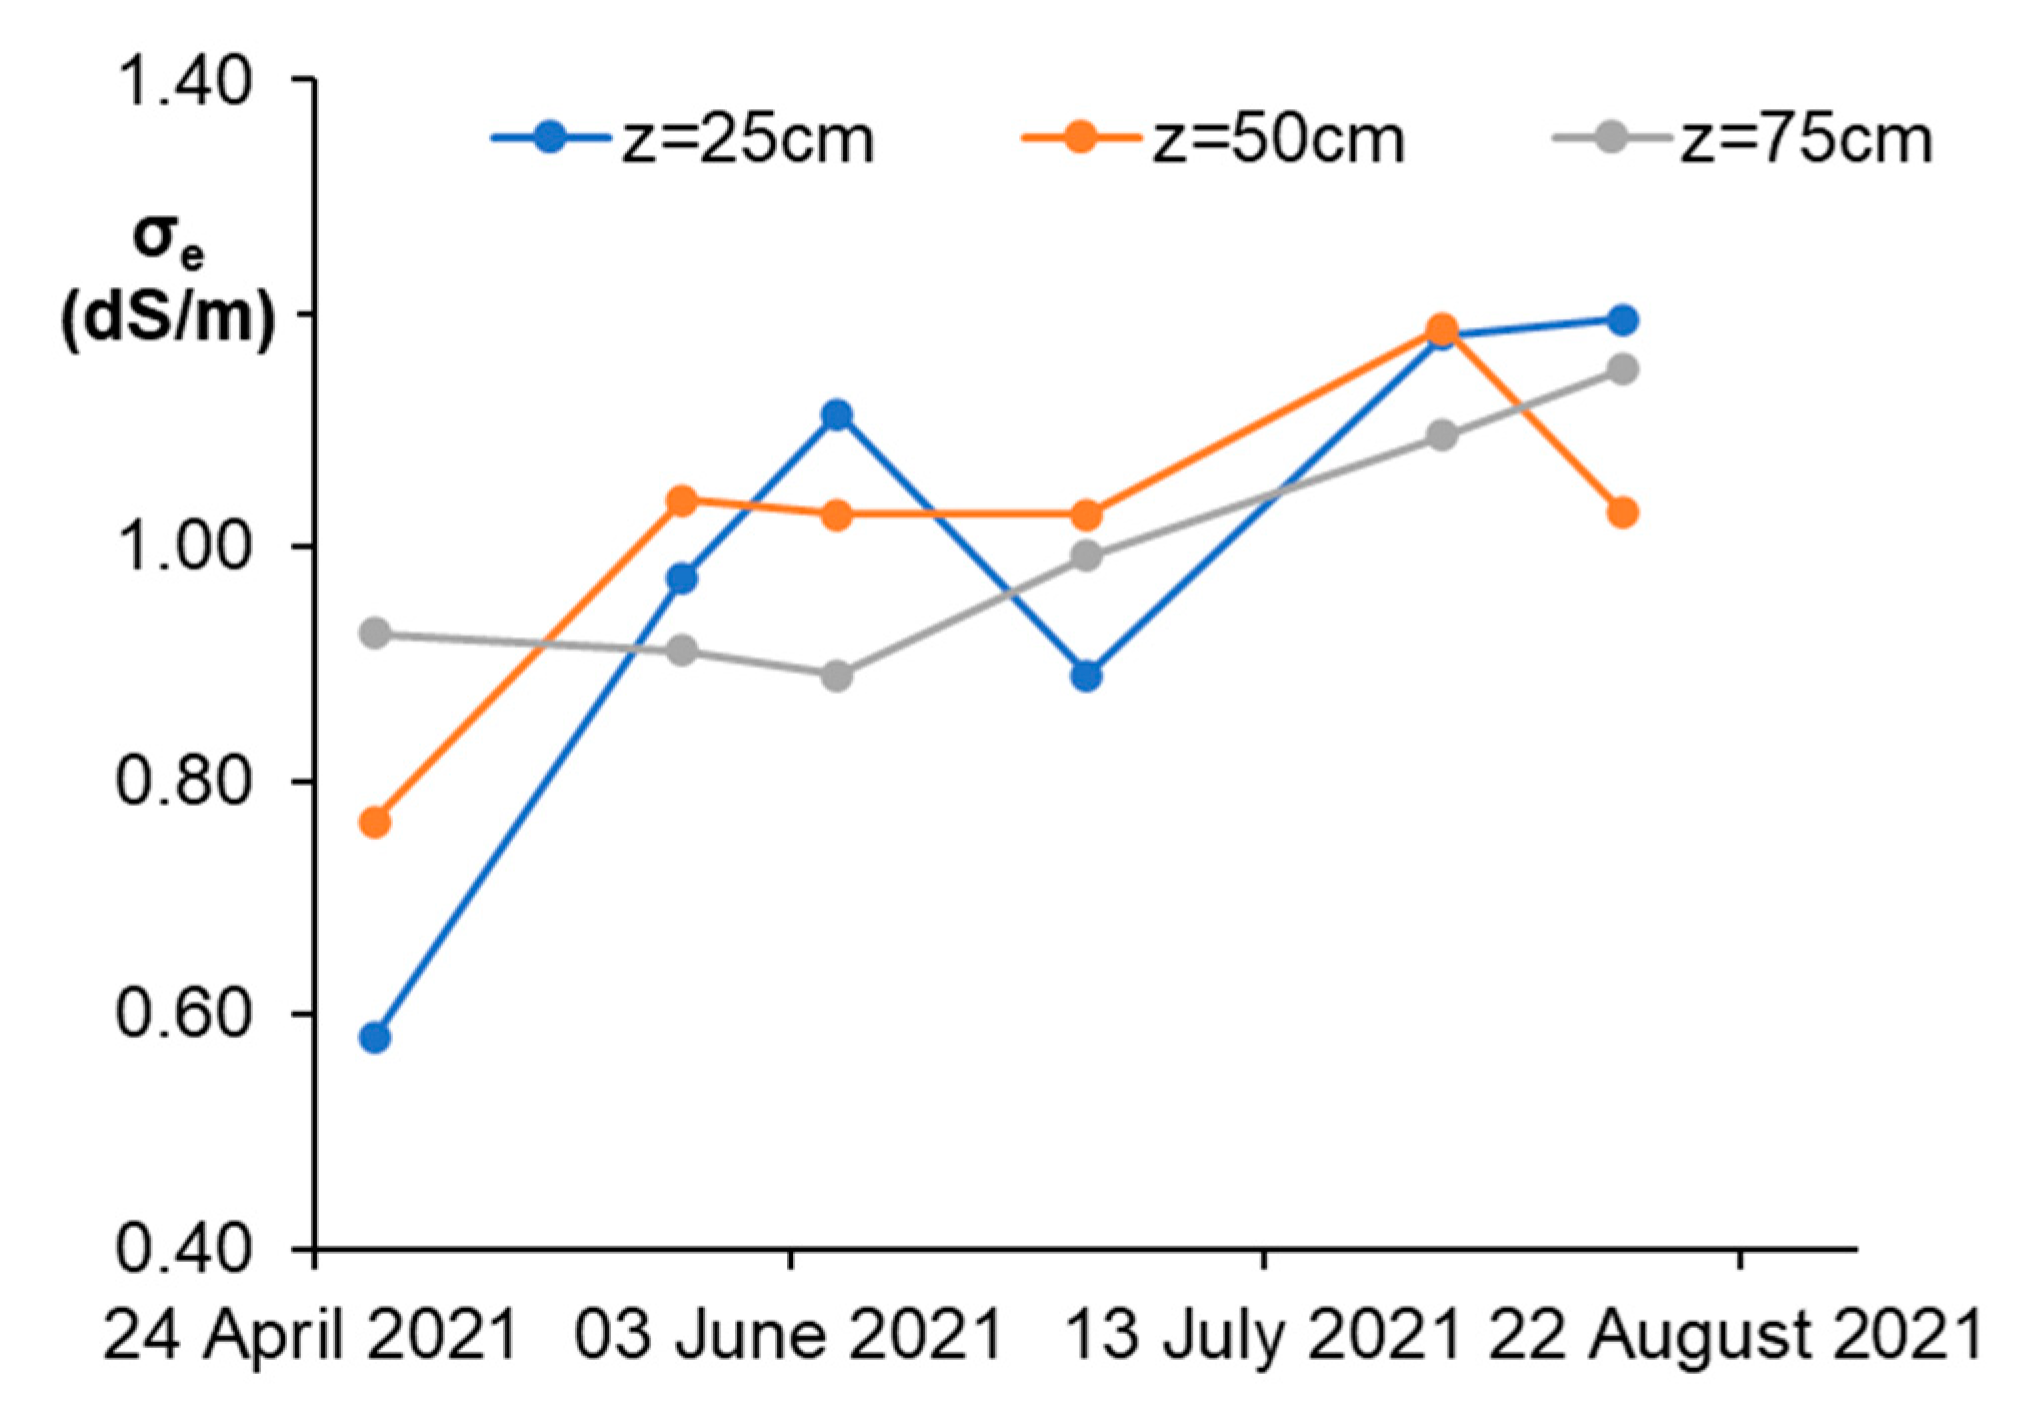
3.1.2. Soil Solution Electrical Conductivity ()
Soil solution
showed a similar trend to the water content (
Figure 5), considering that the salinity measured at three different depths did not show any critical values that may suggest that TWW would have contributed to soil salinity. Soil nitrogen concentrations were within the optimum range. Nevertheless, the low frequency of irrigation events and the high contribution of TWW in terms of ammonium (32 mg L
−1) induced a leaf nitrogen imbalance. The clay particles absorbed part of the ammonium [
62], and another part was subjected to nitrogen transformation processes. This aspect is better discussed later.
Despite the high electrical conductivity of the TWW averaging about 1.90 dS m
−1 (
Table 4), no correspondence was found in soil salinity, suggesting that the water and salt distribution along the soil profile is governed by the soil hydraulic properties. Nitrate, being the available part of nitrogen and moving with the water, may be conveyed below the root zone and leached, partly explaining the nitrogen deficit observed in the leaves (
Table 5).
According to [
63,
64], the salinity risk for citrus is considered high for σ
e values greater than 1.9 dS m
−1, low for values lower than 1.7 dS m
−1, and medium for values ranging between 1.7 and 1.9 dS m
−1. Overall, the nutrient deficit is explained by the simultaneous uptake of water and salt citrus plants, which inevitably induce stress. Therefore, irrigation management with TWW should account for the salt supply and find alternative strategies that do not harm the soil quality or compromise the yield. To this end, the irrigation events’ frequency should be adjusted considering leaf nitrogen and soil salinity; consequently, assessing the soil salinity becomes fundamental.
Refs. [
10,
29], Assouline et al. (2015), and Russo et al. (2015) observed a 20–30% yield drop in citrus cultivated on clay soil, after ten years of TWW irrigation supply. Therefore, resizing the acceptable thresholds of salinity, including the nutrient deficit induced by stress and imposed by TWW is primordial, while improving irrigation management with TWW remains a valid option to control leaf salinity levels.
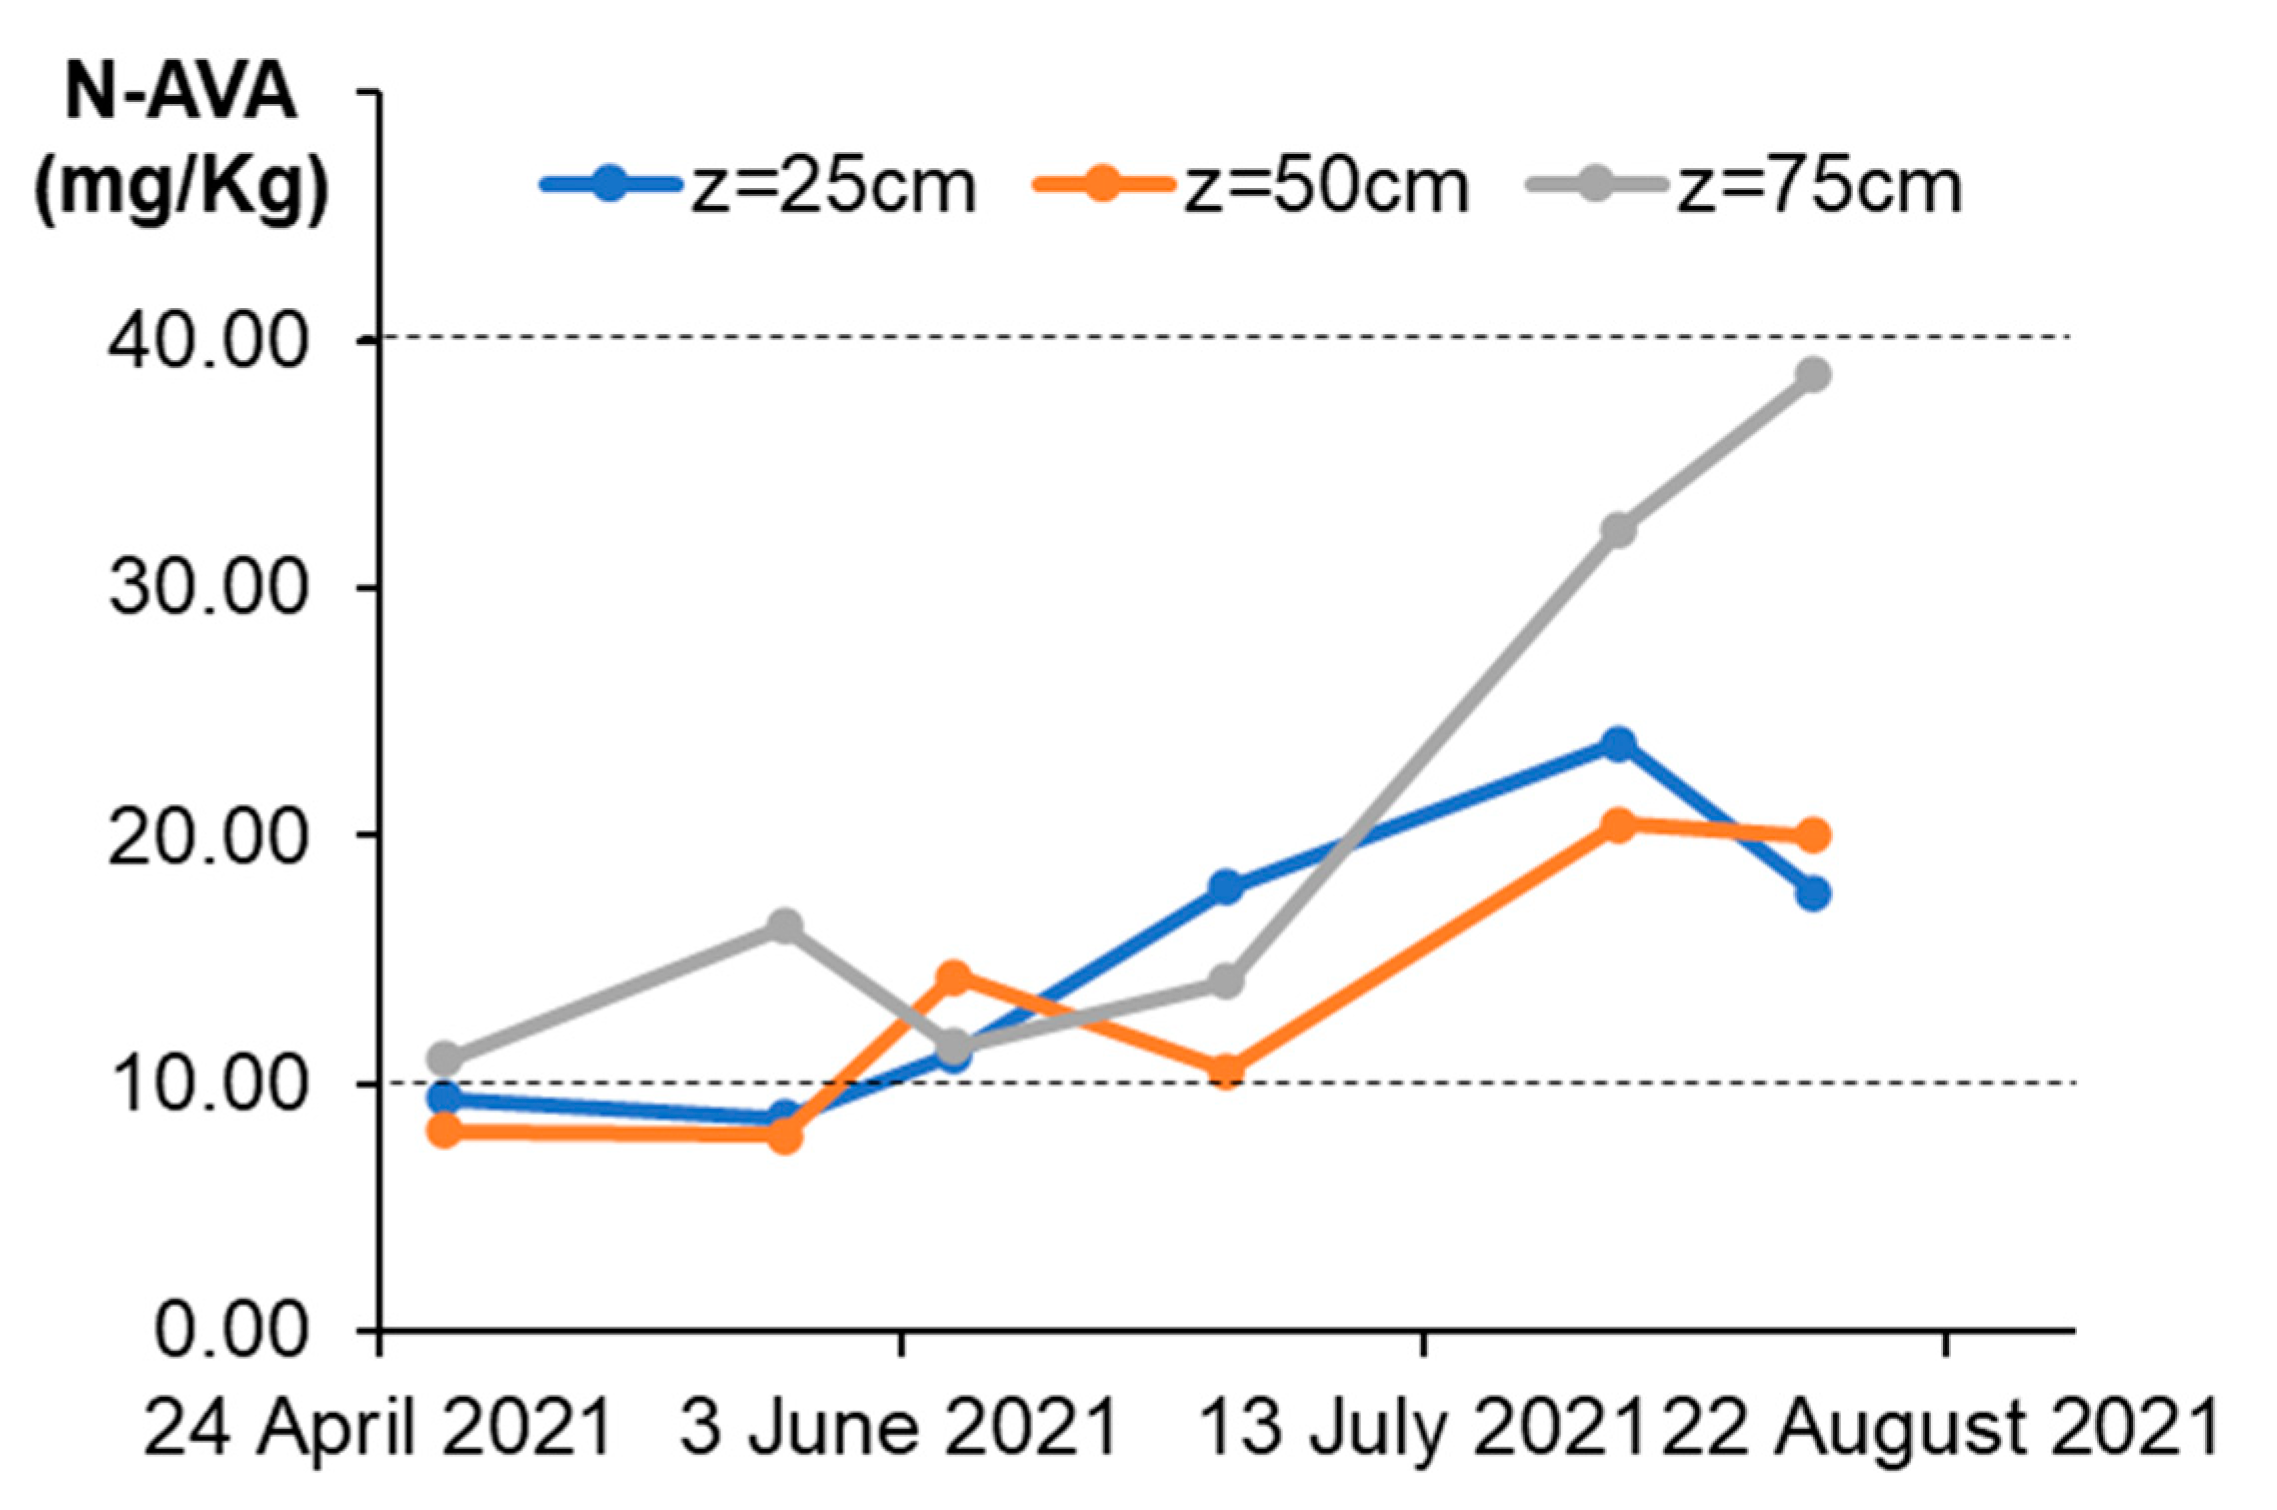
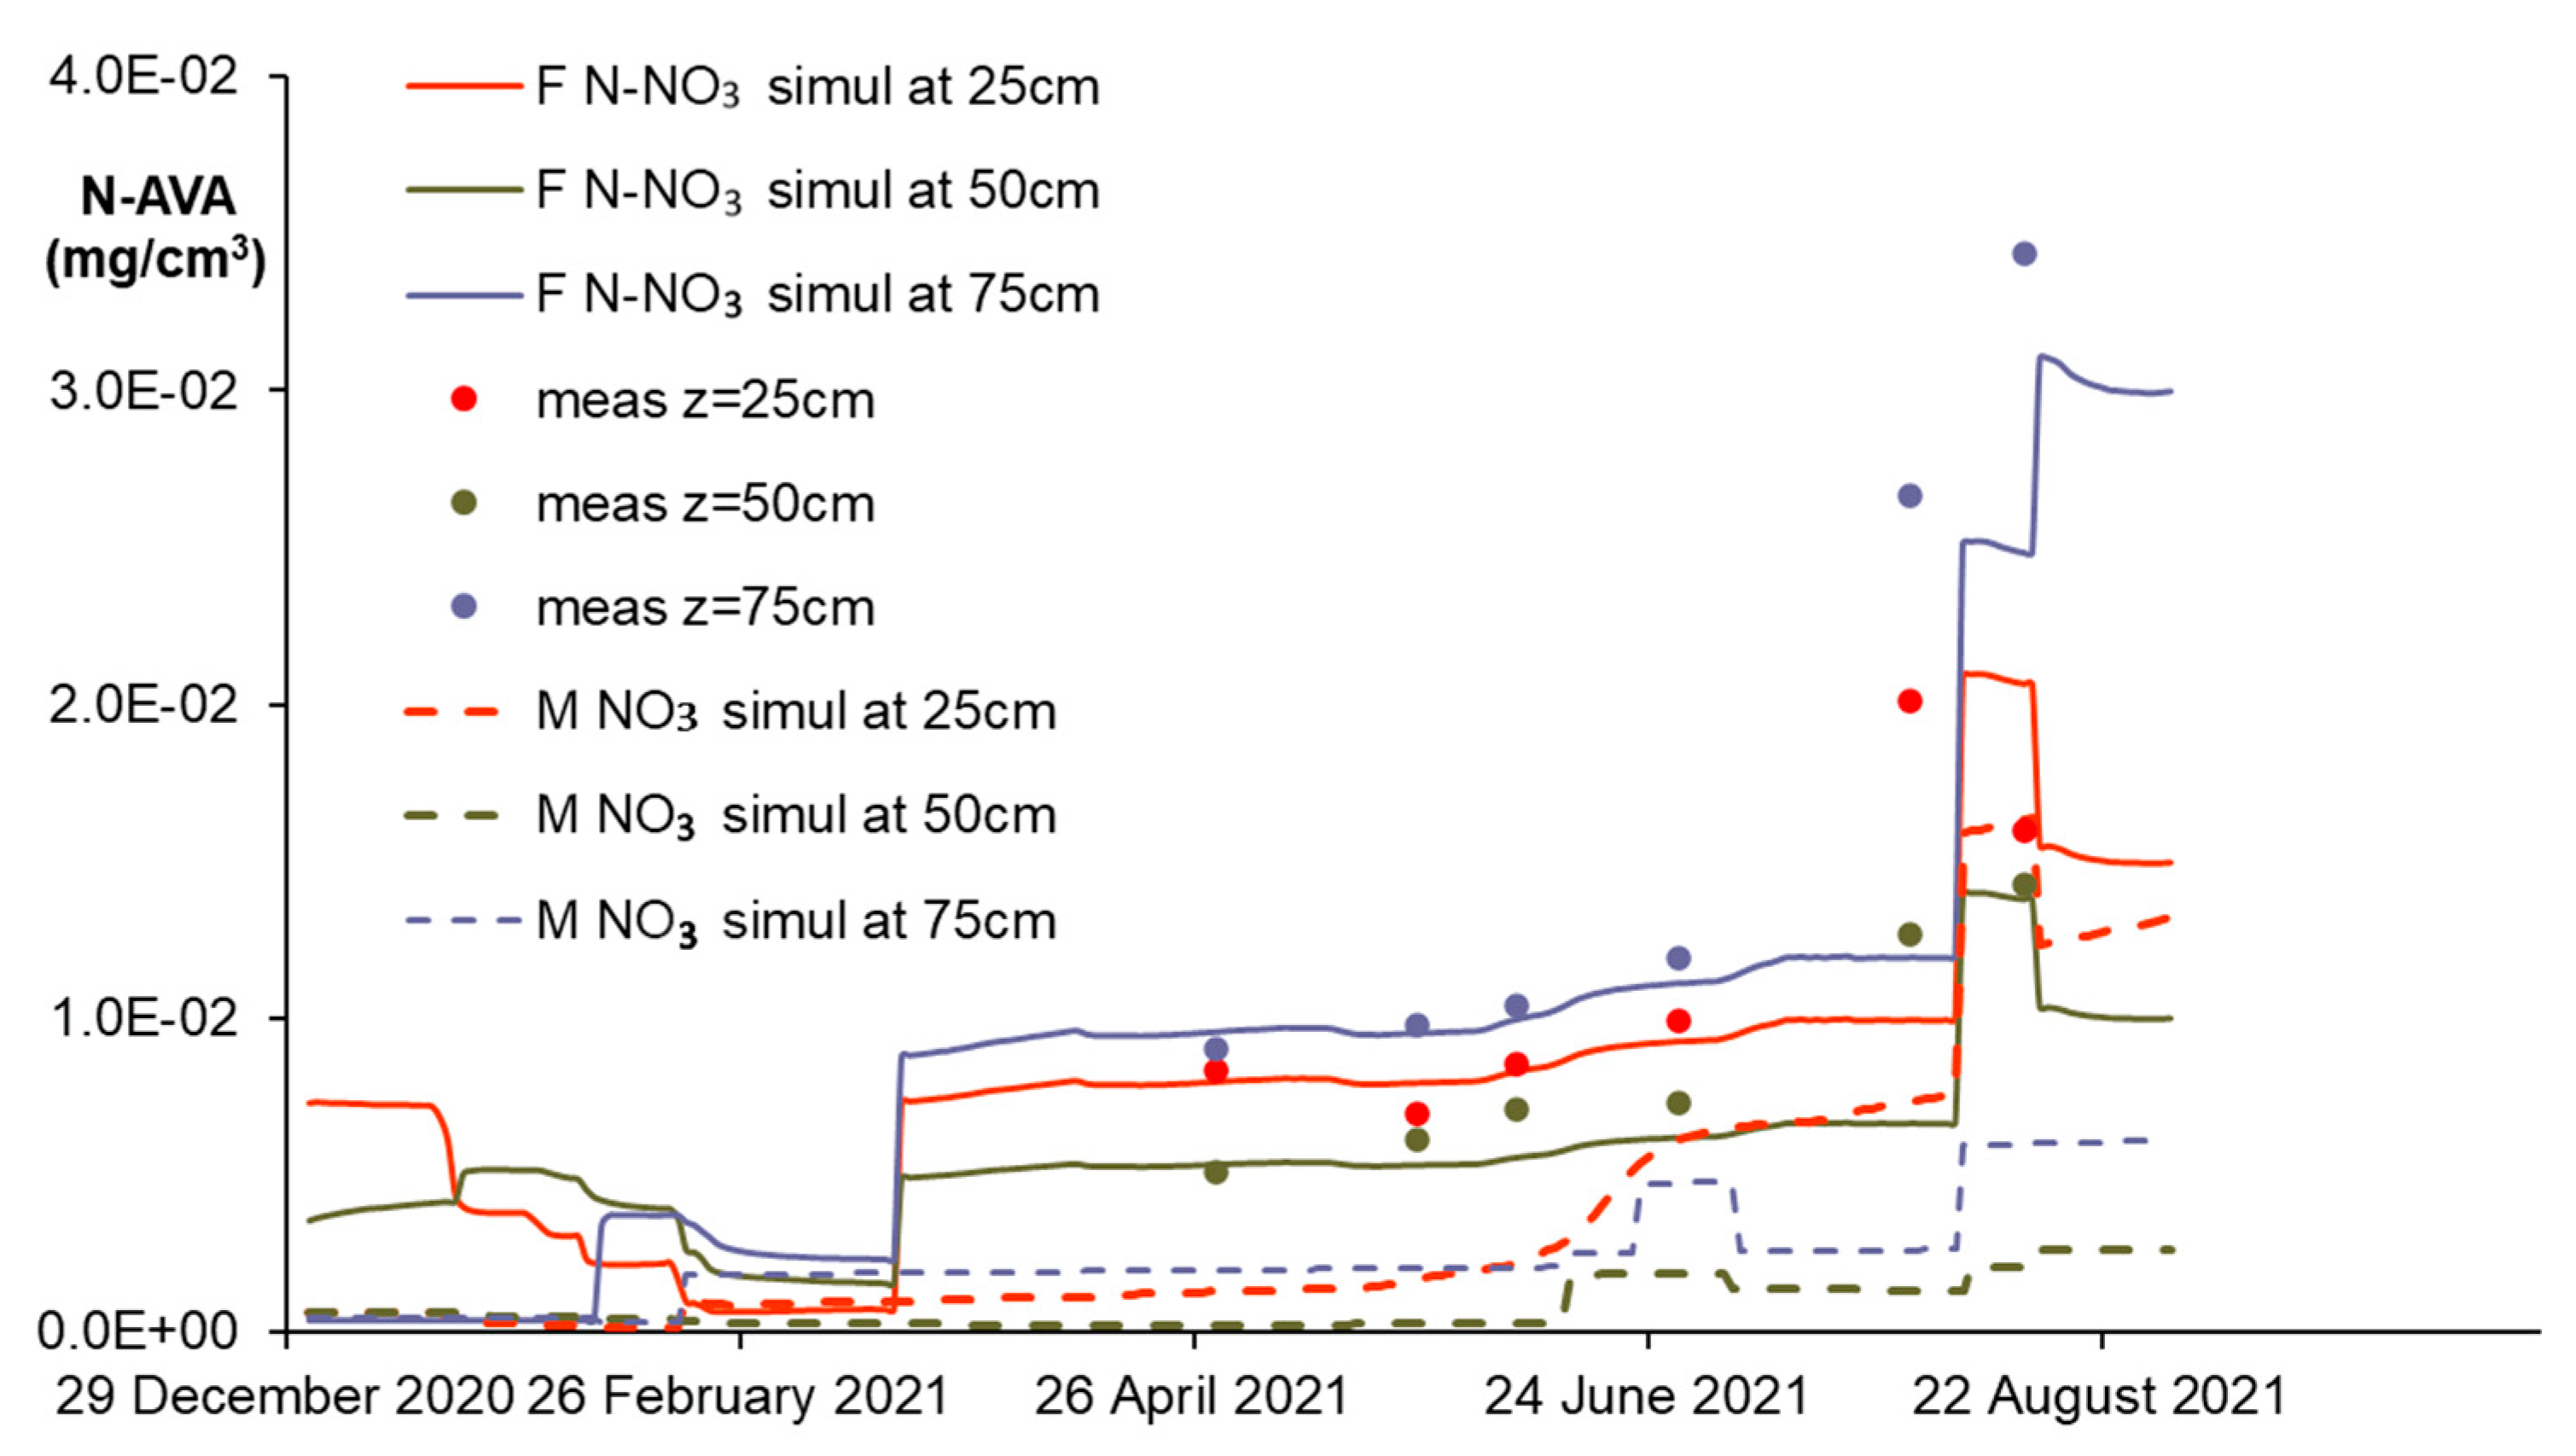
3.1.3. Available Nitrogen ()
Figure 6 shows that
was around 10 mg kg
−1 at the beginning of the monitoring phase, which corresponds to the optimum minimum [
65,
66], and that an increase in N concentration occurred after the sequential TWW irrigation events. Nevertheless, the contribution of TWW was around 1 mg L
−1, while most of the increase was due to the nitrogen–ammonium distributed along the soil profile during the 2021 irrigation season. The observed ammonium levels in the soil were between 4 and 5 mg kg
−1 over time, which is an order of magnitude lower than the nitrate concentrations. This also means that the high ammonium level of TWW (32 mg kg
−1) contributed to the nitrogen transformation processes in the soil [
67]. The salinity stress can be explained by the fact that the salts supplied with TWW induced an osmotic effect that deteriorated the soil’s physical and hydraulic properties [
68] and, in turn, reduced the water uptake and the roots’ activity [
29,
69,
70]. Furthermore, osmotic stress induced the loss of elasticity in roots and thus reduced the uptake of water and nutrients.
Moreover, soil nitrate–nitrogen concentration reached 10 mg kg
−1, a value ranging around the acceptable minimum threshold, in the first half of the irrigation period and for two depths (25 and 50 cm), and then slowly increased and ranged between 15 and 40 mg kg
−1 after 23 June, considering that the optimum threshold range is 10–40 mg kg
−1 under conventional water [
66]. Further experiments on citrus registered levels of total N equal to 1.4% in TWW irrigated soils [
71] that may not be translated into availability to the plant. In fact, another study reported, under the same conditions, higher accumulation of nitrogen (N) only in the soils but not in the leaves [
72].
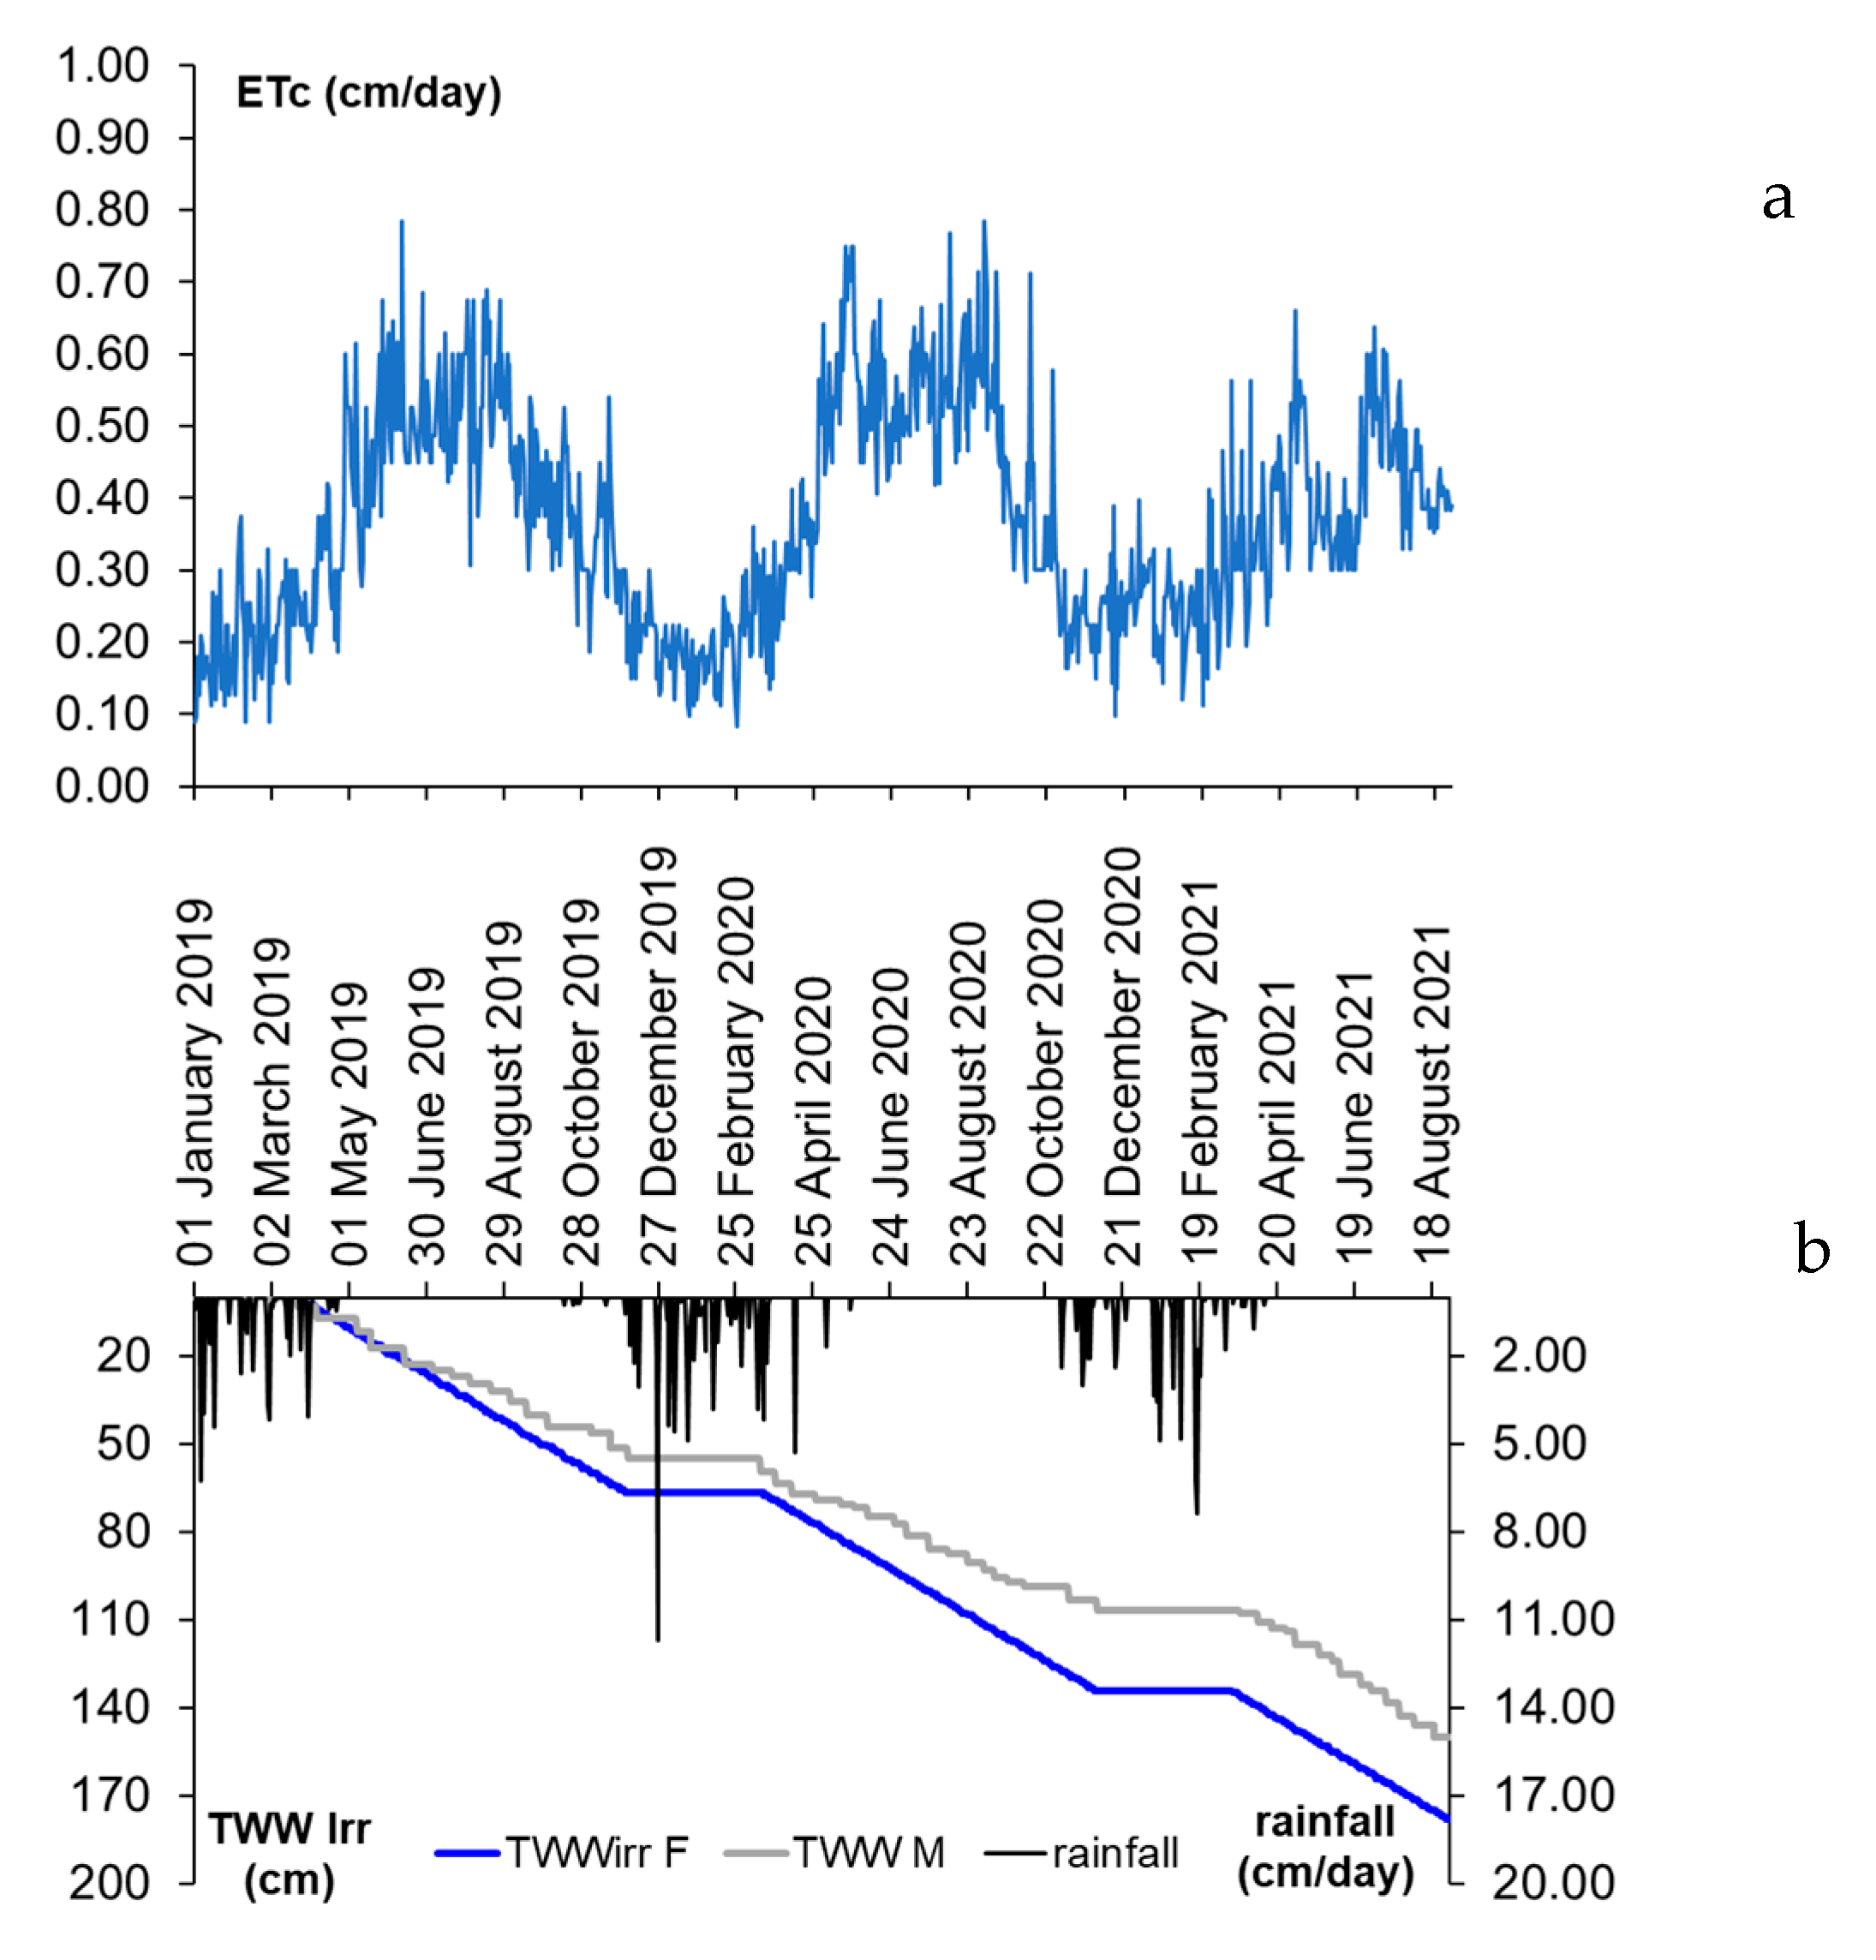
3.2. Simulation Results
To improve the TWW irrigation strategy, simulations were generated based on the soil quality measurements carried out in 2021. Two runs were performed to compare the farmer’s irrigation schedule (three times per week) (F) and the model demand (M). By weighing the water and salt supply and adjusting the irrigation frequency, (M) could also improve the leaf nitrogen content that reached acceptable values.
The two graphs in
Figure 7a,b show the trend of upward (
) and downward (TWW supply and rainfall) fluxes during three irrigation seasons.
, and rainfall, were input data to the model, while the cumulative TWW irrigation volumes were calculated for both (F) and (M). It is evident how the irrigation frequency set by the model slightly reduced the amount of TWW supplied. The cumulative volume of supplied TWW was reduced by 15% compared to (F) during the three irrigation seasons (2019–2021).
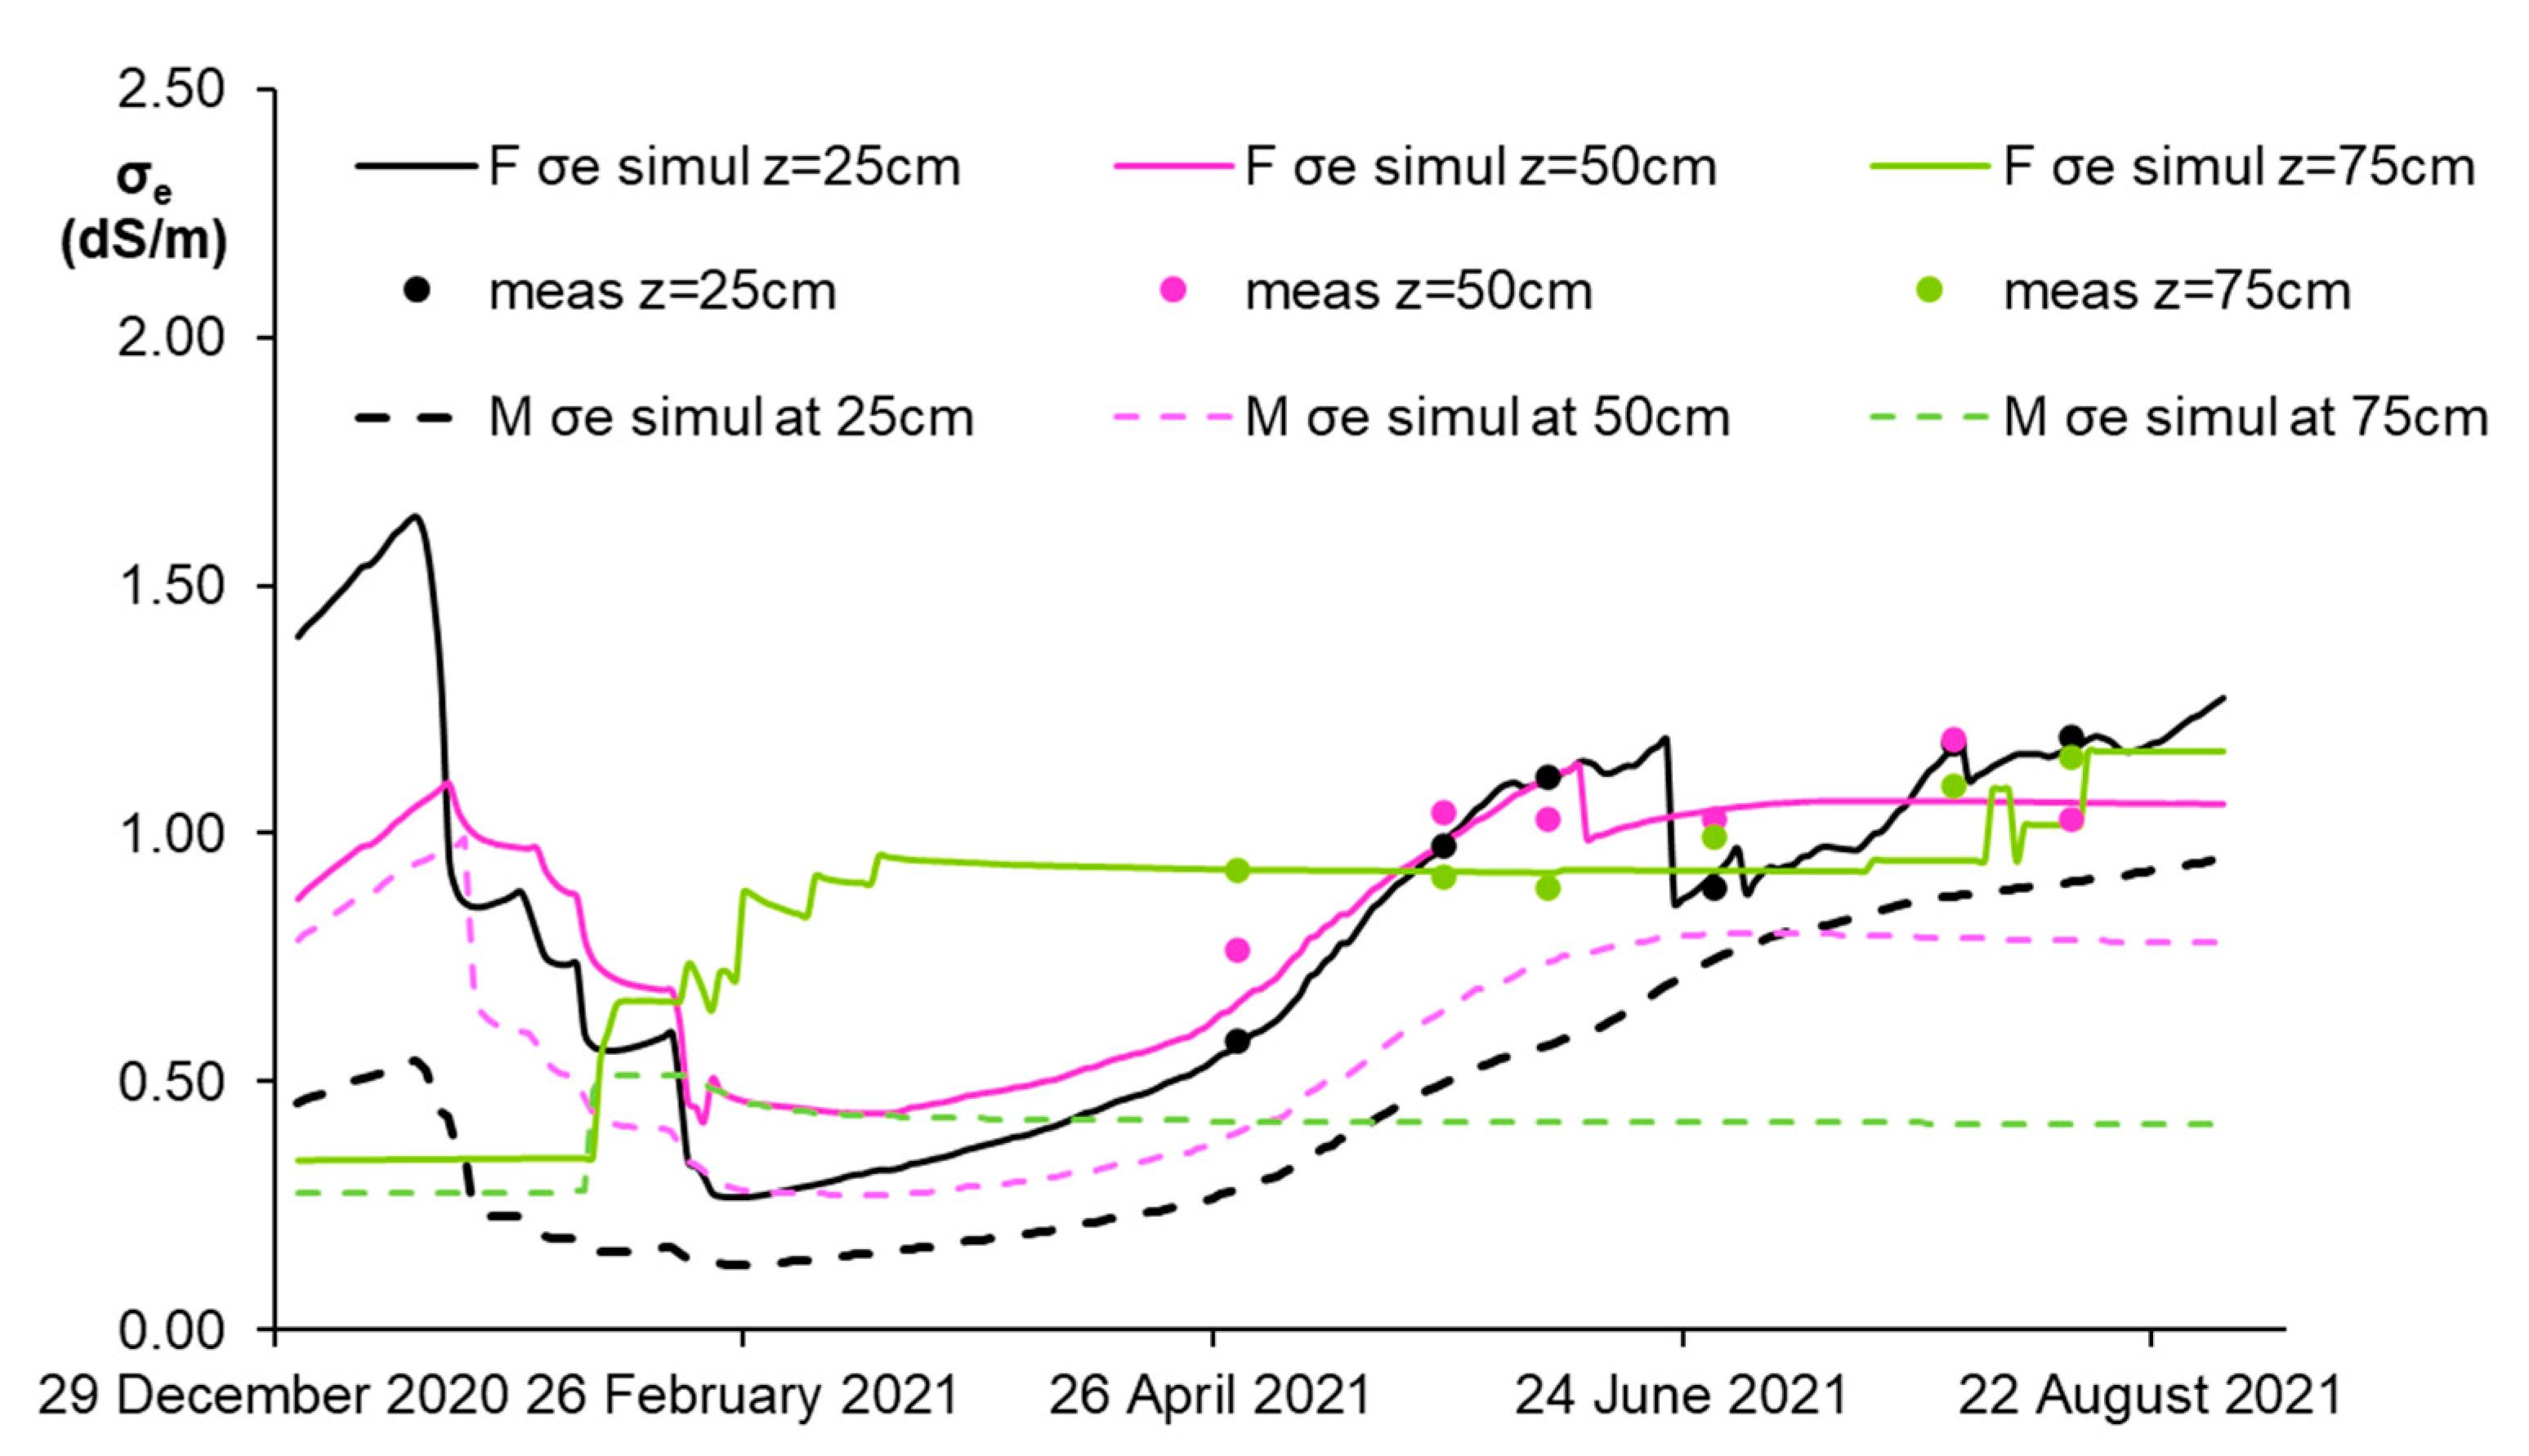
3.3. Comparison between Measured and Simulated Outputs
The simulated water content, the concentration of available nitrogen
and the soil solution,
, at 25, 50, and 75 cm depths were compared with the measured data and are illustrated in
Figure 8,
Figure 9,
Figure 10 and
Figure 11. The field campaigns from 29 April to 12 August 2021 were used to calibrate the model and retrieve the evolution of water and nitrate fluxes where no measured data were available.
Soil water content and soil solution : The simulation closely matched the measured local values, but at the deep layer (50 and 75 cm), the values were underestimated by the model that smoothed the local soil variabilities at each site.
The nitrogen root uptake calculated by the model was assumed to be equal to that of LNC. Accordingly, (M) shows better LNC (
Table 5) and
values compared to (F) (
Figure 9), which ranges around 2 dS m
−1. Even though this value is acceptable, it is not enough to assess the adequacy of the farmer’s management (
Figure 10). It is a point measurement that cannot provide an overall indication of the combined processes and their impact on the soil and crop quality. The measured nitrogen concentrations showed unbalanced plant nitrogen, although the nitrogen available in the soil was within an optimum threshold range.
The leaf nitrogen analyses showed a nutrient deficiency since the values were below 1.0%. This demonstrates that the plant nutrient deficit is not recoverable and cannot be compared with the optimum values proposed for citrus under conventional water conditions, ranging between 2.1 and 2.4% [
73]. This range was not verified under TWW irrigation management, which induces, in the long run, stress hardly improvable even with subsequent proper management due to the hysteresis effect that characterizes the roots [
74]. Other studies reported higher leaf N concentrations in citrus plants (2.8–3.0%) due to an imbalanced supply with sequential TWW irrigation events [
75].
Figure 11 compares the trend of available nitrogen (
) in the two scenarios F and M, and clearly shows that an acceptable nitrogen concentration in the soil does not imply its immediate availability for root uptake. The soil–water interactions, the soil hydraulic characteristics, and the overestimated TWW supply reduced the roots’ elasticity and, thus, their uptake capacity. These parameters and processes were mainly caused by the salts introduced with TWW continuous irrigation events, which may be partly conveyed below the root zone, generating deep percolation fluxes.
Under scenario (F), the
trend was acceptable, but since citrus experienced a long stand and improper TWW irrigation management, the capability of roots to uptake nitrogen was significantly reduced, rendering it often unavailable to the crop. Moreover, most of the water is held in the small pores, requiring excessive energy from the roots to be taken up. Consequently, part of the nitrogen available in the nitrate form may be leached, and only a small portion is kept in the shallow soil layers (0–35 cm), even though less available to the plant, with water being mostly distributed in the small pores. The authors of [
61] state that these mechanisms reduce soil porosity and hydraulic conductivity, decreasing soil infiltration. In [
76], it was also reported that using TWW in agriculture decreased soil infiltration after 4 years, accompanied by macropore reduction. Moreover, the suspended solids in the TWW reduce the soil infiltration capacity as they replace water and occupy the soil pores [
70].
(M) suggests an adequate TWW irrigation management, orientating the simulations to real field conditions, where citrus has experienced a nutrient deficit under stress conditions, as shown by the observed low leaf nitrogen values in
Table 5. Since stress is almost irreversible, modulation of the threshold values for irrigation with conventional water is necessary. In fact, (M), which accounts for stress conditions, shows leaf nitrogen values lower than the ones observed with conventional methods.
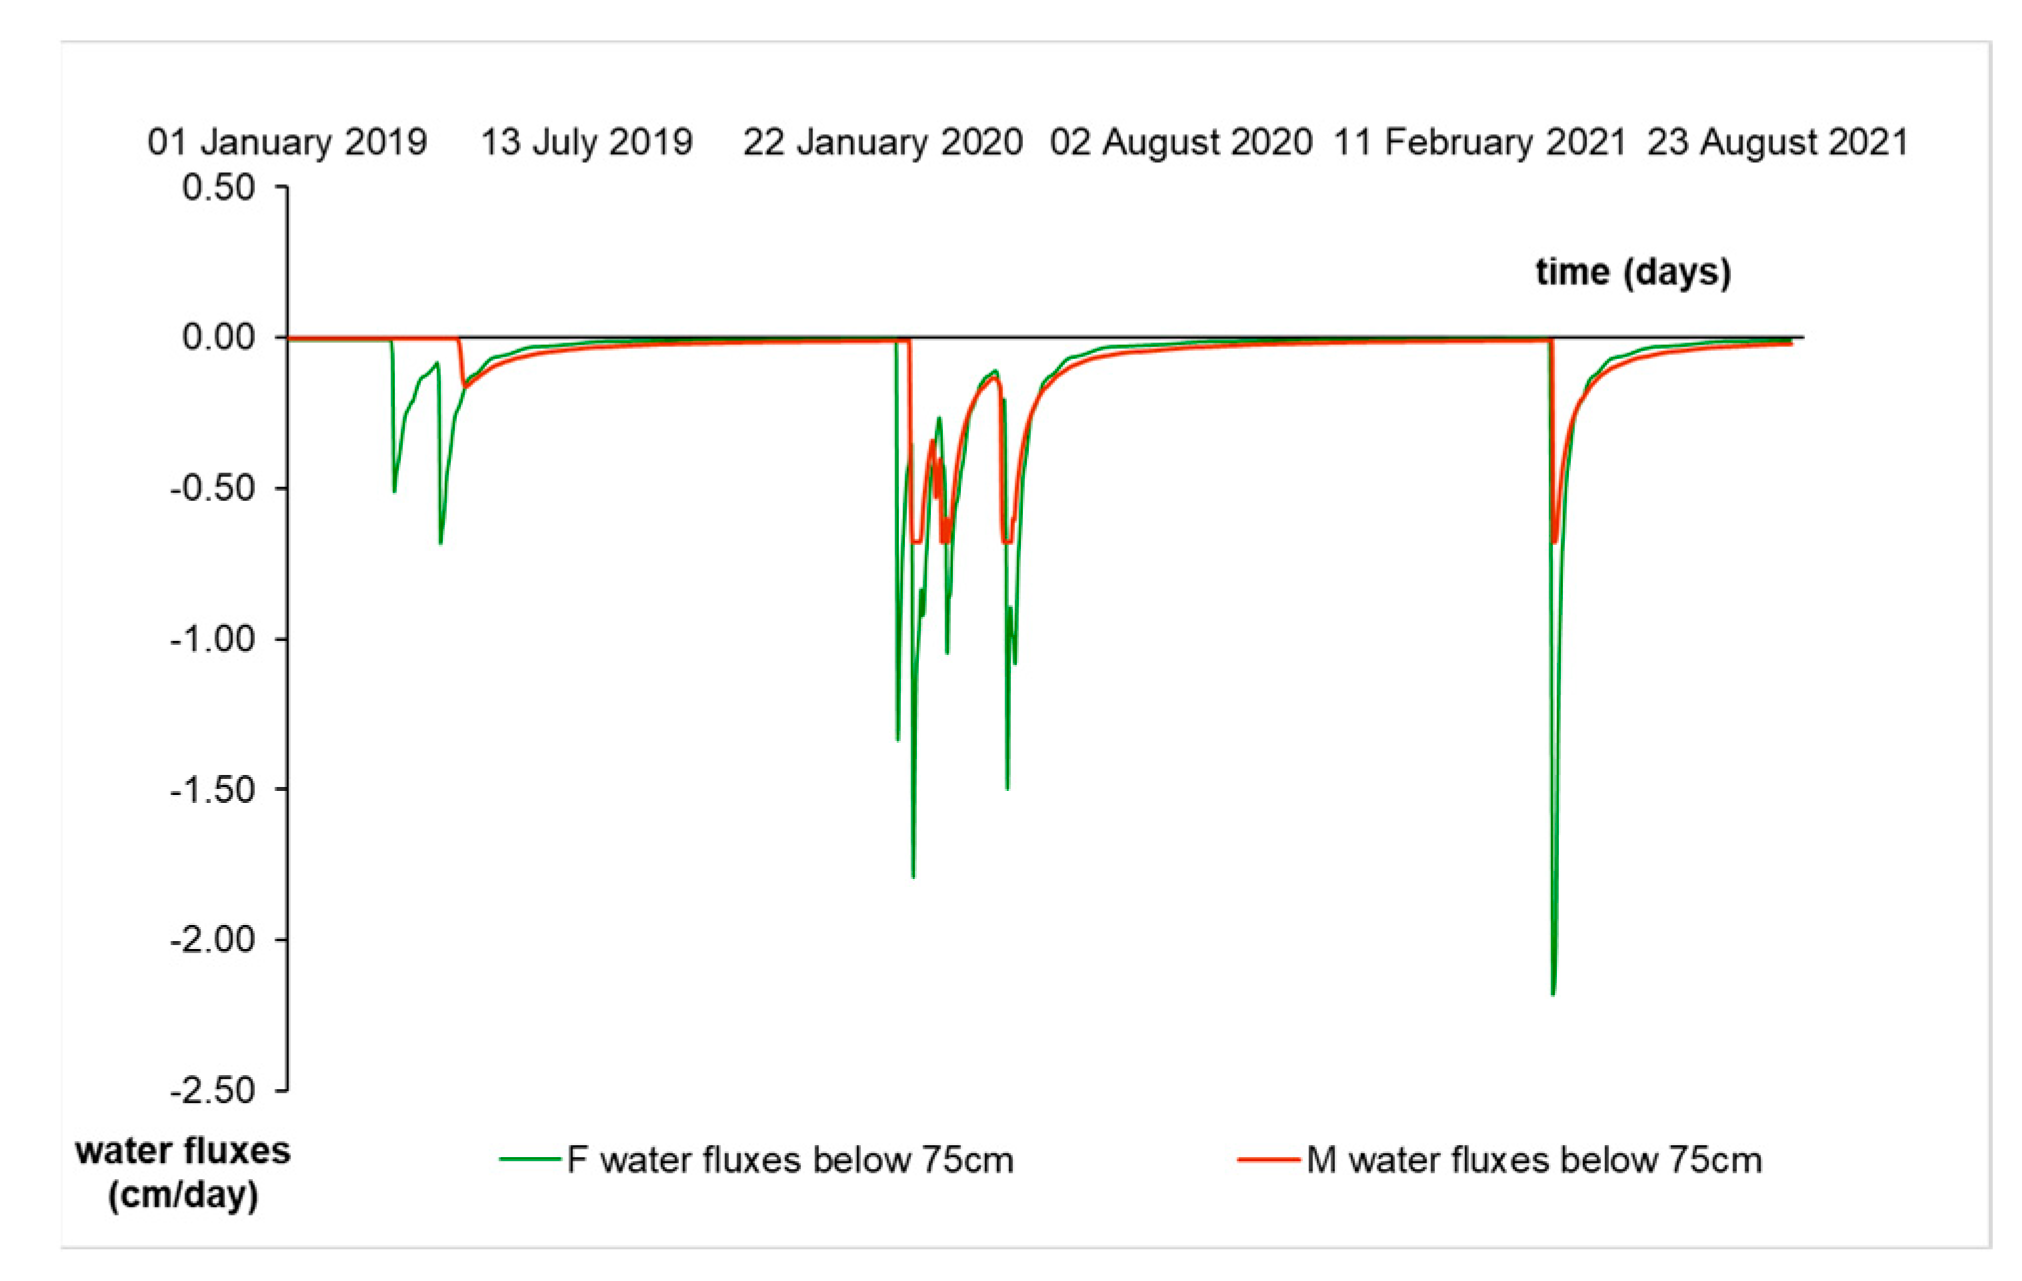
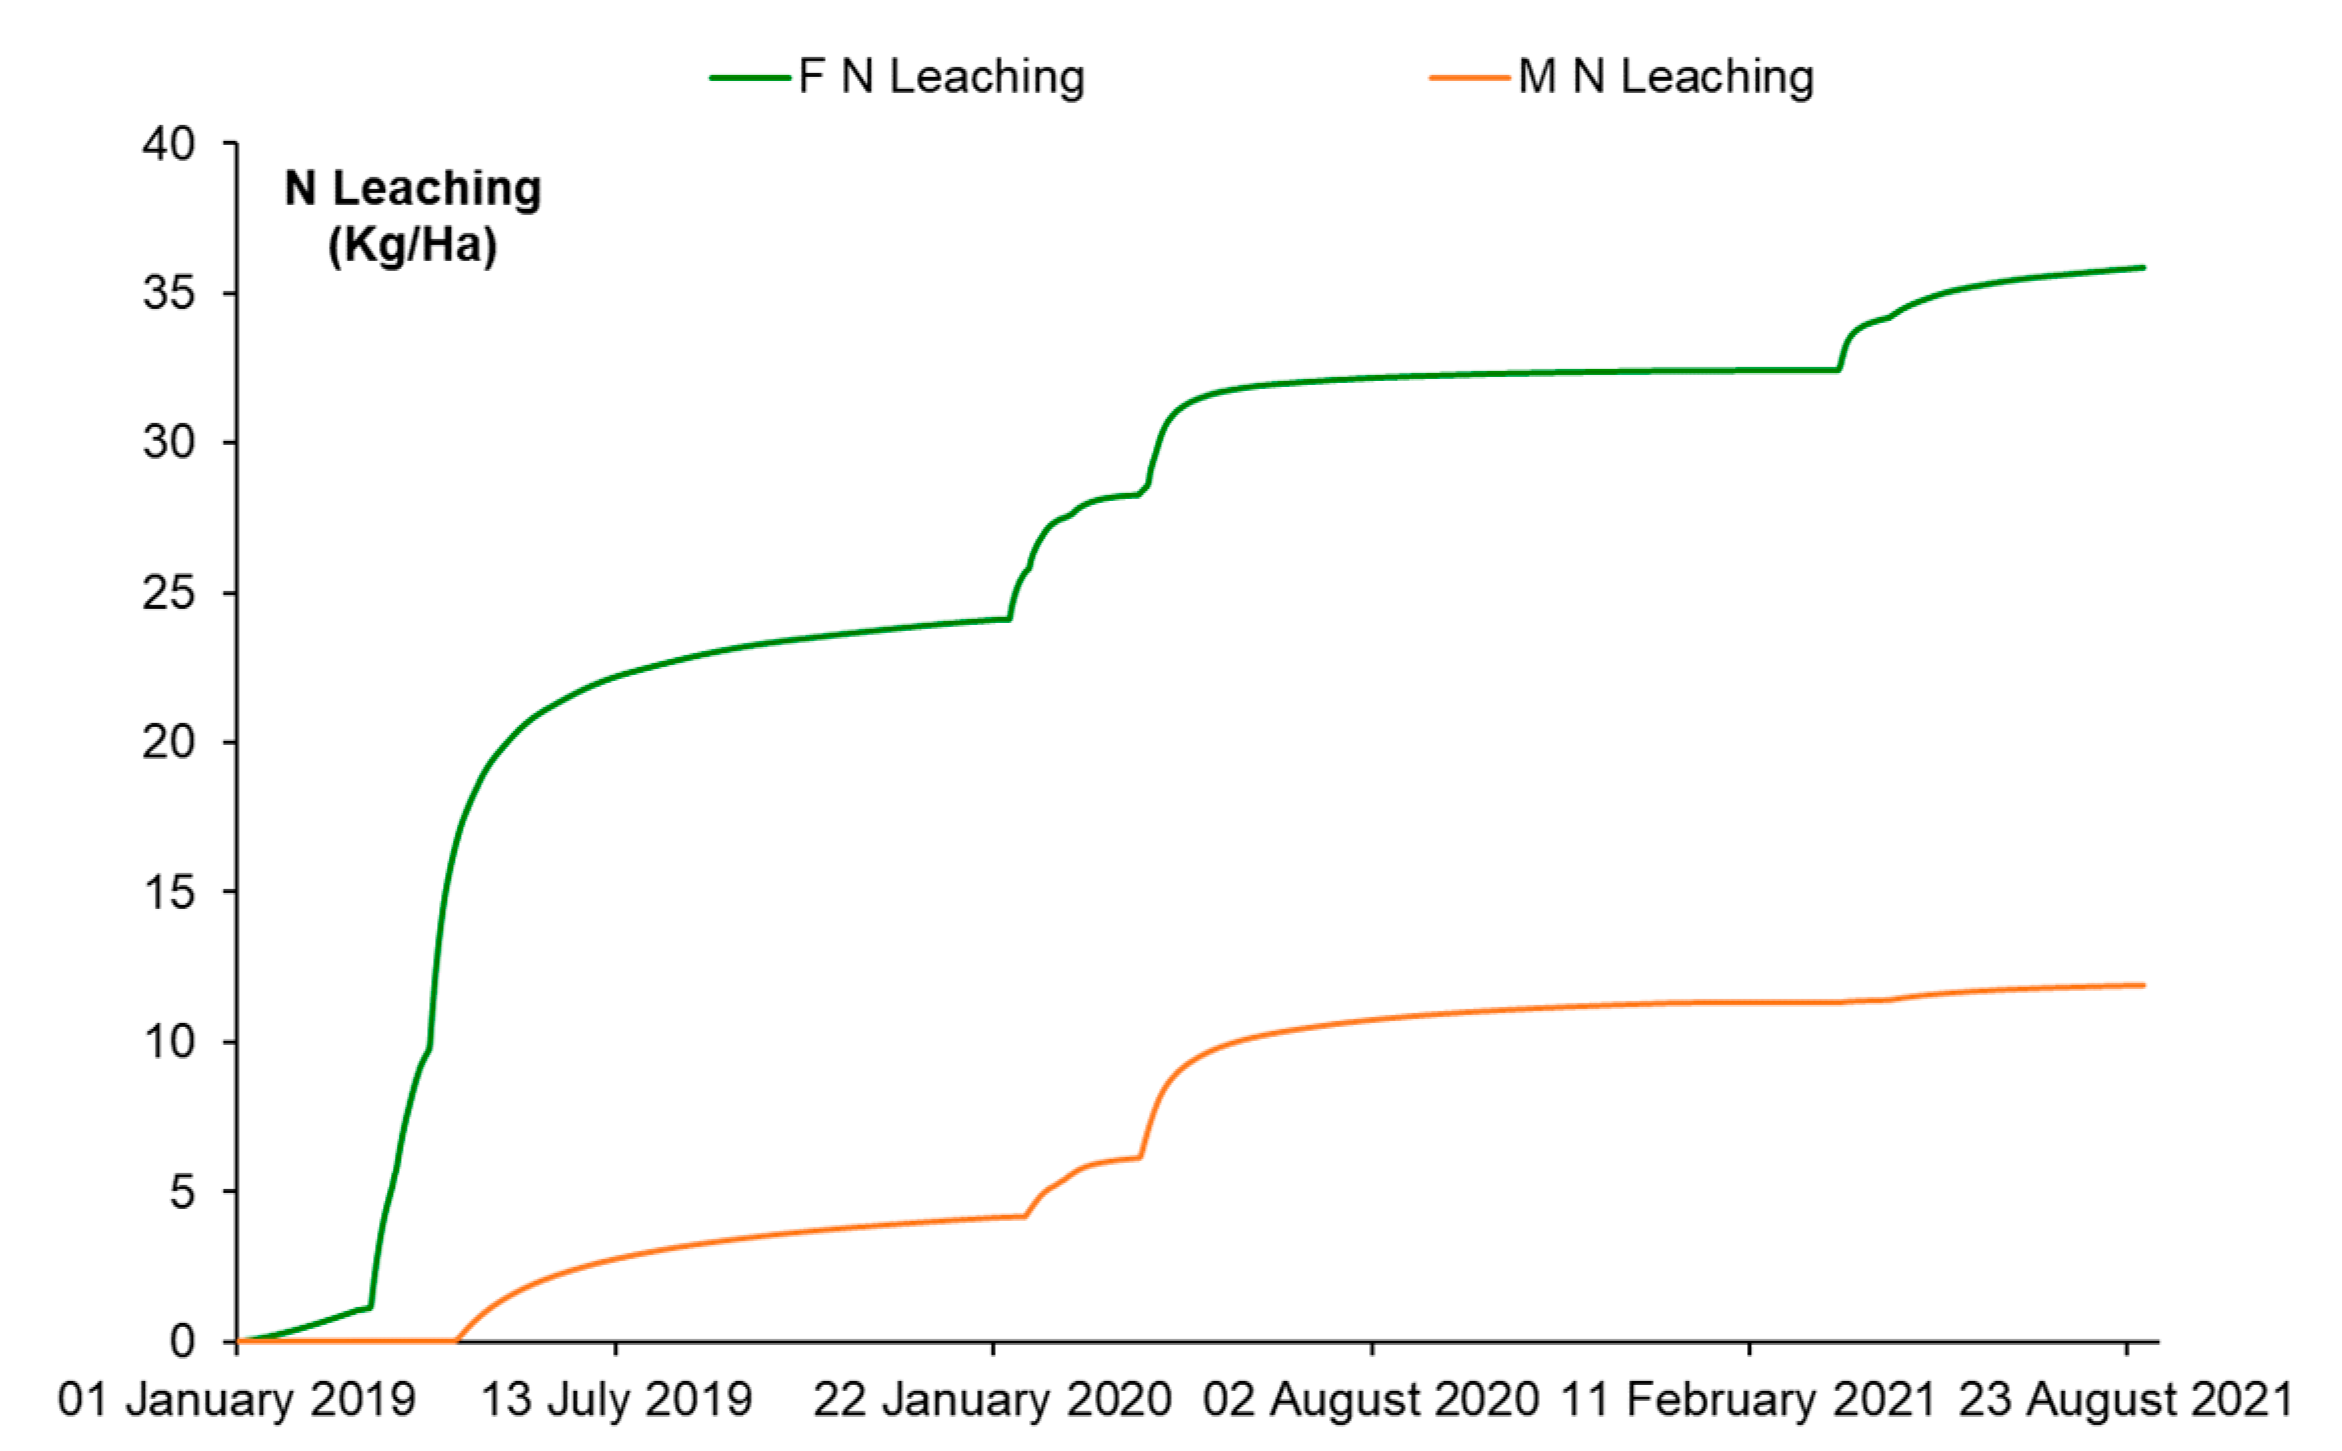
3.4. Water Fluxes below the Root Zone
The water fluxes below the root zone (at 75 cm), simulated according to the (M) scenario (
Figure 12), show how the management imposed by the model reduced the potential downward fluxes and nitrate leaching compared to (F) management that overestimated TWW requirements and contributed to reducing nitrogen, potentially promoting leaching.
Assuming that these fluxes represent the deep percolation (
Figure 13) and that, at the considered depth, root activity is low and, therefore, nitrate abandons the root zone, the nitrate leaching,
, can be computed at 75 cm following (Equation (9)).
where
is the water flux and
the nitrate concentration at 75 cm depth.
The overestimation of TWW supply volumes observed under the farmer management induced an equal to 33% (35 kg ha−1) compared to the scenario (M) (12 kg ha−1). This result demonstrates how the frequency of TWW irrigation events and the correlated soil hydraulic properties influence the movement of water and salt.
In summary, to curb the environmental impacts, the irrigation management with TWW should simultaneously consider soil and water quality and the citrus nitrogen deficit induced by the long-term use of TWW.
3.5. Model Testing
The model was evaluated by comparing the simulated and measured values over time and at three depths. Statistical analysis was performed, and the average error (), the root mean square error (), and the modeling efficiency expressed by the Nash–Sutcliffe criterion () in terms of water content and available nitrogen were calculated.
is the average difference between the simulated and the measured values, which may be affected by a positive or negative sign, indicating whether the model overestimates or underestimates a certain output. The
is a statistical index that calculates the mean difference between the simulated and observed data. In an ideal situation, the
should be nil, indicating that the model estimates have the highest possible accuracy. As for the Nash-Sutcliffe criterion (
), a value of one indicates the complete conformity of the simulated and observed data [
77].
The average error and root mean square error were calculated as follows:
The Nash–Sutcliffe efficiency is defined as follows:
where
is the number of observations,
is the average of the observed values, and
and
are the simulated and measured values, respectively [
78].
Table 6 summarizes the statistical analysis for the model evaluation, which demonstrates a good correlation between the model outputs and the field data. The
values are very close to 1, whereas the
and
values are close to zero [
79].
The performance of the Hydrus model is satisfactory, especially at depths of 0–25 cm and 50–75 cm, and the efficiency indexes demonstrate the goodness of statistical fit and the accuracy of the model for the soil water and salt processes.
4. Conclusions
The reuse of TWW in agriculture is an appealing and practical solution that significantly relieves pressure on water resources and, as such, is a consolidated adaptation strategy for the current and future sustainability of agriculture in water-scarce countries; nonetheless, it necessitates a sizable re-calibration for local conditions and specific crops.
In this regard, a Monitoring and Modeling Approach (MMA) was developed to improve the current irrigation management of a citrus crop, regularly and chronically irrigated with TWW, in Beit Dajan, Palestine. MMA considered the soil solution’s electrical conductivity and the leaf nitrogen concentration to characterize the water–soil–plant interactions and compared the outcomes of conventional and TWW-tailored irrigation practices.
MMA enabled the conservation of the soil salinity level between 2.0 and 2.2 dS m−1 and estimated an acceptable leaf nitrogen range between 1.7 and 1.9%, considering that a nitrogen deficit is usually induced by the stress conditions established under TWW supply. These results directly correlate with the re-scaling of the frequency of irrigation events based on comparing the farmer (F) and the model (M) routines. They demonstrate that a robust TWW irrigation management cannot but consider the quality of water and soil and the crop nitrogen deficit.
The HYDRUS-1D model was used to estimate the water flow and nitrogen transport in a citrus orchard under TWW irrigation using data collected in 2021. Based on the 2021 calibration, the same geometry domain was set up to retrieve the water and salt behavior during the irrigation seasons of 2019–2020. The simulations also allowed for the prediction of the deep percolation and leaf nitrogen optimum values. The results show that at 75 cm depth, the (M) strategy generated 33% less nitrate leaching than (F), which induced an increase in the available soil nitrogen in the long run. This is due to the high frequency of the irrigation events (2–3 times per week) scheduled by the farmer, coupled with a reduction in the root uptake.
Despite the TWW quality being characterized by high salinity (1.9 dS m−1), soil salinity was acceptable, but leaves suffered from nitrogen deficit experienced under inadequate long-standing practices. The high concentration of soil did not translate into Citrus since citrus root uptake was reduced under water and salt stresses, in addition to the part of nitrogen that was pushed beyond the root zone.
Irrigation scheduling with TWW based on the combination of water and soil parameters showed an improvement in nitrogen root uptake and a reduction in deep percolation fluxes compared to the F practice.
All the above results show that irrigation management with TWW should be re-scaled to consider both supplies of water and salts and deficits witnessed by the citrus crop.
At the time being, the irrigation management follows a business-as-usual plan that is most adapted for and applies optimum thresholds that fit practices with conventional water. This behavior does not account for the different mechanisms induced when TWW is used and their impact on the soil and plant.
The main contribution of this study is, therefore, a new perspective in managing irrigation with TWW, where sustainability stands and no harm irrigation plans apply, especially in those areas where TWW is the only source, and its reuse is consolidated to ensure irrigation. These results demonstrate the potential of MMA in this regard, although further studies are still required to consolidate the methodology.


