1. Introduction
Air conditioning systems are increasingly becoming energy-intensive and are predicted to be the second-largest source of electricity consumption in the next three decades [
1,
2]. In hot and humid regions, traditional mechanical vapor compression refrigeration systems (
) consume over 50% of the building’s total energy use and have a limited coefficient of performance (
) [
3]. This poses challenges for cooling and dehumidification in high-humidity regions [
4]. To address these issues, researchers are exploring safe and efficient alternatives to traditional MVCR systems, such as indirect evaporative cooling (
) and liquid desiccant dehumidification (
) [
5] technologies. The combination of
and
technologies in a regenerative internally cooled liquid desiccant air conditioning system (
) has shown great promise in overcoming the limitations of traditional air conditioning systems.
The liquid desiccant cooling system (
) represents a promising technology for achieving energy-efficient and environmentally friendly air conditioning. However, the application of its two main components, the
and
is constrained by regional climate conditions. On the one hand,
has demonstrated significant cooling potential in dry and cold regions [
6]. However, in humid areas characterized by elevated wet bulb temperatures,
IEC encounters limitations in providing adequate evaporative cooling capacity [
6]. Its condensation method is not enough to achieve the dehumidification goal [
7]. Chu et al. [
8] found that the heat transfer performance of a regenerative indirect evaporative cooler (
) is not prominent in wet areas. On the other hand, the reduced vapor pressure difference of
LDD at high temperatures compromises its dehumidification efficacy [
9]. To overcome these limitations, previous studies have attempted to integrate
and
. Zhang et al. [
10] developed a device that combines
and
. Although this device increased the dry bulb efficiency by 39%, the currently available device is insufficient to replace energy-efficient air conditioners in providing an air-conditioned air supply. Therefore, simply integrating
and
is not enough to achieve the target supply air temperature and moisture content [
11] in hot and humid regions. It is crucial to explore the performance of liquid desiccant cooling systems and their applicability in hot and humid regions.
The purpose of a regional applicability study is to assess the cooling and dehumidification capabilities for conditioning air to target operating conditions, as well as to evaluate its energy consumption and heat transfer performance. Previous studies [
10,
11] have demonstrated that certain liquid desiccant cooling systems may struggle to consistently provide low-temperature and dry air, particularly in hot and humid regions. To address this challenge, it becomes imperative to configure and optimize system parameters according to varying climatic conditions. It is important to configure the system to make it handle the air to meet the air conditioning supply conditions. In previous multi-stage evaporative cooling and dehumidification systems, dehumidification devices represented by desiccant wheels [
12], liquid desiccants [
5,
13], and evaporative coolers [
14] were often used as air pretreatment or recovery devices. It is rare to use a multi-stage
system directly to treat the air to the supply air state point without any vapor compression device. In prior studies on
[
15,
16], some
LDD-assisted cooling methods relied on coils [
16], or they involved pre-cooling procedures [
15]. In the newly proposed system, the regenerative
IEC employs a portion of the low-temperature supply air as the air source for the indirect cooling channels. The
uses waste heat recovered from the exhaust air as a source of internal cooling air.
The existing study on systems integrating
LDD and
IEC has faced challenges in optimizing configurations to resolve the trade-off between system air handling performance and energy efficiency. On one hand, integrated systems may require higher resource consumption to condition air to the desired specifications [
17]. Heidarinejad et al. [
18] developed a multi-stage system using
and directly evaporative cooling that achieved better cooling performance, but it resulted in a 55% increase in water consumption compared to
. Kim et al. [
16] developed a multi-stage system using
,
, and
that avoided the use of vapor compression devices. However, the excessively complex design of this system resulted in a significantly higher initial investment cost. Consequently, striking a balance between the cooling and dehumidification capabilities of the system and its energy performance has emerged as a critical challenge. On the other hand, there are cross-effects between the parameters that affect the system’s performance. Ren et al. [
19] used
to optimize a desiccant wheel cooling system and found that many factors had cross effects on the system’s performance indicators. Hu [
20] tested the dehumidification capabilities of
in different climatic zones in China and found that
had varying sensitivities to changes in solution concentration in different cities. Hence, there is a compelling need for a comprehensive optimization approach that considers multiple parameters and objectives to effectively balance the system cooling and dehumidification capabilities with its energy performance.
In summary, it is necessary to develop a new system configuration with improved cooling and dehumidification performance and conduct regional adaptability studies in order to achieve the cooling and dehumidification goals in humid regions [
21,
22]. In the newly proposed system, the regenerative
uses a portion of the low-temperature supply air as the air source for the indirect cooling channels.
uses waste heat recovered from the exhaust air as a source of internal cooling air and the liquid desiccant regenerated by the solar heat collector. Through sensitivity analysis, key components and parameters of the system have been identified, and empirical formulas have been generated using statistical methods to predict the performance of the liquid desiccant cooling system (
) and optimize six key parameters, namely temperature, relative humidity, inlet air velocity, desiccant concentration, return air ratio, and number of transfer units. Furthermore, the regional adaptability of the
system in humid regions is explored, with the system performance coefficient (
) as well as the outlet temperature and humidity being optimized targets.
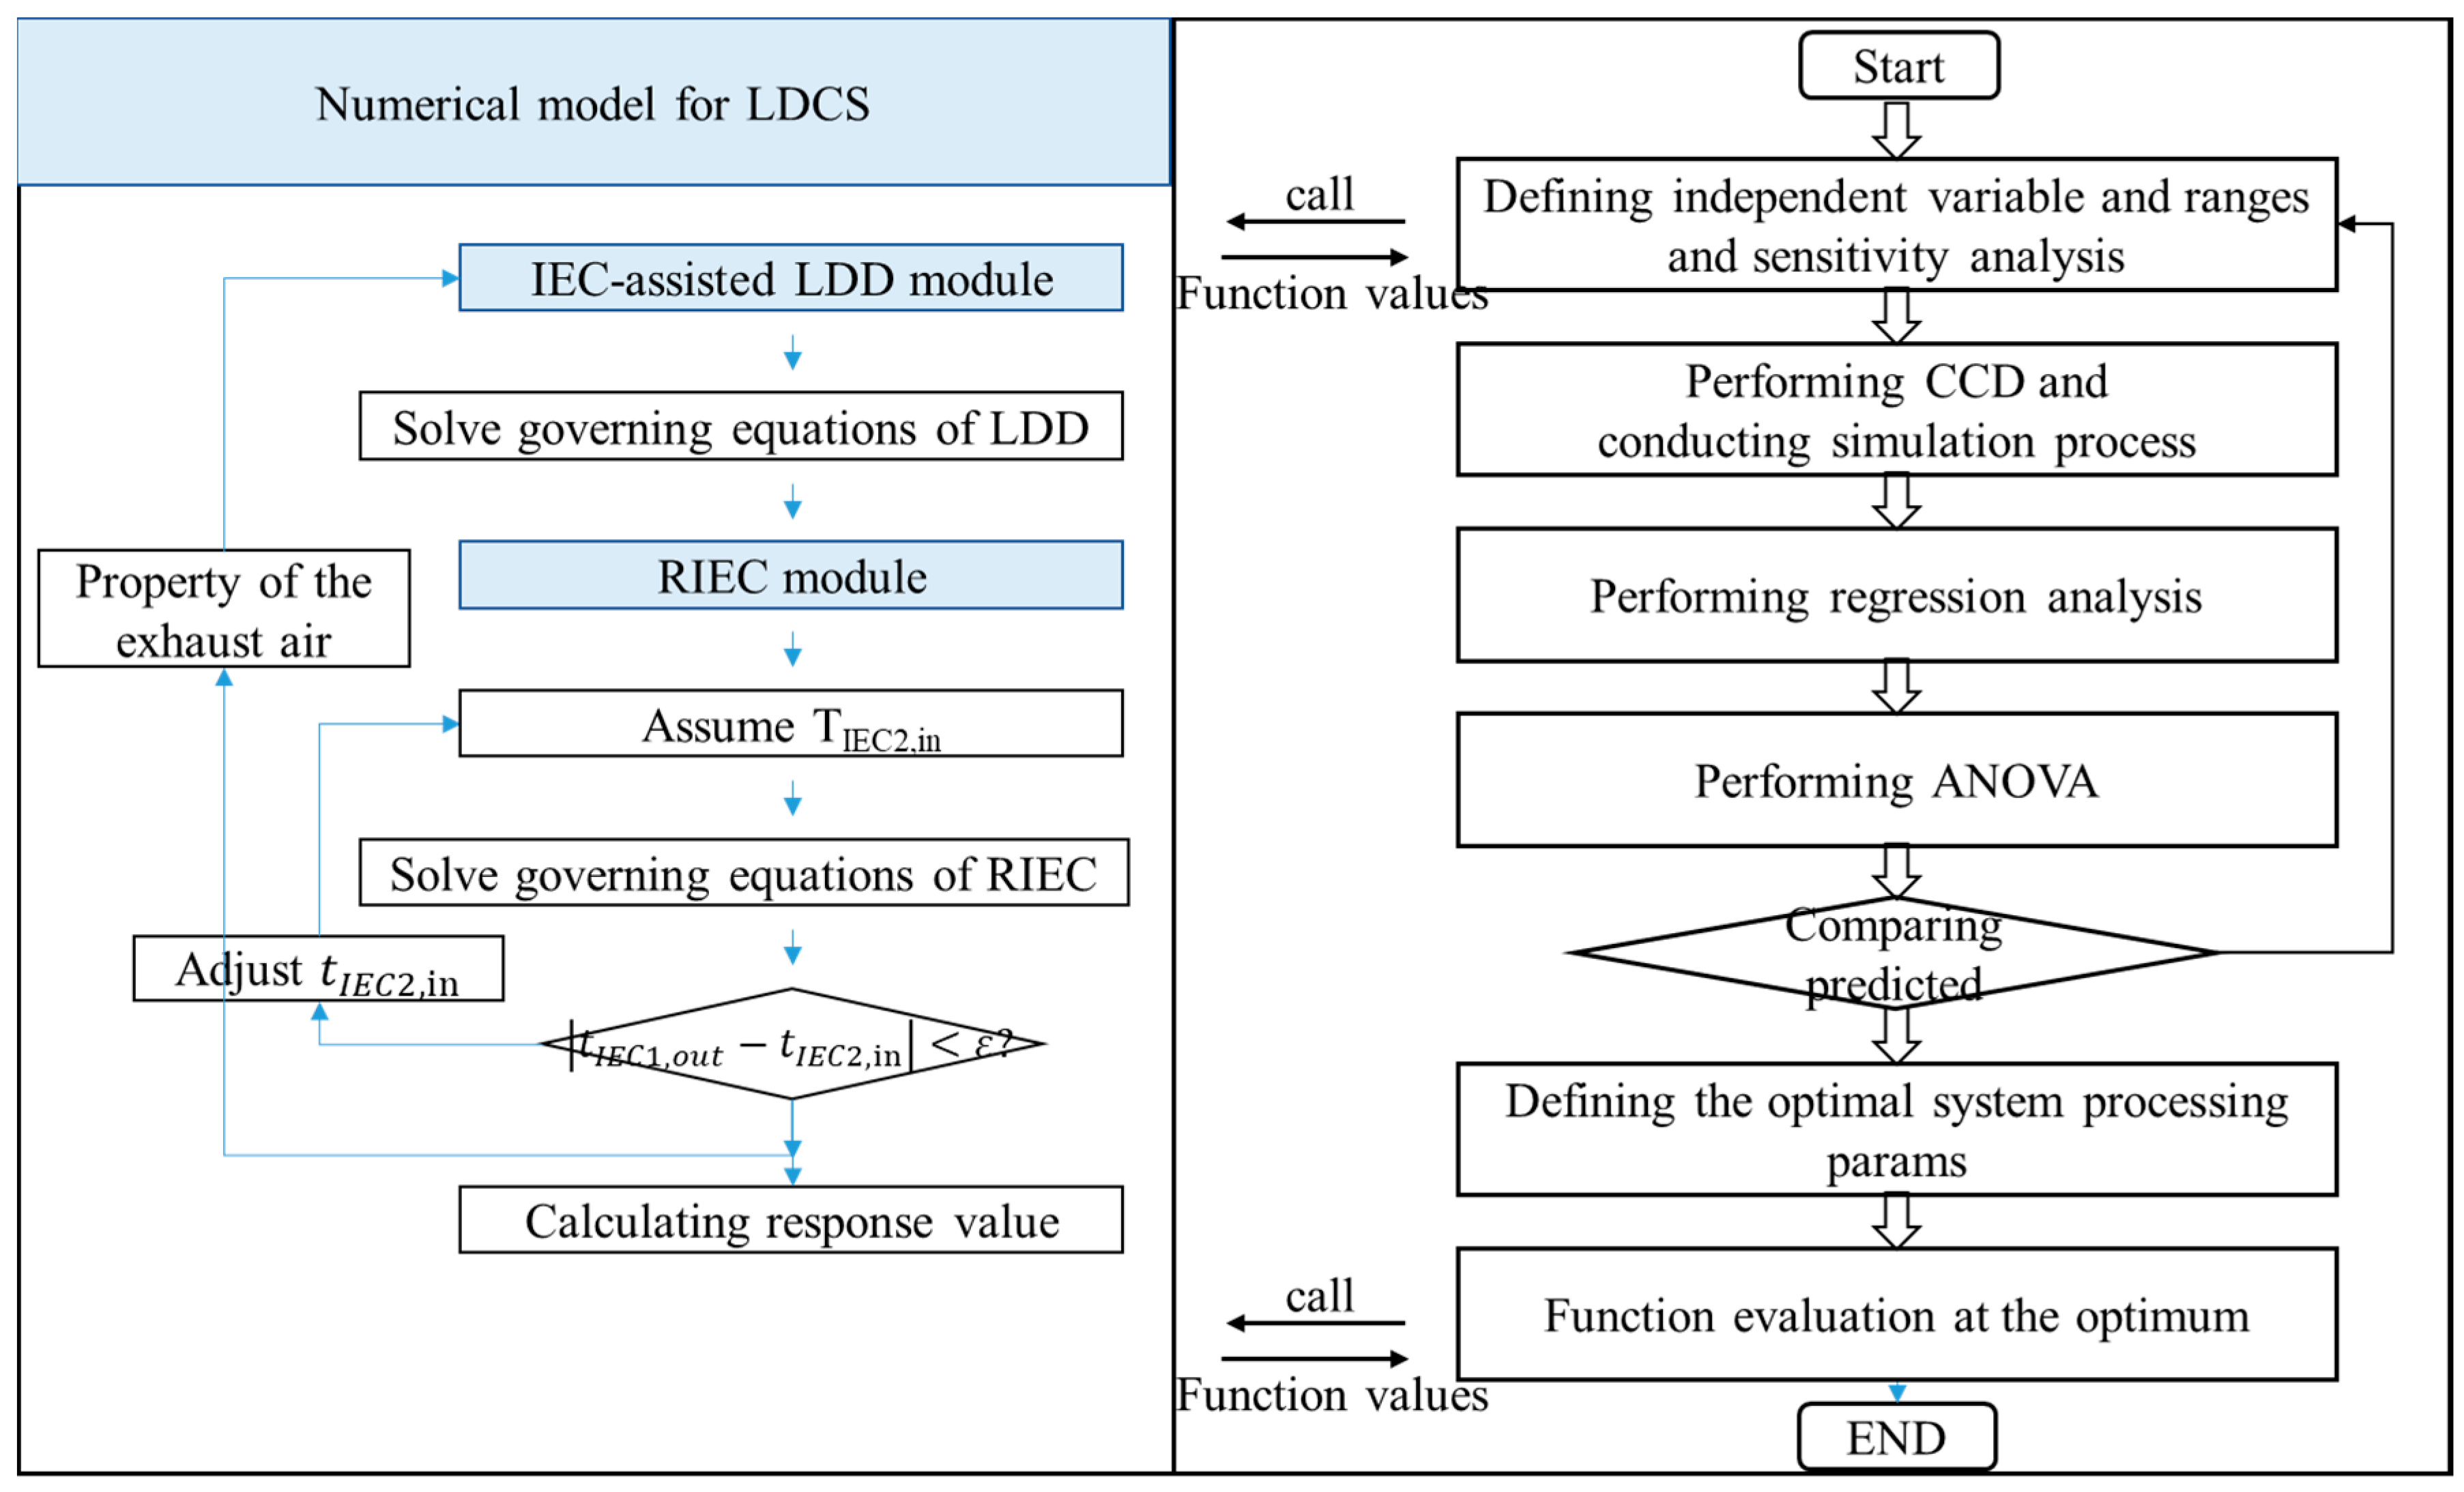
3. Empirical Model and Multi-Objective Parameter Optimization
The optimization within this system aims to identify the optimal combination of system parameters to achieve the dual objectives of air dehumidification and cooling while simultaneously maximizing the . Six key parameters have been selected for sensitivity analysis to assess the performance of the across diverse environmental and operational conditions. The central composite design () is a statistical design technique widely employed in research and engineering to examine how a system or process responds to multiple factors, accounting for both linear and nonlinear effects, as well as potential interactions among these factors. In this study, is utilized to determine representative combinations of multiple factors. These representative cases effectively represent the test results of all variable parameter combinations.
In the system, six key parameters (primary air temperature
, primary air relative humidity
solution concentration
, primary-to-secondary airflow ratio
, primary air velocity
, and the number of transfer units
) were selected for sensitivity analysis to identify the parameters that exert a substantial influence on the
of
. Following the sensitivity analysis, independent variables (
,
,
,
,
) that had a significant impact on the response value were selected, and a 50-group test design with three levels for each parameter was carried out. The specific values for each parameter are detailed in
Table 1. The temperature and relative humidity ranges are selected based on the weather conditions in hot and humid regions. The recommended air velocity for
or
typically falls within the range of 1 to 3 m/s. The concentration of the solution is chosen within the solubility range of
[
26]. The simulations were conducted according to the arrangement specified by the
, resulting in a total of 50 tests. The analysis of the test results was carried out utilizing the Design Expert version 13.0.
The sensitivity analysis explores the main effects of the parameters, and the interaction effects of the parameters can be further explored. Moreover, 50
LDCS simulated data were analyzed by analysis of variance (
ANOVA) to identify the significant parameters influencing three evaluation criteria:
,
, and
. The
p-value is calculated to assess the probability of obtaining a test statistic as extreme as or more extreme than the observed statistic under the assumption that the null hypothesis is true. A lower
p-value indicates stronger evidence against the null hypothesis. A response surface model is constructed using the obtained data, and its statistical significance is evaluated using an F-test at a 95% confidence level [
22,
27]. A
p-value less than 0.05 is considered evidence that the regression model is capable of predicting the response for the parameters that significantly affect the system performance; a curve fitting is employed to establish an empirical mathematical model. To assess the relationships between the responses and validate the empirical model, correlation coefficients of determination (R
2) were used. Taking the outlet temperature (
), humidity (
), and
of the product air as optimization objectives, the impact of parameter variations on system performance is analyzed using the
, and multi-objective optimization is conducted.
The flowchart of the optimization process is shown in
Figure 3. The system optimization process includes the establishment of mathematical models, regression analysis, sensitivity analysis of single values and cross-effect parameters, and multi-objective optimization. The numerical model developed in the previous section provides data for fitting the empirical model. Sensitivity analysis is first used to explore the effect of single-valued variables on the air outlet status and
COP performance of the system (
Table 2).The central composite design (
) consists of a square grid with four additional test points located at the corners, in the center, and along the axial directions. It is widely used for fitting second-order surface equations. A regression equation based on a second-order polynomial model (Equation (17)) can describe the relationship between the response and the terms in the model and characterize this response surface algebraically. The fitted response surface model was statistically analyzed by analysis of variance (
ANOVA). The significance of each additional term is evaluated in sequence using the F-test. The results of the
ANOVA allow the identification of first-order terms, intersection terms, and higher-order terms that have a significant impact on outlet air performance and
COP.
Therefore, based on a second-order polynomial model, a multivariate regression analysis using statistical methods is performed on the three optimization objectives () and five parameters to generate empirical equations. The desirability function approach () is used for multi-objective optimization of the three optimization objectives (Equations (18) and (19)).
Given the substantial variations in specific meteorological conditions across different cities within hot and humid regions, there exists a multitude of scenarios encompassing hot and humid weather conditions that necessitate exploration. Tailored optimization strategies are believed to be invaluable in addressing these diverse scenarios. The combined effects of meteorological and operating parameters can be used to explore the optimal operation of the system under different weather conditions. Air velocity, RC, and solution concentration were identified as parameters that primarily affected system performance, and cross-effects between operating parameters significantly influenced the variation in
COP. Therefore, modifying operational parameters through cross-interaction holds the potential to enhance overall system performance. Finally, the performance of the operation scheme under different meteorological conditions is explored to explore the regional applicability of the system. Three cities (San Juan, Kuala Lumpur, and Hong Kong) have been selected for case studies with varying temperature and moisture content (
Table 3) to explore the performance of the system in hot and humid regions. The intake conditions are chosen based on the local annual extreme design conditions [
28]. The optimization of operational parameters, as outlined in
Table 3, and the prediction of target values have been conducted for these three cities.
4. Results
The results of the multifactor analysis of variance are provided to identify the key parameters that affect the system . Subsequently, empirical equations are fitted based on the key parameters to predict the system’s outlet parameters () and . A two-factor analysis is then conducted on these empirical equations to establish a ranking of the factors and evaluate their significance in shaping the . Finally, the optimization scheme and the findings pertaining to the regional applicability of the are presented.
4.1. Empirical Model of Performance Indicators
The empirical correlations of the predicted efficiency and supply air temperature and humidity values for the internally cooled liquid desiccant cooling system were derived as functions of the six operating parameters based on the numerical model. Statistical analysis was conducted using regression analysis and analysis of variance ().
The results of the variance analysis revealed the noteworthy impact of operational parameters and their interactions with two factors on the performance of outlet air supply and . For the of the system, all operational and design parameters showed high significance p-value ), while only some cross-term operational parameters exhibited significance to the target values. For example, the interaction of inlet air temperature and airflow velocity showed high significance for , while the interaction of inlet air relative humidity and airflow velocity displayed low significance for the outlet air temperature of the system (p-value ). The combined effects of meteorological and operational parameters can be utilized to explore the optimized operation of the system under different weather conditions. As discussed in the preceding section, the cross-interactions among operational parameters, including airflow velocity, , and solution concentration significantly influenced variations. Therefore, modifying operational parameters with cross-interactions can lead to improved system performance. Consequently, the parameters deemed significantly important for LDCS metrics, along with their interactions, were selected to formulate empirical correlations aimed at predicting the system’s product air outlet conditions and the of the .
The empirical correlations for the product air temperature, humidity content, and
of the
system are shown in Equations (20)–(22). The
values of the proposed model were found to be 98.6% for the product air temperature, 98.7% for the outlet humidity content, and 98.4% for
, indicating a good agreement between the simplified empirical formula predictions and the numerical model data.
4.2. Parameter Analysis
4.2.1. Single-Value Factor Analysis
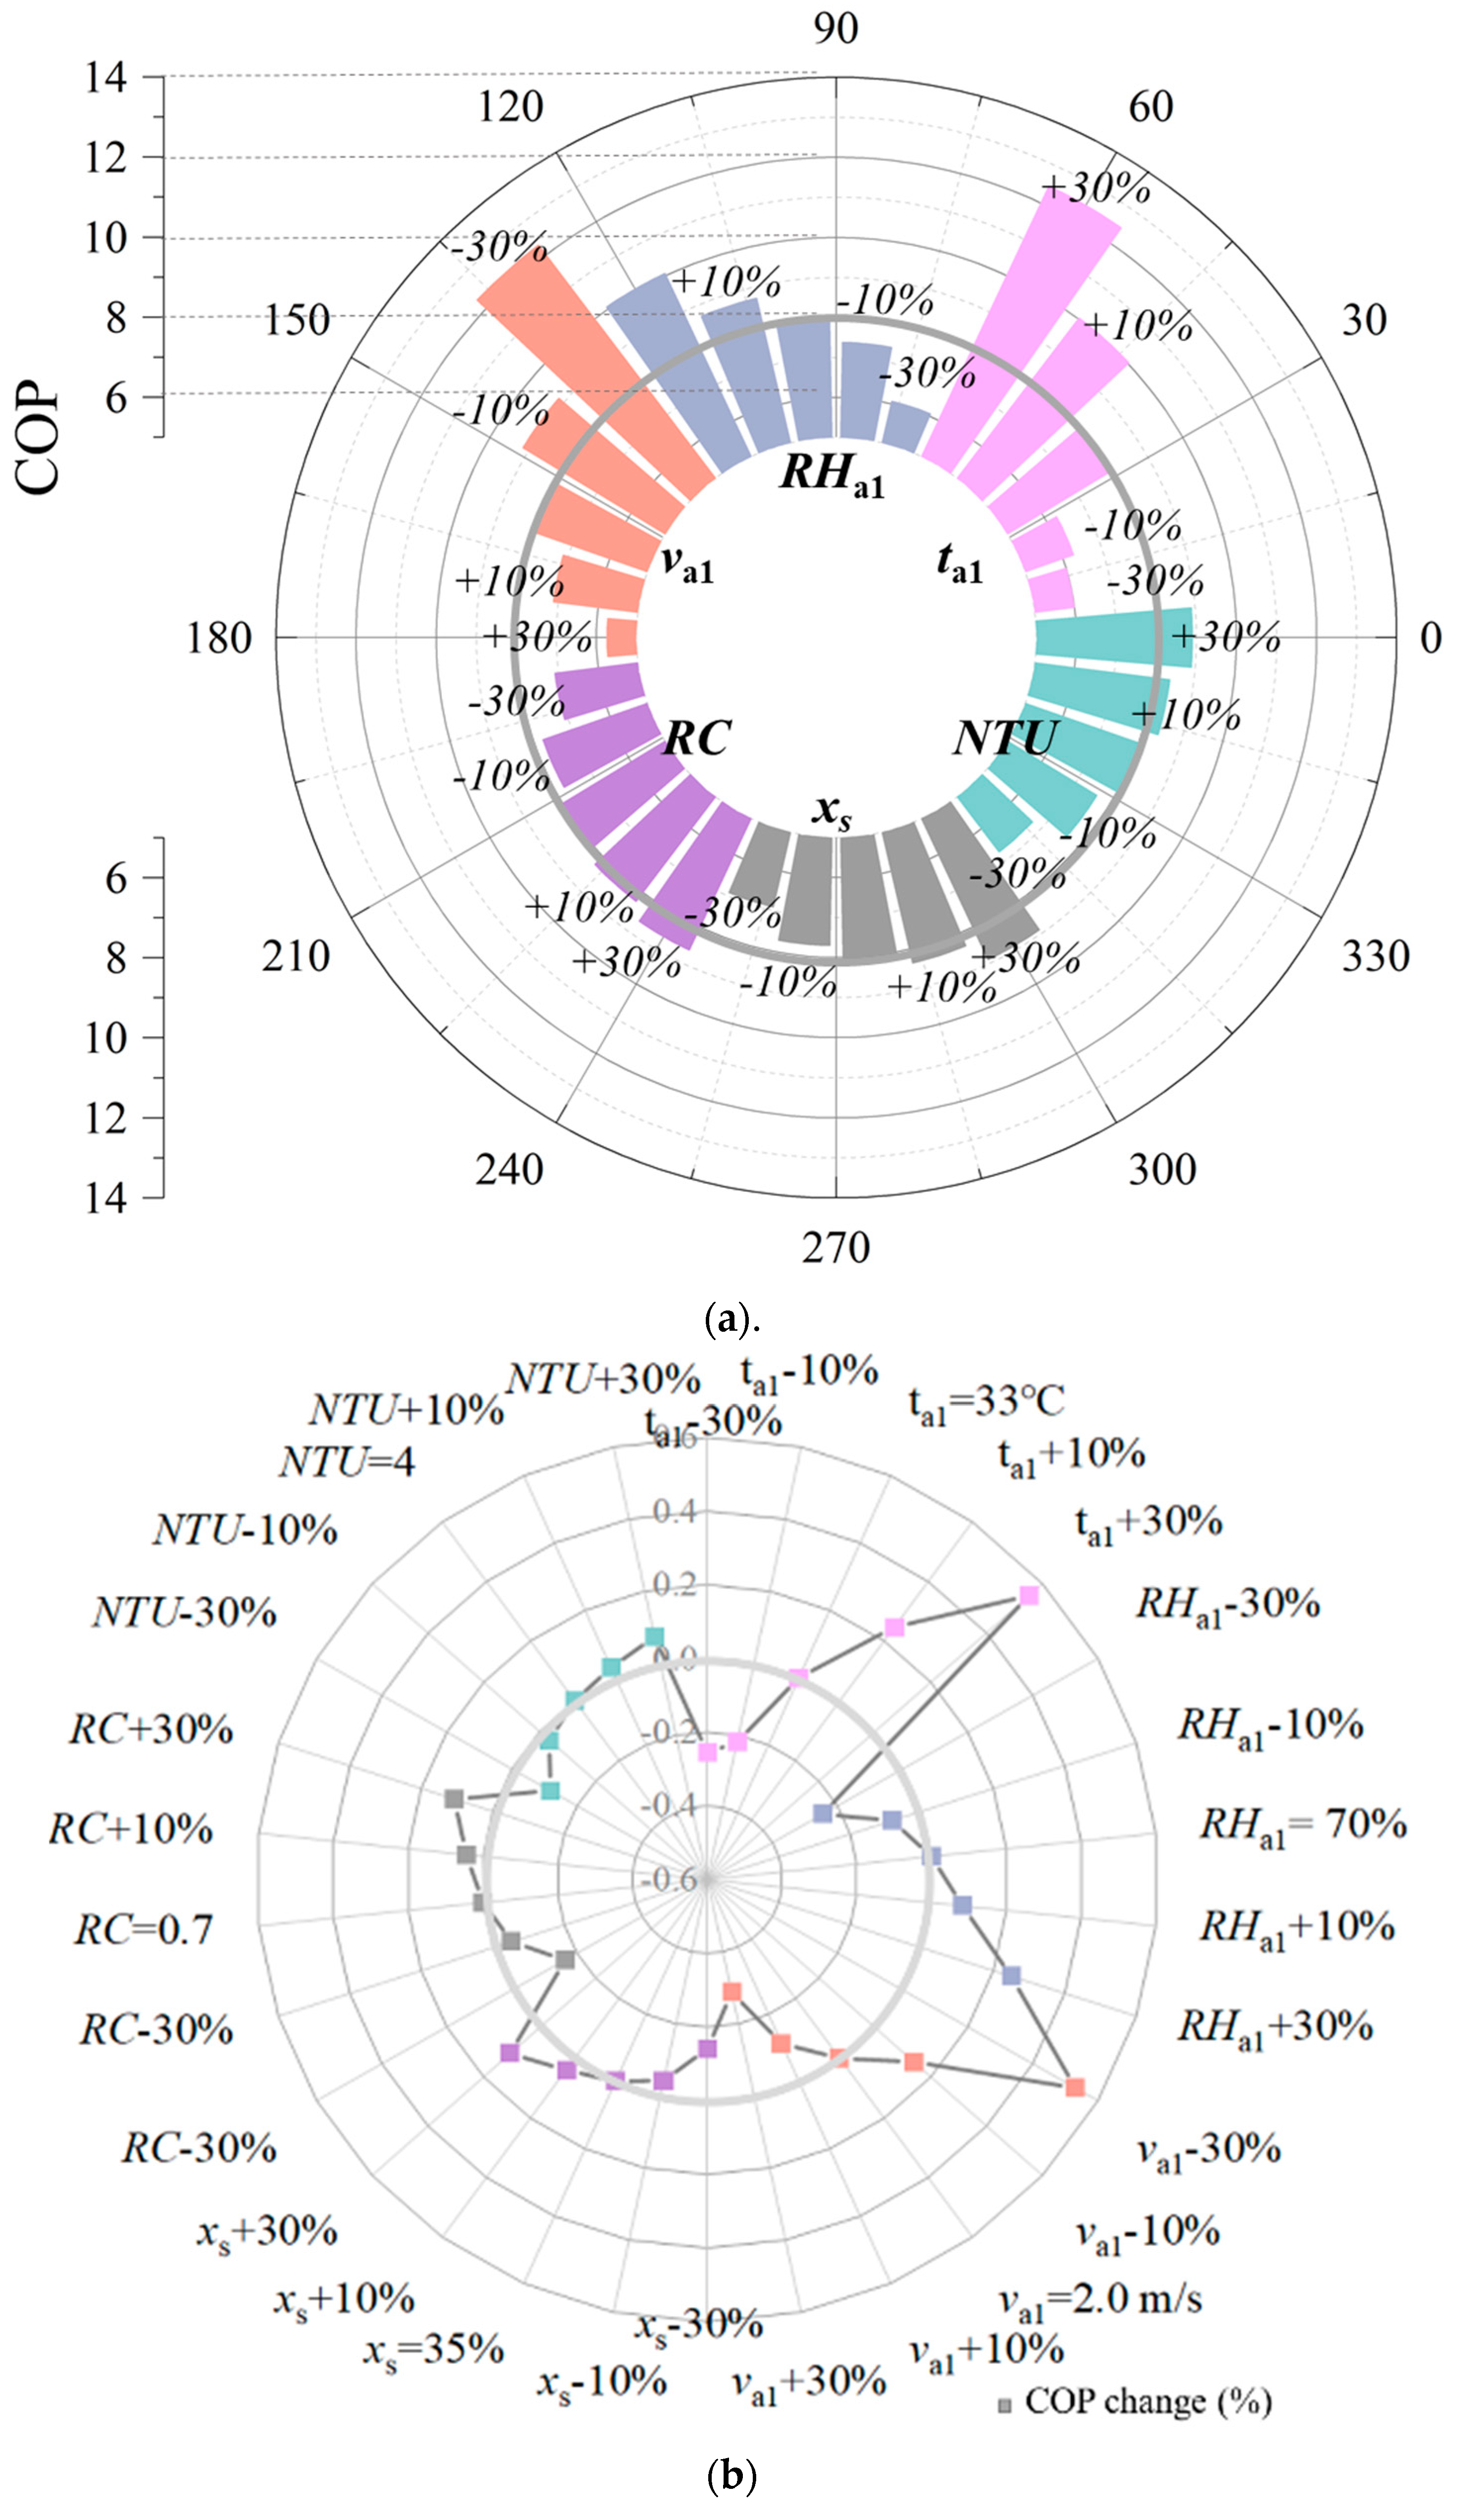
Identifying the effect of variations in single-value parameters on the system’s robustness is imperative for optimizing its performance. Based on the single-value parameter analysis discussed in the previous section, sensitivity analysis is conducted for the six parameters that significantly affect the system-optimized objectives (
Figure 4a). The impact of each parameter is examined by deviating ±10% and ±30% to assess their influence on the performance (
Table 2). The base scenario is represented by the gray line, with the selection of temperature and humidity values based on meteorological data from a hot and humid city. The operating parameters are referenced from recommended values in previous studies on
and
performance.
Analyzing and understanding the behavior of the system within and outside these regions are essential for evaluating its overall performance and identifying factors that contribute to its efficiency. By comparing the performance with the baseline scenario, the impact of different operational parameters, environmental conditions, or design modifications on the system’s effectiveness can be explored.
Figure 4a,b illustrates the impact of parameter variations on
based on the baseline scenario. The inlet temperature has the greatest influence on the system
; it is determined by the outdoor environmental conditions. However, without changing the operating parameters, it is not possible to improve the system
under constant outdoor conditions. The factor
and
have a significant impact on the system
.
determines the ratio of the secondary airflow in
and
, allocating the cooling and dehumidification capacity of the system. It can significantly affect the system’s
and has greater potential for system optimization.
The solution concentration and airflow velocity are significant operating parameters that affect the outlet humidity and temperature. These parameters have a substantial impact on the system’s performance and energy efficiency and require further optimization.
Figure 4c,d illustrate the influence of altering six parameters on the outlet air temperature and moisture content, using the baseline scenario as a reference. The gray circles represent the temperature and humidity differences at the outlet of the system in the basic scenario. The points outside the circles represent the increase in the difference between the inlet and outlet temperature and humidity of the system after changing the corresponding parameters. The dots in the circles indicate that changing the value of the corresponding parameter results in a smaller change in temperature and humidity at the inlet and outlet of the system than in the baseline scenario. The results indicate a relatively balanced influence of the six parameters on the change in moisture content of the outlet air. Among them, airflow velocity and solution concentration, as operational parameters, exhibit a significant effect on the moisture content. Decreasing the airflow velocity by 30% leads to an additional removal of 1.769 g/kg of water vapor compared to the baseline scenario. Moreover, the outdoor temperature also affects the dehumidification performance of the system under the same relative humidity conditions, indicating the system’s sensitivity to high-temperature and high-humidity environments.
When the solution concentration was increased by 30%, the water vapor removal rate exhibited a significant increase of 2.281 g/kg. Surprisingly, the system outlet temperature did not experience a substantial rise, with only a marginal increase of 0.14 °C observed. This unexpected result can be attributed to the improved dehumidification capability of the higher-concentration solution. Although the high
released heat during the water absorption process, the enhanced dehumidification capacity led to a decrease in the wet-bulb temperature of the working air entering the
system. This reduction in moisture content increased the potential for cooling, compensating for the heat released by the solution. Consequently, the overall temperature rise at the system outlet remained relatively small.
Figure 4d also demonstrates that changing the six parameters significantly influences the temperature of the system outlet air. The number of transfer units (
), which represents the heat exchanger’s geometry and heat transfer capacity, plays a crucial role. By selecting a heat exchanger with a 30% higher
value, the outlet air temperature can be reduced by 1.2 °C.
These findings emphasize the importance of carefully considering and optimizing the selected parameters to achieve the desired outcomes in terms of both temperature and moisture control in the system.
4.2.2. Cross-Factor Analysis
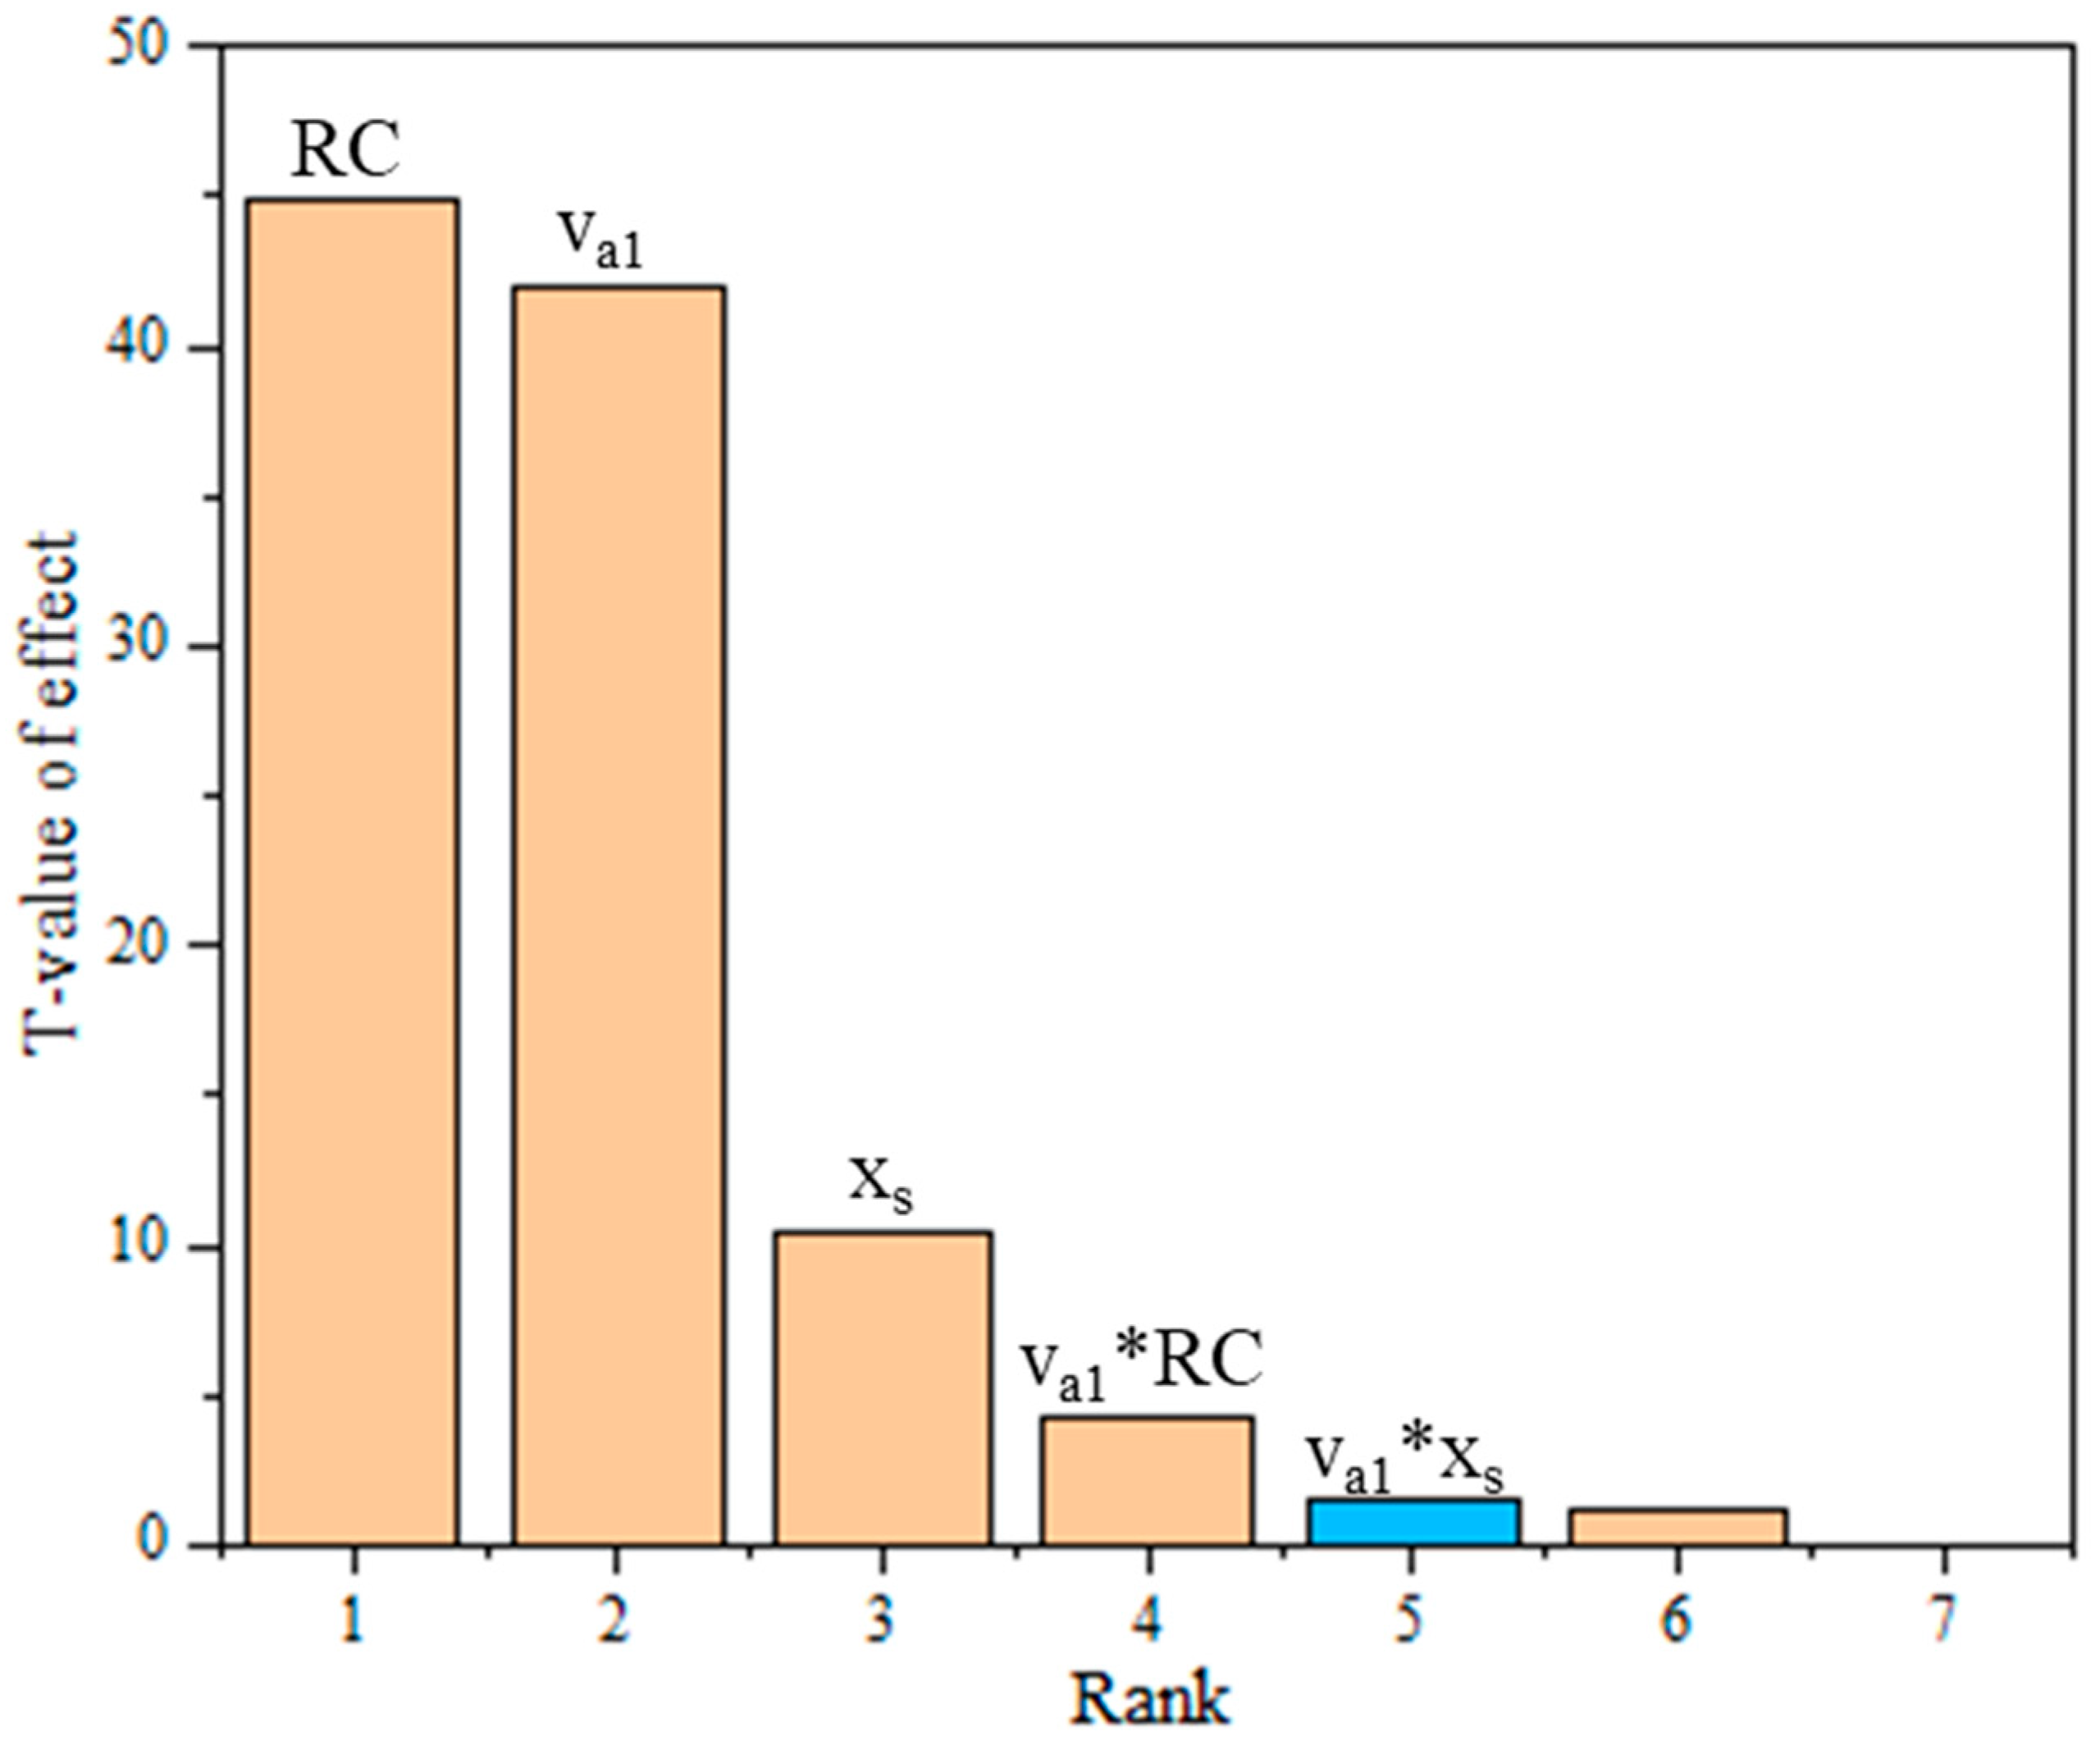
It is important to recognize that the weights or impacts of the influencing factors leading to specific outcomes are not equal. Therefore, identifying the high-weight factors and addressing them first can help achieve the desired results. Some system parameters have been found to have cross-influences on the
, allowing for flexible simultaneous changes to effectively enhance system performance. The Pareto bar chart (
Figure 5) on the left side (
y-axis) displays the T-values of each operating parameter in the system, with the influencing factors arranged on the
x-axis in descending order of frequency. The results indicate that single-value operating parameters have the greatest impact on the
, with the following ranking: secondary to primary air mass flow ratio in LDD (
> inlet air velocity
> concentration of the solution
. When
is increased, the
extracts less return air, allowing more product air to enter the indoor space for heat and humidity treatment, resulting in better dehumidification potential and a higher
. The cross-influence factor between
and
also significantly affects the target value of
. Despite the positive correlation between
and
with the coefficient of performance (
), the cross-term
exhibits a negative correlation with the system
. This is due to the fact that although increasing
can enhance the processed air volume and increasing
can improve water absorption, the enhancement of water absorption requires more time to ensure a sufficient water absorption process.
4.2.3. Cross-Impact of System Parameters
Figure 6 illustrates the cross-interactions between the operational parameters
and
on the coefficient of performance. Due to the presence of the quadratic term of
in the empirical formula, both RC and
are positively correlated with
, resulting in a curved surface. The optimal
is achieved at high
and high
values. For example, at (
= 32,
= 70), the
reaches 7.50. Furthermore, when
is high,
is more sensitive to improvements in
. In practical scenarios where the solubility of the solution may be limited, enhancing the secondary airflow volume of the
LDD can also contribute to improvements in
.
Figure 7 demonstrates the cross-interactions between
and
on
. The results show that, without changing
, increasing
alone has a minimal impact on system
. This can be attributed to the higher airflow volume requiring more energy consumption and potentially weakening the dehumidification effect. However, when both
and
are simultaneously increased, the system achieves a better
. For instance, when both
and
are increased by 30%, the
of the system improves from 5.66 to 7.82, resulting in a 38.1% increase.
These findings highlight the importance of considering the combined effects of multiple parameters and their interactions when optimizing the of the system. By carefully adjusting , , and , researchers and engineers can achieve significant improvements in the system performance and energy efficiency.
4.3. Regional Applicability of the System in Hot and Humid Regions
This section demonstrates the application of regression models for performance prediction in various hot and humid urban areas, alongside the implementation of optimized control strategies tailored to local meteorological conditions. Using derived regression models (Equations (20)–(22)), the operating parameters were optimized with outlet temperature and humidity content, as well as system
as the optimization objectives (
Table 3). The regional adaptability of the
system was illustrated by operating it in three selected cities under the optimized parameters, as shown in
Figure 8,
Figure 9 and
Figure 10. The
effectively reduced the outlet temperature and humidity during the high-temperature seasons in these regions, achieving performance coefficients (
) ranging from 3.93 to 6.29, which is up to 57.25% increase compared to the
system with a
of 4.
In Kuala Lumpur, a city characterized by high temperatures and humidity year-round, maintaining high s (5.52–6.29) was achieved by setting optimized parameters ( = 2.3 m/s, = 0.4, = 0.75). Under this optimization strategy, the regression model predicted annual outlet temperature and humidity content in the ranges of 18.53–18.58 °C and 0.012–0.013 kg/kg, respectively. For San Juan, the optimized inlet air velocity was set at 2.3 m/s, balancing the airflow for cooling and dehumidification with set to 0.7. The outlet air temperature () ranged from 17.69–17.72 °C. In Hong Kong, the optimized system achieved a of 6.01 during the warmer months, although it varied throughout the year. The optimized system outperformed traditional evaporative vapor compression refrigeration systems ( = 4) by 34.9% in terms of .
Given the year-round climate variations in hot and humid regions, further investigations may focus on operational modes to ensure the system’s adaptability to different seasonal weather conditions.
5. Conclusions
This study examined the performance of a regenerative liquid desiccant cooling system () for dehumidification and cooling. Simulations from three cities were conducted, deriving empirical models to predict system performance. Sensitivity analysis and multi-objective optimization methods were employed to determine optimal system configurations.
The simulation results demonstrated that the secondary to primary air ratio of () and airflow velocity () having the most significant impact on system performance. The system maintained a high when operated under low airflow velocity ( = 1.5 m/s) and high secondary to primary air ratio of ( = 0.8) conditions.
The results of the dual-factor analysis of operating parameters indicated that when both and were increased by 30%, the of the system improved from 5.66 to 7.82, representing a 38.1% enhancement. The optimal was achieved at high and high moisture removal () conditions, with a of 7.50 at a temperature of 32 °C and relative humidity of 70%.
The regional applicability results demonstrated that the has great potential for use in hot and humid regions, with a range of 3.93 to 6.29. The optimized was up to 57.25% higher than that of traditional evaporative cooling systems with mechanical vapor compression refrigeration () systems.
This study contributes to the implementation of internally cooled LDCS and offers recommendations for their optimal operation in hot and humid regions. The regional applicability in diverse cities with varying weather conditions is investigated. This approach enables the control of the cooling and dehumidification process through the adjustment of operating parameters. Additionally, the optimized COP demonstrates a 57.25% improvement compared to the traditional evaporative cooling system with mechanical vapor compression refrigeration (MVCR).


