Article

Incorporating Heat Vulnerability into Local Authority Decision Making: An Open Access Approach

1
School of Engineering, University of Birmingham, Birmingham B15 2TT, UK
2
School of Geography, Earth and Environmental Sciences, University of Birmingham, Birmingham B15 2TT, UK
3
Birmingham City Council, Birmingham B1 1BB, UK
4
School of Engineering and the Built Environment, Anglia Ruskin University, Cambridge CB1 1PT, UK
*
Authors to whom correspondence should be addressed.
Sustainability 2023, 15(18), 13501; https://doi.org/10.3390/su151813501
Submission received: 24 July 2023 / Revised: 25 August 2023 / Accepted: 5 September 2023 / Published: 8 September 2023

Abstract

:
High temperatures and heatwaves are becoming more frequent, but heat vulnerability is rarely considered within local authority city design and statutory land-use planning processes. Here, we describe an approach to assess heat vulnerability in Birmingham, the second largest city in the UK. The approach uses open access data and GIS techniques that are available for built environment practitioners. Heat vulnerability is assessed by combining four datasets: surface temperatures, Local Climate Zones, green space, and Indices of Multiple Deprivation. The assessment shows that central and eastern areas of Birmingham that have the most compact urban form, least green space, and highest levels of deprivation are most vulnerable to heat. We evaluated the approach against previous climate research, examined the approach and datasets at the local scale, and described how heat vulnerability can be (and is being) incorporated into decision making. This project combines three key innovations: (1) the decision-centric process that focuses the method on the decision that needs to be made, minimizing inertia related to scientific or modeling uncertainty and reducing resource-intensity; (2) the co-creation process with Birmingham City Council, who have statutory powers for planning within the city, thereby ensuring that heat vulnerability is embedded within decisions on the suitability, design, and location of sites for future development; and (3) the open access and technically appropriate methodology which can be applied to any urban area in the UK, using the open access datasets described here, or globally, using locally applicable data sources.

1. Introduction

Extreme temperatures are becoming more frequent. Within the UK, summers are becoming warmer; nine of the top ten hottest days since 1900 have occurred since 1990; and in July 2022, the UK experienced its hottest summer day in history [1,2]. The 2022 heatwave was unusually intense and geographically extensive: 40 °C was exceeded in multiple locations in England; 35 °C was exceeded in Scotland; and record overnight minimum temperatures were recorded in England, Wales, and Scotland (25.8 °C, 24.5 °C, and 21.3 °C, respectively; [3]). Hot summer temperatures, particularly those days that have a high daily maximum temperature, or tropical nights, where temperatures fail to sufficiently cool, have a negative impact on infrastructure, the built environment, and human health ([4,5]; within the Third UK Climate Change Risk Assessment).
In urban areas, the impacts of hot summer temperatures are disproportionately greater for several reasons. Firstly, several factors make urban areas are warmer. Artificial surfaces are prevalent; these tend to warm up more quickly and cool down more slowly [6,7]. Compact urban form also limits the sky view factor, trapping heat by reducing heat loss via advection [8]. Urban areas also have increased sources of heat from homes, industry, and transport [9]. Combined, these factors lead to urban areas having a higher mean temperature than surrounding rural areas, termed the urban heat island (UHI; [10]). During heatwave events, high temperatures can be exacerbated by the UHI, particularly when heat can accumulate over several days and nights [11]. Secondly, by their inherent design, urban areas are concentrations of people and infrastructure; thereby, there are more people and more infrastructure to be impacted [12,13]. Moreover, urban areas often host critical infrastructure, such as transport hubs, and, consequently, any impacts can propagate into the rural hinterlands and beyond [14,15]. Lastly, urban areas often have high concentrations of vulnerable communities who are also more likely to be living in high-rise or poor-quality housing that is more vulnerable to overheating [16,17,18], with lower access to quality green space or natural shading to cool down [19,20,21].
To reduce the heat vulnerability in our urban areas, built-environment practitioners must consider high temperatures and future warmer summers within operational (i.e., approving new developments and retrofits) and strategic (i.e., the long-term vision for city development) planning. Given the strong link with environmental justice [22], addressing urban overheating risk is a fundamental part of addressing urban inequalities in line with the levelling-up agenda within the UK and globally. Climate adaptation is a priority risk area with the UK [23] and is mandated within Clause 154 of the National Planning Policy Framework that outlines what the English planning system should deliver [24]. However, there is no nationally or globally accepted approach to assessing urban heat vulnerability. Moreover, there is often a disconnect between academic approaches to measuring heat vulnerability and those that can be used by local authorities. Academic approaches for measuring urban heat islands or heat vulnerability often use complex computational fluid dynamics (CFD) modeling (e.g., [25]) or commercial models (e.g., ENVI-met; see [26] for a systematic review); see [27] for a review on modeling studies focused on UHI and green infrastructure. These often require licensing agreements or datasets (e.g., satellite data) that are unfamiliar or unknown or only available at cost to non-academic built-environment practitioners. Academic methods may also require programming expertise or significant computing facilities. In contrast, most local authorities do not have the technical expertise, computing facilities, data access, or software licenses to use satellite data or undertake high-resolution urban climate modeling or the time or training to interpret the outcomes [28]. They are unlikely to have extensive urban temperature-monitoring networks [29]. Although toolkits originating from academic research are a useful resource, these are rarely updated or maintained once the project and its short-term funding ceases (e.g., BUCCANEER; [30]). Crucially, even when the heat vulnerability of an urban area is mapped, if heat vulnerability or climate adaptation is not embedded within local authority decision-making processes, then there is little means for this information to influence any built-environment decisions.
The open access approach described here addresses this disconnect between academic methodologies to model heat vulnerability and decision-making processes undertaken at local authorities, using three key innovations:
(1)
The approach is decision-centric (after [31]). It focuses on the objectives and values of the stakeholder and what can be done to address the problem. It contrasts with the science-first approach, which focuses on comprehensively modeling the problem, which is often time- and resource-intensive and can lead to inertia within decision making, as the focus is on the ability of the model, rather than on addressing the problem.
(2)
The approach was co-created with multiple personnel in the local authority, including policymakers responsible for climate resilience, urban forestry, city planning, and design, and the technical experts who provide GIS data to support city decision making. Moreover, the local authorities hold and maintain the data layers, so that they can govern and access the datasets to support decision making, thereby ensuring the long-term sustainability of the approach within city decision making.
(3)
The approach uses open access data and a geographic information system (GIS)-based approach that is commensurate with the technical skills, software, and resources available to local authorities. Using open access data ensures that the method is replicable and scalable beyond the case-study area. Using secondary data ensures that the responsibility for data quality and updating lies with the data provider (rather than resource-strapped local authorities). Except for Local Climate Zones (Section 2.2), the datasets are produced by official national institutes (Office for National Statistics, Met Office).
These key innovations have provided an approach that allows heat vulnerability to be incorporated into city design and statutory land-use planning processes for the first time. The approach is considered a Minimum Viable Product, meaning that it represents heat vulnerability sufficiently to support decision making, and it ensures that usage and feedback will allow for further development (note the contrast with a science-first approach, which would focus on creating a more comprehensive and robust model but require a substantially longer timeframe). Incorporating heat vulnerability into decision making as soon as possible is imperative. In the next decade, 80,000 homes will be built in Birmingham [32] the collaborative approach developed here means that heat vulnerability is now being considered within current and future developments. Furthermore, the approach is replicable for any village, town, or city within England and is easily adapted for the devolved nations of Wales, Scotland, or Northern Ireland, who have marginally different datasets, as planning is devolved within the UK (e.g., Scotland has the Scottish Index of Multiple Deprivation [33], rather than Indices of Multiple Deprivation [34]. The GIS approach is also replicable globally, using locally appropriate datasets (e.g., country-level datasets for surface temperature, green space, and deprivation, combined with the global Local Climate Zones dataset).
The manuscript is organized as follows. In Section 2, we consider the key scientific and practical questions required to develop an open access approach for embedding heat vulnerability within decision making: What factors make an urban area vulnerable to heat? What datasets can be used to quantify heat vulnerability? How can we use GIS to map heat vulnerability? In Section 3, we describe the case study area (Birmingham; Figure 1) and then present the application of the approach in Section 4. In Section 5, we discuss the suitability of the datasets and the decision-centric approach, considering the following questions: Do the datasets indicate heat vulnerability and support decision making? Does the approach support local decision making? What are the future opportunities and current limitations of this approach? Section 6 concludes the paper and provides a forward look.

2. Developing an Open Access Approach

2.1. What Makes an Urban Area Vulnerable to Heat?

Heat vulnerability is intrinsically linked to urban design and varies in space and time (Table 1). On the urban to neighbourhood scale, the highest urban temperatures are generally associated with a dense urban form and impervious surfaces [35,36], a low sky-view factor [37,38], and less green space [39,40]. On the street and building scale, the individual characteristics of buildings and their construction predominate. Tall buildings can lead to localized shading and the development of localized urban cool islands [41,42], and the size, orientation, and construction of buildings influence the shade they provide, the local air flow, and their albedo [43]. Trees can provide localized shade [44], thus reducing the cooling demand [45] and improving thermal comfort [46]. Anthropogenic emissions from buildings or transportation also add heat; in the UK, this is generally small in scale, very localized, and most significant during winter months, when the heat from the sun is low [47]. Building function and occupancy patterns are also crucial; the UHI intensity (i.e., the difference between urban areas and rural areas) is typically greatest at night and, therefore, most relevant where buildings are occupied at night, such as residential homes or care settings. Higher relative humidity is also associated with increased mortality and morbidity [48]. Overheating risk is also intrinsically linked to environmental justice [22]. The hottest urban neighborhoods are often those with high levels of multiple deprivation, where communities can have fewer options to cool down, such as opening windows or using mechanical cooling; have less access to public green space; and have generally poorer-quality living conditions, such as poor air quality, which exacerbates the impact of heat [16,19,40,49].
This study considered the heat vulnerability of an area and/or development to support the local authority’s planning decisions on the suitability of sites for development to inform the site-allocation process and development of planning policy framework. It did not consider the overheating risk of a particular dwelling, which, in addition to external temperature (the focus of this study) is linked to building size, orientation, solar gain, amount of insulation, provision of ventilation and shading, and occupancy behavior [50,51,52]. Internal overheating risk assessments suitable for use by local authorities and other stakeholders include TM52 The limits of thermal comfort: avoiding overheating in European buildings [53] and TM59 Design methodology for the assessment of overheating risk in homes [54], developed by CIBSE (Chartered Institution of Building Services Engineers); and the Good Homes Alliance toolkit [55].
Table 1. Factors influencing the heat vulnerability of an urban area. UHI = urban heat island. Modified from [56].
FactorEffectRepresentation in Heat Vulnerability Map
MeteorologyUHI is greatest in dry, still (anticyclonic) conditions with limited wind to mix and disperse heat. Included as a seasonal average for surface temperature from the HadUK-Grid (Figure 2a).
Time of dayUHI is often greater at night, as densely urbanized (compact) areas retain heat and cool more slowly. Included in decision-making flowchart.
Climate changeHot days are increasing in frequency and temperature. Trend toward drier summers (especially SE England), thus increasing drought risk. Drier weather reduces cooling by evapotranspiration.Not included. Could be included using UKCP18 projections available from UKCP18.
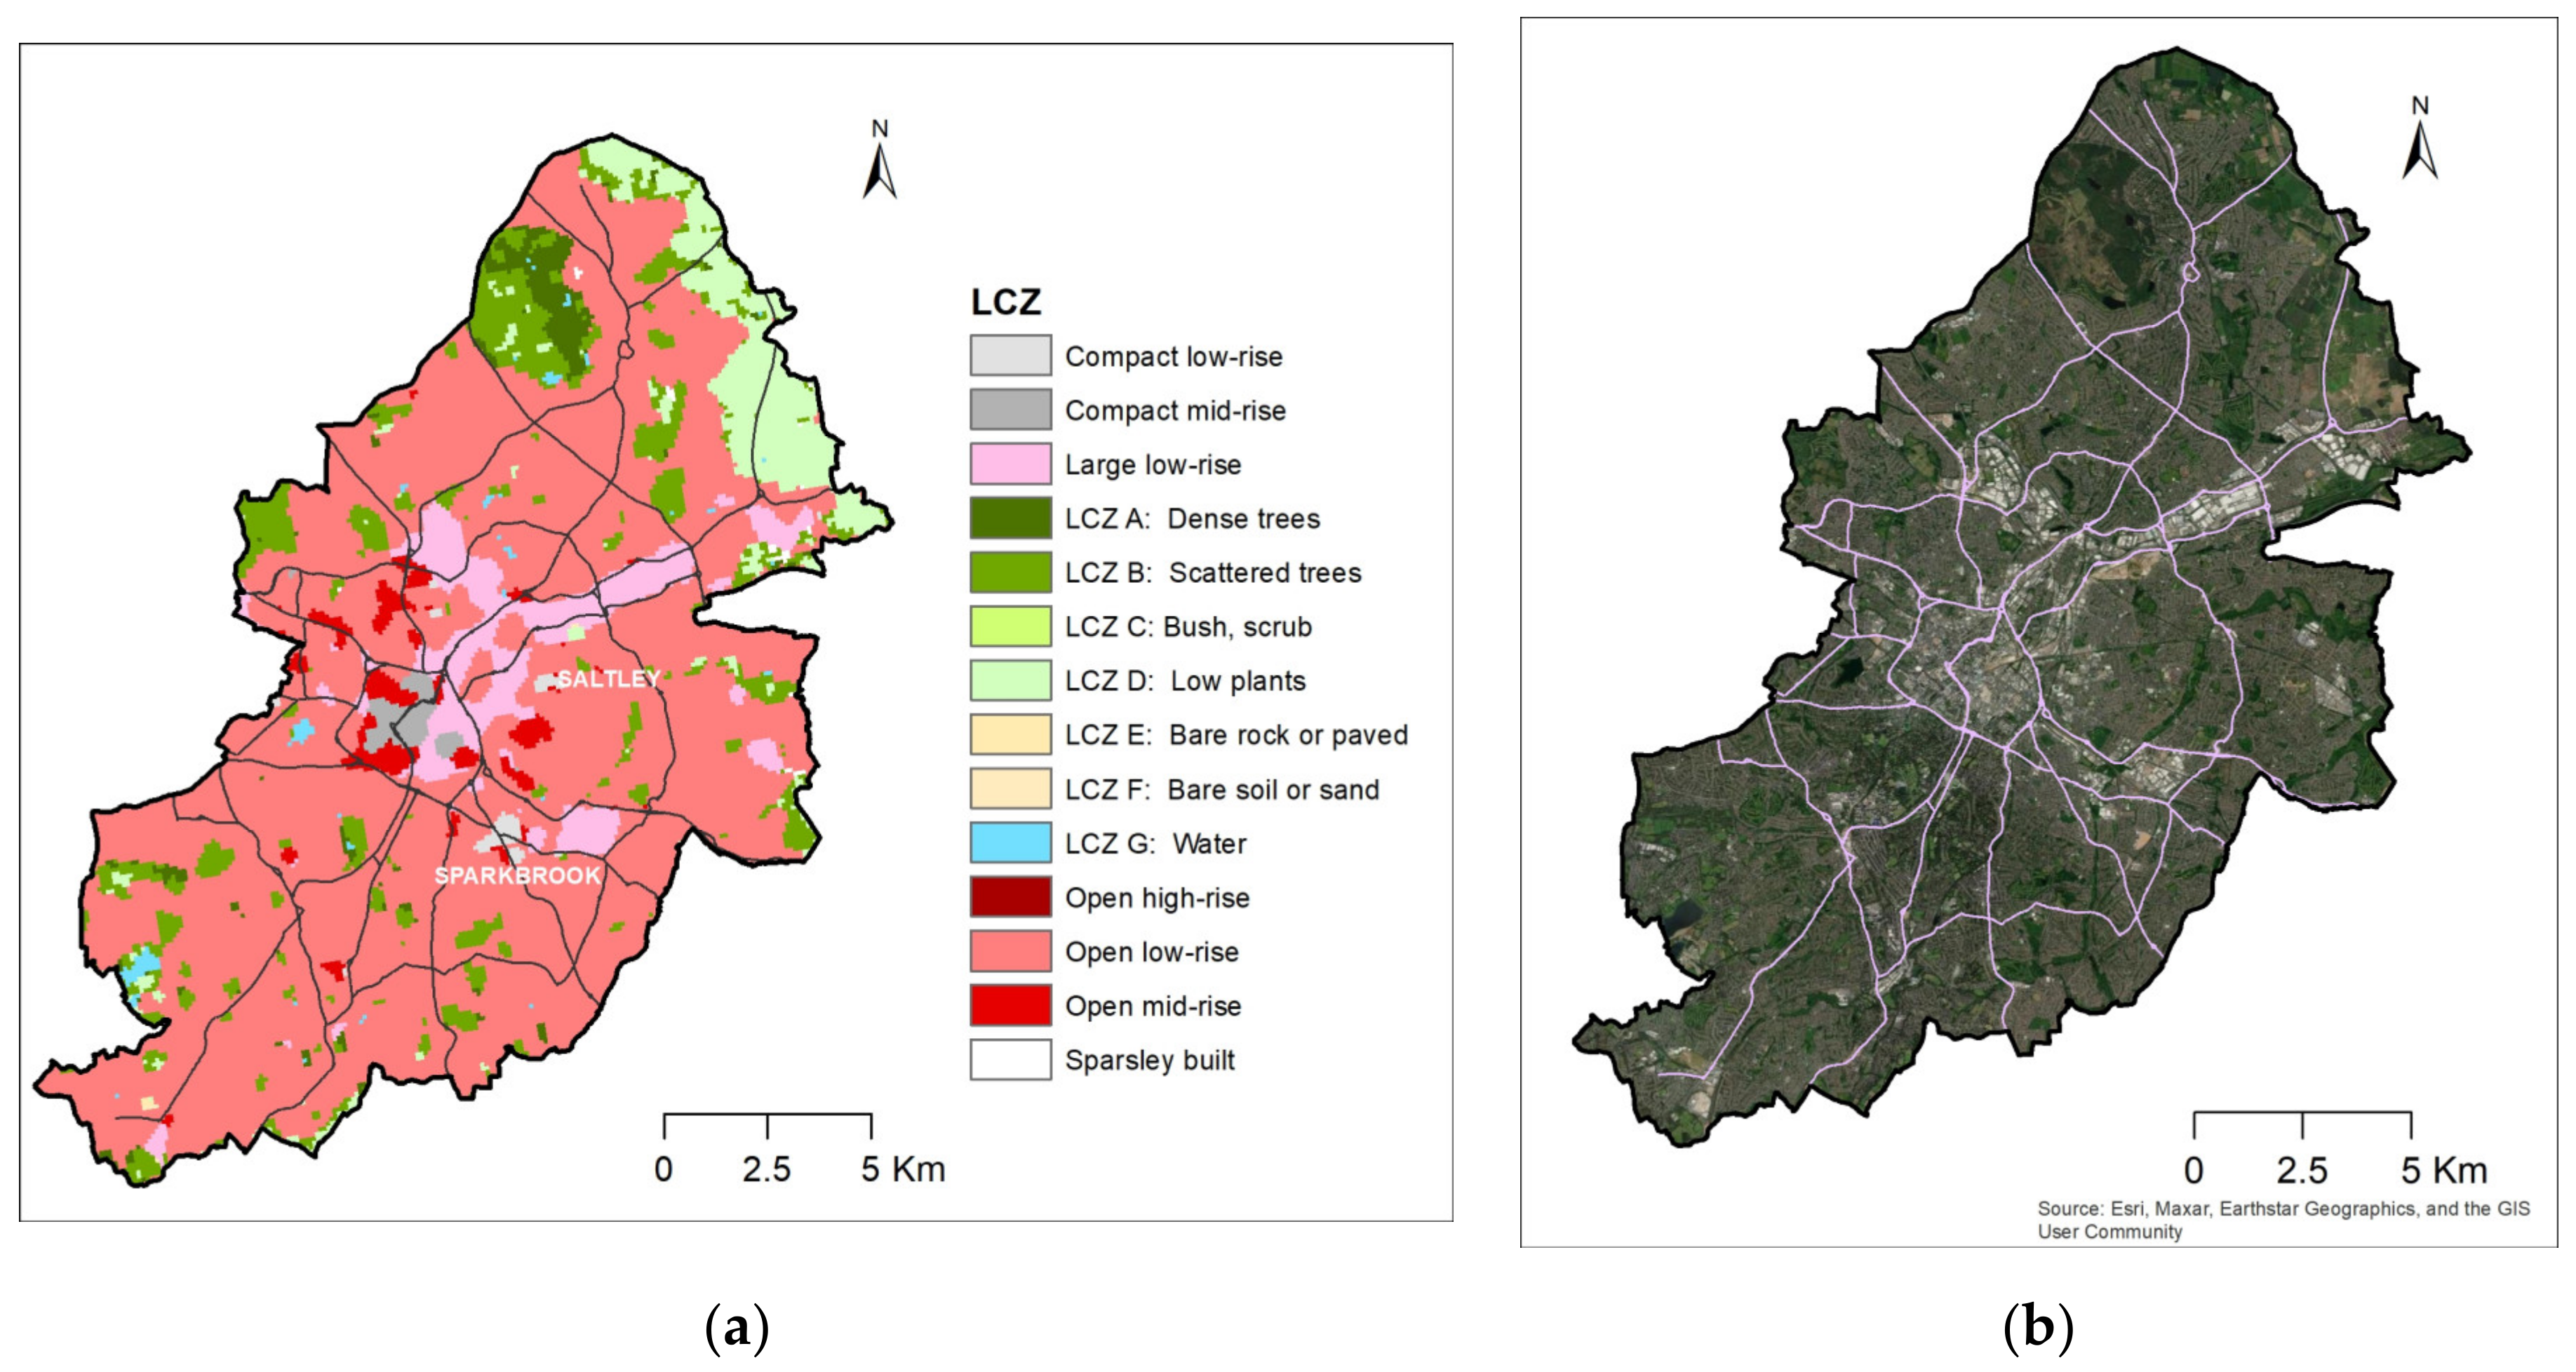
LandscapeTopography influences wind strength and direction, influencing dispersion of heat; urban areas in valleys or at the base of the slope may have reduced air circulation and heat dispersion. Coastal areas have onshore/offshore winds.Not explicitly included. Implicitly included via surface-temperature layer (Figure 2a) and Local Climate Zones (Figure 2b and Figure 3a).
Urban formThe 3D form of the street and neighborhood, including the street width and building height, determines air flow, sky view factor, and how an area can lose heat.Included via UK Climate Zones (Figure 2b and Figure 3a).
Building functionBuilding function and occupancy pattern (e.g., residential versus commercial) infer overheating risk. Care homes, schools, and hospitals have vulnerable populations at risk of overheating.Included in decision-making flowchart (Section 4.4).
Materials and ventilationMaterial type and color determines albedo and heat storage. A high proportion of glazing can cause excessive heat storage, and inadequate ventilation can prevent heat dispersion and cooling. Of greater importance on the building scale rather than the urban scale.Neighborhood-scale albedo is implied via Local Climate Zones (Figure 2b and Figure 3a).
EmissionsWaste heat from transport, industrial/residential heating/cooling and people adds warmth to urban areas.Not explicitly included. Partially implied via Local Climate Zone, as emissions are linked to urban density and anthropogenic land use (Figure 3a,b).
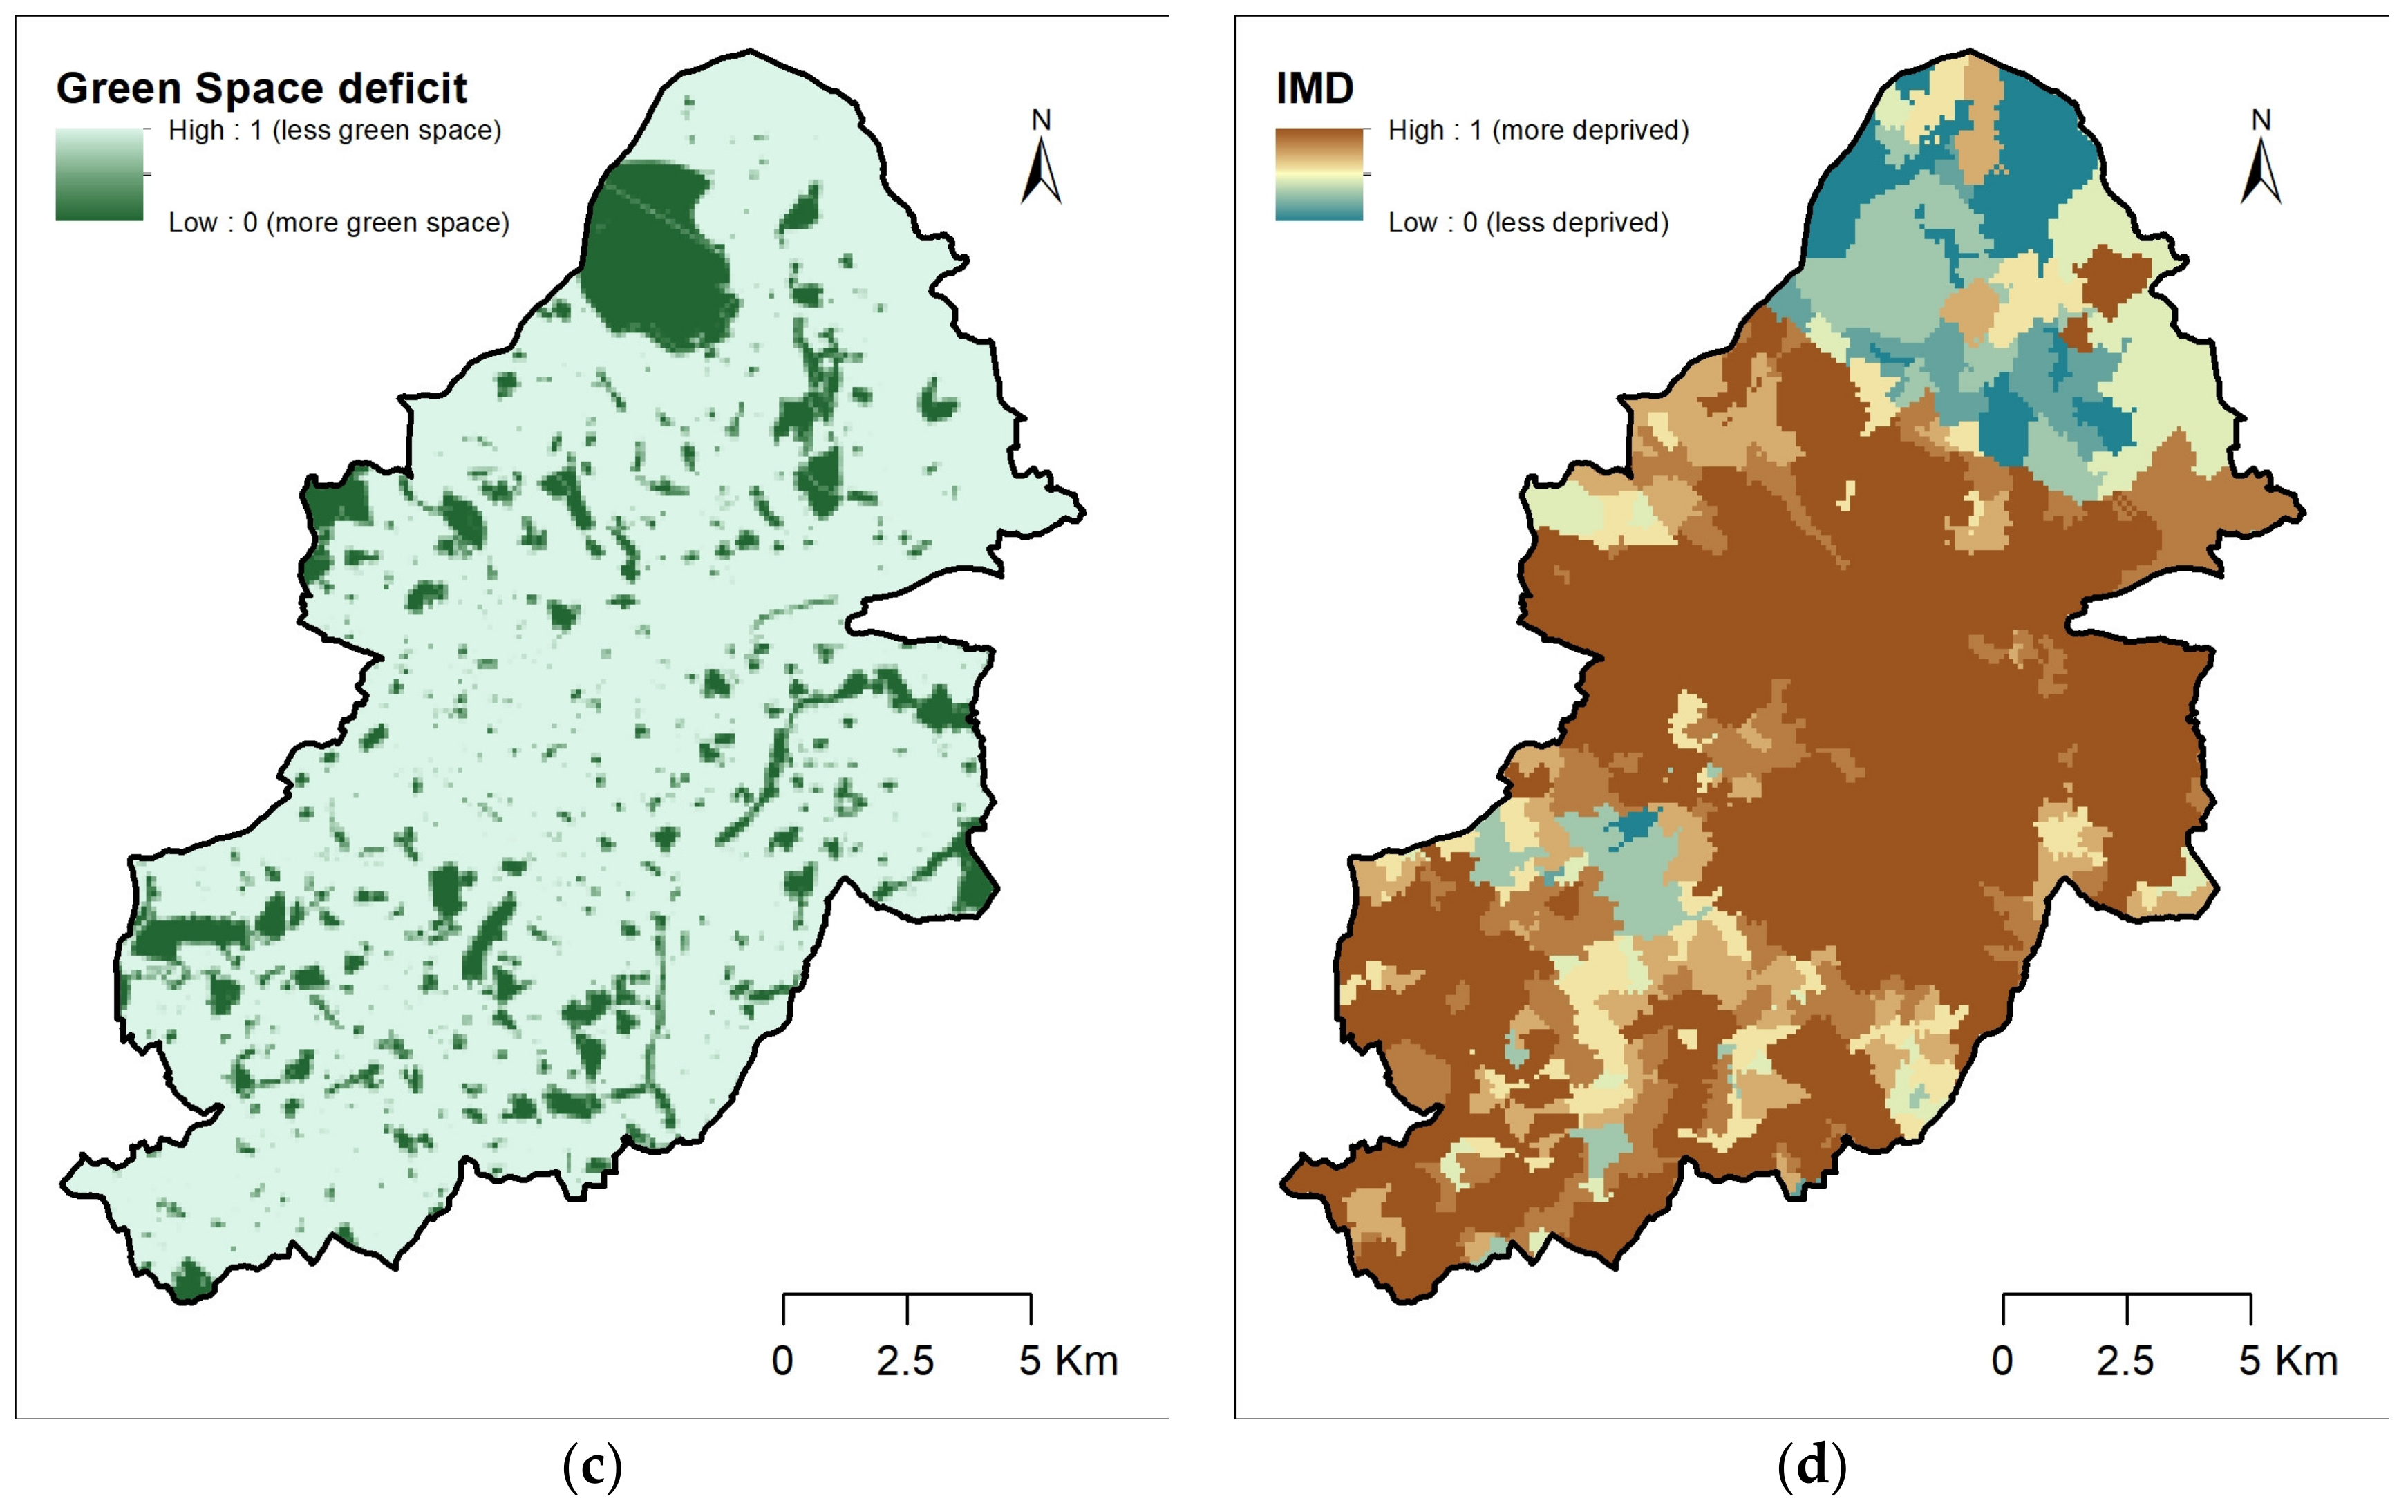
Blue and green infrastructureBlue/green infrastructure provides cooling via high albedo, shade, evapotranspiration, and sky view, on a range of scales from local (green roof) to neighborhood (park) and citywide (via strategic design of green infrastructure). Water is essential for cooling via evapotranspiration and can create urban cool islands during the day.Green infrastructure included via OS MasterMap Greenspace Layer (Figure 2c). Larger areas of green and blue infrastructure are included via Local Climate Zones (Figure 2a and Figure 3a). Urban greening is also considered within the urban green factor in the flowchart (Section 4.4).
Population vulnerabilityCommunities living in low-income areas are more likely to reside in housing that is more likely to overheat and/or have pre-existing health conditions that increase vulnerability to overheating. Included via IMD (Figure 2d).

2.2. Creating a Decision-Centric Approach for Assessing Heat Vulnerability

This decision-centric approach establishes heat vulnerability within an urban area by using datasets that encompass the key factors that lead to heat vulnerability (Table 1) but without overcomplication. Increased complexity does not always lead to increased understanding, and every additional layer adds to the resources required for data management and stewardship by the local authority, as well as adding additional uncertainty and error, and consequently leading to inertia in decision making [31]. For widespread take-up by local authorities, the approach should be replicable and scalable to allow for comparisons, and the underpinning data must be maintained and updated regularly to ensure quality. It must also be at a resolution suitable for development-level decision making within urban areas. Table 2 evaluates those datasets that could be used against these criteria. We prioritized those datasets that were open access. We propose four datasets that, when combined, can characterize urban heat vulnerability within this decision-centric approach.
Table 2. Datasets that could be used to determine heat vulnerability. Satellite datasets were excluded from this table for their relatively coarse spatial resolution as compared to the size of Birmingham. For urban areas without ground-based observations, satellite data could provide land-surface temperatures or a measure of greenness from NDVI (Normalized Difference Vegetation Index).
FactorDatasetSourceOpen AccessFormatExtentQuality AssuredComments
Meteorology/ClimateSurface temperatureHADUK Grid
[57]
Y1 km raster UK YResolution coarse but should reflect average summer climate. UHI not explicitly included.
Birmingham Urban Observatory
[29]
Via University of BirminghamVector-point sensors
spacing ~3 km
B’ham 2013/14 onlyY
[29]
Data 2013/14 only; UHI can be calculated. Using this dataset limits approach to Birmingham only.
Urban FormLocal Climate ZonesWUDAPT
[58]
Y100 m rasterGlobal, but not completeY [59]A category for blue and green infrastructure is also present.
OS MasterMap Topography LayerOrdnance Survey [60]Free for public service and educationVector polygonsGreat BritainY (by Ordnance Survey)Includes building heights and attributes to make 3D visualizations.
Building HeightsEMU analytics
[61]
Noncommercial product VectorGreat BritainUnclearBuilding outlines, heights, roof slope, and aspects.
Blue and Green InfrastructureOS MasterMap Greenspace LayerOrdnance Survey [62] Free for public service and educationVector polygonsGreat BritainY (by Ordnance Survey)Most detailed set of public and private green spaces and sports facilities. Urban areas only.
OS Open GreenspaceOrdnance Survey [63]YVector-polygonsGreat BritainY (by Ordnance Survey)Public parks, playing fields, sports facilities, play areas, and allotments. Urban and rural areas.
Tree CanopyEnvironment Agency VOM [64]Y1m rasterEnglandNo manual QC and editing of the output, except visual checksLidar product for all vegetation greater than 2.5 m.
Tree CanopyNational Tree map
Blue Sky [65]
Non-commercial productVector points and polygonsGreat BritainunclearCanopy information for every tree greater than 3 m in height. Dataset that underpins tree-canopy information in [66].
IMDMHCLG [34]YCSV table for LSOA EnglandBy Office of National StatisticsGovernment calculated local measures of deprivation.
Figure 2. The four layers used to compile the heat vulnerability map, each scaled 0–1. From top left in clockwise direction: (a) Mean Tmax for summer months (June, July, and August) between 1981 and 2000 [57]. (b) Local Climate Zones from [58] scaled using the values provided in Table 3. (c) Green space deficit [62] and (d) Indices of Multiple Deprivation (IMD) [34]. The location of Birmingham within the UK is shown in Figure 1.
Sustainability 15 13501 g002aSustainability 15 13501 g002b
Figure 3. (a) Local Climate Zones in Birmingham. Data provided by WUDAPT [58] and (b) visual satellite imagery (source provided on map). Major “A” roads are shown on the map. The Central Business District is located within the inner ring road shown in the center of the map.
Sustainability 15 13501 g003
Table 3. Overheating-risk value for Local Climate Zones [67].
LCZ CategoryLCZ DescriptionLCZs’ Overheating-Risk Value
1Compact high-rise1.0
2Compact mid-rise1.0
3Compact low-rise0.9
4Open high-rise0.8
5Open mid-rise0.7
6Open low-rise0.4
7Lightweight low-rise0.5
8Large low-rise0.6
9Sparsely built0.1
10LCZ 10: Heavy industry1.0
11LCZ A: Dense trees0.1
12LCZ B: Scattered trees0.1
13LCZ C: Bush, scrub0.1
14LCZ D: Low plants0.1
15LCZ E: Bare rock or paved0.1
16LCZ F: Bare soil or sand0.1
17LCZ G: Water0.1
Surface temperature varies across urban areas, especially large metropolises with varying topography and landcover. Options (Table 2) ground observations, or modeled output. The highest resolution open access dataset for the UK is the HadUK-Grid [57]. We selected the maximum daily temperature (Tmax) for 1981–2000, for summer (June, July, and August) to characterize the land-surface temperature. The HadUK-Grid was selected in preference to Birmingham Urban Observatory because it is national (and therefore other urban areas can replicate the approach) and has a greater temporal duration.
Local Climate Zones (LCZs): Surface-temperature observations capture the broadest temperature variability, and LCZs provide a more localized understanding of neighborhood-scale temperature via the consideration of the urban form [67]. LCZs classify the urban surface into 17 categories based on surface structure (e.g., building height and density) and surface type (impervious versus pervious). Ten of the categories describe the built environment, and seven describe the natural environment. These are available for urban areas globally, at a 100 m resolution [58,59]. LCZs were selected in preference to OS MasterMap Topography and Building Heights for their climatological origin; the LCZs classify the urban form into areas that are likely to have greater or lesser UHI magnitude and therefore are a suitable proxy for the microclimate effects that are not incorporated into surface temperature maps.
Green Space is generally associated with cooler temperatures, especially at night-time, when radiative heat loss is greater and cool wells of air can provide localized cooling. Green space can, where there is appropriate shade and access, provide daytime cooling for urban residents. The OS MasterMap Greenspace layer includes accessible and non-accessible green space in urban areas and is free to access for public service and educational usage [62]. This was selected in preference to the OS Open Greenspace layer because it includes private green spaces and, therefore, more comprehensively reflects the cooling associated with green space.
Endemic population vulnerability can be quantified using the Indices of Multiple Deprivation (IMD; [34]). The IMD are the official measure of deprivation in England and combine datasets on income (22.5%), employment (22.5%), health deprivation and disability (13.5%), education, skills training (13.5%), crime (9.3%), barriers to housing and services (9.3%), and the living environment (9.3%); the weighting of each characteristic in the final score is given in parentheses [34]. The dataset is open access and provided at Lower Super Output Area (LSOA), which has an average population of 1500 and is relative, with areas ranked from least to most deprived. Within the IMD, the living-environment dataset is composed of indoor factors (quality of housing) and outdoor factors (air quality and road traffic accidents) and, thus, is not double counted with other environmental datasets used in this study. The IMD are the standard measure of inequalities within England and are used for a variety of purposes within local authorities.
When combined, these four layers incorporate most of the factors driving heat vulnerability (Table 1).

2.3. Developing the GIS Approach

Geographical Information Systems (GIS) allow for the rapid analysis and manipulation of spatial sets. They are commonly used within local authorities to manage environmental and infrastructure datasets who therefore have the in-house resources and infrastructure (e.g., licensing and existing access to datasets) to manage a decision-support tool utilizing this approach. GIS can be used to process, scale, and add the four datasets (Section 2.2) to create a heat vulnerability layer.
Within GIS, the raster calculator function can be used to add the different layers to create a heat vulnerability layer. Initially, each data layer must be preprocessed to a raster format, with the same projection and resolution, and it must be scaled between 0 and 1 to enable addition. A resolution of 100 m was selected as a balance between the local scale required for development-level decision making and the original resolution of the input datasets. Particularly, the Local Climate Zone (at 100 m resolution) dataset is categorized and, therefore, cannot be subsampled without merging categories. A fishnet, i.e., a feature class of square cells of 100 m, using the British National Grid (BNG) coordinate system, was used as a template for conversion (Create fishnet). Each specific layer is defined as follows:
Surface temperature [57]: This gridded dataset has a resolution of 1000 m, using the BNG coordinate system. It is too coarse for development-scale decision making. Accordingly, this was resampled to 100 m (Resample) and then rescaled between 0 and 1 (Rescale by function), where 1 represents the highest temperature on the grid (20.8 °C), and 0 represents the lowest (19.9 °C). This was the only layer that was subsampled, and the validity of this resultant layer is discussed in Section 4.1.
Local Climate Zone (LCZ; [58]): This gridded dataset is available at a 100 m resolution, using European Terrestrial Reference System 1989. The data were reprojected to the British National Grid and resampled using the “nearest neighbor” interpolation to the fishnet template (Resample). As LCZ uses a discrete classification system, a value between 0 and 1 was allocated to the different land-cover surfaces within the study area (Table 3).
Green space deficit [34]: This vector layer uses the British National Grid coordinate system. The Intersect and Calculate Geometry functions within ArcGIS were used to determine the percentage of green space within each fishnet cell. These were rescaled (Rescale by function) between 0 and 1, where 0 represents 100% green space within the cell, and 1 represents 0% green space, and the layer was converted to a raster format (Polygon to Raster).
Indices of Multiple Deprivation (IMD; [34]): The IMD are available as a table for each LSOA. To convert, the majority decile value per 100 m × 100 m was allocated to each individual fishnet cell and then converted to raster (Polygon to Raster); then, the data were normalized between 0 and 1 (Rescale by Function).

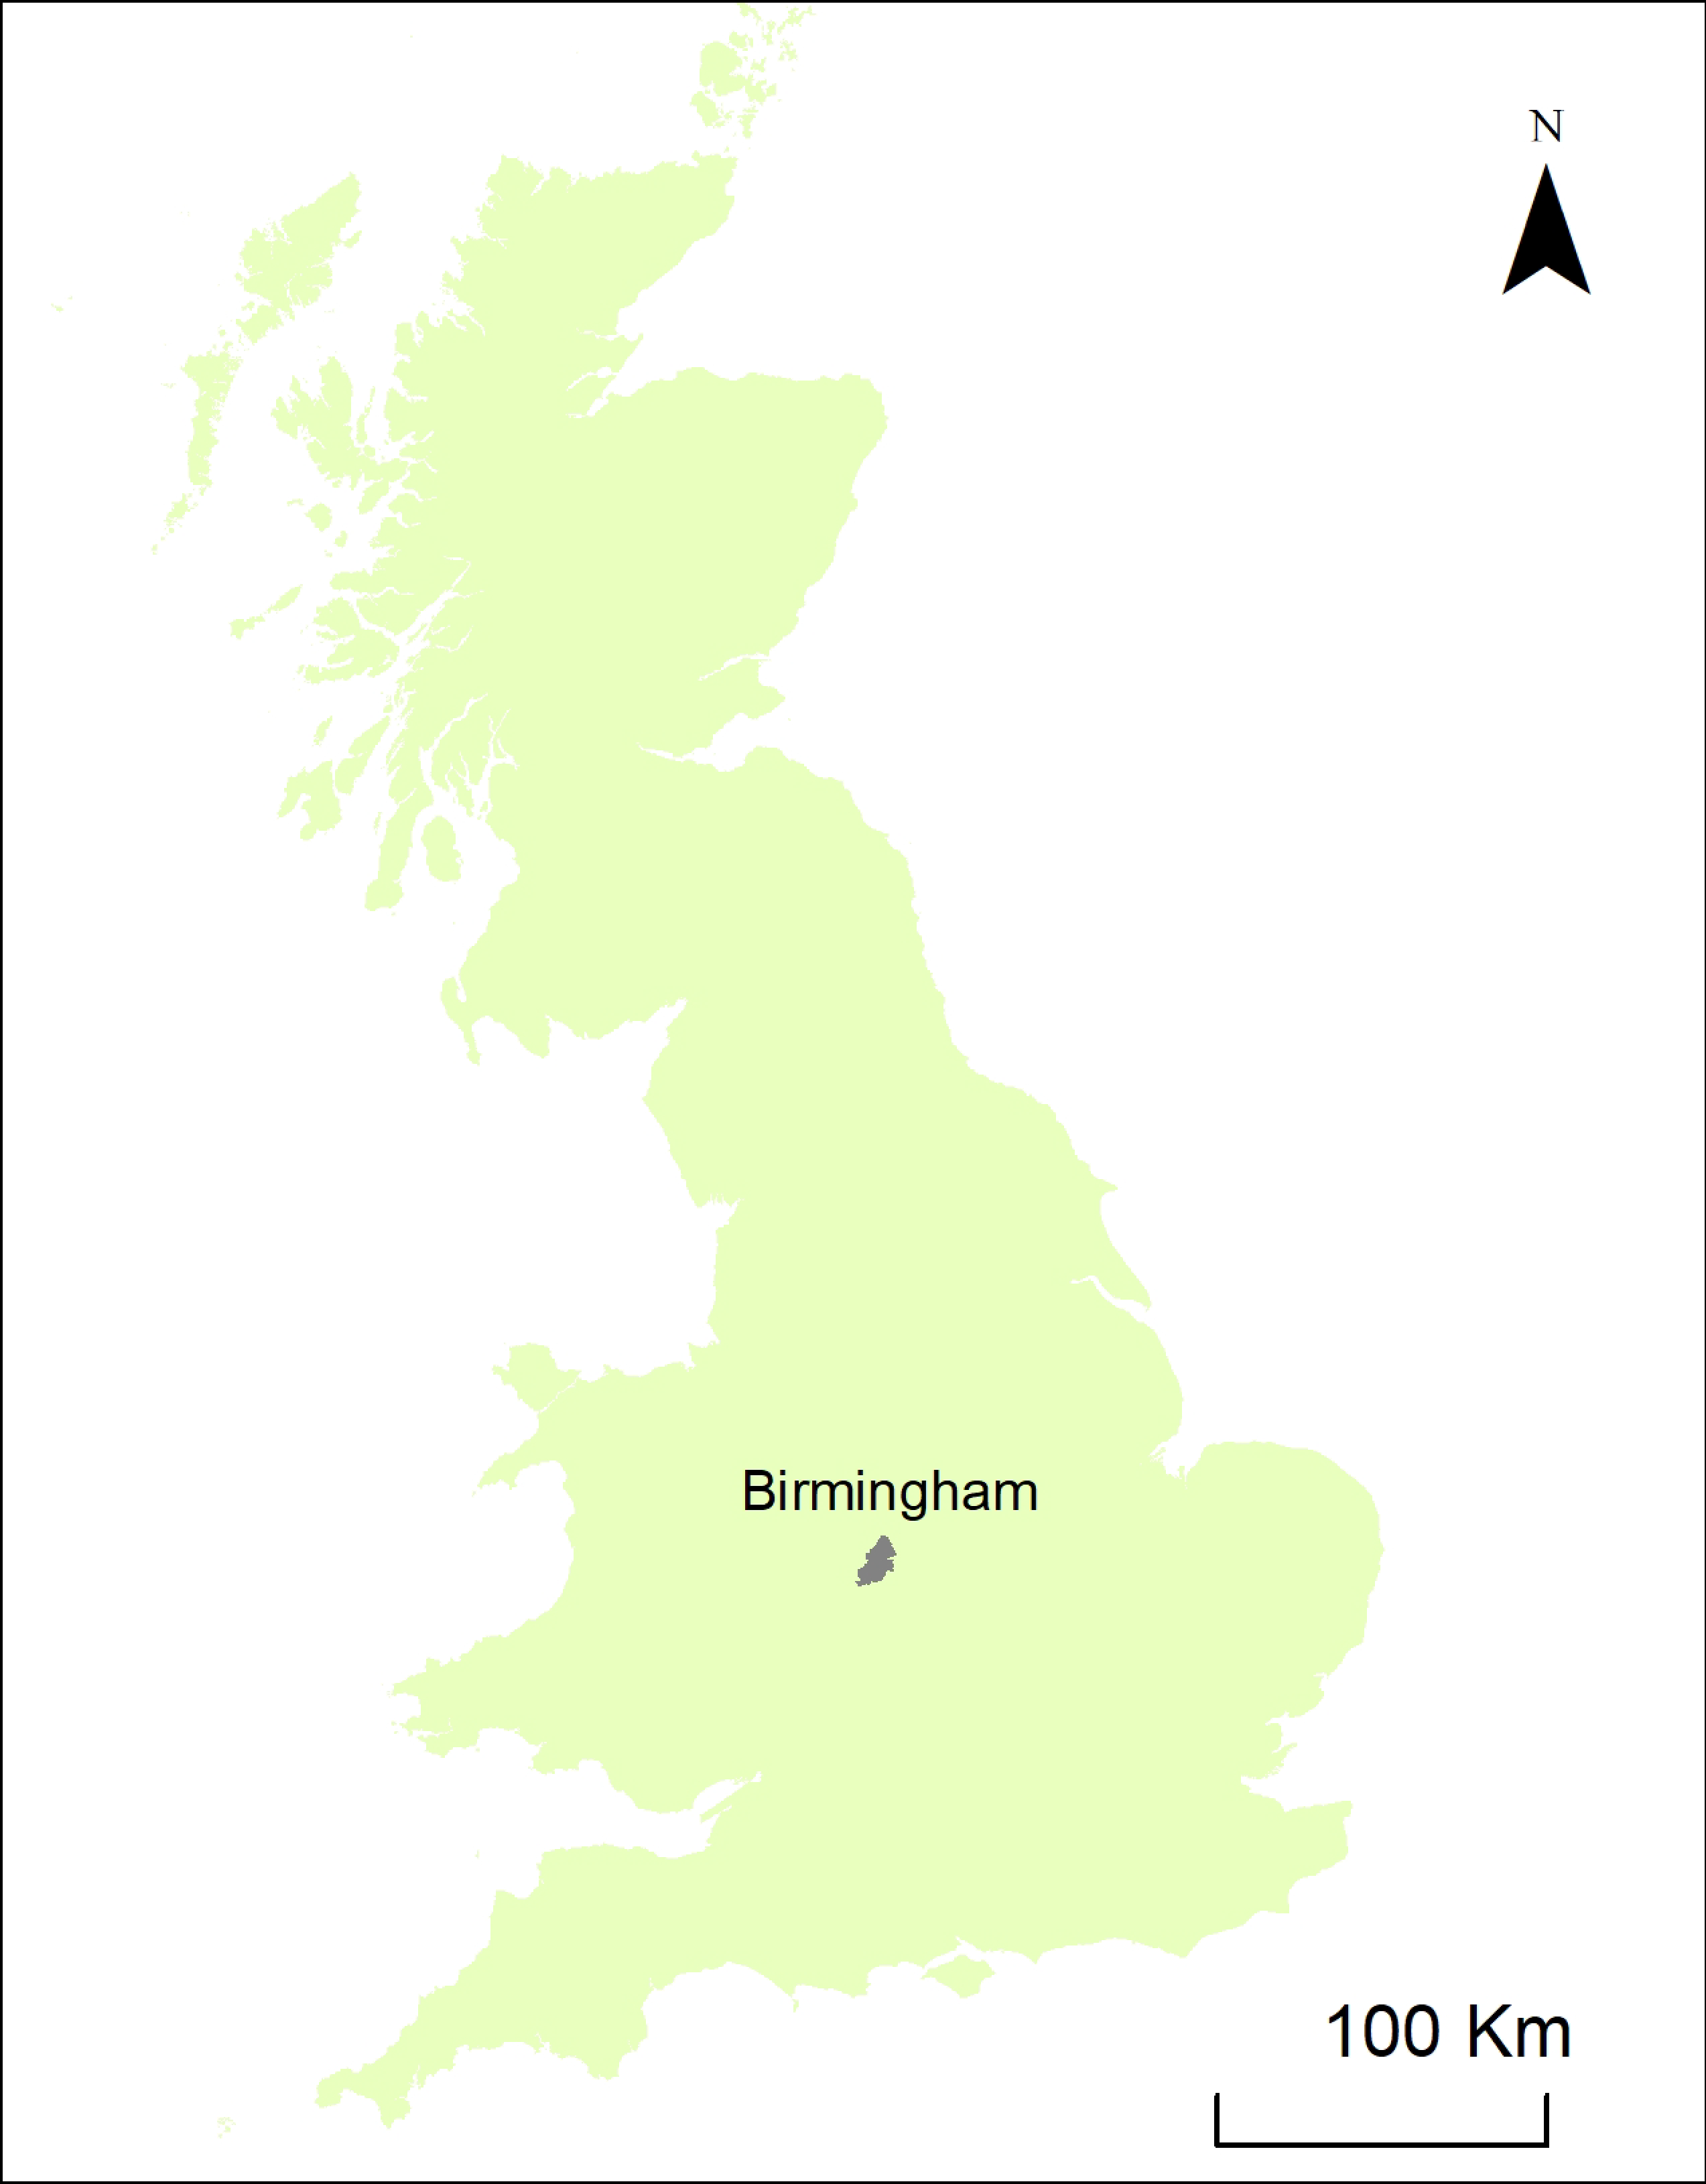
3. Case Study Area—Birmingham, UK

Birmingham is the UK’s second biggest city, with a population of ~1.2 million, located within the broader West Midlands conurbation, with an approximate population of 5 million. Birmingham City Council (BCC) is a large local authority that is responsible for the governance of Birmingham. The city has undergone significant redevelopment in the last decade, particularly within the city center, and of former industrial areas. There is intense pressure for development to address the housing deficit (c 80,000 new homes before 2040; [32]), but the city is constrained geographically within a green belt.
In recent years, the BCC has placed an increasing focus on the importance of nature and green space within the city. In 2014, Birmingham became the UK’s first Biophilic City [68], signaling its commitment to put nature at the heart of the planning. Birmingham has been a Tree City of the World since 2020 [69] and is the only local authority in Europe to have an Urban Forest Master Plan [70] supported by a GIS-based decision-support tool [66]. Between 2018 and 2022, the Naturally Birmingham program reconsidered the way green space is managed within the city, raising its profile, so that the long-term management and care of urban green space is embedded within city strategies and ambitions [71]. Tree-planting improvements in neighborhood green spaces are considered an important means to address historic inequities in access to quality green space within the city [72]. In 2014, the BCC issued a climate adaptation plan when these were mandated by central government; however, there was no delivery framework or lines of governance to translate this into action. In 2019, following the School Strikes for the Climate, BCC declared a Climate Emergency, and commissioned a decarbonization strategy, and in 2021, it appointed an Assistant Director responsible for the Route to Net Zero. BCC is currently in the draft stages of its next development plan, which will guide how the city will develop in the future and provide policies to guide decisions on development proposals and planning applications up until the year 2042. Tools can therefore assist in decisions regarding the appropriate locations for development and site allocations within the emerging Local Plan, as well as on the different densities and function of developments (e.g., commercial, residential, and industrial) and open space provision.
Birmingham hosted an urban meteorological network between 2012 and 2014 [73], and the city has been a focus for urban climate research [74], using remote sensing (e.g., [75,76]), modeling (e.g., [11,18,77], and land-based observations [78] or mixed methods [79,80]. Although, some of this work has been undertaken in collaboration with BCC, there has been a disconnect between academic research and local authority decision making, and to date, previous research outputs have not been embedded within city design and planning policies.
This project builds on earlier research, within the context of the BCC’s spheres of decision making. We have worked with the city’s design and planning team to raise awareness of heat vulnerability within the city, within the broader area of climate risk. We have championed for climate change to be included in the Strategic (Corporate) Risk Register, and in 2021, SR6.3, outlining a climate resilient and adapted council and city, was added, with a specific risk description: failure to assess and prepare the council for risks posed by climate change and city-wide resilience and adaptation measures. As such, climate risk and adaptation (including heat vulnerability) must be considered against all future developments. This heat vulnerability map, which is part of the forthcoming climate risk and vulnerability assessment, forms the underpinning evidence base to support decision making and will feed into the next Birmingham Development Plan. We have worked with the GIS team to ensure that they will adopt these datasets and embed the maintenance and updating of datasets within their operations. Moreover, given the importance of green space for climate resilience, this project is aligned with the Urban Forest Master Plan in terms of its approach, by using compatible and shared GIS layers, and in regard to its vision, via close collaboration and the shared understanding of mutual agendas.

4. Results

4.1. Individual Data Layers of the Heat Vulnerability Map

Figure 2a–d show the individual data layers used to compile the heat vulnerability map rescaled between 0 and 1. Surface temperatures (Figure 2a) range between 19.9 °C and 20.8 °C, with cooler mean temperatures in the southwest of Birmingham and warmer mean temperatures toward the northern and eastern areas. The HadUK Grid (Met Office 2018) does not explicitly include any effects of the UHI; however, this southwest spatial gradient is consistent with previous studies that have measured surface temperatures across Birmingham by using an urban meteorological network that was operational in 2013 (see Figure 3; [75]).
Figure 2b shows the LCZ and, by proxy, those areas where we expect the UHI to have the greatest intensity. The areas with the highest values are observed in Central Birmingham, where compact mid-rise (OHR = 1.0), large low-rise (OHR = 0.6), and open mid-rise (OHR = 0.7) predominate (Figure 3a,b). These land-cover types are associated with a higher UHI magnitude (Section 2.1). A comparison with the previous studies that have measured the UHI by using remote sensing indicates that the Birmingham city center has the highest surface UHI magnitude (see Figure 4; [75]), thereby giving us confidence that the LCZ provides a proxy for the magnitude and location of the UHI. The city center includes a mix of light industry and commercial and residential properties. There are also higher values associated with the neighborhoods of Saltley and Sparkbrook, driven by the LCZ of compact low-rise (OHR = 0.9). Although these neighborhoods have more compact development, neighborhoods with similar forms are classified as open-low rise (OHR = 0.4). This is discussed in Section 5.1.
The green space deficit layer (Figure 2c) clearly identifies Sutton Park, located within the north of Birmingham, and that a central band of the city has less green space than regions to the southwest and north. In terms of deprivation, on a national scale, the IMD show that 43% of Birmingham lives within the 10% most deprived areas in England [81], and this remained unchanged from 2015 to 2019. Figure 2d shows the IMD across Birmingham, relative to the IMD’ rankings within the city. There are distinct areas of lower and higher deprivation: the northern most Birmingham has low IMD scores; the central swathe of the city has medium and high IMD scores; there is more variability in the southwest of the city.

4.2. Heat Vulnerability Map

Figure 4a shows the heat vulnerability map for Birmingham, which was created by compiling the four data layers described in Section 4.1. The heat vulnerability score (i.e., the value of each individual pixel) ranges from 0.6 to 3.8, with a mean of 2.6 and a standard deviation (SD) of 0.6. The standard deviation and mean were used to classify the variability in heat vulnerability across the city into five categories (Table 4). The road network shows the location of the city center; the inner-ring road is located at the center of the map, truncated by the A38, a key trunk road aligned approximately southwest–northeast. Figure 4b provides the heat vulnerability by Lower Super Output Areas (LSOA); these are geographic areas with an average population of approximately 1500 residents, or 650 households, commonly used to underpin local authority’s decision making. Heat vulnerability varies across this city; the lowest vulnerability is located to the north and the southwest, and the highest vulnerability in the middle region, extending eastward. Indeed, the highest vulnerability to heat is not located in the city center but toward its north and east, extending along the trunk roads that lead northeast from the city. Here, surface temperatures are slightly higher (Figure 2a), and there are multiple neighborhoods with higher levels of socioeconomic deprivation (as measured by the IMD; Figure 2d) and areas of large low-rise industry and commerce (Figure 3a,b). Green space acts to reduce heat vulnerability on a more localized scale; the greenways associated with the Rivers Tame and Cole are highlighted by the map, as are large areas of green space, such as Sutton Park, Woodgate Valley, or greener neighborhoods such as leafy Edgbaston (Figure 2c and Figure 4a).

4.3. Testing at the Local Scale

To examine the drivers of heat vulnerability on a local scale and understand the variation across the city, the highest scoring LSOA from each decile was examined in detail (Figure 4b). Figure 5 describes how the input layers contribute to the heat vulnerability in each of the selected LSOAs, and Figure 6 quantifies the variability within each LSOA and across the city. There were several findings.
Firstly, the three lowest-decile LSOAs (1–3) are in the southwest of the city, where the surface temperature is low, the green space deficit is lower, and the IMD is lower. The five highest-decile LSOAs have an IMD of one; the top three decile LSOAs have a green space deficit score of one. Two of the LSOAs studied are geographically close (5,7); here, differences in the heat vulnerability score are driven by LCZ classification. As much of Birmingham is classified as LCZ open low-rise (Figure 2c), the variation in heat vulnerability is driven by surface temperature (with the coolest surface temperature being in the SW), IMD, and local access to green space.
Secondly, within individual LSOAs, variations in the interquartile range and range, and outlier values were driven by local changes in the green space deficit which were sometimes linked to changes in the LCZ (e.g., classification of tree or low plants). This is intuitive; green space should have lower heat vulnerability because of the cooling properties of vegetation, and also by its nature; people do not reside in parkland.
Thirdly, although the LCZ open low-rise is predominant across all LSOAs (excluding the seventh, ninth, and tenth decile LSOAs), the number of trees, the size of their canopies, and the number and size of gardens within this LCZ differs. For example, LSOA 3 has fewer trees and gardens than other areas classified as open low-rise and is a little more compact. This will change the heat vulnerability, but this is not reflected in the LCZ scoring.
Lastly, testing at the local scale highlighted occasional misclassification errors. In LSOA decile 3, a cell is classified as green space, but visual inspection indicates this to be a school sports court with green surfacing. In LSOA decile 6 and 7, there are green areas which are present on the visual inspection and on the green space layer that are incorrectly classified as open low-rise on the LCZ map (Figure 3).

4.4. End-User Application and Ongoing Work

Once the heat vulnerability of an area has been assessed (Figure 4), the local authority or other stakeholder (e.g., business or infrastructure owners and operators) requires a means to incorporate this information within the decision-making processes. This work was undertaken in collaboration with the city design team at Birmingham City Council, and Figure 7 shows a conceptual flowchart that allows the heat vulnerability map to support decision making for prospective development areas, and not to prevent development from taking place in vulnerable areas, to ensure that any development that does take place is heat sensitive. The flowchart also enables the function of the development to be considered within the context of climate vulnerability; overheating risk is most significant in residential accommodation.
The flowchart uses the Urban Greening Factor (UGF), a tool developed by the Greater London Authority (GLA) to evaluate the quality and quantity of urban greening on development plans, ultimately to integrate and mandate greening into the design process [82]. The UGF is calculated by multiplying a value for urban greening on the development (e.g., semi-natural vegetation = 1, trees in pits = 6, and amenity grassland = 0.4; see GLA guidance for full descriptors) by the surface area of the particular covering, as a ratio of the total site area. Within the GLA, Local Plans can specify a UGF; the recommendation is 0.3 for commercial developments or 0.4 for residential developments. The UGF is currently being trialed in Birmingham, and the values proposed in the conceptual framework are for discussion and testing on prospective development sites as this program of co-created work progresses.
Where development is deemed to contribute to heat vulnerability or take place within a heat vulnerable area, there is a requirement to incorporate specific heat-mitigation measures. These may include green infrastructure to cool via shading or evapotranspiration (for a review, [83]); a more open urban form that allows ventilation and heat loss via advection (e.g., [84]); cool pavements, which reflect radiation and store less heat (for a review, see [85]); or architectural design that reduces heat gain and promotes ventilation (see chapters within [86]). Measuring the extent to which any or all heat mitigation measures can reduce heat vulnerability on a development could be evaluated by high-resolution built environment models such as ENVI-met [87], with the cost borne by their developer. The approach outlined here can be used to understand changes on the scale of the approach, e.g., changes to the LCZ or green space significant at 100 m resolution. This is the focus of ongoing action research with the local authority.

5. Discussion

This project worked in collaboration with a large metropolitan local authority to develop a decision-centric approach to understanding heat vulnerability. Here, we consider the suitability of our approach, both in terms of the data selected (Section 5.1) and our decision-centric approach, against the principles for action research for adaptation in practice [88] (Section 5.2). Future opportunities and ongoing development of the approach are described in Section 5.3.

5.1. Do the Datasets Indicate Heat Vulnerability within an Urban Area to Support Decision Making?

There are several reasons to be confident that this MVP approach indicates heat vulnerability with sufficient accuracy to support local authority decision making. Each of the four datasets that combine to create the heat vulnerability maps was independently validated via an academic peer review [57,58,59] or government data services (Ordnance Survey [34,62]). Together and/or used in combination with an appropriate end-user flowchart (Figure 7), these four datasets represent the main socioeconomic factors that contribute to the heat vulnerability of an area (Section 2.1 and Table 1). Climate change is not currently included within the approach but could be (see Section 5.3). Map Algebra is an established approach to combining GIS layers.
Furthermore, previous academic research locates the daytime and nighttime UHI over the central swathe of Birmingham for different weather conditions (e.g., [75], where this approach calculates high levels and the highest levels of heat vulnerability. An Environmental Justice Map (EJM; [72]) produced by the Birmingham City Council highlights that those areas that are least equal in terms of environmental justice are co-located with those of highest heat vulnerability. The EJM is composed of five layers, including environmental data (access to green space, flood risk, and modeled UHI) and socioeconomic data (IMD and health inequalities through Excess Years of Life Lost); note that the IMD is common to both approaches. Although both the UHI map [75] and the EJM [72] map have different variables, they provide reassurance that the approach outlined here, using different and open access datasets, can identify heat-vulnerable areas with sufficient accuracy to support decision making. As such, it is reasonable to suggest that the approach can be provided in other urban areas.
Lastly, testing on the local scale (Section 4.3) showed that satellite data combined with contextual information (e.g., location within Birmingham, nearest green space) were consistent with the derived heat vulnerability. There were some minor issues with classification, but these isolated errors do not fundamentally change the heat vulnerability classification of an area and can be corrected if needed when working at the local scale as part of the assessment of development suitability.

5.2. Does the Heat Vulnerability Map Support Local Decision Making?

The Action Research for Adaptation in Practice principles [88] provide a useful framework to evaluate whether the heat vulnerability map supports local decision making, both now and in the future. The ARA principles state that action research should be driven by user needs, impact-focused and measurable, co-produced with local knowledge holders, equitable in practice, evolving and flexible, and sustainable over time. Specifically:
Driven by User Needs: This is a practical and realistic solution to improve heat resilience. The approach uses datasets that are open access; the GIS approach can be replicated using the resources which are available to other local authorities or other stakeholders; and the approach is MVP to start influencing decisions now and avoid inertia in decision making that is often associated with uncertainty or model refinement. As the approach is used, feedback can inform model development.
Impact-focused and measurable: Outcomes must be measured according to needs and challenges. For example, early feedback from the city design team was that measuring heat vulnerability could not be a barrier to development taking place. Accordingly, the decision flowchart (Figure 7) uses the heat vulnerability score to ensure that any development that does take place is heat-sensitive. Further testing with the local authority will ensure that needed outcomes are achieved; it may be possible to create metrics to measure adaptation moving forward if there is a benefit for the local authority in doing this.
Co-produced with knowledge holders: This was co-created with the Birmingham City Council, and the interdisciplinary team has extensive experience in local authority planning and climate resilience. Birmingham was selected as a test area for the approach on account of the existing knowledge on urban climatology, environmental justice, green infrastructure, and climate resilience (Section 2.2).
Equitable in practice: The IMD is used as a measure of vulnerability; to make this more equitable in practice, local communities can be involved in design decisions when the MVP is tested on the development scale.
Evolving and flexible: The MVP approach will be tested with the city design team, and improvements can be made as datasets evolve (as the city GIS team holds the data layers) and usage improves our understanding of how the approach can support decision making.
Sustainable over time: The GIS approach was developed in collaboration with the city GIS team, so the knowledge is retained in-house (rather within the fixed-term research project).

5.3. Ongoing Development of MVP Approach and Limitations

This is an MVP approach, and there are multiple opportunities to develop and refine this approach by increasing the spatial resolution of some layers (e.g., surface temperature), by adding additional information (e.g., tree canopy data that provide a localized cooling effect in some locations or cooling via evapotranspiration), or by testing whether the alternative datasets listed in Table 2 provide a consistent or different resultant map. It would be interesting to see whether increased detail provides increased support for decision making; it may well be that this simple approach provides a sufficient evidence base to allow for heat vulnerability to be incorporated into decisions.
Additionally, all layers within the MVP are weighted equally, and further testing or applications could evaluate whether this is the most suitable approach. Using weighting can introduce subjectivity into the approach because assessing vulnerability is complex and varies according to household (and indeed within household) scales [89]. Quantifying those factors that have the greatest influence on vulnerability is challenging, given that the factors are often interlinked (e.g., socioeconomic status is associated with lower levels of green space) and require datasets with high spatial resolution, which are not generally available due to privacy and ethical concerns. Accordingly, several studies choose not to use weighting systems (e.g., [90,91,92]). A weighting system for the MVP could be developed through stakeholder analysis [93], expert opinion [94,95], or regression [96,97].
It would also be possible to consider how heat vulnerability changes through time by using the climate-change projections available from UKCP18 [98]. Projected temperature anomalies for different Representative Concentration Pathways (RCPs) could be added as a dataset, scaled 0–1, and then combined with the original four layers to understand how heat vulnerability changes for different time periods. These are currently only available at 25 km resolution, and, as such, there will be little variability across the urban area, and changes are likely to be linear. This is beyond the scope of this work but could be useful considering the heat vulnerability of different development scenarios though time. Most important, the map must be tested in practice, and current work is applying this approach and the flowchart for two development areas located in the high and highest risk areas.
As time progresses, it would also be possible to consider how changes instigated by the approach described here have acted to reduce heat vulnerability. Given the timeframes of the local authority decision making and building and development, this is something that could be considered at least five or more years into the future.
Concerning specific datasets, LCZ uses a discrete classification system based on scientific reasoning (Table 3). This is subjective, however, except for the city center; much of the city is classified as open low-rise, and, as such, changes to the classification system have a limited effect. IMD and green space datasets are bigger drivers in local-scale differences, and future studies applying this approach at the regional level (e.g., across the West Midlands Combined Authority) would allow for greater validation and understanding of the suitability of the approach. The surface temperature is at a 1 km resolution, and, as such, improvements in the resolution of this dataset could provide increased detail on surface temperature variations.
Currently, function (e.g., commercial versus residential) is only included via the decision-support flowchart (Figure 7). Function could be added to the map as a layer, with different vulnerabilities related to function being scored 0–1. Indeed, this could be a means to incorporate vulnerable locations such as hospitals, schools, or care homes. Moreover, a key assumption underpins the flowchart, namely that there is a relationship between urban greening and heat resilience and that having a predefined amount of urban greening (e.g., 0.6) will reduce heat vulnerability. Intuitively, we know this to be correct; for example, trees provide shade on hot days. This is also supported by the academic literature: cooling by trees via evapotranspiration and shading is documented in a range of settings and urban areas [99]. Lastly, using the approach outlined here (Section 3), having or increasing substantive green space on the development will change the Local Climate Zone and/or Green Space Value, thereby changing the heat vulnerability score.

6. Summary and Forward Look

This article presents an approach to use open access datasets to create a repeatable and robust approach to identify areas of lesser and greater heat vulnerability. The approach was tested in Birmingham, where there is a strong understanding of the urban climate derived via academic research [11,18,75,76,77,78], and local authority derived knowledge on environmental justice and green infrastructure [66,72]. Each dataset was independently validated, and combining the datasets aligns with our understanding of areas where the greatest heat risk and greatest vulnerability are expected.
This is an MVP approach, with opportunities for development via improvements in dataset resolution, incorporating additional datasets or changes to weighting of individual layers. Model validation in the traditional sense is not possible, for there are no ground-level observations of heat vulnerability, nor can we wait for decades to see which areas of Birmingham are most impacted by heat. Any time spent finessing the approach prior to use leads to more city design and planning decisions that do not consider heat vulnerability, potentially leading to maladaptation and/or lock-in (where decisions prohibit or reduce the feasibility/success of future adaptation). The aim of this action research was to incorporate overheating vulnerability into city planning and design decisions, for the first time, for the long-term, as simply as possible. The inclusion of climate risk within the risk register means that climate risk must be considered within decisions moving forward, and the approach outlined here provides the evidence base on which to make heat-sensitive decisions. It was important to use data sources that could be used by the local authority and other stakeholders and to develop an approach that could be applied in other urban areas in the UK, using the same datasets, and globally, using locally available datasets within the approach we described. Moreover, the research was designed and delivered in accordance with principles for action research for adaptation in practice [88]. It is driven by user needs, impact-focused and measurable, co-produced with local knowledge holders, equitable in practice, evolving and flexible, and sustainable over time.
To take this work forward, there are three areas of collaborative work with the local authority. Firstly, testing this at the development scale, using the decision-support flowchart (Figure 7), to understand how changes made to the local environment can change heat vulnerability. For the city design and planning team, it is important that an understanding of heat vulnerability does not prevent development in areas of high or highest risk; housing targets need to be met. Rather, it should provide an evidence base to ensure that any developments that do take place in the high or highest risk areas are undertaken in a heat-sensitive way, so that each development can be considered an opportunity to reduce vulnerability moving forward. Secondly, on a broader scale, this overheating risk is part of a larger mapping project to create a Climate Risk and Vulnerability Assessment map for the city and region that includes other climate risks, such as flooding, or exacerbating factors, such as poor air quality [100]. Lastly, overheating risk, as part of the broader understanding of climate risk, will be incorporated into the next Birmingham Development Plan ensuring that all future development is climate sensitive. Moreover, where constraints mean that development must take place in an area that is vulnerable to climate change, appropriate measures must be taken to reduce vulnerability. Ultimately, this approach enables the BCC to meet and achieve its wider aims and ambitions in mitigating and adapting to climate change through the provision of green and blue infrastructure.

Author Contributions

Conceptualization, E.F., N.G. and J.F.; Methodology, E.F., S.C., S.V.G., N.G. and J.F.; Software, N.G.; Investigation, E.F., S.C. and S.V.G.; Resources, N.G.; Writing—original draft, E.F. and S.C.; Writing—review & editing, E.F., S.C., S.V.G., N.G. and K.S.; Visualization, E.F., S.C. and S.V.G.; Funding acquisition, E.F., J.F. and K.S. All authors have read and agreed to the published version of the manuscript.

Funding

This research was funded by an Engineering and Physical Sciences Research Council awarded to Ferranti: EP/R007365/1. Greenham acknowledges funding from Natural Environment Research Council: NE/S003487/1. The APC was funded by University of Birmingham.

Data Availability Statement

Not applicable.

Conflicts of Interest

The authors declare no conflict of interest.

References

  1. Met Office. A Milestone in UK Climate History. Met Office Press Office. 2022. Available online: https://www.metoffice.gov.uk/about-us/press-office/news/weather-and-climate/2022/july-heat-review (accessed on 5 September 2022).
  2. Kendon, M.; McCarthy, M.; Jevrejeva, S.; Matthews, A.; Sparks, T.; Garforth, J.; Kennedy, J. State of the UK Climate 2021. Int. J. Climatol. 2022, 42, 1–80. [Google Scholar] [CrossRef]
  3. Kendon, M. Unprecedented Extreme Heatwave, July 2022. Met Office National Climate Information Centre. 22 July 2022. Available online: https://www.metoffice.gov.uk/binaries/content/assets/metofficegovuk/pdf/weather/learn-about/uk-past-events/interesting/2022/2022_03_july_heatwave.pdf (accessed on 5 September 2022).
  4. Kovats, S.; Brisley, R. Health, communities and the built environment. In The Third UK Climate Change Risk Assessment Technical Report; Betts, R.A., Haward, A.B., Pearson, K.V., Eds.; Prepared for the Climate Change Committee: London, UK, 2021; Available online: https://www.ukclimaterisk.org/wp-content/uploads/2021/06/CCRA3-Chapter-5-FINAL.pdf (accessed on 17 October 2022).
  5. Jaroszweski, D.; Wood, R.; Chapman, L. Infrastructure. In The Third UK Climate Change Risk Assessment Technical Report; Betts, R.A., Haward, A.B., Pearson, K.V., Eds.; Prepared for the Climate Change Committee: London, UK, 2021; Available online: https://www.ukclimaterisk.org/wp-content/uploads/2021/06/CCRA3-Chapter-4-FINAL.pdf (accessed on 17 October 2022).
  6. Mohajerani, A.; Bakaric, J.; Jeffrey-Bailey, T. The urban heat island effect, its causes, and mitigation, with reference to the thermal properties of asphalt concrete. J. Environ. Manag. 2017, 197, 522–538. [Google Scholar] [CrossRef] [PubMed]
  7. Phelan, P.E.; Kaloush, K.; Miner, M.; Golden, J.; Phelan, B.; Silva, H., III; Taylor, R.A. Urban heat island: Mechanisms, implications, and possible remedies. Annu. Rev. Environ. Resour. 2015, 40, 285–307. [Google Scholar] [CrossRef]
  8. Oke, T.R. Canyon geometry and the nocturnal heat island: Comparison of scale model and field observations. J. Climatol. 1981, 1, 237–254. [Google Scholar] [CrossRef]
  9. Hart, M.A.; Sailor, D.J. Quantifying the influence of land-use and surface characteristics on spatial variability in the urban heat island. Theor. Appl. Clim. 2009, 95, 397–406. [Google Scholar] [CrossRef]
  10. Oke, T.R.; Mills, G.; Christen, A.; Voogt, J.A. Urban Climates; Cambridge University Press: Cambridge, UK, 2017. [Google Scholar]
  11. Heaviside, C.; Vardoulakis, S.; Cai, X.M. Attribution of mortality to the urban heat island during heatwaves in the West Midlands, UK. Environ. Health 2016, 15, 49–59. [Google Scholar] [CrossRef]
  12. Ferranti, E.; Oberling, D.; Quinn, A. Urban transport resilience to weather and climate: An interdisciplinary view from Rio de Janeiro. Proc. Inst. Civ. Eng. Urban Des. Plan. 2022, 175, 103–121. [Google Scholar] [CrossRef]
  13. Chapman, L.; Azevedo, J.A.; Prieto-Lopez, T. Urban heat & critical infrastructure networks: A viewpoint. Urban Clim. 2013, 3, 7–12. [Google Scholar] [CrossRef]
  14. Ferranti, E.; Chapman, L.; Lee, S.; Jaroszweski, D.; Lowe, C.; McCulloch, S.; Quinn, A. The hottest July day on the railway network: Insights and thoughts for the future. Meteorol. Appl. 2018, 25, 195–208. [Google Scholar] [CrossRef]
  15. Jaroszweski, D.; Hooper, E.; Baker, C.; Chapman, L.; Quinn, A. The impacts of the 28 June 2012 storms on UK road and rail transport. Meteorol. Appl. 2015, 22, 470–476. [Google Scholar] [CrossRef]
  16. Santamouris, M. Recent progress on urban overheating and heat island research. Integrated assessment of the energy, environmental, vulnerability and health impact. Synergies with the global climate change. Energy Build. 2020, 207, 109482. [Google Scholar] [CrossRef]
  17. Environmental Audit Committee. Heatwaves: Adapting to Climate Change. UK Parliament Commons Select Committee. Environmental Audit. 2018. Available online: https://publications.parliament.uk/pa/cm201719/cmselect/cmenvaud/826/82604.htm (accessed on 6 December 2022).
  18. Macintyre, H.L.; Heaviside, C.; Taylor, J.; Picetti, R.; Symonds, P.; Cai, X.M.; Vardoulakis, S. Assessing urban population vulnerability and environmental risks across an urban area during heatwaves–Implications for health protection. Sci. Total Environ. 2018, 610, 678–690. [Google Scholar] [CrossRef]
  19. Ridgley, H.; Hands, A.; Lovell, R.; Petrokofsky, C.; Stimpson, A.; Feeley, A.; Bedford, A.; Fenech, B.; Leeman, D.; Skykes, E.; et al. Improving Access to Greenspace A New Review for 2020; Public Health England: London, UK, 2020. Available online: https://assets.publishing.service.gov.uk/government/uploads/system/uploads/attachment_data/file/904439/Improving_access_to_greenspace_2020_review.pdf (accessed on 6 December 2022).
  20. Mears, M.; Brindley, P.; Maheswaran, R.; Jorgensen, A. Understanding the socioeconomic equity of publicly accessible greenspace distribution: The example of Sheffield, UK. Geoforum 2019, 103, 126–137. [Google Scholar] [CrossRef]
  21. Jones, A.; Hillsdon, M.; Coombes, E. Greenspace access, use, and physical activity: Understanding the effects of area deprivation. Prev. Med. 2009, 49, 500–505. [Google Scholar] [CrossRef] [PubMed]
  22. Klinsky, S.; Mavrogianni, A. Climate justice and the built environment. Build. Cities 2020, 1, 412–428. [Google Scholar] [CrossRef]
  23. Climate Change Committee COP26: Key Outcomes and Next Steps for the UK. December 2021. Climate Change Committee. Available online: https://www.theccc.org.uk/wp-content/uploads/2021/12/COP26-Key-outcomes-and-next-steps-for-the-UK-Final.pdf (accessed on 23 July 2023).
  24. MHCLG 2023. National Planning Policy Framework; Department for Levelling Up, Housing and Communities: London, UK, 2023. Available online: https://assets.publishing.service.gov.uk/government/uploads/system/uploads/attachment_data/file/1182577/NPPF_Sept_23.pdf (accessed on 23 July 2023).
  25. Cocci Grifoni, R.; Caprari, G.; Marchesani, G.E. Combinative Study of Urban Heat Island in Ascoli Piceno City with Remote Sensing and CFD Simulation—Climate Change and Urban Health Resilience—CCUHRE Project. Sustainability 2022, 14, 688. [Google Scholar] [CrossRef]
  26. Liu, Z.; Cheng, W.; Jim, C.Y.; Morakinyo, T.E.; Shi, Y.; Ng, E. Heat mitigation benefits of urban green and blue infrastructures: A systematic review of modeling techniques, validation and scenario simulation in ENVI-met V4. Build. Environ. 2021, 200, 107939. [Google Scholar] [CrossRef]
  27. Tiwari, A.; Kumar, P.; Kalaiarasan, G.; Ottosen, T.B. The impacts of existing and hypothetical green infrastructure scenarios on urban heat island formation. Environ. Pollut. 2021, 274, 115898. [Google Scholar] [CrossRef]
  28. Potts, D.A.; Ferranti, E.J.S.; Vande Hey, J. Investigating the barriers and pathways to implementing satellite data into air quality monitoring, regulation and policy. Environ. Sci. Policy 2023. in review. [Google Scholar]
  29. Chapman, L.; Muller, C.L.; Young, D.T.; Warren, E.L.; Grimmond, C.S.B.; Cai, X.M.; Ferranti, E.J. The Birmingham urban climate laboratory: An open meteorological test bed and challenges of the smart city. Bull. Am. Meteorol. Soc. 2015, 96, 1545–1560. [Google Scholar] [CrossRef]
  30. Bassett, R.; Cai, X.; Thornes, J.E.; Rees, R.; Chapman, L. Urban climatic map studies in UK. In The Urban Climatic Map: A Methodology for Sustainable Urban Planning; Routledge: London, UK, 2015; p. 252. [Google Scholar] [CrossRef]
  31. Ranger, N.; Reeder, T.; Lowe, J. Addressing ‘deep’uncertainty over long-term climate in major infrastructure projects: Four innovations of the Thames Estuary 2100 Project. EURO J. Decis. Process. 2013, 1, 233–262. [Google Scholar] [CrossRef]
  32. Birmingham City Council 2022 Our Future Birmingham City Plan. Birmingham Local Plan Issues and Options. Birmingham City Council. October 2022. Available online: https://www.birmingham.gov.uk/downloads/file/25056/birmingham_local_plan_issues_and_options (accessed on 22 July 2023).
  33. SIMD 2020. Scottish Index of Multiple Deprivation 2020. Available online: https://www.gov.scot/publications/scottish-index-multiple-deprivation-2020/ (accessed on 23 July 2023).
  34. MHCLG 2019. The English Indices of Deprivation 2019 (IoD2019). Statistical Release 26 September 2019. Ministry of Housing, Communities and Local Government: London UK. Available online: https://assets.publishing.service.gov.uk/government/uploads/system/uploads/attachment_data/file/835115/IoD2019_Statistical_Release.pdf (accessed on 5 January 2023).
  35. Zhao, J.; Zhao, X.; Liang, S.; Zhou, T.; Du, X.; Xu, P.; Wu, D. Assessing the thermal contributions of urban land cover types. Landsc. Urban Plan. 2020, 204, 103927. [Google Scholar] [CrossRef]
  36. Estoque, R.C.; Murayama, Y.; Myint, S.W. Effects of landscape composition and pattern on land surface temperature: An urban heat island study in the megacities of Southeast Asia. Sci. Total Environ. 2017, 577, 349–359. [Google Scholar] [CrossRef] [PubMed]
  37. Unger, J. Intra-urban relationship between surface geometry and urban heat island: Review and new approach. Clim. Res. 2004, 27, 253–264. [Google Scholar] [CrossRef]
  38. Chen, L.; Ng, E.; An, X.; Ren, C.; Lee, M.; Wang, U.; He, Z. Sky view factor analysis of street canyons and its implications for daytime intra-urban air temperature differentials in high-rise, high-density urban areas of Hong Kong: A GIS-based simulation approach. Int. J. Climatol. 2012, 32, 121–136. [Google Scholar] [CrossRef]
  39. Wong, N.H.; Tan, C.L.; Kolokotsa, D.D.; Takebayashi, H. Greenery as a mitigation and adaptation strategy to urban heat. Nat Rev Earth Env. 2021, 2, 166–181. [Google Scholar] [CrossRef]
  40. Murage, P.; Kovats, S.; Sarran, C.; Taylor, J.; McInnes, R.; Hajat, S. What individual and neighbourhood-level factors increase the risk of heat-related mortality? A case-crossover study of over 185,000 deaths in London using high-resolution climate datasets. Environ. Int. 2020, 134, 105292. [Google Scholar] [CrossRef]
  41. Yuan, B.; Zhou, L.; Dang, X.; Sun, D.; Hu, F.; Mu, H. Separate and combined effects of 3D building features and urban green space on land surface temperature. J. Environ. Manag. 2021, 295, 113116. [Google Scholar] [CrossRef]
  42. Yang, X.; Li, Y.; Luo, Z.; Chan, P.W. The urban cool island phenomenon in a high-rise high-density city and its mechanisms. Int. J. Climatol. 2017, 37, 890–904. [Google Scholar] [CrossRef]
  43. Gago, E.J.; Roldan, J.; Pacheco-Torres, R.; Ordóñez, J. The city and urban heat islands: A review of strategies to mitigate adverse effects. Renew. Sustain. Energy Rev. 2013, 25, 749–758. [Google Scholar] [CrossRef]
  44. Armson, D.; Stringer, P.; Ennos, A.R. The effect of tree shade and grass on surface and globe temperatures in an urban area. Urban For. Urban Green. 2012, 11, 245–255. [Google Scholar] [CrossRef]
  45. Moss, J.L.; Doick, K.J.; Smith, S.; Shahrestani, M. Influence of evaporative cooling by urban forests on cooling demand in cities. Urban For. Urban Green. 2019, 37, 65–73. [Google Scholar] [CrossRef]
  46. Rahman, M.A.; Stratopoulos, L.M.; Moser-Reischl, A.; Zölch, T.; Häberle, K.H.; Rötzer, T.; Pretzsch, H.; Pauleit, S. Traits of trees for cooling urban heat islands: A meta-analysis. Build. Environ. 2020, 170, 106606. [Google Scholar] [CrossRef]
  47. Bohnenstengel, S.I.; Hamilton, I.; Davies, M.; Belcher, S.E. Impact of anthropogenic heat emissions on London’s temperatures. Q. J. R. Meteorol. Soc. 2014, 140, 687–698. [Google Scholar] [CrossRef]
  48. Fischer, E.; Schär, C. Consistent geographical patterns of changes in high-impact European heatwaves. Nat. Geosci. 2010, 3, 398–403. [Google Scholar] [CrossRef]
  49. Mavrogianni, A.; Pathan, A.; Oikonomou, E.; Biddulph, P.; Symonds, P.; Davies, M. Inhabitant actions and summer overheating risk in London dwellings. Build. Res. Inf. 2017, 45, 119–142. [Google Scholar] [CrossRef]
  50. Gamero-Salinas, J.C.; Monge-Barrio, A.; Sánchez-Ostiz, A. Overheating risk assessment of different dwellings during the hottest season of a warm tropical climate. Build. Environ. 2020, 171, 106664. [Google Scholar] [CrossRef]
  51. Ozarisoy, B.; Elsharkawy, H. Assessing overheating risk and thermal comfort in state-of-the-art prototype houses that combat exacerbated climate change in UK. Energy Build. 2019, 187, 201–217. [Google Scholar] [CrossRef]
  52. Oikonomou, E.; Davies, M.; Mavrogianni, A.; Biddulph, P.; Wilkinson, P.; Kolokotroni, M. Modelling the relative importance of the urban heat island and the thermal quality of dwellings for overheating in London. Build. Environ. 2012, 57, 223–238. [Google Scholar] [CrossRef]
  53. CIBSE. 2013. Available online: https://www.cibse.org/knowledge-research/knowledge-portal/tm52-the-limits-of-thermal-comfort-avoiding-overheating-in-european-buildings (accessed on 12 December 2022).
  54. CIBSE. TM59 Design Methodology for the Assessment of Overheating Risk in Homes. 2017. Available online: https://www.cibse.org/knowledge-research/knowledge-portal/technical-memorandum-59-design-methodology-for-the-assessment-of-overheating-risk-in-homes (accessed on 12 December 2022).
  55. GHA. Overheating in New Homes. Tool and Guidance for Identifying and Mitigating early Stage Overheating Risks in New Homes. Good Homes Alliance: London UK. GHA-Overheating-in-New-Homes-Tool-and-Guidance. 2019. Available online: https://goodhomes.org.uk/wp-content/uploads/2019/07/GHA-Overheating-in-New-Homes-Tool-and-Guidance.pdf (accessed on 12 December 2022).
  56. Ferranti, E.J.S.; Futcher, J.; Salter, K.; Hodgkinson, S.P.B.; Chapman, L. First Steps in Urban Heat for Built Environment Practitioners. In A Trees and Design Action Group (TDAG) Guidance Document; TDAG Trust: London, UK, 2021. [Google Scholar] [CrossRef]
  57. Met Office; Hollis, D.; McCarthy, M.; Kendon, M.; Legg, T.; Simpson, I. HadUK-Grid Gridded and Regional Average Climate Observations for the UK. Centre for Environmental Data Analysis. 2018. Available online: http://catalogue.ceda.ac.uk/uuid/4dc8450d889a491ebb20e724debe2dfb (accessed on 22 December 2022).
  58. Demuzere, M.; Kittner, J.; Martilli, A.; Mills, G.; Moede, C.; Stewart, I.D.; van Vliet, J.; Bechtel, B. Global Map of Local Climate Zones (1.0.0) [Data set]. Zenodo. 2022. Available online: https://zenodo.org/record/6364594 (accessed on 28 March 2023).
  59. Demuzere, M.; Kittner, J.; Martilli, A.; Mills, G.; Moede, C.; Stewart, I.D.; van Vliet, J.; Bechtel, B. A global map of local climate zones to support earth system modelling and urban-scale environmental science. Earth Syst. Sci. Data 2022, 14, 3835–3873. [Google Scholar] [CrossRef]
  60. Ordnance Survey 2023c OS MasterMap Building Height Attribute [Dataset]. Available online: https://beta.ordnancesurvey.co.uk/products/os-mastermap-building-height-attribute#overview (accessed on 26 February 2023).
  61. EMU 2022 EMU Analytics Building Heights [Dataset]. Available online: https://www.emu-analytics.com/products/datapacks (accessed on 26 February 2023).
  62. Ordnance Survey 2023a. MasterMap Greenspace [Dataset]. Available online: https://beta.ordnancesurvey.co.uk/products/os-mastermap-greenspace-layer (accessed on 26 February 2023).
  63. Ordnance Survey 2023b OS Open Greenspace [Dataset]. Available online: https://beta.ordnancesurvey.co.uk/products/os-open-greenspace (accessed on 26 February 2023).
  64. Environment Agency 2023 National LIDAR Programme Vegetation Object Model [Dataset]. Available online: https://environment.data.gov.uk/dataset/ecae3bef-1e1d-4051-887b-9dc613c928ec (accessed on 26 February 2023).
  65. Blue Sky. National Tree Map [Dataset]. 2023. Available online: https://bluesky-world.com/ntm/ (accessed on 26 February 2023).
  66. Treeplotter 2023 Tree Mapping Software Suite for Birmingham. Available online: https://uk.pg-cloud.com/BTP/ (accessed on 6 January 2023).
  67. Stewart, I.D.; Oke, T.R. Local Climate Zones for Urban Temperature Studies. Bull. Am. Meteorol. Soc. 2012, 93, 1879–1900. [Google Scholar] [CrossRef]
  68. Biophilic Cities. Birmingham, United Kingdom. 2014. Available online: https://www.biophiliccities.org/birmingham-uk (accessed on 6 January 2023).
  69. Birmingham City Council 2020 Birmingham Earns Prestigious Tree Cities of the World Status. Available online: https://www.birmingham.gov.uk/news/article/531/birmingham_earns_prestigious_tree_cities_of_the_world_status (accessed on 6 January 2023).
  70. Treeconomics 2021. Birmingham’s Urban Forest Master Plan; Treeconomics: Exeter, UK, 2021; Available online: http://birminghamtreepeople.org.uk/birminghams-urban-forest-master-plan/ (accessed on 7 November 2022).
  71. Birmingham City Council 2022 City of Nature Plan—February 2022. Birmingham City Council. February 2022. Available online: https://www.birmingham.gov.uk/downloads/file/21805/city_of_nature_plan_-_february_2022 (accessed on 7 November 2022).
  72. Birmingham City Council 2022 Environmental Justice Map. Available online: https://naturallybirmingham.org/environmental-justice/ (accessed on 6 January 2023).
  73. Warren, E.L.; Young, D.T.; Chapman, L.; Muller, C.; Grimmond, C.S.B.; Cai, X.M. The Birmingham Urban Climate Laboratory—A high density, urban meteorological dataset, from 2012–2014. Sci. Data 2016, 3, 1–8. [Google Scholar] [CrossRef] [PubMed]
  74. Tomlinson, C.J.; Prieto-Lopez, T.; Bassett, R.; Chapman, L.; Cai, X.M.; Thornes, J.E.; Baker, C.J. Showcasing urban heat island work in Birmingham–measuring, monitoring, modelling and more. Weather 2013, 68, 44–49. [Google Scholar] [CrossRef]
  75. Azevedo, J.A.; Chapman, L.; Muller, C.L. Quantifying the daytime and night-time urban heat island in Birmingham, UK: A comparison of satellite derived land surface temperature and high resolution air temperature observations. Remote Sens. 2016, 8, 153. [Google Scholar] [CrossRef]
  76. Tomlinson, C.J.; Chapman, L.; Thornes, J.E.; Baker, C.J. Derivation of Birmingham’s summer surface urban heat island from MODIS satellite images. Int. J. Climatol. 2012, 32, 214–224. [Google Scholar] [CrossRef]
  77. Heaviside, C.; Cai, X.M.; Vardoulakis, S. The effects of horizontal advection on the urban heat island in Birmingham and the West Midlands, United Kingdom during a heatwave. Q. J. R. Meteorol. Soc. 2015, 141, 1429–1441. [Google Scholar] [CrossRef]
  78. Bassett, R.; Cai, X.M.; Chapman, L.; Heaviside, C.; Thornes, J.E. Methodology to separate urban from regional heat advection by use of the Weather Research and Forecasting mesoscale model. Q. J. R. Meteorol. Soc. 2017, 143, 2016–2024. [Google Scholar] [CrossRef]
  79. Feng, J.L.; Cai, X.M.; Chapman, L. Impact of atmospheric conditions and levels of urbanization on the relationship between nocturnal surface and urban canopy heat islands. Q. J. R. Meteorol. Soc. 2019, 145, 3284–3299. [Google Scholar] [CrossRef]
  80. Feng, J.L.; Cai, X.M.; Chapman, L. A tale of two cities: The influence of urban meteorological network design on the nocturnal surface versus canopy heat island relationship in Oklahoma City, OK, and Birmingham, UK. Int. J. Climatol. 2021, 41, E445–E462. [Google Scholar] [CrossRef]
  81. Birmingham City Council 2019 Deprivation in Birmingham. Analysis of the 2019 Indices of Deprivation. Birmingham City Council, December 2019. Available online: https://www.birmingham.gov.uk/downloads/file/2533/index_of_deprivation_2019 (accessed on 25 January 2023).
  82. Greater London Authority 2021 Urban Greening Factor. London Plan Guidance (LPG). Greater London Authority. 30 September 2021. Available online: https://www.london.gov.uk/publications/urban-greening-factor (accessed on 23 February 2023).
  83. Elliott, H.; Eon, C.; Breadsell, J.K. Improving City vitality through urban heat reduction with green infrastructure and design solutions: A systematic literature review. Buildings 2020, 10, 219. [Google Scholar] [CrossRef]
  84. Negev, M.; Khreis, H.; Rogers, B.C.; Shaheen, M.; Erell, E. City design for health and resilience in hot and dry climates. BMJ 2020, 371, m3000. [Google Scholar] [CrossRef]
  85. Kappou, S.; Souliotis, M.; Papaefthimiou, S.; Panaras, G.; Paravantis, J.A.; Michalena, E.; Hills, J.M.; Vouros, A.P.; Ntymenou, A.; Mihalakakou, G. Cool pavements: State of the art and new technologies. Sustainability 2022, 14, 5159. [Google Scholar] [CrossRef]
  86. Sayigh, A. Achieving Building Comfort by Natural Means; Springer Nature: Berlin/Heidelberg, Germany, 2022. [Google Scholar] [CrossRef]
  87. ENVI-met 2023. ENVI-met Software. Available online: https://www.envi-met.com/ (accessed on 28 March 2023).
  88. Adaptation Research Alliance 2021 Adaptation Research for Impact Principles Adaptation Research Alliance. 28 October 2021. Available online: https://southsouthnorth.org/wp-content/uploads/2021/11/Adaptation-Research-for-Impact-Principles_28.10.21.pdf (accessed on 23 February 2023).
  89. Cutter, S.L.; Boruff, B.J.; Shirley, W.L. Social vulnerability to environmental hazards. In Hazards Vulnerability and Environmental Justice; Routledge: London, UK, 2012; pp. 143–160. [Google Scholar] [CrossRef]
  90. Maragno, D.; Dalla Fontana, M.; Musco, F. Mapping heat stress vulnerability and risk assessment at the neighborhood scale to drive Urban adaptation planning. Sustainability 2020, 12, 1056. [Google Scholar] [CrossRef]
  91. Allen, S.K.; Ballesteros-Canovas, J.; Randhawa, S.S.; Singha, A.K.; Huggel, C.; Stoffel, M. Translating the concept of climate risk into an assessment framework to inform adaptation planning: Insights from a pilot study of flood risk in Himachal Pradesh, Northern India. Environ. Sci. Policy 2018, 87, 1–10. [Google Scholar] [CrossRef]
  92. Greater London Authority 2022 London Climate Risk. A Spatial Analysis of Climate Risk Across Greater London: Methodology Report. Report prepared for the Greater London Authority by Bloomberg Assosciates. April 2022. Available online: https://data.london.gov.uk/download/climate-risk-mapping/ef3176ab-0ef0-41ae-a2b2-d0a5ff3a69af/ClimateRiskMaps_Methodology.pdf (accessed on 25 August 2023).
  93. Opach, T.; Glaas, E.; Hjerpe, M.; Navarra, C. Vulnerability visualization to support adaptation to heat and floods: Towards the EXTRA interactive tool in Norrköping, Sweden. Sustainability 2020, 12, 1179. [Google Scholar] [CrossRef]
  94. Leis, J.L.; Kienberger, S. Climate risk and vulnerability assessment of floods in Austria: Mapping homogenous regions, hotspots and typologies. Sustainability 2020, 12, 6458. [Google Scholar] [CrossRef]
  95. Kim, H.G.; Lee, D.K.; Jung, H.; Kil, S.H.; Park, J.H.; Park, C.; Tanaka, R.; Seo, C.; Kim, H.; Kong, W.; et al. Finding key vulnerable areas by a climate change vulnerability assessment. Nat. Hazards 2016, 81, 1683–1732. [Google Scholar] [CrossRef]
  96. Azam, M.G.; Rahman, M.M. Assessing spatial vulnerability of Bangladesh to climate change and extremes: A geographic information system approach. Mitig Adapt Strat. Glob Chang. 2022, 27, 38. [Google Scholar] [CrossRef]
  97. Yu, J.; Castellani, K.; Forysinski, K.; Gustafson, P.; Lu, J.; Peterson, E.; Tran, M.; Yao, A.; Zhao, J.; Brauer, M. Geospatial indicators of exposure, sensitivity, and adaptive capacity to assess neighbourhood variation in vulnerability to climate change-related health hazards. Environ. Health 2021, 20, 1–20. [Google Scholar] [CrossRef]
  98. UKCP18 2023. UK Climate Projections User Interface. Available online: https://ukclimateprojections-ui.metoffice.gov.uk/ui/home (accessed on 23 February 2023).
  99. Vaz Monteiro, M.; Handley, P.; Morison, J.I.L.; Doick, K.J. The Role of Urban Trees and Greenspaces in Reducing Urban Air Temperatures; Forestry Commission Research Note (FCRN) 037; Forest Research: London, UK, 2019. Available online: https://cdn.forestresearch.gov.uk/2019/01/fcrn037.pdf (accessed on 23 February 2023).
  100. Greenham, S.V.; Jones, S.A.; Ferranti, E.J.S.; Acton, W.J.F.; MacKenzie, A.R.; Grayson, N. Mapping Climate Risk and Vulnerability with Publicly Available Data. A Guidance Document Produced by the WM-Air Project, University of Birmingham. 2023. Available online: http://epapers.bham.ac.uk/4259/ (accessed on 23 July 2023).
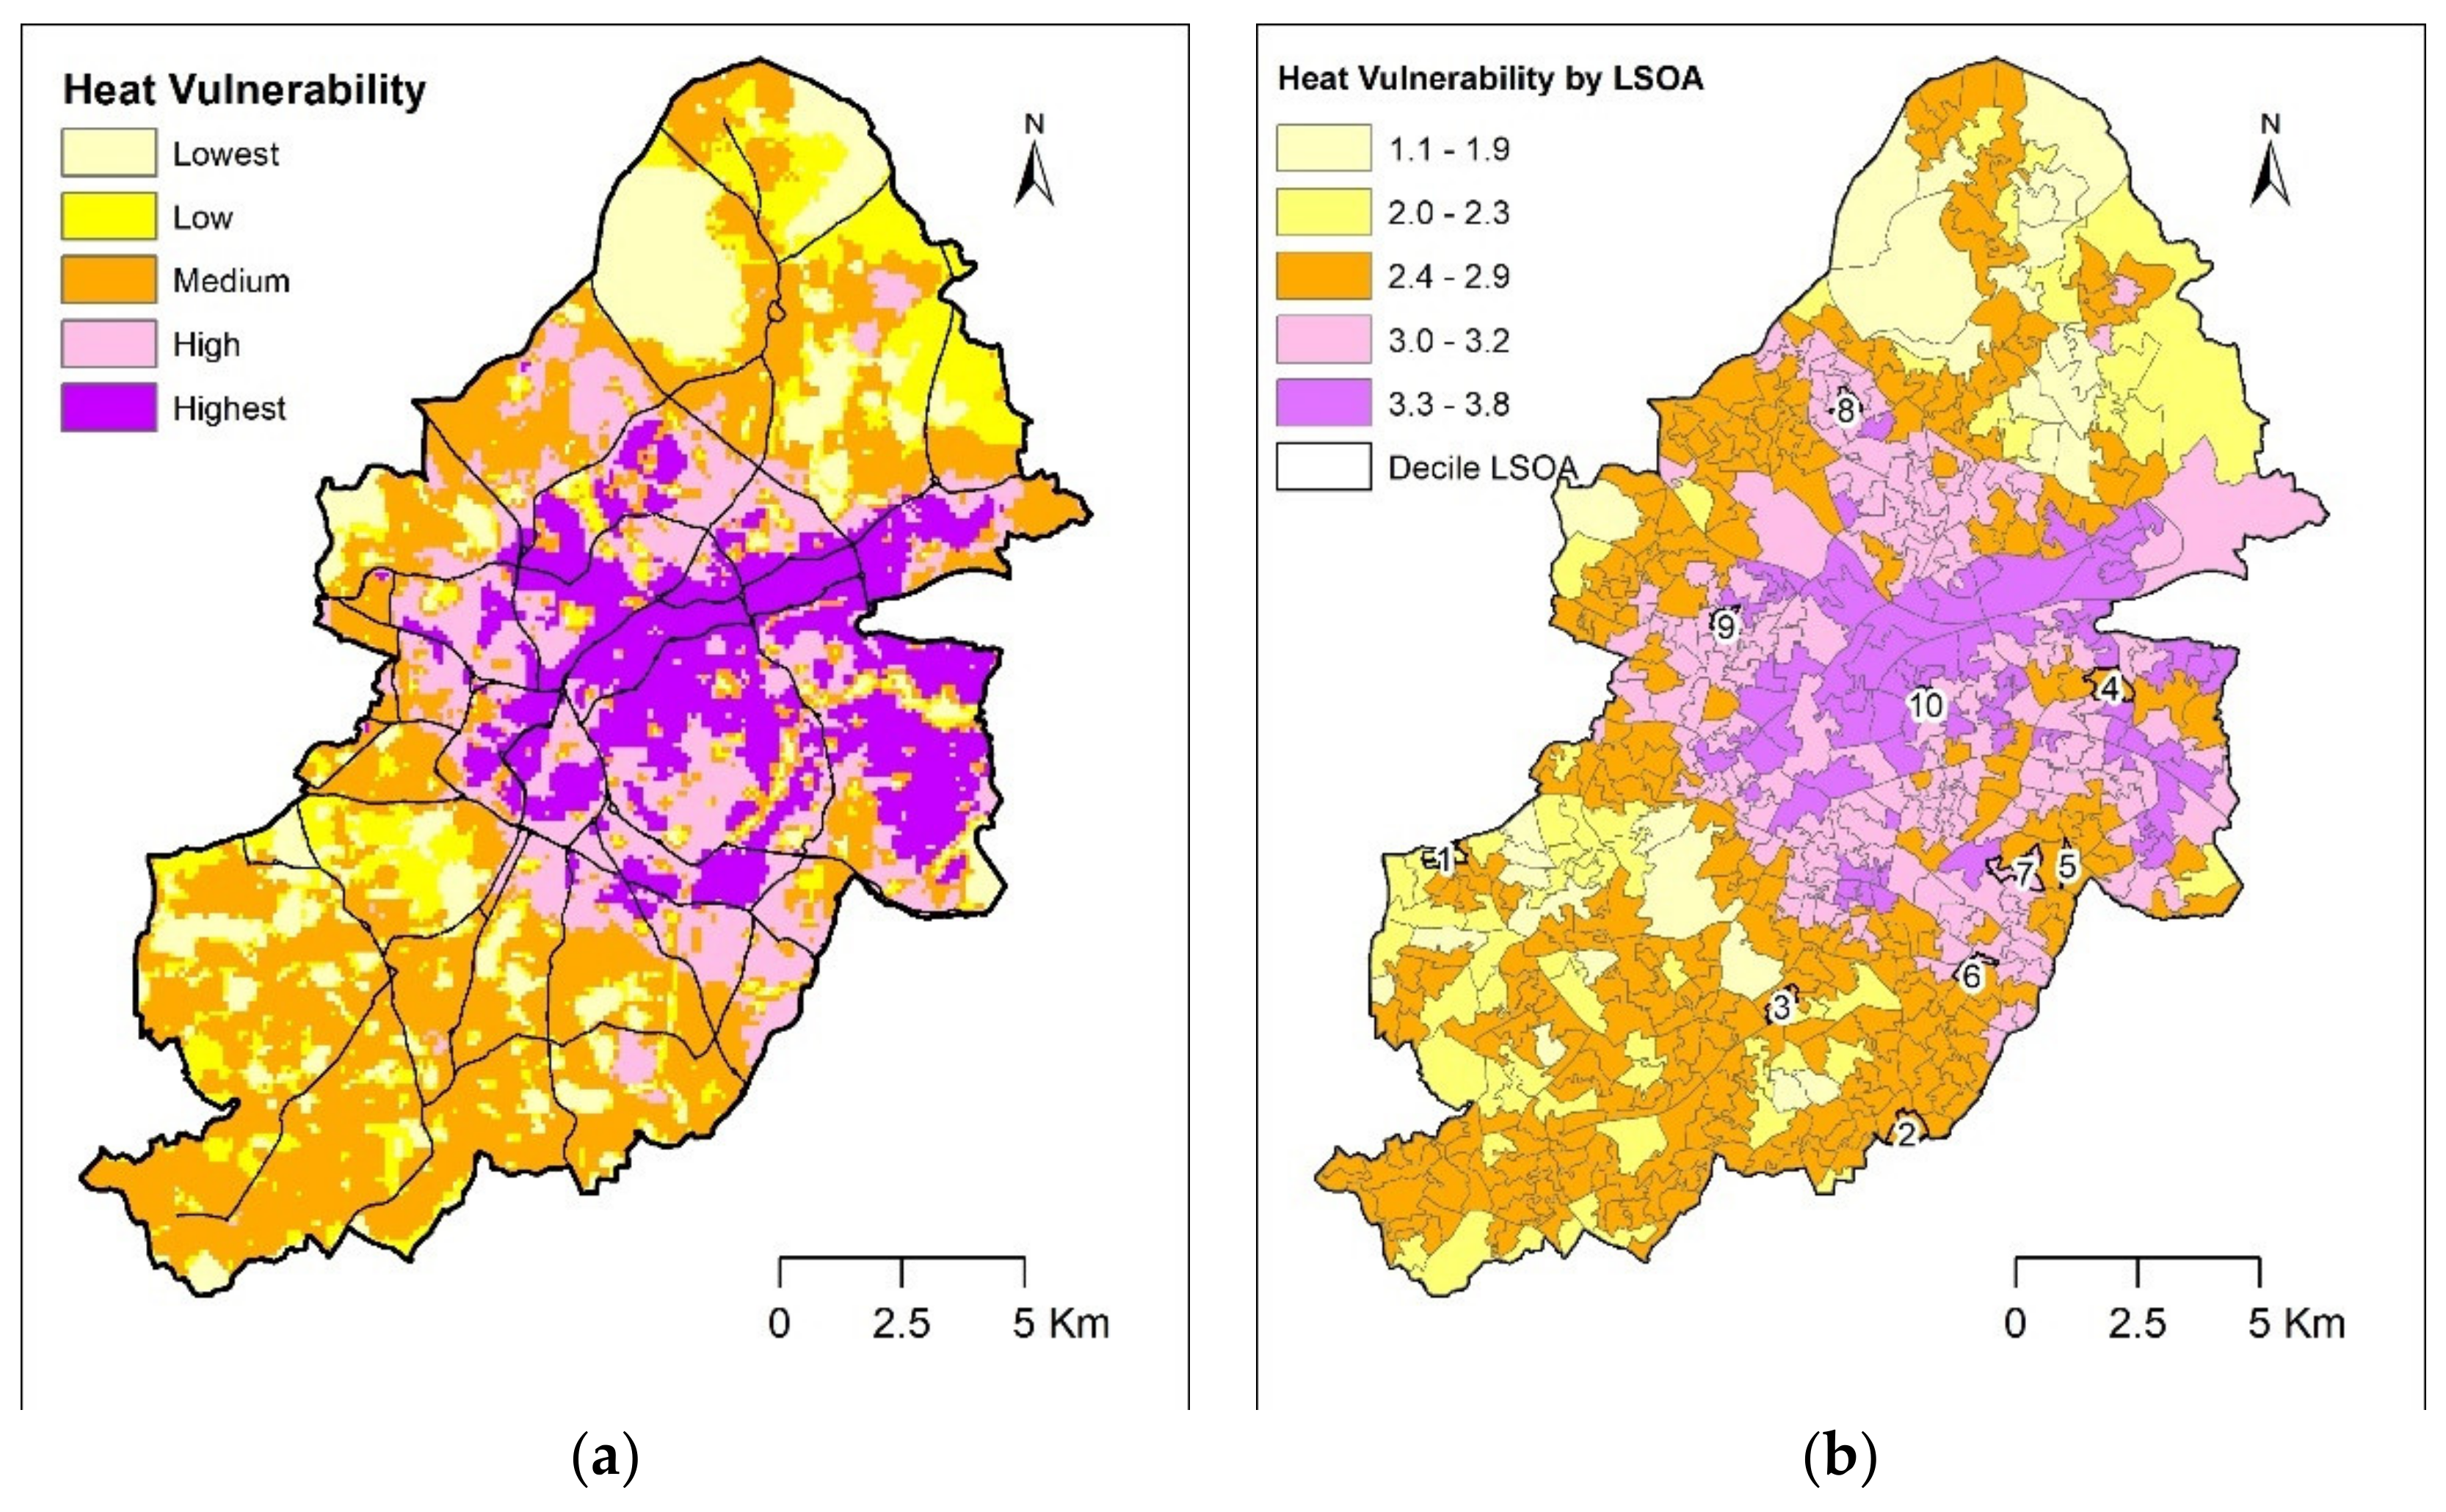
Figure 1. Location of Birmingham, UK.
Sustainability 15 13501 g001
Figure 4. Heat vulnerability presented as (a) a continuous surface, with classifications shown in Table 4; and (b) by Lower Super Output Area (LSOA). The inter- and intra-decile variabilities of the heat vulnerability for the 10 LSOAs shown on Figure 4b are given in Figure 5.
Sustainability 15 13501 g004
Figure 5. Box-and-whisker plots showing the inter- and intra-decile variability of the heat vulnerability (y-axis) for the 10 LSOAs shown on Figure 4b. On the plot, X denotes the mean value; the box indicates the interquartile range.
Sustainability 15 13501 g005
Figure 6. Local-scale testing of the heat vulnerability map at different decile scores. The heat vulnerability is compared with the surface imagery, and the factors that drive the score are discussed.
Sustainability 15 13501 g006aSustainability 15 13501 g006b
Figure 7. Flowchart to allow heat vulnerability to be incorporated into development-scale decision making. For LCZ types, see Table 3.
Sustainability 15 13501 g007
Table 4. Classification of heat vulnerability.
ClassHeat Vulnerability (hv) Value
Lowest0.6 ≤ hv < 1.9 (less than 1SD below mean)
Low1.9 ≤ hv < 2.3 (between 0.5 and 1SD below mean)
Medium2.3 ≤ hv < 2.9 (within 0.5SD)
High2.9 ≤ hv < 3.2 (between 0.5 and 1SD above mean)
Highest3.2 ≤ hv ≤ 3.8 (more that 1SD above mean)
Disclaimer/Publisher’s Note: The statements, opinions and data contained in all publications are solely those of the individual author(s) and contributor(s) and not of MDPI and/or the editor(s). MDPI and/or the editor(s) disclaim responsibility for any injury to people or property resulting from any ideas, methods, instructions or products referred to in the content.

