Article

A Complex Circular-Economy Quality Indicator for Assessing Production Systems at the Micro Level

1
Mineral and Energy Economy Research Institute, Polish Academy of Sciences, 31-261 Cracow, Poland
2
Faculty of Management, AGH University of Science and Technology, 30-067 Cracow, Poland
3
Faculty of Chemical Engineering and Technology, Cracow University of Technology, 31-155 Cracow, Poland
*
Author to whom correspondence should be addressed.
Sustainability 2023, 15(18), 13495; https://doi.org/10.3390/su151813495
Submission received: 18 July 2023 / Revised: 21 August 2023 / Accepted: 6 September 2023 / Published: 8 September 2023

Abstract

:
Measuring circular-economy progress requires indicators to examine the implementation of management systems. A complex quality indicator for assessing production systems at the circular-economy micro level was proposed. One innovative aspect of this evaluation of quality indicators is the classification of a set of sixty selected options divided into four core groups (technical, environmental, economic, and social). The second one is the use of a trimmed-mean method to summarize the individual options score into core groups and complex circular-economy indicators of analyzed production systems. The individual options were weighed according to indices defined by the professional team. Here is presented a case study of the use of developed complex quality indicators, including a comparison of two sodium tripolyphosphate production processes. The calculated indicator of the new method was higher, at 204.8%, than the indicator of the old method. This confirms the significant advantage of the new technology.

1. Introduction

The circular economy (CE) is a still new business model for many companies, one which depicts a production and consumption system that relies on the recycling, re-use, repairing, remanufacturing, and sharing of products, changing consumption patterns. CE’s goal is to effectively use resources and reduce the influence on the environment in all phases of the product’s life cycle, simultaneously enabling our demands within the world and increasing the societal weal [1]. CE supports the maintenance of the value of goods by recycling materials into the production chain, decreasing waste production, and eliminating product losses from manufacturing life cycles [2].
The circular economy has four implementation levels. The nano scale describes the circularity of products and materials, including within it three wider systemic levels, using activities by which a company adds value to an article, including production, marketing, and the entire after-sales service life cycle [3]. The micro scale applies to CE development directed towards consumers, individual companies, and produced goods. The meso level includes industrial eco-parks and macro-scale cities, provinces, regions, or nations [1,4].
Measuring circular-economy progress requires indicators to examine management systems and their impact on the environment in a value chain. Most of them are nano-scale ecological indicators intended to evaluate CE structures in terms of sustainable development. Another group is concentrated on the environmental and economic pillars. Social consequences are hardly ever estimated [5]. CE indicators using LCA are helpful in screening CE initiatives and determining the most advantageous development scenarios [6,7]. Life-cycle thinking (LCT) uses life-cycle costing (LCC), social life-cycle assessment (S-LCA), and LCA for environmental, economic, and social evaluation, respectively, and also performs complex assessments with standard tools [8,9].
The existing tools for the evaluation and assessment of environmental performance are reviewed [10] with regard to European and local legislation and evaluated using the analytical hierarchy process and SWOT analysis. For the monitoring and assessment of the Circular Economy Action Plan, different assessment tools are being used, including key performance indicators, software tools and predictive models, management systems, and environmental standards, providing clear, reliable guidelines and steps concerning the environmental performance of a chosen institution. At the same time, the use of software tools for recording and assessing data regarding aspects of environmental performance can be very beneficial.
Circular-economy indicators are used in terms of a LCT approach/designing level to measure physical features from the production cycles without the LCT approach (e.g., recycling rate) [11], physical features from the production cycles with LCT accessibility (e.g., the indicator reusability/recyclability/recoverability (RRR) as to the conditions of materials, and the potential rate of reuse (substrates)), and energy recovery [12] and the costs/profits in terms of environmental, economic, and/or social problems in a production chain’s design (e.g., RRR profit rate in terms of environmental benefits) [13]. The study reported in [14] provided a systematic analysis for both existing and new CE targets for the consideration of decision-makers, based on a review of the literature related to existing targets, supplemented by the elaboration of new targets. Ten comprehensive strategies summarized by the 10R framework have been scrutinized systematically. These targets can lead to synergies, also termed complementarities, which need to be considered for the realization of a CE. The R-strategies together define a system in which multiple options and targets can be applied to promote CE implementation. Optimization of the technical and economic activity of a commercial company in terms of environmental and resource protection considerations as a model for putting into practice the theoretical concept of circular economy used at the macro level was made using the existing indicators from a national public database. At the micro level, for the purpose of carrying out a case study on the optimization of the washing activity of the means of transport in the context of the circular economy, the data from the commercial urban transport company were analyzed [15].
A gamification approach provides feedback through performance indicators (i.e., waste accumulation index, waste composition, pollution prevention, etc.) and offers the opportunity, through multi-criteria decision-making, to simulate real-life scenarios and the possible results of certain actions. These effects could be a reference point for any policymaker intending to assess environmental performance, as well as activities proposed to reach circular-economy targets [16]. This type of approach to a CE is accessible on a micro level. Pauliuk [17] analyzed new and existing numerical indicators for CE strategy evaluation in organizations. CIRC (material circularity indicator), TRP (total restored products), and LMA (lifetime of materials on anthroposphere) have resulted from material flow analysis (MFA), MFCA, and LCA. Kristensen and Mosgaard [18] reviewed thirty CE indicators at the micro level. Most of them concentrated on recirculation, end-of-life management, or remanufacturing, but only a few concerned lifetime extensions, waste management, resource yielding, or reusing. There is no generally established method of CE measurement at the micro scale. Most indicators are concerned with economic issues and meet environmental, and particularly public policy, problems to a minor degree.
Indicators evaluating goods’ quality take advantage of the characteristic impact of consumers and markets; for example, looking to economic benefits [19]. The longevity indicator [20] applies lifespan evaluations from statistical information and expert estimations. Some indicators combine qualitative and quantitative data to evaluate circular-economy progress [21]. CE indicators must assess the consensual design of the production sectors using the predicted activities promoted by the sustainable development goals [22], and could be fit to evaluate the relative scope of policies relative to attainment of the CE’s influences at an appropriate CE level. The proposed series of indicator sets is analyzed, but without implied assent for their application [17]. For measurement of the CE indicator at the micro scale [23], this study proposes a disassembly metric (eDIM), which is used to calculate the dismantling time, given the set of actions and basic product information. The innovative aspect of this is the classification of dismantling operations into six categories. The longevity qualitative indicator [20] includes the average lifetime of products, considering the data variability resulting from different consumer behaviors. Composite indicators (CIs) which compare country-level performance are increasingly recognized as a useful tool in policy analysis and public communication [24]. Important as well is the quality framework for composite indicators, in which the relationships between methodologies used to construct and disseminate composite indicators and different quality dimensions are discussed.
The qualitative measurement indicator that leverages activities affected by consumers or markets, such as product life span or economic value, is the product-level circularity metric (PLCM) [19], which compares economic value from recycled flows and the economic value of total flows. PLCM is also used as a material circularity indicator (MFI) [25]. Results related to the qualitative aspects of drinking water in relation to aspects of its eco-innovation were based on nine indicators belonging to the following groups: inputs in the field of eco-innovation; eco-innovation activities and results; a specific indicator regarding the requirements of the performed study; socio-economic results; and resource efficiency [26]. In [27] was applied the quantitative eco-costs value ratio (EVR), an LCA-based index, as well as the qualitative circular transition framework to assess a product service system (PSS) for water transport. The sustainable circular index (SCI) for production companies by Azevedo et al. [21] contained the weighting of the data according to indicators determined by a team of experts. A select number of expert interviews were performed with academics/experts involved with various research topics to verify the validity of the considered sustainability and circularity indicators and to rank them. The circular economy comprises many extensions of the concept, and one indicator could likely not summarize different indicator types. The package of indicators is supported by CE control systems on the macro and micro level [17,25] when the facultative complementing indicators are discussed. According to [28], monitoring the manufacturing and consumption stages is fundamental to comprehending strategic activities in order to obtain CE goals.
Methods evaluate the quality of complicated production systems [29], taking advantage of the quality indicators for a proper selection of the most advantageous choices from competing options. Assessing the influence of the basic phases on production processes allows for the determination of the accuracy of the chosen indicator. Pieroni et al. [30] presented the implementation in the industry of the Circular Economy Business Modelling Expert System. The use of expert teams increased benefits for industrial firms by the promotion of better solutions on the CE model, a determined structure which confirmed designed hypotheses, and a consistent model prompting the making of decisions and reducing insecurities. In the paper [31] proposed and defined a new qualitative method for building conceptual frameworks. Conceptual framework analysis offers a procedure of theorization for building conceptual frameworks based on the grounded-theory method. The advantages of conceptual framework analysis are its flexibility and capacity for modification.
This study proposes a qualitative evaluation of circular-economy micro-level production systems based on the CE, cleaner production (CP), and sustainability development (SD), incorporating strategic activities by developing a method for measuring the CE complex indicator for micro-level manufacturing systems. More specifically, this study has the following objectives: (1) Show the collection and selection of the core four groups of technical, environmental, economic, and social options proposed as the base for the calculation of the CE complex quality indicator. (2) Investigate the measuring system for the calculation of individual options using expert evaluation. (3) Propose a trimmed-mean method for summarization of the score of individual options into core group indicators and total CE indicators for analyzed production systems. (4) Incorporate a showcase study comparing two sodium tripolyphosphate production processes using a worked-out CE indicator.

2. Methods

The presented methodology applied a comparative assessment of production systems using a cumulative quality method to calculate the circular-economy indicator of an analyzed system. This allows for the selection of higher quality systems from the compared production systems [32,33]. The author of [34] considers also the advisability of the strict application of traditionally defined quantitative research and proposes a more flexible approach to ensuring reliability and validity in qualitative research. The qualitative evaluation of production systems typically includes many analyzed quality attributes. Quality indicators, as described in [35], are assessed for objectivity (measurability), as characterized by reliability and validity.
A qualitative indicator was also used in [36] for the assessment of digital fabrication with concrete (DFC), which demonstrated the potential to bring sustainability, productivity, and process innovation to the construction industry. The DFC Evaluation Framework was used to analyze current advancements in DFC through a conceptual framework analysis. The framework is focused on the inputs, process parameters, and outcomes of a given technology solution, independently of the enabling technology type. It can be used to classify and compare DFC technologies according to their systemic characteristics, which are both technical and non-technical in nature. The DFC Scoreboard, an interactive tool to match DFC technologies with the needs of prospective adopters, was developed and tested based on this framework.
Quality indicators offer the possibility of a fast and simple evaluation of the product or service quality level. These indicators are defined on the basis of scientific concepts, particular experiences, discussions with experts, etc. Each of these numbers characterizes a specific quality attribute [37,38,39]. The complex quality (Q) is therefore a function of variable quality elements:
Q = f ( F i )   =   f ( F 1 , F 2 , F n )
where: Q—complex quality, and F1 … Fn—variable quality features.
The proposed method for the calculation of the circular-economy indicator of production systems is a total method providing the proper selection and categorization of collected process options into four core-group categories: technical, environmental, economic, and social. Their weighing and scoring are performed by a team of experts, and use the trimmed-mean method, allowing the summarization of the scores of individual options into core-group indicators and total CEI indicators of analyzed production systems.
The selection of a single option is the first stage of the calculation of the CE indicator. The set of four core-group options chosen for the evaluation of CE micro-level indicators was selected based on CE strategic activities and CP and SD goals, taking advantage of technical, environmental, and economic characteristics of industrial processes.
The options were selected and rated by a panel of experts. The team of experts consisted of five people, specialists in the field of chemical technology and environmental engineering, who knew and used in practice and research the principles applied in the circular economy. These were two people from the industry (retired research and development managers), and three scientists from technical universities (one Professor and two Assistant Professors).
The rating range of each option was from zero to ten points. The medium value of the points determined by the expert resulted in a single-score (S) assessment.
The method additionally considers the weighted arithmetical index [40,41] in the form of the degree of each group of options’ validity, proposed arbitrarily, for evaluation of the core groups’ CE indicators, as determined by a team of experts. Using trimmed means allowed for the summarizing of the scores of individual options and groups of options, and finally, a total score for the CEI quality indicator. Trimmed mean is a statistical measurement method of TRIZ theory which provides effective support for the innovative design of complex systems, and it improves the system’s functions [42,43].

Determination of a Set of Four Options for the Analysis of Production Systems

The circular economy is a model of production and consumption which involves a set of strategies (redesign, product disassembly, recycling, use of renewable energy, etc.) that meet the general CE goals. Circularity indicators are tools focused on measuring the degree of association of a system (or part of one) to practices and strategies applied to develop a CE [1]. The micro level is related to the degree of CE progress for individual consumers, a single company, or a product and its components [16]. CE implementation at the microeconomic level in production units causes the company to implement various strategies to improve circulation in the production system and to cooperate with other companies in the supply chain to achieve a more economically efficient closed-circulation cycle [1]. The options presented below exemplify the application of basic elements of the circular economy in industrial practice, using the methodology of cleaner technologies on a microeconomic scale, and could be globally applicable in industrial practice.
The selection of a single option is the first stage of the calculation of the circular-economy indicator. The set of four core-group options chosen for the evaluation of CE micro-level indicators was selected and chosen based on CE strategic activities, CP methodology, and SD goals, taking advantage of the technical, environmental, and economic characteristics of industrial production processes and the assessment of development, design implementation, and management of practical products’ manufacturing. The changes in the relationship with the public due to the implementation of analyzed production systems were also considered.
  • Technical (T) options are based on CP methods, considered a key strategy for CE due to better integration into other environmental strategies of a company, the introduction of cleaner products, processes, and services to reduce waste and emission, and prevention of the use of non-renewable streams and harmful input materials [44]. CP aims to achieve the goals of CE to change the perception of the relationship between business and the environment [45]. The technical options presented allow for the assessment of: the difficulty level and implementation time of the technology and its innovation degree in comparison to the global level; production method simplification, i.e., the reduction of the number of unit processes and the shortening of transport routes; the decreased consumption of materials and energy, and the use of renewable energy; an approaching to a possible index of reused goods, raw materials, recycling of waste, and recovering energy. These options are based on the best available techniques (BAT), i.e., processes with the least possible influence on the environment attained without a decrease in the economic conditions of the involved industrial companies.
    BAT assessment is typically performed by specialist estimation. The methodology described in [46] shows that expert evaluation determines straight and clear on-base calculated scores for implementation achievability, environmental impact, and economic profitability.
  • Environmental (En) options provide CE strategic actions; the models described in [47,48] were selected. These comprise recirculation, cleaner production, and projecting for remanufacturing, reuse, renewable energy, high-quality recycling, and prolongation of the product life-cycle. There are two types of important principles, the first one concerns the R framework and the second one concerns the system availability, and these were differentiated. The 9R approach [49,50] was chosen, including the following extensions: refuse, rethinking, reduction, reuse, repair, refurbishment, remanufacture, repurpose, recycling, and recovery. To assess environmental profits or losses and the possible influence on the environment of waste incineration, LCA should be performed to develop a life-cycle inventory [1]. Therefore, some results from the literature have been analyzed to compare with the proposed methodology. The set of proposed environmental options allows for the estimation of: decreased environmental impact through the increase of manufacturing productivity, using changes in process manuals, project solutions, and modifications of existing technologies; waste release reduction and prevention of pollution emission; reductions in the toxicity degree of waste; the obtaining of secondary waste using spent goods in new products; the quality of recycling of materials and energy; solutions that render the optimum levels of waste collection; the incineration of materials to recover energy.
  • Economic/Business (Ec) options include the group of CE activities consisting of waste management, improvements in the durability of goods to enable them possibly to persist within the manufacturing system for a long time, production cost, and efficiency of investment expenditures at as low as possible an investment cost. CE strategic actions [37,47] allow implementation options associated with resource productivity and economic benefits. Options allow for: evaluation of the effective use of resources; productive project strategies, goods, and service levels; the maintenance of resource and product values and changeable and modifiable manufacturing; efficient investment expenditures and implementation; assessment of production costs, including labor demand, energy expenses, materials costs, and reparation and conservation costs; calculating the degree of substitution for natural resources by waste; an increase of the longevity of the product, for staying within the economy as long as possible; and consistency with state and EU economic policy.
  • Societal (Soc) options [47,48] are developed according to CE strategic actions for the implementation of socioeconomic benefits. These options were analyzed in terms of the aims of: improving relationships with the public due to reduced damage to human health caused by industrial processes; promotion of better-quality products; keeping the higher value of goods as long as possible; workplace formation and increases in the number of highly-qualified employees; shifting consumption patterns due to use by consumer of the optimum quantity of goods, energies, or services; reuse as the effect of a changing approach in terms of repairs and renovations; and increasing the degree of adaptation to local conditions.

3. Results and Discussion

3.1. Selection and Collection Options and the Construction of the Theoretical Framework for Assessment of CE Micro Levels Indicators

3.1.1. Evaluation of Options to Obtain a Set of Options Single-Scores (S) for the Core Group

For the assessment of the CE micro levels indicators, the following function was applied:
CEI = CE T   +   CE En   +   CE Ec   +   CE Soc
where CEI—CE indicator of evaluated production systems; CE—indicators of core option group: CET—Technical, CEEn—Environmental, CEEc—Economic, CESoc—Societal.
The options were rated by a panel of five experts. The rating range of each option was from zero to ten points. The medium value of the points determined by the expert resulted in a single-score (S) assessment.

3.1.2. Determination of a Degree of Validity for the Core Group of Options

The method additionally considers the weighted arithmetical index [40,41] in the form of the degree of each group of options’ validity, dwj. These are suggested by a panel of experts, and adjusted arbitrarily depending on the local conditions of analyzed production systems. The validity degrees of core group’s CE indicators are presented below:
dwCE T = 1
dwCE En = 4
dwCE Ec = 3
dwCE Soc = 2
The next stage allowed for the calculation of single score S* considering degree validity according to Equation (7).
S * = S · dw j
where: S*—single-score (S) considering degree of validity; S—single score of an option (0–10 points); dwj—degree of validity of single option.

3.1.3. The Use of Trimmed Mean (TM) to Calculate the Value for the Group of Options

The arithmetical mean can be used for the more reliable mean value of the options set. It was proposed to use the trimmed mean (Equation (8)) to calculate the value for the group of options [51], where the k-parameter specifies how many smallest and largest values are rejected.
x ¯ t = 1 n - 2 k i = k + 1 n k x i
Trimming is a problem-solving method of TRIZ theory. Trimming provides effective support for the innovative design of complex systems, and it improves the system’s functions by reducing its components [42,43].
Trimmed mean is a statistical measure that eliminates some higher and lower values before the final calculation, due to its obtaining of the most credible mean value. The exclusion refers to values from the lower and upper parts of the analyzed data. It is also presented as a truncated mean, which is used mostly for determining economic evaluations requiring a minimum of variations. The lowest truncated value is 0%, which is the same as the mathematical mean. A trimmed mean is stated as a mean trimmed by x%, where x is the sum of the percentage of observations removed from both the upper and lower bounds. The trimming points are often arbitrary according to practical estimations. For example, a trimmed mean of 4% means elimination of the higher and lower 4% of the data analyzed, in order to calculate the mean from the 92% of other observations. Then, the arithmetical means can be used for all options.
The trimmed mean of single-score S*, considering degree validity, is calculated according to Equation (9).
S * TM = S TM · dw j
where S*TM—trimmed mean of single-score (S) considering degree validity.

3.1.4. Calculation of the Circular-Economy Indicator (CEI)

Using trimmed means allowed for the summarizing of the scores of individual options and groups of options, and finally, Equation (2), considering Equations (3)–(9), will have the form presented in Equation (10).
CEI = S * T TM   + S * En TM   + S * Ec TM + S * Soc TM
where: ∑S*TTM—trimmed mean of Technical group CET partial indicator; ∑S*EnTM—trimmed mean of Environmental group partial indicator; ∑S*EcTM—trimmed mean of Economic group partial indicator; ∑S*SocTM—trimmed mean of Societal group partial indicator.

3.1.5. Comparison of Production Systems

To compare two (or more) production systems, the relative increase of CEI (RICEI) could be calculated. RICEI is defined as a quotient, expressed in percentages, of the difference between the new (first one) CEIN and the old (second one) system’s CNIO.
RI CEI = ( CEI N     CNI O ) / CNI O · 100 %
Table 1 presents a set of sixty selected options divided into four core groups. Every group includes the same number of fifteen options, which were chosen to simplify the comparison. A proposed option could be treated as representative if it demonstrated features typical of widely used production processes, and its number should reflect fulfilled needs in terms of a manifold assessment. The presented set of indicators contains an efficiency indicator which allows for the estimation of the waste of resources, which will reduce process productivity, is focused on the product and the result obtained, and is directly related to customer satisfaction. The safety quality indicator is critical in order to prevent damage to the environment and also to customers’ health or physical integrity, for example. The effectiveness indicator shows the consequences of implementing a product or service and can measure whether the proposed objectives have been achieved.

3.2. Illustration of the System of Calculation for CE Indicators; Their Proposed Application to the Case Study

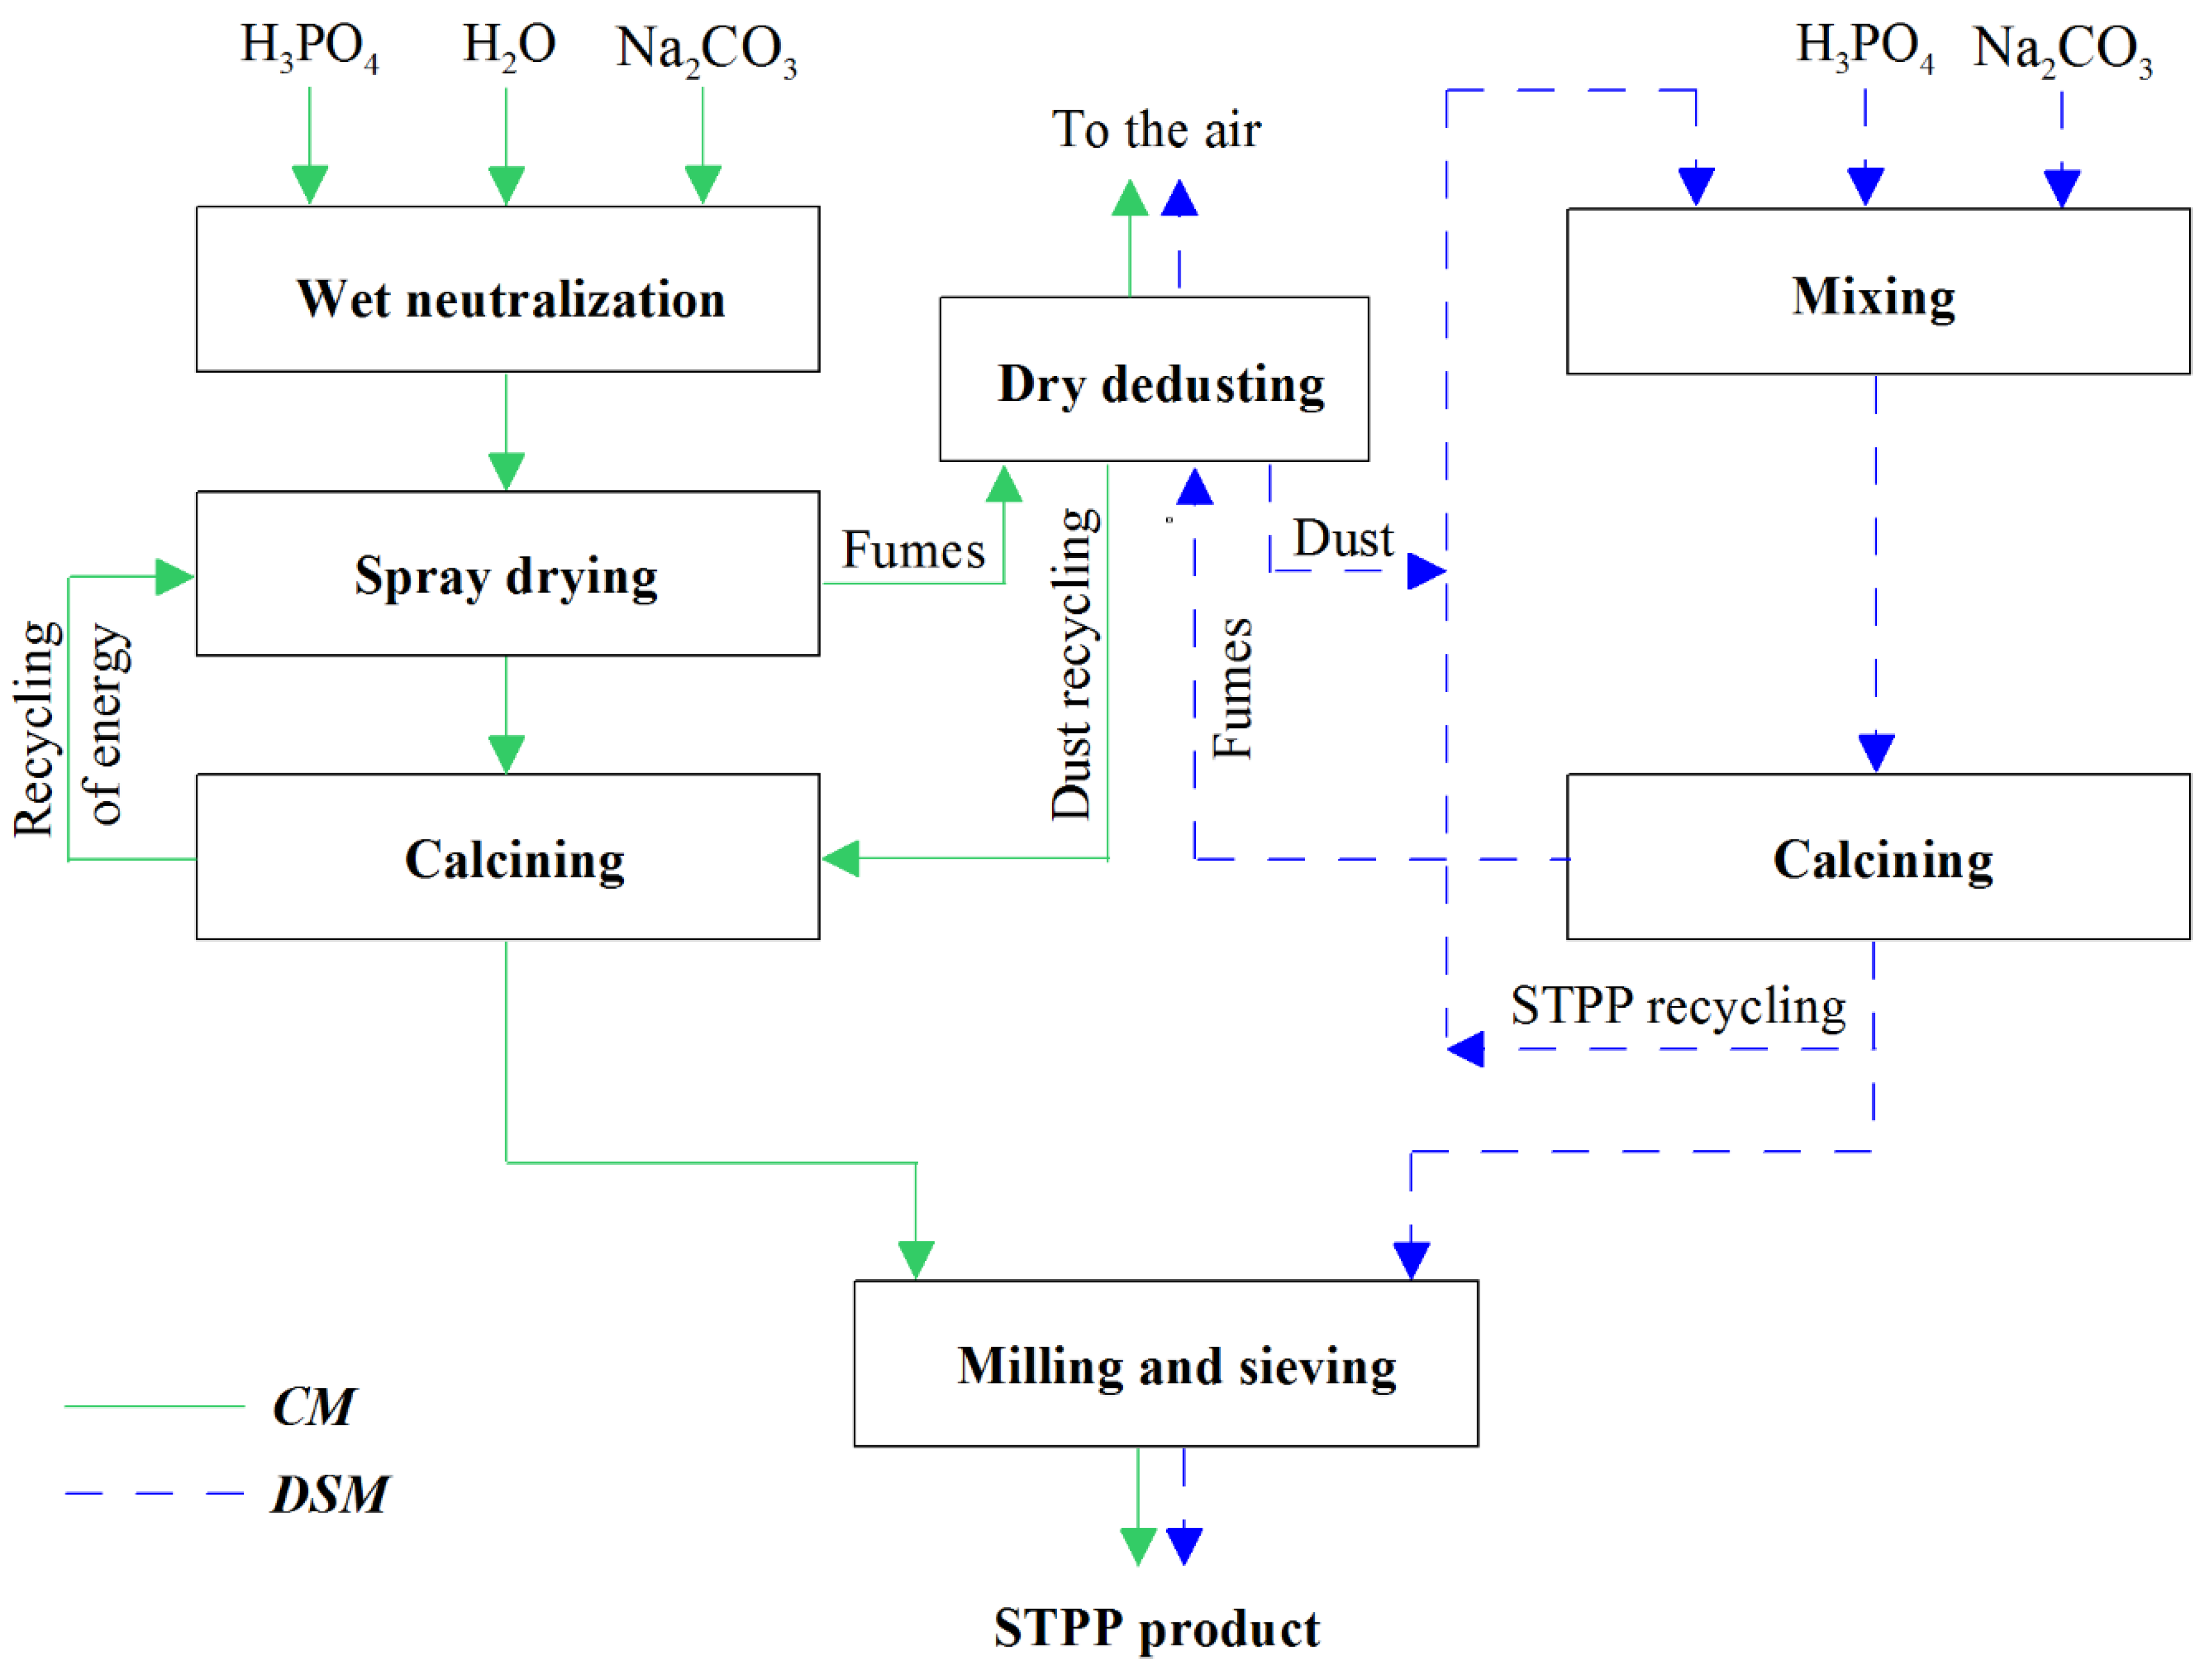
3.2.1. Description of the Compared Sodium Tripolyphosphate (STPP) Production Technologies

To check the proposed method in practice at the micro level, sodium tripolyphosphate production (STPP) was selected for evaluation; two technologies of STPP manufacturing were compared [52]. The first one was the old conventional spatter method (CM), which is typically used to produce STPP. The second was a new dry, one-stage method (DSM) worked out and examined on a laboratory scale.
The first phase of the two-stage CM method, (Figure 1) is neutralization; containing 30% P2O5, phosphoric acid reacts with sodium carbonate to obtain a solution of orthophosphates with the molar proportion Na2O/P2O5 = 1.666. The next stage is the spray drying of sodium orthophosphate solutions, resulting in a condensation reaction which obtains a mixture of tetrasodium diphosphates and disodium dihydrogen diphosphates.
In the second phase, performed in rotary kilns, the mixture of tetrasodium diphosphate and disodium dihydrogen diphosphate is condensed by calcining to obtain the final product, Na5P3O10 [32]. The product undergoes milling, sieving, and packing.
Combustion gases from the rotary kiln pass through a dedusting bag filter and are then recycled into the process. The classic spray method requires energy for the drying and calcining of phosphates. Higher energy consumption resulted from the necessity of the dilution of phosphoric acid during neutralization [45].
In the DSM technology (Figure 1), a blend of sodium carbonate and a determined amount of the recirculated product is neutralized with concentrated phosphoric acid (53% P2O5) to obtain an orthophosphate mixture. The one-phase condensation reaction is realized by calcining in a rotary kiln, where orthophosphates react into pyrophosphates, and are further condensed to receive the end-product Na5P3O10. STPP recirculation makes for a better flow of calcinated mixture in the rotary kiln, prevents the melting of some mass particles, and improves the mass transport in the rotary kiln. Single-stage production eliminates the spray-drying and neutralization stages, due to investment costs being reduced by a minimum of 50% compared to the CM method [53].
The crucial advantage of the DSM is energy savings, which are estimated to be 4.92 GJ/t of STPP produced by DSM, compared to STPP produced by CM, and reduction of electricity consumption by 72.5 kWh/t STPP. The new method creates an opportunity for significant progress in reducing the environmental impact of STPP production, which is achieved mainly through the use of new technological and design solutions, the basic elements of the activities proposed in the cleaner production method. The production costs of STPP obtained by CM and single-stage DSM were compared, with the following assumptions: amortization of 8% and repairs at 50% of amortization costs. Capacity was 40,000 t/y for both methods. Investment costs were estimated to be EUR 18.67 million for CM and EUR 9.335 million for DSM. The cost of STPP production by DSM may be 10.3% lower than that of CM. However, the most important factor is the cost of raw materials, which is upwards of 75% of the total manufacturing costs [52].

3.2.2. Calculation and Comparison of Micro-Level Indicators (CEIs) of Two STPP Production Processes

Calculations of circular economy CEI and CE group options indicators for compared production methods are summarized in Table 2. For each individual option, a single score was calculated resulting from an assessment of five experts (in the range of 0–10 points), the score being the average value of these evaluations. The single score was multiplied by the degree of validity established for each option group by the same panel of experts. To obtain this score, a trimmed mean was calculated, with average trimmed k = 1. In the following are summarized the trimmed means of each core group and the trimmed means of four groups synthesized to obtain one value for the calculated CEI indicator.
Table 3 compares the values of the trimmed means of groups of partial indicators and CEI using the set of options presented in Table 2. The relative increase of CEI (RICEI) compared to the case study of STPP production methods was also presented in Table 2.
The evaluated methods gave very varied scores. The calculated partial indicators for Technical and Environmental groups with the new DSM method were higher, at 192.81% and 254.82%, respectively, than the indicators of the old method. The sum of technical and environmental values was 32.62 (50.01% of CEI) for the DSM method and 13.85 (43.89% of total CEI) for the CM method. This confirms that technical and environmental indicators have the highest impact on the CE indicator score. The calculated relative increase of CEI (RICEI) resulted in a value of 104.80%, showing the dominance of new DSM technology over the old CM method.

3.3. Study Discussion

One of the fundamental issues for the circular economy is how to measure the results of CE implementation. The inability to make such an assessment is a barrier for both producers and consumers, who want to know how to compare products and which of the available indicators measure CE implementation properly and could be used in an effective way by the industry [3].
Industrial companies need CE indicators, but there are no generally accepted methods of measuring circular economy at the micro level. The majority of the indicators focus on economic aspects, with environmental and, especially, social aspects included to a lesser extent [18]. Indicators evaluating goods’ quality take advantage of the characteristic impacts of consumers and markets and combine qualitative and quantitative data to evaluate CE [19,21].
The described method, based on CE strategic activities, allowed this research project to obtain a single score as a CE complex indicator for micro-level manufacturing systems. The worked-out method proposes, first, the collection and selection of the core four groups of Technical, Environmental, Economic, and Social options as the base for the calculation of the CE complex quality indicator. A set of sixty selected options is divided into four core groups. Every group includes the same number of fifteen options, which are chosen to simplify the comparison. A selected option could be treated as representative if it demonstrated features typical of widely used production processes, and its number should be determined by fulfilled needs in terms of a manifold assessment. The selected options combine qualitative and quantitative data to evaluate CE [19,21].
The options were rated by a panel of five experts. The rating range of each option was from zero to ten points. The medium value of the points determined by the expert resulted in a single-score (S) assessment.
The method additionally considers the weighted arithmetical index [40,41] in the form of validity degrees suggested by a panel of experts. Using the trimmed-mean method [42,43] allowed for the summarizing of the scores of individual options into core-group indicators and a total CEI indicator of analyzed production systems.
This paper presents a case study comparing two STPP production processes, using a worked-out CE indicator. From calculated core-group partial indicators, technical and environmental scores of the new DSM method were higher at 192.81% and 254.82% from indicators of the old CM method, respectively, showing the dominance of the new DSM technology over the old CM method. The dry single-stage DSM technology of STPP manufacturing is advantageous for technical, environmental, and economic evaluation (indices twice as high), and much more socially favorable in comparison to the old, classic, spray-dry CM method.
The worked-out method for assessing the CE quality indicator of the production processes at the micro level includes the main quality indicators for a reasonable choice of an assessment of the most acceptable option from among competing ones, a method which can be applied elsewhere as long as enough data is available for the analysis.
The proposed quality indicators are sufficiently general for any type of business and can be used in the decision-making process as strategic points. For a company’s business, this could be relevant across all levels and sectors due to such indicators being based on reliable and measurable data, and it could serve as an input for an action plan.

4. Conclusions

This paper describes a developed qualitative method in a proposed framework and measurement scope for the CEI quality indicator, which is used to assess production systems at the CE micro level. The method could be used for evaluating the influence of individual stages of the designed production process, as it qualitatively characterizes compared systems. The added value of the proposed method for the calculation of the circular-economy indicator for production systems is a total method providing the proper selection and categorization of the collected process options into four core-group categories: Technical, Environmental, Economic, and Social. Their weighing and scoring are performed by a team of experts and the application of the trimmed-mean method, which allows the summarizing of the scores of individual options into core-group indicators and total CEI indicators of the analyzed production systems. A case study described above, as an example of the practical use of the worked-out CE quality indicator, includes the comparison of two methods of STPP production. The calculated relative increase of CEI (RICEI) was determined to be 104.80%, showing that the dry single-stage DSM technology of STPP manufacturing is much more advantageous (with a CEI twice as high) in comparison to the old, classic, spray-dry CM method.

Author Contributions

Conceptualization, Z.K.; methodology, Z.K. and M.B.; formal analysis, Z.K., J.K., M.B. and A.M.; investigation, Z.K. and M.B.; resources, Z.K. and A.M.; data curation, Z.K.; writing—original draft preparation, Z.K. and A.M.; writing—review and editing, Z.K., J.K. and M.B.; visualization, A.M.; supervision, Z.K. and J.K.; funding acquisition, J.K. and A.M. All authors have read and agreed to the published version of the manuscript.

Funding

This research received no external funding.

Institutional Review Board Statement

Not applicable.

Informed Consent Statement

Not applicable.

Data Availability Statement

The data that support the findings of this study are available upon request from the authors.

Conflicts of Interest

The authors declare no conflict of interest.

References

  1. Ghisellini, P.; Cialani, C.; Ulgiati, S. A review on circular economy: The expected transition to a balanced interplay of environmental and economic systems. J. Clean. Prod. 2016, 114, 11–32. [Google Scholar] [CrossRef]
  2. Korhonen, J.; Nuur, C.; Feldmann, A.; Birkie, S.E. Circular economy as an essentially contested concept. J. Clean. Prod. 2018, 175, 544–552. [Google Scholar] [CrossRef]
  3. Saidani, M.; Yannou, B.; Leroy, Y.; Cluzel, F.; Kendall, A. A taxonomy of circular economy indicators. J. Clean. Prod. 2019, 207, 542–559. [Google Scholar] [CrossRef]
  4. Kirchherr, J.; Reike, D.; Hekkert, M. Conceptualizing the circular economy: An analysis of 114 definitions. Resour. Conserv. Recycl. 2017, 127, 221–232. [Google Scholar] [CrossRef]
  5. Tognato de Oliveira, C.; Tavares Dantas, T.E.; Soares, R.S. Nano and micro level circular economy indicators: Assisting decision-makers in circularity assessments. Sustain. Prod. Consum. 2021, 26, 455–468. [Google Scholar] [CrossRef]
  6. Colley, T.A.; Birkved, M.; Olsen, S.I.; Hauschild, M.Z. Using a gate-to-gate LCA to apply circular economy principles to a food processing SME. J. Clean. Prod. 2020, 251, 119566. [Google Scholar] [CrossRef]
  7. Hauschild, M.Z.; Goedkoop, M.; Guinée, J.; Heijungs, R.; Huijbregts, M.; Jolliet, O.; Margni, M.; De Schryver, A.; Humbert, S.; Laurent, A.; et al. Identifying best existing practice for characterization modeling in life cycle impact assessment. Int. J. Life Cycle Assess. 2013, 18, 683–697. [Google Scholar] [CrossRef]
  8. Petit-Boix, A.; Llorach-Massana, P.; Sanjuan-Delmás, D.; Sierra-Pérez, J.; Vinyes, E.; Gabarrell, X.; Rieradevall, J.; Sanyé-Mengual, E. Application of life cycle thinking towards sustainable cities: A review. J. Clean. Prod. 2017, 166, 939–951. [Google Scholar] [CrossRef]
  9. Directorate-General for Environment (European Commission); Joint Research Centre (European Commission). Making Sustainable Production and Consumption a Reality. A Guide for Business and Policymakers to Life Cycle Thinking and Assessment. Publication Office of European Union. 2010. Available online: https://op.europa.eu/en/publication-detail/-/publication/be847e7e-b28f-4968-a980-c595cc2307a5/language-en (accessed on 2 May 2023).
  10. Papamichael, I.; Voukkali, I.; Loizia, P.; Pappas, G.; Zorpas, A.A. Existing tools used in the framework of environmental performance. Sustain. Chem. Pharm. 2023, 32, 101026. [Google Scholar] [CrossRef]
  11. Graedel, T.E.; Allwood, J.; Birat, J.P.; Buchert, M.; Hagelüken, C.; Reck, B.K.; Sibley, S.F.; Sonnemann, G. What do we know about metal recycling rates? J. Ind. Ecol. 2011, 15, 355–366. [Google Scholar] [CrossRef]
  12. Ardente, F.; Mathieux, F. Identification and assessment of product’s measures to improve resource efficiency: The case-study of an Energy using Product. J. Clean. Prod. 2014, 83, 126–141. [Google Scholar] [CrossRef]
  13. Huysman, S.; Debaveye, S.; Schaubroeck, T.; Meester, S.D.; Ardente, F.; Mathieux, F.; Dewulf, J. The recyclability benefit rate of closed-loop and open-loop systems: A case study on plastic recycling in Flanders. Resour. Conserv. Recycl. 2015, 101, 53–60. [Google Scholar] [CrossRef]
  14. Morseletto, P. Targets for a circular economy. Resour. Conserv. Recycl. 2020, 153, 104533. [Google Scholar] [CrossRef]
  15. Crișan, O.A.; Crișan, H.G.; Dan, V.; Șerdean, F.M. Approaching the circular economy in Romania—A higher alternative to linear economy. Acta Tech. Napoc. Ser. Appl. Math. Mech. Eng. 2019, 62, 193–200. [Google Scholar]
  16. Papamichael, I.; Pappas, G.; Siegel, J.E.; Zorpas, A.A. Unified waste metrics: A gamified tool in next-generation strategic planning. Sci. Total Environ. 2022, 833, 154835. [Google Scholar] [CrossRef]
  17. Pauliuk, S. Critical appraisal of the circular economy standard BS8001: 2017 and a dashboard of quantitative system indicators for its implementation in organizations. Resour. Conserv. Recycl. 2018, 129, 81–92. [Google Scholar] [CrossRef]
  18. Kristensen, H.S.; Mosgaard, M.A. A review of micro level indicators for a circular economy—Moving away from the three dimensions of sustainability? J. Clean. Prod. 2020, 243, 118531. [Google Scholar] [CrossRef]
  19. Linder, M.; Sarasini, S.; van Loon, P. A metric for quantifying product-level circularity. J. Ind. Ecol. 2017, 21, 545–558. [Google Scholar] [CrossRef]
  20. Franklin-Johnson, E.; Figge, F.; Canning, L. Resource duration as a managerial indicator for Circular Economy performance. J. Clean. Prod. 2016, 133, 589–598. [Google Scholar] [CrossRef]
  21. Azevedo, S.; Godina, R.; de Oliveira Matias, J.C. Proposal of a sustainable circular index for manufacturing companies. Resources 2017, 6, 63. [Google Scholar] [CrossRef]
  22. Moraga, G.; Huysveld, S.; Mathieux, F.; Blengini, G.A.; Alaerts, L.; Van Acker, K.; de Meester, S.; Dewulf, J. Circular economy indicators: What do they measure? Resour. Conserv. Recycl. 2019, 146, 452–461. [Google Scholar] [CrossRef] [PubMed]
  23. Vanegas, P.; Peeters, J.R.; Cattrysse, D.; Tecchio, P.; Ardente, F.; Mathieux, F.; Dewulf, W.; Duflou, J.R. Ease of disassembly of products to support circular economy strategies. Resour. Conserv. Recycl. 2018, 135, 323–334. [Google Scholar] [CrossRef] [PubMed]
  24. Handbook on Constructing Composite Indicators: Methodology and User Guide. JRC European Commission, © OECD Publications, No. 56327. 2008. Available online: http://search.oecd.org/sdd/42495745.pdf (accessed on 17 August 2023).
  25. Ellen MacArthur Foundation. Circular Indicators: An Approach to Measuring Circularity. Methodology; Ellen MacArthur Foundation: Cowes, UK, 2015. [Google Scholar]
  26. Crișan, O.A.; Bîrleanu, C.; Crișan, H.-G.; Pustan, M.; Merie, V.; Șerdean, F. Eco-innovation analyses in the management of drinking water provided by the main suppliers in Romania. Int. J. Environ. Res. Public Health 2021, 18, 6232. [Google Scholar] [CrossRef]
  27. Scheepens, A.E.; Vogtländer, J.G.; Brezet, J.C. Two life cycle assessment (LCA) based methods to analyse and design complex (regional) circular economy systems. Case: Making water tourism more sustainable. J. Clean. Prod. 2016, 114, 257–268. [Google Scholar] [CrossRef]
  28. Official Journal of the European Union, Opinion of the European Economic and Social Committee on the ‘Communication from the Commission to the European Parliament, the Council, the European Economic and Social Committee and the Committee of the Regions on a Monitoring Framework for the Circular Economy’ (COM(2018) 29 Final). 2018. Available online: https://eur-lex.europa.eu/legal-content/EN/ALL/?uri=CELEX%3A52018AE0464 (accessed on 2 May 2023).
  29. Akhtulov, A.; Ivanova, L.; Charushina, E. Method of quality assessment of design of complex objects in mechanical engineering. IOP Conf. Ser. Mater. Sci. Eng. 2020, 709, 022116. [Google Scholar] [CrossRef]
  30. Pieroni, M.P.P.; McAloone, T.C.; Borgianni, Y.; Maccioni, L.; Pigosso, D.C.A. An expert system for circular economy business modelling: Advising manufacturing companies in decoupling value creation from resource consumption. Sustain. Prod. Consum. 2021, 27, 534–550. [Google Scholar] [CrossRef]
  31. Jabareen, Y. Building a Conceptual Framework: Philosophy, Definitions, and Procedure. Int. J. Qual. Methods 2009, 8, 49–62. [Google Scholar] [CrossRef]
  32. Jianzhong, L.; Jingkun, H.; Yiyang, S.; Heng, L. Qualitative evaluation technology of complex equipment guarantee resources based on grey theory. IOP Conf. Ser. Earth Environ. Sci. 2020, 440, 052059. [Google Scholar] [CrossRef]
  33. Janeková, J.; Onofrejová, D. Quality assessment of production. Transf. Inovácií 2016, 33, 192–194. [Google Scholar]
  34. Lewis, J. Redefining Qualitative Methods: Believability in the Fifth Moment. Int. J. Qual. Methods 2009, 8, 1–14. [Google Scholar] [CrossRef]
  35. Vuk, T. Quality indicators: A tool for quality monitoring and improvement. In Proceedings of the 32nd International Congress of the International Society of Blood Transfusion in Joint Cooperation with the 10th Congress of AMMTAC, Cancun, Mexico, 7–12 July 2012. ISBT Science Series Volume 7, Special Issue: State of the Art Presentations. [Google Scholar] [CrossRef]
  36. Graser, K.; Walzer, A.N.; Hunhevicz, J.; Jähne, R.; Seiler, F.; Wüst, R.; MHall, D.M. Qualitative technology evaluation of digital fabrication with concrete: Conceptual framework and scoreboard. Autom. Constr. 2023, 154, 104964. [Google Scholar] [CrossRef]
  37. Kowalski, Z.; Kulczycka, J.; Makara, A.; Verhé, R.; De Clercq, G. Assessment of energy recovery from municipal waste management systems using circular economy quality indicators. Energies 2022, 15, 8625. [Google Scholar] [CrossRef]
  38. Kowalski, Z.; Makara, A. Comparison of technologies for the sodium tripolyphosphate production by conventional spray and new one-stage dry methods. Przem. Chem. 2017, 96, 187–192. (In Polish) [Google Scholar] [CrossRef]
  39. Kowalski, Z.; Generowicz, A.; Makara, A.; Kulczycka, J. Evaluation of municipal waste landfilling using the technology quality assessment method. Environ. Prot. Eng. 2015, 41, 167–179. [Google Scholar] [CrossRef]
  40. Ramu, P.; Shiva Bhushan, J.Y.V.; Shravani, B.; Nagarani, I. Cinder coal-aggregate quality index (AQI) appraisal based on weighted arithmetic index method and fuzzy logic. In Advances in Geotechnical and Transportation Engineering. Lecture Notes in Civil Engineering; Saride, S., Umashankar, B., Avirneni, D., Eds.; Springer: Singapore, 2020; Volume 71, pp. 153–163. [Google Scholar] [CrossRef]
  41. Satish Chandra, D.; Asadi, S.S.; Raju, M.V.S. Estimation of water quality index by weighted arithmetic water quality index method: A model study. Int. J. Civ. Eng. Technol. 2017, 8, 1215–1222. Available online: https://sdbindex.com/documents/00000001/00000-62352 (accessed on 10 May 2022).
  42. Sheu, D.D.; Hou, C.T. TRIZ-based trimming for process-machine improvements: Slit-valve innovative redesign. Comput. Ind. Eng. 2013, 66, 555–556. [Google Scholar] [CrossRef]
  43. Li, M.; Ming, X.; He, L.; Zheng, M.; Xu, Z. A TRIZ-based trimming method for patent design around. Comput. Aided Des. 2015, 62, 20–30. [Google Scholar] [CrossRef]
  44. Bilitewski, B. The circular economy and its risks. Waste Manag. 2012, 32, 1–2. [Google Scholar] [CrossRef]
  45. Van Berkel, R. Cleaner production and eco-efficiency initiatives in Western Australia 1996–2004. J. Clean. Prod. 2007, 15, 741–755. [Google Scholar] [CrossRef]
  46. Dijkmans, R. Methodology for selection of best available techniques (BAT) at the sector level. J. Cleaner Prod. 2000, 8, 11–21. [Google Scholar] [CrossRef]
  47. Rizos, V.; Tuokko, K.; Behrens, A. The Circular Economy: A Review of Definitions, Processes and Impacts. CEPS Research Reports, No. 2017/08. Available online: https://www.ceps.eu/wp-content/uploads/2017/04/RR2017-08_CircularEconomy_0.pdf/ (accessed on 10 May 2022).
  48. Bicket, M.; ten Brink, P.; van Dijl, E.; Guilcher, S.; Hestin, M.; Hudson, C.; Razzini, P.; Tan, A.; Vanner, R.; Watkins, E.; et al. Scoping Study to Identify Potential Circular Economy Actions, Priority Sectors, Material Flows and Value Chains; Publications Office of the European Union: Luxembourg, 2014; Available online: https://www.eesc.europa.eu/resources/docs/scoping-study.pdf/ (accessed on 18 May 2023).
  49. Potting, J.; Hekkert, M.; Worrell, E.; Hanemaaijer, A. Circular Economy: Measuring Innovation in the Product Chain; Policy Report; PBL Netherlands Environmental Assessment Agency: Hague, The Netherlands, 2017; Available online: https://www.pbl.nl/sites/default/files/downloads/pbl-2016-circular-economy-measuring-innovation-in-product-chains-2544.pdf (accessed on 10 May 2022).
  50. Van Buren, N.; Demmers, M.; Van der Heijden, R.; Witlox, F. Towards a circular economy: The role of Dutch logistics industries and governments. Sustainability 2016, 8, 647. [Google Scholar] [CrossRef]
  51. Kaltenbach, H.M. A Concise Guide to Statistics; Springer: Berlin/Heidelberg, Germany, 2011. [Google Scholar] [CrossRef]
  52. Kowalski, Z.; Makara, A.; Henclik, A.; Kulczycka, J.; Cholewa, M. Comparative evaluation of sodium tripolyphosphate production technologies with the use of a complex quality method. Pol. J. Chem. Technol. 2020, 22, 48–54. [Google Scholar] [CrossRef]
  53. Kowalski, Z.; Makara, A. The synthesis of tripolyphosphate using a one-stage method and a laboratory rotary kiln. Pol. J. Chem. Technol. 2014, 16, 36–40. [Google Scholar] [CrossRef]
Figure 1. Flowsheet of the STPP technologies. CM—spatter two-stage technology; DSM—dry one-stage technology.
Sustainability 15 13495 g001
Table 1. Collected options for the assessment of CE micro-level indicators.
Options Group FrameworkOption SymbolOption Description
Technical
(T)
T1Accessibility of production methods. Difficulty level and implementation time.
T2Technology and project innovation level. Degree of modernity in comparison to the global level according to BAT.
T3Technology and production difficulty level. Risk of implementation and probability of success.
T4Production method simplification. Reduction in the number of operations and unit processes.
T5Reduction/shortening of transport routes.
T6Reduction of energy consumption figures.
T7Reduction in materials consumption figures and of harmful materials used.
T8Use of renewable energy/bioenergy.
T9Improvement in product quality and stability.
T10Eco-design for sustainable products, which covers energy-related products. It should be consistent with the CP methodology of cleaner production and compatible with SD goals.
T11Consistency with the methodology of cleaner production.
T12Compatibility with the purposes of sustainability.
T13Efficient packaging-design strategies.
T14Evaluation of physical characteristics from the production cycles based on LCT procedures, e.g., index of reusability/recyclability/recoverability (RRR) in approaching a possible index of the reuse of goods, decreased use of raw materials, increased recycling of waste, and the recovery of energy.
T15Required legal authorizations.
Environmental
(En)
En1Decreased environmental impact through the increase of manufacturing productivity by using a lower number of primary resources.
En2Changes in process manuals. Changes in project solutions and modifications of existing technologies.
En3Waste release reduction and prevention of pollution emission. Reductions of the toxicity degree of waste and in the formation of secondary waste.
En4Assessment of the amount and properties of emissions in terms to the release of waste into the environment.
En5Refurbishment of older products for their modernization and using spent goods or their parts in new products with different functions.
En6Waste reduction at the source.
En7Incentivized high-quality recycling. In-process recirculation of substrates.
En8On-site and off-site recirculation of materials.
En9Incentivized high-quality recycling. In-process recirculation of energy.
En10On-site and off-site recirculation of energy.
En11Remanufacturing of used products or their elements into new goods with the same characteristics.
En12Solutions that render the optimum levels of waste collection.
En13Take-back schemes of remanufacturing. Separating waste flows and bringing the waste to remanufacture/recirculation/sorting sites.
En14Recycling process substrates to produce the same goods with higher or lower degrees of quality.
En15Combustion of materials to recover energy.
Economic (Ec)Ec1Effective management of waste and by-products.
Ec2Optimum location.
Ec3Consistency with state and EU economic policy.
Ec4End-of-life management and disassembly.
Ec5Increasing the longevity of the product, with the aim of its staying within the economy as long as possible.
Ec6Regeneration and recirculation as the most important activities for CE development.
Ec7Substitution for natural resources by waste.
Ec8Labor demand.
Ec9Total energy expenses.
Ec10Total materials cost.
Ec11Reparation and conservation costs.
Ec12Production cost.
Ec13Capital expenditures. Tme investment, outlays recovery, and implementation efficiency.
Ec14Amortization.
Ec15Product-life extension.
Societal (Soc)Soc1Participation in novel types of consumption (e.g., readiness to pay more for products’ persistence).
Soc2Reuse as the effect of a changing approach in terms of repairs and renovations.
Soc3Keeping the higher value of goods as long as possible.
Soc4Workplace formation in regions with rising unemployment.
Soc5Increased numbers of higher-qualified employees.
Soc6Influence on distribution between parts of society with differentiated revenue.
Soc7Decreased hazard for societal healthiness.
Soc8Shift in consumption patterns. Consumer could use optimum quantity of goods, energies, or services.
Soc9Advantageous influence of high-quality goods on human healthiness.
Soc10Improvement of relationships with consumer.
Soc11Improvement of relationships with society.
Soc12Degree of adaptation to local conditions.
Soc13Reuse by other consumers of discarded goods having adequate quality and having achieved their primary objective.
Soc14Abandonment of product by eliminating its function or by proposing the same characteristic for completely different goods.
Soc15Goods used more intensively.
Table 2. Calculation and comparison of micro-level indicators (CEI) of STPP manufacturing with the dry one-stage DSM and spray-drying CM methods.
Options Group FrameworkOptions SymbolSingle Option
Score (S)
Single Score S*dwi
Considered as Degree Validity
Single Score S*dwi Considered as Degree Validity after the Rejection of Extreme Values (k = 1)
DSMCMDSMCMDSMCM
Technical (T)
Degree of Validity
dwCE T = 1
T110101010
T2929292
T3929292
T4102102102
T5929292
T6919191
T7656565
T80000
T9878787
T10939393
T11747474
T12747474
T13888888
T14767676
T15101010101010
Trimmed mean of Technical group partial indicator ∑S*T8.314.31
Environmental (En)
Degree of Validity
dwCE En = 4
En182328328
En27328122812
En38332123212
En482328328
En50000
En69436163616
En791364364
En89436163616
En958203220
En10000000
En11000000
En128532203220
En138632243224
En14101404 4
En15000000
Trimmed mean of Environmental group partial indicator ∑S*En24.319.54
Economic (Ec)
Degree of Validity
dwCE Ec = 3
Ec110103030
Ec2101030303030
Ec39627182718
Ec47121321
Ec56618181818
Ec61133 3
Ec793279279
Ec88424122412
Ec98724212421
Ec1083249249
Ec1183249249
Ec128724212421
Ec1393279279
Ec1482246246
Ec158724212421
Trimmed mean of Economic group partial indicator ∑S*Ec24.4614.31
Societal (Soc)
Degree of Validity
dwCE Soc = 2
Soc1316262
Soc20000
Soc387161416
Soc4112222
Soc5224444
Soc6326464
Soc7000000
Soc8214242
Soc9000000
Soc10951810 10
Soc1183166166
Soc1293186186
Soc13000000
Soc1491182182
Soc158516101610
Trimmed mean of Societal group partial indicator ∑S*Soc8.153.69
CEI indicator65.2331.85
Relative increase of CEI (RICEI)104.80%
Table 3. Calculation of trimmed means of a group of partial indicators and CEI indicator for STPP production with the dry one-stage method DSM and classic method CM.
Option Group Partial IndicatorsTrimmed Means of Partial IndicatorDSM/CM
(%)
DSMCM
Technical CET8.314.31192.81
Environmental CEEn24.319.54254.82
Economic CEEc24.4614.31170.93
Societal CESoc8.153.69220.87
CEI65.2331.85204.80
Disclaimer/Publisher’s Note: The statements, opinions and data contained in all publications are solely those of the individual author(s) and contributor(s) and not of MDPI and/or the editor(s). MDPI and/or the editor(s) disclaim responsibility for any injury to people or property resulting from any ideas, methods, instructions or products referred to in the content.

