Article

The Application of AutoML Techniques in Diabetes Diagnosis: Current Approaches, Performance, and Future Directions

by
Lily Popova Zhuhadar
1 and
Miltiadis D. Lytras
2,*
1
Center for Applied Data Analytics, Western Kentucky University, Bowling Green, KY 42101, USA
2
Effat College of Engineering, Effat University, Jeddah P.O. Box 34689, Saudi Arabia
*
Author to whom correspondence should be addressed.
Sustainability 2023, 15(18), 13484; https://doi.org/10.3390/su151813484
Submission received: 19 May 2023 / Revised: 28 August 2023 / Accepted: 4 September 2023 / Published: 8 September 2023
(This article belongs to the Special Issue Knowledge Management in Healthcare)

Abstract

:
Artificial Intelligence (AI) has experienced rapid advancements in recent years, facilitating the creation of innovative, sustainable tools and technologies across various sectors. Among these applications, the use of AI in healthcare, particularly in the diagnosis and management of chronic diseases like diabetes, has shown significant promise. Automated Machine Learning (AutoML), with its minimally invasive and resource-efficient approach, promotes sustainability in healthcare by streamlining the process of predictive model creation. This research paper delves into advancements in AutoML for predictive modeling in diabetes diagnosis. It illuminates their effectiveness in identifying risk factors, optimizing treatment strategies, and ultimately improving patient outcomes while reducing environmental footprint and conserving resources. The primary objective of this scholarly inquiry is to meticulously identify the multitude of factors contributing to the development of diabetes and refine the prediction model to incorporate these insights. This process fosters a comprehensive understanding of the disease in a manner that supports the principles of sustainable healthcare. By analyzing the provided dataset, AutoML was able to select the most fitting model, emphasizing the paramount importance of variables such as Glucose, BMI, DiabetesPedigreeFunction, and BloodPressure in determining an individual’s diabetic status. The sustainability of this process lies in its potential to expedite treatment, reduce unnecessary testing and procedures, and ultimately foster healthier lives. Recognizing the importance of accuracy in this critical domain, we propose that supplementary factors and data be rigorously evaluated and incorporated into the assessment. This approach aims to devise a model with enhanced accuracy, further contributing to the efficiency and sustainability of healthcare practices.

1. Introduction

1.1. Research Objectives

Diabetes mellitus is a chronic metabolic disorder affecting millions of people worldwide, posing significant challenges for healthcare systems [1]. Diabetes, a relentless chronic ailment, surfaces either when the pancreas fails to generate adequate insulin or when the body is inefficient in capitalizing on the insulin produced. Regrettably, no cure has been discovered for this disease yet. Diabetes is generally conceived as an outcome of a complex interplay between genetic predispositions and environmental triggers [2]. Numerous risk factors associated with diabetes span across ethnicity, family history, advancing age, excessive weight, poor dietary choices, lack of physical activity, and smoking habits [3]. Significantly, the lack of early detection of diabetes not only worsens the disease prognosis but also sets the stage for the development of further chronic conditions such as kidney disease [4]. Patients suffering from pre-existing non-communicable diseases occupy an exceptionally vulnerable position. Their susceptibility to infectious diseases, including but not limited to the formidable COVID-19, is significantly heightened [5]. Therefore, appraising the risk factors and potential susceptibility to chronic conditions, such as diabetes, becomes an area of critical importance within the healthcare domain. An early diagnosis of these chronic ailments offers twofold benefits: it aids in mitigating future medical costs, and concurrently decreases the likelihood of exacerbating health complications, thus ensuring the maintenance of a patient’s quality of life. These insights equip healthcare professionals with valuable data, enabling them to make more informed, strategic decisions about patient treatment. This is crucial in high-risk scenarios, where the right decisions can make a significant difference in patient outcomes.
Recent advancements in AI and machine learning algorithms have paved the way for more accurate and efficient predictive models in the diagnosis and management of diabetes [6]. While machine learning offers innovative solutions across various sectors, a significant level of distrust persists among certain groups. This skepticism primarily arises from the ‘black-box’ nature of these models, characterized by their opaqueness in revealing internal decision-making processes. Such a lack of explainability can lead to apprehension among potential users, particularly in the healthcare sector [7]. This sector’s slow adoption of machine learning solutions is reflective of consumers’ wariness of technologies they perceive as enigmatic and potentially fallible [8]. The need for transparency in machine learning cannot be overstated, especially in a field as critical as healthcare. Here, errors can have dire, often irreversible consequences. As such, the ability to elucidate the logic and processes behind a machine learning prediction becomes vital. Providing insight into the reasoning that drives these predictions is instrumental in fostering trust among end-users. By achieving this, we can catalyze the broader acceptance and application of machine learning solutions in healthcare, thereby maximizing their potential in advancing patient care.
This research explores the development of an open-source, cloud-based platform for creating highly accurate predictive classification models. This tool is geared towards assisting healthcare professionals in early diabetes detection based on various risk indicators. By providing a preliminary diagnosis, it enables medical practitioners to advise patients on proactive measures, such as diet modification, exercise, and blood glucose monitoring. The effectiveness of these classification models was assessed through multiple evaluative measures, including accuracy, precision, recall, F-measure, confusion matrices, and the area under the receiver operating characteristic (ROC) curve. This multifaceted evaluation was essential for identifying the highest-performing classifier [9].
Insightful features instrumental in predicting diabetes severity were gleaned from the most effective classification models. As a result, the platform is envisioned as an invaluable resource for clinicians, empowering them with data-driven insights to provide informed counsel and initiate effective treatment protocols for patients at a heightened risk of diabetes or those requiring urgent intervention. Ultimately, this study strives to identify the contributing factors to diabetes onset, thereby enhancing the accuracy of predictive models and facilitating earlier, more effective intervention.
This study utilizes the Pima Indian Diabetes dataset, a notable benchmark in diabetes research. The Pima Indians, an Indigenous group residing in Arizona, USA and Mexico, have been found to exhibit an unusually high incidence rate of diabetes mellitus [10]. As such, studies focusing on this group hold substantial relevance and potential for advancing global health knowledge [11,12]. In particular, the dataset encompasses Pima Indian females aged 21 and above. Not only does this dataset offer valuable insights into diabetes, but it also serves as a crucial resource for understanding health patterns among underrepresented minority or Indigenous communities.
The National Institute of Diabetes and Digestive and Kidney Diseases (NIDDK [13]) is diligently endeavoring to augment the precision of diabetes diagnosis by harnessing the power of a meticulously curated dataset, replete with pertinent diagnostic measurements that hold the key to unlocking a more refined understanding of the disease and its intricate mechanisms. The ramifications of these findings possess the potential to transcend the immediate interests of the NIDDK, extending to the broader medical community and, most critically, to the patients whose lives could be significantly improved through enhanced diagnostic precision.
As the investigation advances and a more expansive array of variables is scrutinized, the prediction model is anticipated to undergo a continuous metamorphosis, thereby empowering medical professionals to manage diabetes risk more adeptly on an individual level. This heightened diagnostic accuracy is poised to yield more tailored advice and treatment modalities, ultimately ameliorating the lives of those afflicted by diabetes. While novel factors will invariably emerge, the primary aspiration remains the unyielding refinement and improvement of the model, ensuring its enduring applicability within the realms of medical research and practice. The sustained investment in diabetes prediction modeling is indisputably essential, given the profound implications for patients and the medical community at large. By leveraging machine learning algorithms for predictive modeling in diabetes diagnosis, healthcare professionals can harness the power of advanced analytics to identify early warning signs and risk factors, ultimately enabling more accurate and timely intervention strategies. In summation, this ambitious research venture harbors immense potential for revolutionizing the future of diabetes diagnosis and management, and the findings are poised to leave an indelible impact on the fields of medical research and practice.

1.2. Scientific Context of the Study

In this segment of the paper, we plunge into the complex world of machine learning, considering it as a crucial facet within the realm of artificial intelligence (AI). Our exploration commences with an overview of the current state of AI, clarifying its contemporary advancements and direction. We then navigate the discourse towards a comparative analysis of AI, machine learning, deep learning, and generative AI [14]. Through this comparative lens, we illuminate their distinct features as well as their overlapping facets. This comparison shines a light on their unique characteristics and shared elements, enabling us to appreciate the interconnectedness and individuality of these concepts. This understanding is crucial in realizing the full potential of AI and its multifaceted aspects in current and future applications.
As our discourse unfolds, we underscore the concept of AutoML, an innovative tool that has become central to numerous sectors, including healthcare. By highlighting specific instances, we illustrate the profound transformative influence AutoML has on these industries, enabling efficiency and precision. As we approach the end of this section, we turn our attention to the pressing issue of health inequity. We propose potential pathways through which AutoML, when thoughtfully applied, could serve as a powerful tool in mitigating this pervasive challenge. The overarching objective of this discourse is to inspire a profound comprehension of the complex intersections among AI, AutoML, and health equity, thus deepening our understanding of how these components can synergistically work towards a more equitable future.

1.2.1. Comparative Analysis of AI, Machine Learning, Deep Learning, and Generative AI

In recent years, the disciplines of artificial intelligence (AI), machine learning (ML), and deep learning (DL) have garnered substantial attention, establishing themselves as focal points in the technology sector. These techniques, subsets of AI, are employed to automate processes, predict outcomes, and derive insights from extensive datasets. The preceding six months have witnessed a phenomenal surge in generative AI, most notably marked by OpenAI’s “ChatGPT” [15]. Despite some shared characteristics, these areas exhibit profound differences. This section will elucidate the principal distinctions among AI, ML, DL, and generative AI.
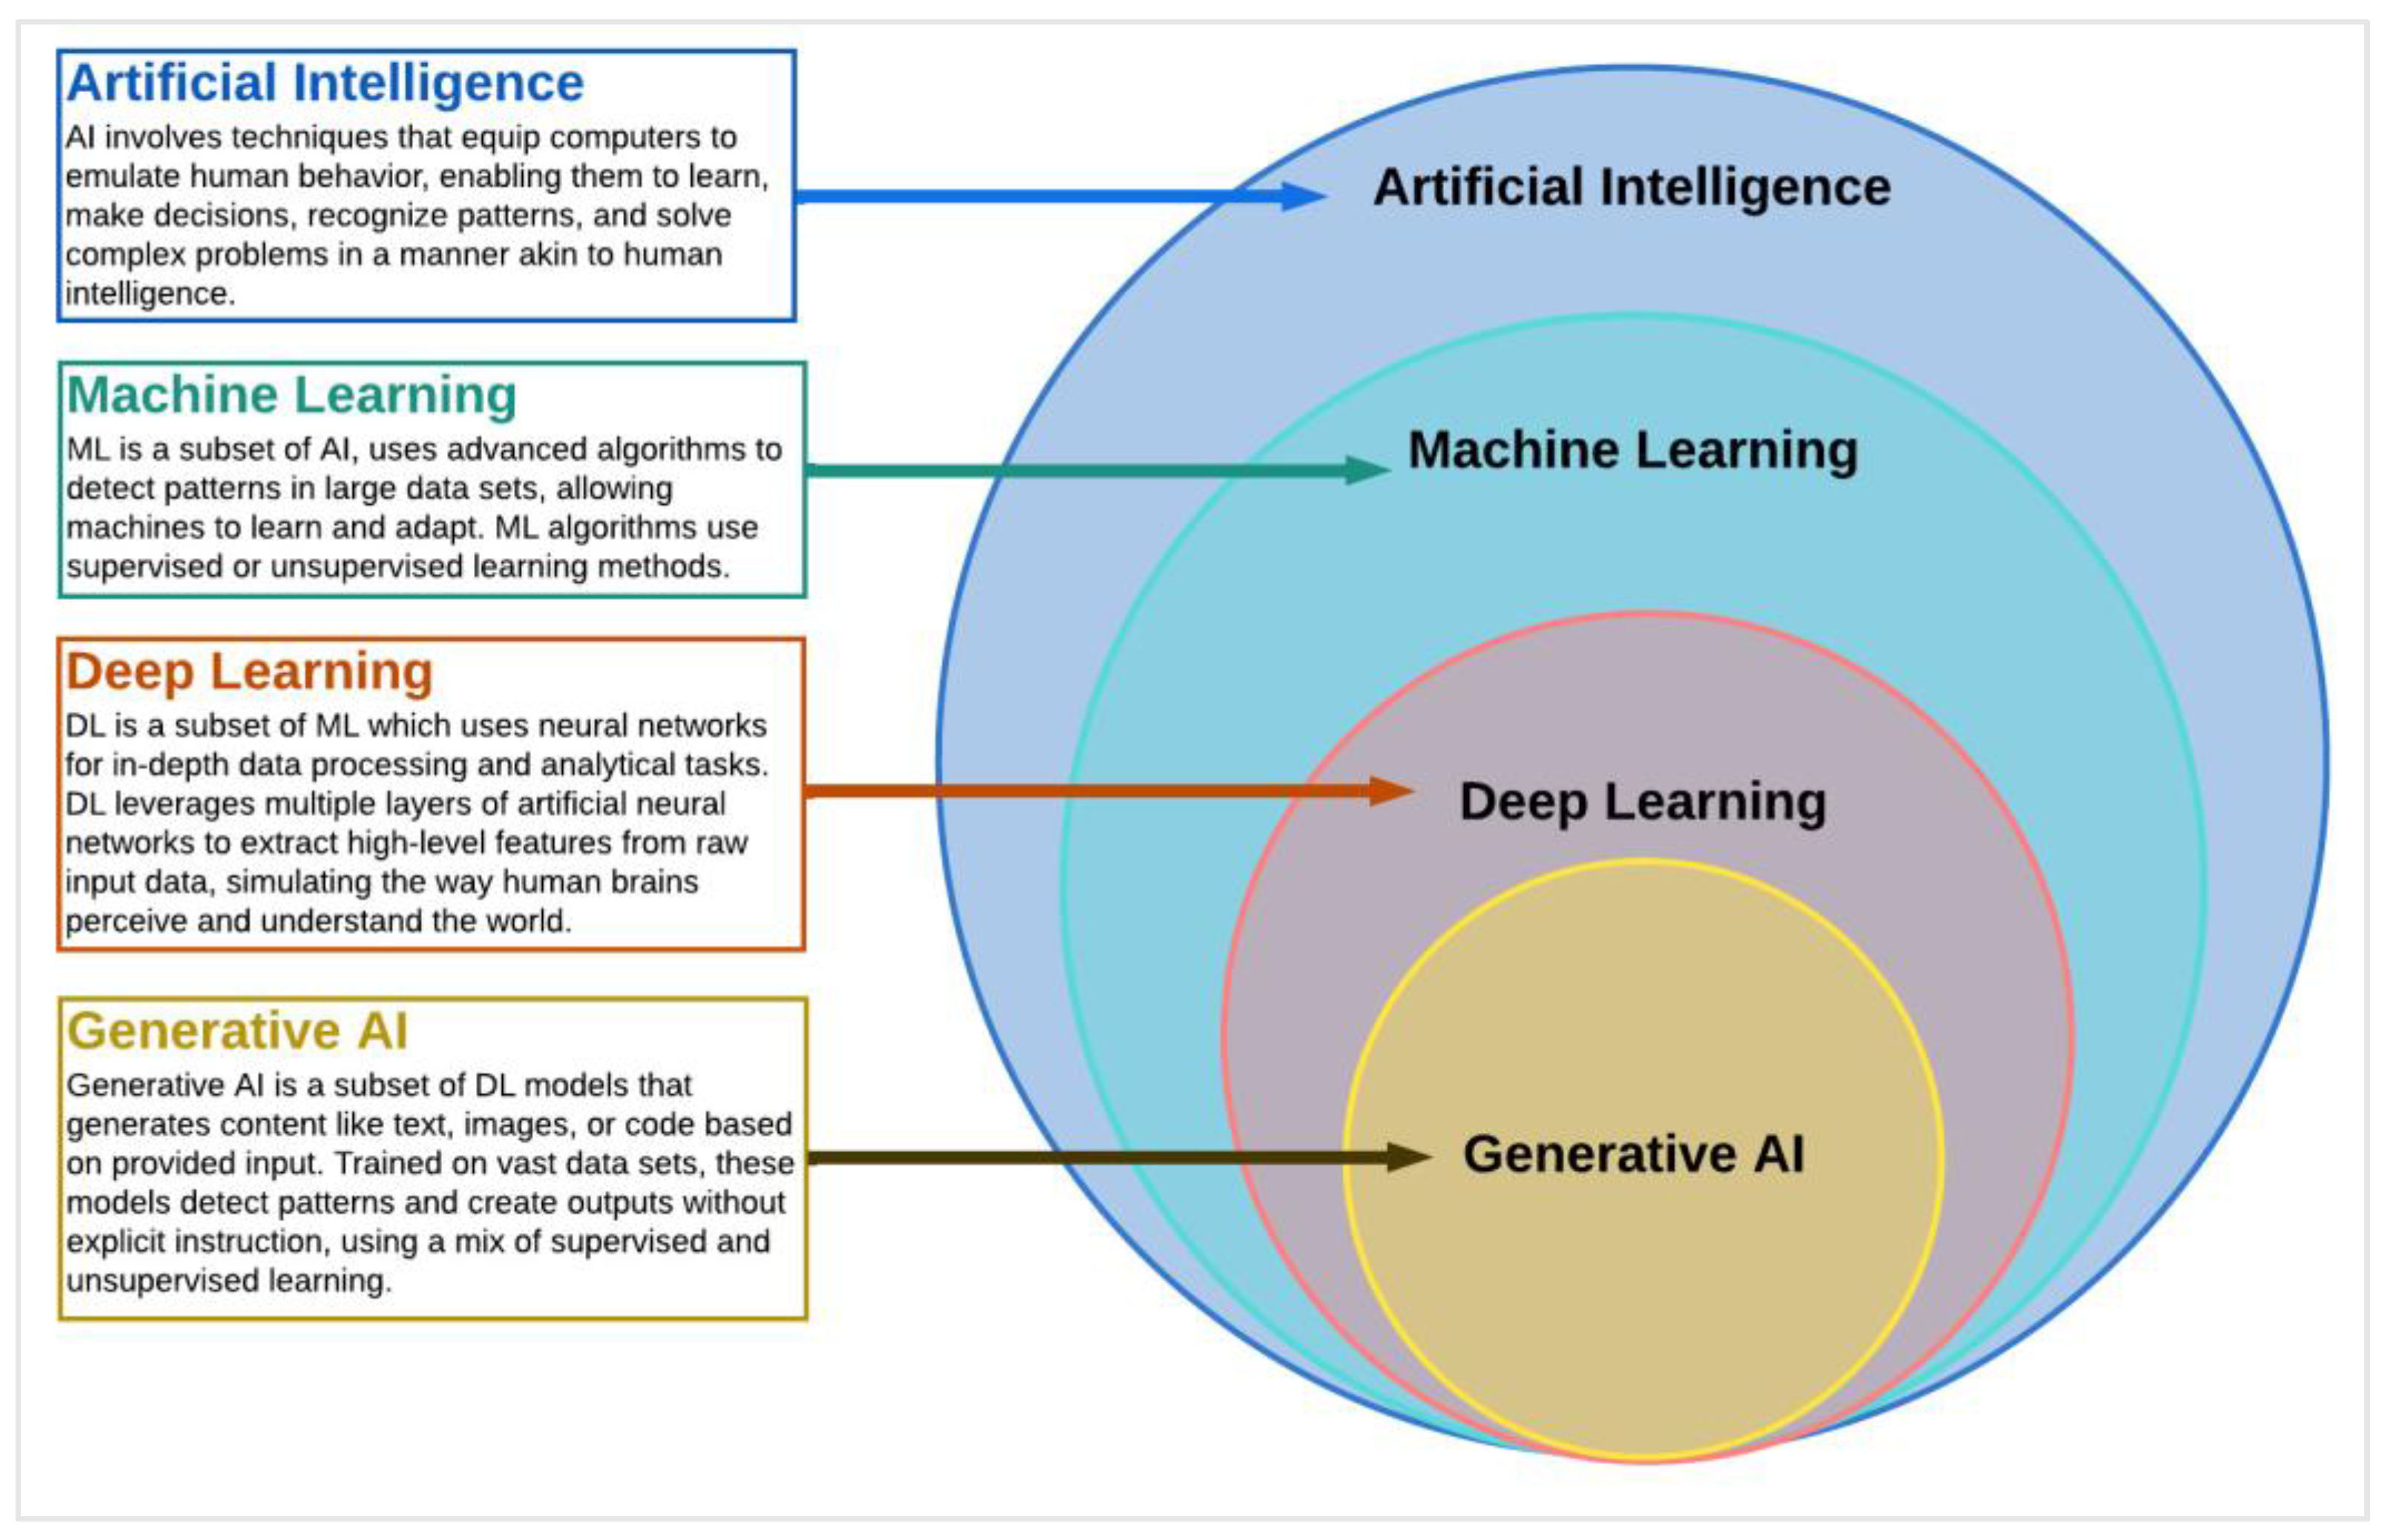
Artificial intelligence (AI), a key pillar of computer science, represents a complex and dynamic field that engages a wide array of techniques to empower machines to exhibit capabilities analogous to human cognition (refer to Figure 1). It incorporates methods that facilitate computational systems to replicate human-like behavior, ranging from basic task execution to advanced problem solving and decision making.
This field aims at creating systems that can intelligently analyze the environment, learn from experiences, draw inferences, understand complex concepts, and even exhibit creativity, all of which were traditionally considered unique to human intelligence; it is commonly defined as a field that encompasses any technology that imparts human-like cognitive abilities to computers [17].
The notion of AI achieving human-level cognitive abilities has been popularized through various methodologies, one of the most notable ones being the seminal—albeit somewhat antiquated—Turing Test. This test, proposed by the British mathematician Alan Turing, gauges a machine’s ability to exhibit intelligent behavior that is indistinguishable from that of a human. Modern manifestations of AI, such as Apple’s Siri, exemplify this notion quite vividly. When we interact with Siri and receive a coherent response, it mirrors a human-like conversational ability, indicating how far AI has evolved in mimicking human interaction.
Machine learning (ML), a significant subset of AI (refer to Figure 1), is primarily concerned with deciphering patterns embedded within datasets. This intricate process not only empowers machines to derive rules for optimal behavior but also equips them to adapt to evolving circumstances in the world. The algorithms involved in this endeavor, while not novel in their inception, have been known and explored for decades and, in some cases, centuries. However, it is the recent breakthroughs in the domain of computer science and parallel computing that have imbued these algorithms with the capability to operate at an unprecedented scale. Now they can handle and analyze voluminous datasets, a feat that was previously unattainable. This transformative advancement has significantly broadened the application and impact of ML, heralding a new era in the field of AI [18].
Deep learning (DL), a subset of ML (refer to Figure 1), operates through the utilization of intricate neural networks. In essence, it represents a set of interrelated techniques akin to other methodological groups such as ‘Decision Trees’ or ‘Support Vector Machines’. The recent surge in its popularity can be largely attributed to the significant strides made in parallel computing. This has enabled DL techniques to handle larger datasets and perform more complex computations, thereby resulting in heightened interest and widespread application in the field. Nevertheless, there exists a significant differentiation between ML and DL in terms of the learning methods they employ. ML algorithms typically utilize either supervised or unsupervised learning approaches. In supervised learning, algorithms are trained on labeled datasets, where each input data point is associated with a specific output [19]. For example, an algorithm can be trained using a collection of labeled images of cats and dogs, enabling it to predict whether a new image contains a cat or a dog. However, unsupervised learning algorithms are employed when input data lack designated outputs, and their purpose is to identify patterns within the data [19].
In the realm of DL, algorithms primarily leverage a form of supervised learning known as deep neural networks. These networks are composed of multiple layers of interconnected nodes designed to hierarchically process data. Each layer in the network extracts features from the input data, which are then used by subsequent layers to further refine the output. DL algorithms have the capacity to learn from unstructured data, including images, audio, and text, making them versatile across various applications such as image recognition, speech recognition, and natural language processing [20]. However, a limitation of DL algorithms, as observed in studies, is their lack of interpretability [21]. Due to their autonomous learning nature, deciphering the decision-making process of deep neural networks can be challenging, posing a significant obstacle in scenarios where end-users or stakeholders require explanations for an algorithm’s decisions. Conversely, ML algorithms often provide superior interpretability, as they are designed to make decisions based on specific rules or criteria. For instance, the logic behind a Decision Tree algorithm, which relies on a series of if–then statements, can be easily articulated and understood [22]. Moreover, DL algorithms have gained recognition for their remarkable accuracy and performance in tasks involving image recognition and natural language processing. Their ability to discern complex patterns and relationships within data contributes to this superior performance, which may prove challenging for other types of algorithms [23].
However, it is essential to acknowledge that DL algorithms can be computationally demanding and may require specialized hardware to achieve optimal accuracy and performance [24]. In contrast, ML algorithms, while potentially lacking the same level of accuracy or performance, generally exhibit higher speed and require fewer computational resources. Despite these differences, ML algorithms remain effective in tasks such as predictive modeling and anomaly detection.
Generative AI represents a subset of sophisticated DL models designed to produce text, images, or code based on textual or visual inputs. Two leading frameworks in the realm of generative AI currently dominate the field: generative adversarial networks (GANs) and generative pre-trained transformers (GPTs) [25].
The concept of GANs, devised by Ian Goodfellow [26] in 2014, operates on the premise of competition between two neural network sub-models. A generator model is tasked with creating new content, while a discriminator model is charged with classifying this content as real or counterfeit. These models engage in a perpetual learning cycle, consistently enhancing their capabilities until the discriminator is unable to distinguish between the output of the generator and authentic input examples. On the other hand, the GPT framework is employed primarily for generative language modeling.
Generative AI’s main objective is to emulate human interaction. It operates using a synergistic blend of supervised learning (predicting the subsequent word in a sentence based on the preceding words) and unsupervised learning (discerning the structure of language without explicit guidance or labels). Its capabilities are vast, ranging from generating text and code, providing translations across various languages, creating a diverse range of creative content, and engaging in conversational dialogue.

1.2.2. Why Is Generative AI Crucial in Today’s Technological Landscape?

The origin of generative AI can be traced back to the 1950s, when pioneers in computer science began to experiment with Markov Chains algorithms [27] to generate novel data. Despite its longstanding history, it is only in recent years that we have seen transformative strides in generative AI’s performance and capabilities. This leap in progress has witnessed its application in diverse fields, whether it be generating engaging narratives in text generation [28], synthesizing melodious compositions in music generation [29], or crafting visually engaging content in image generation [30,31]. However, the recent advancements in AI technology now demand a reassessment of how we interact with our environment. AI has bolstered computing capabilities, enhancing both speed and scalability [32,33,34,35]. In bioinformatics, it has ushered in a revolution, allowing for rapid, accurate, and cost-effective human genome sequencing [36,37,38,39].
By taking on routine tasks, AI has propelled workplace efficiency and productivity to unprecedented levels [40,41], While these AI tools might not surpass human ingenuity yet, they serve as vital enablers for innovation, design, and engineering, thereby considerably amplifying human creativity and efficiency.
Cutting-edge generative AI technologies, such as GPT-4 and DALL-E 2, are designed around machine learning algorithms that can autonomously produce novel content. GPT-4, OpenAI’s most sophisticated large language model yet, excels in understanding and using context-appropriate words, thereby creating meaningful language that mirrors human communication with striking accuracy. The vast potential of AI cannot be overstated. Its applications span from driving breakthroughs in disease management to boosting workplace performance. The promise that AI holds is profound and its implications far-reaching. While generative AI has yet to fully capture the nuances of human creativity, it has nonetheless emerged as a potent catalyst for innovation in various domains, including design and engineering. This thereby amplifies human inventiveness and productivity.

1.2.3. What Is Automated Machine Learning?

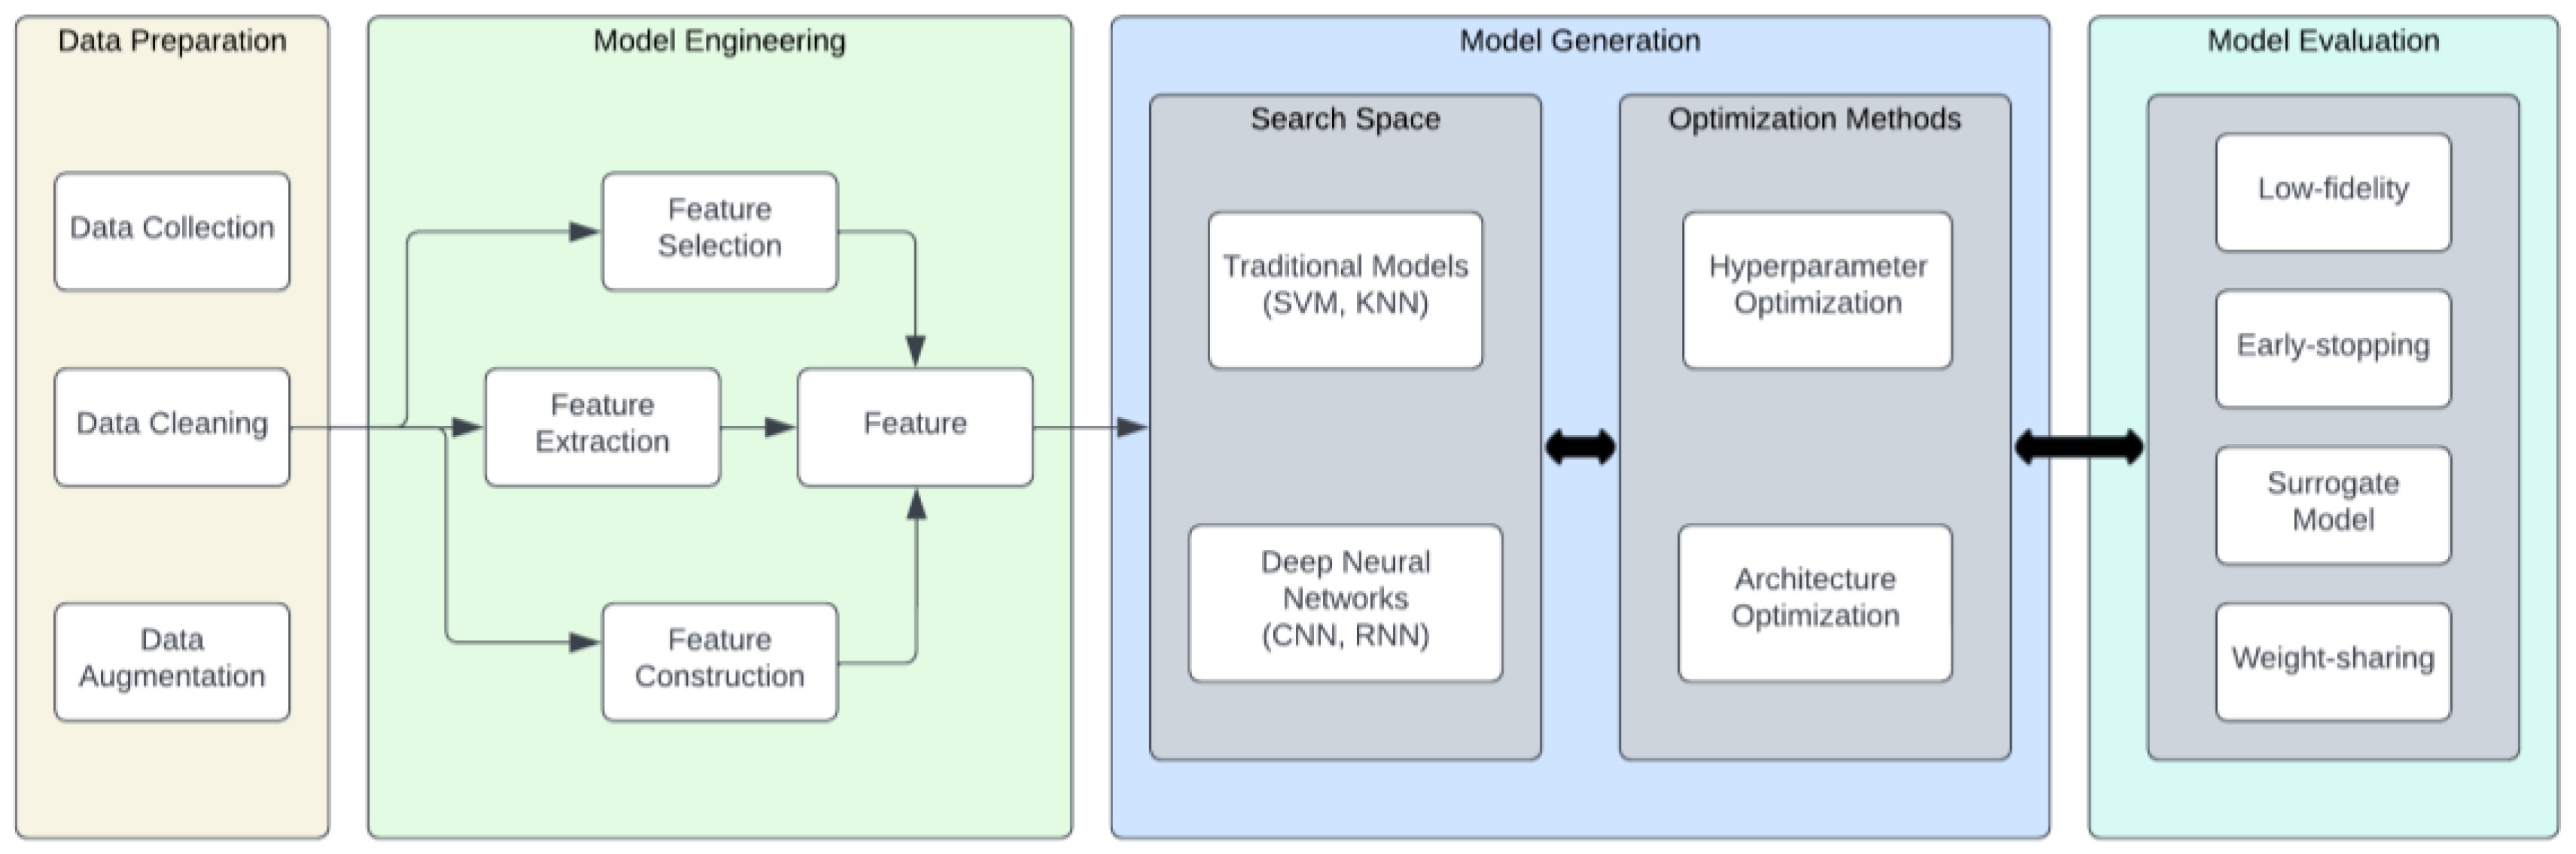
In the landscape of computational intelligence, the relevance and applicability of deep learning models have surged across diverse sectors, successfully addressing complex AI tasks. However, the creation of these intricate models often involves a labor-intensive, trial-and-error process conducted manually by domain experts, a methodology that mandates substantial resource allocation and an extensive time commitment. To circumnavigate these challenges, the paradigm of AutoML has risen to prominence as a solution aiming to streamline and optimize the machine learning pipeline, refer to Figure 2 for an example of machine learning pipeline [42]. The concept of AutoML, however, is interpreted differently by different sectors of the scientific community. For example, Ref. [43] theorizes that AutoML is primarily designed to mitigate the demand for data scientists, thereby equipping domain experts with the capacity to construct machine learning applications without a deep reservoir of ML knowledge.
In contrast, Ref. [44] perceives AutoML as a harmonious blend of automation and machine learning. This definition emphasizes the automated assemblage of an ML pipeline, constrained by a limited computational budget. In a world experiencing an exponential growth in computing power, AutoML has emerged as a focal point for both industrial and academic research. A comprehensive AutoML system exhibits the dynamic amalgamation of a multitude of techniques, resulting in an intuitive, end-to-end ML pipeline system. Several AI-centric companies, including Google, Microsoft Azure, Amazon, H2O.ai, and RapidMiner, have developed and publicly shared systems like Cloud AutoML. Figure 2 illustrates the structure of an AutoML pipeline, comprising several key processes: (1) Data preparation: this consists of data collection, data cleaning, and data augmentation; for more details, refer to [45]. (2) Model or feature engineering: this consists of feature selection (Chen and Li, 2022), feature extraction, and feature selection; for more details, refer to [46]. (3) Model generation: this consists of two parts: a. search space (this includes traditional models such as Support Vector Machine (SVM) (Garcia and Moreno, 2017) and the k-nearest neighbors algorithm (KNN)) and b. optimization methods (these include hyperparameter optimization and architecture optimization); for more details, refer to [47]. (4) Model evaluation: this consists of low-fidelity (Davis, 2019), early stopping (Nelson and Thompson, 2020), surrogate model (Martinez, 2021), and weight-sharing (Rivera and Santos, 2022); for more details, refer to [48].

1.2.4. AutoML and Its Role in Healthcare

AutoML aims to automate the process of selecting the best machine learning algorithms, optimizing hyperparameters, and managing data pre-processing. This automation reduces the time and expertise needed to develop effective models, making it an attractive approach in healthcare, where rapid and accurate decision making is crucial [19].
AutoML has become an essential tool in the medical field for identifying risk factors, predicting disease progression, and guiding treatment strategies [49,50]. In the context of diabetes diagnosis, AI-powered predictive models have been instrumental in detecting early signs of the disease and assisting clinicians in making data-driven decisions [51]. These models leverage vast amounts of data from various sources, such as electronic health records, genomics, and wearable devices, to provide accurate predictions of diabetes risk and onset [52].

1.2.5. AutoML in Diabetes Diagnosis

Several studies have explored the application of AutoML for diabetes diagnosis. One such study by [53] used AutoML to predict diabetes onset by analyzing electronic health records, demonstrating improved predictive performance compared to traditional machine learning models. Deep learning, a subfield of AI, has demonstrated remarkable success in various medical applications, including diabetes diagnosis [54]. Convolutional neural networks (CNNs) and recurrent neural networks (RNNs) are two prominent deep learning architectures that have been employed in the analysis of complex data for diabetes prediction and diagnosis [55,56]. These models can process high-dimensional data, such as medical images, and identify intricate patterns that traditional machine learning techniques may not capture [6].

2. Materials and Methods

This study adheres to an established research structure, which mirrors the AutoML workflow (as illustrated in Figure 2). This structure will be further expanded upon in the following sections, where we will delineate the step-by-step progression of this research. Initially, we begin by comprehending the intrinsic nature of the problem and the attributes harbored by the data. This comprehension phase leads directly into the data preparation phase, forming the cornerstone of our research foundation. Subsequently, we embark on the feature engineering stage. The entire process culminates with the generation of the model, which is subsequently subjected to a rigorous evaluation process. This process of evaluation is crucial to validate the effectiveness of the model.

2.1. Problem Understanding and Determining the Purpose of the Analysis

The purpose of this analysis is to guide the selection of appropriate modeling methods, evaluate model performance, and choose relevant metrics based on the research question at hand. For instance, one may seek to investigate the relationship between diabetes occurrence in patients within the NIDDK dataset and other distinct attributes, such as Glucose, BloodPressure, Insulin, BMI, and Age. Alternatively, the focus might be on predicting the likelihood of a new patient developing diabetes in the near future. When addressing the former question, the analysis centers on the coefficients’ significance and the goodness of fit through descriptive or explanatory analysis. Descriptive modeling involves fitting a regression model to identify relationships between independent variables and the dependent variable. On the other hand, explanatory modeling aims to draw causal inferences based on theory-driven hypotheses. However, the present study focuses its efforts on addressing the latter inquiry, specifically centered on predicting the development of diabetes in a newly encountered patient. The primary objective is to rigorously evaluate the predictive performance of the model in this context.
To achieve this aim, advanced analytics modeling, prominently featuring machine learning algorithms, is commonly practiced within the domain. While our focus is not centered on descriptive or explanatory analysis, variability within disease data can affect the accuracy and reliability of our predictions. To address this, we have partitioned the data into training and testing sets at the beginning of the process, which allows us to monitor and account for any fluctuations or inconsistencies. Various performance metrics have been used alongside validation techniques to assess the model’s robustness against the variability inherent in the disease data. In assessing the quality of predictive models, especially for classification problems with categorical outcomes (e.g., diabetes or no diabetes), certain methods are frequently employed.
The process typically begins by partitioning the existing data into training and testing sets. This is followed by the application of various performance metrics in tandem with validation techniques. Principal tools for evaluating the efficacy of a classification model include confusion matrices (or truth tables), lift charts, receiver operator characteristic (ROC) curves, and area under the curve (AUC). The following sections will elaborate on the construction and usage of these tools, as well as detailing how to carry out effective performance evaluations.

2.2. Data Exploration and Pre-Processing

This study primarily centers around the application of sophisticated machine learning techniques to the Pima Indian Diabetes Dataset. The dataset is sourced from Kaggle (https://www.kaggle.com/uciml/pima-indians-diabetes-database, accessed on 10 January 2023).
To ensure ethical standards, it has been meticulously anonymized, so it is completely void of any identifiable patient characteristics. While larger and more complex diabetes datasets now exist, the Pima Indian Diabetes dataset continues to serve as a benchmark in diabetes classification research. Its binary outcome variable naturally suits supervised learning methodologies. Despite this, the dataset’s flexibility extends beyond just one model type, with numerous machine learning algorithms having been leveraged to produce diverse classification models. It is composed of 768 entries, each representing an individual subject (500 non-diabetics and 268 diabetics). Every individual is profiled through nine distinct attributes, as detailed in Table 1.
The attribute ‘Pregnancies’ quantifies the total number of pregnancies an individual has experienced. The attribute ‘Glucose’ represents the blood glucose concentration, providing insight into the individual’s glycemic status. ‘BloodPressure’, ‘SkinThickness’, ‘Insulin’, and ‘BMI’ respectively correspond to measurements of blood pressure, skin fold thickness, serum insulin levels, and body mass index, each of which delivers crucial insights into the health status of the participant. Further, the attribute ‘DiabetesPedigreeFunction’ signifies the likelihood of diabetes predicated on the individual’s familial history, encapsulating genetic influence in the propensity towards diabetes. The attribute termed ‘Outcome’ serves as a categorical binary response variable in our study. It represents the presence or absence of diabetes in an individual.
The predictors (independent variables) used in this research include ‘Pregnancies’, ‘Glucose’, ‘BloodPressure’, ‘SkinThickness’, ‘Insulin’, ‘BMI’, ‘DiabetesPedigreeFunction’, and ‘Age’. The target variable (dependent outcome variable) is ‘Outcome’. The dataset under analysis is complete, devoid of any null or missing values, which ensures a comprehensive assessment of the data points. However, drawing upon domain-specific knowledge [57], inconsistencies were noted in several critical attributes, namely: glucose concentration, blood pressure, skin thickness, insulin levels, and BMI. These inconsistencies are presented as zero values, which do not fall within the established normal ranges, hence rendering them inaccurate (Table 2). To rectify this, we implemented a data imputation technique, specifically opting to replace these zero values with the corresponding attribute’s median value. This strategy was chosen because the median, unlike the mean, is robust to outliers and can provide a more accurate representation of the central tendency for each attribute. Figure 3 serves as a comprehensive scatterplot matrix, employed as a primary exploratory instrument to discern potential pairwise associations among the study variables. The distribution of data points within this matrix offers substantial insights into the nature of these relationships. For instance, a scattered, diffused distribution indicates the absence of an identifiable correlation, while a more streamlined, linearly arranged set of points hints at a linear interdependency among the attributes.
In a critical analysis of the scatterplot matrix depicted in Figure 3, a strong positive correlation emerges among specific variable pairs that demonstrate notable proportionality. This correlation is most conspicuous between Pregnancies and Age, SkinThickness and BMI, and Glucose and Insulin levels. Nonetheless, in an examination of the actual correlation values, outlined in Table 3, Age and Pregnancies exhibited the strongest correlation, but since the correlation coefficient was below 0.550, it was deemed insufficient to warrant the removal of either attribute. This observation underpins the relative lack of robust associations amongst the study variables. A detailed scrutiny of the results further confirms the absence of multicollinearity, ensuring the accuracy and reliability of the observed correlations. Additionally, an examination of Figure 3 unveils the existence of outliers in specific attributes (Age, Insulin, Glucose, BMI, DiabetesPedigreeFunction, and BloodPressure).
These outliers might be the result of various underlying factors. Considering the limited size of the dataset, eliminating these outliers could potentially result in the loss of valuable information. To circumvent this risk, a decision was made to standardize the data, which would help to alleviate the potential negative impact of these outliers.

2.3. Feature Selection

Feature selection, the process of discerning and selecting the most significant variables essential for accurate model prediction, continues to be a subject of discussion within the research community. Critics assert the redundancy of model fitting, contending that a faster, brute-force approach to data analysis can more efficiently identify meaningful correlations for decision making [58]. However, the practical relevance of models remains indisputable. Beyond aiding decision making, models serve as conduits for advancing knowledge in various fields of study. Given the critical role of models, the process of feature selection becomes equally crucial. It offers two key advantages: first, it optimizes the performance of the algorithm by minimizing potential noise from extraneous variables; second, it facilitates a more streamlined interpretation of the model’s output by reducing the complexity associated with numerous attributes or features.
The research undertaken employs principal component analysis (PCA) as a fundamental analytical instrument. This sophisticated statistical method principally aids in discerning variables that display maximum variability within a given dataset. The methodology accomplishes this by astutely transforming the original variables into a new collection of constructs, denoted as ‘principal components’. Each principal component carries its distinct set of attributes. PCA’s value extends beyond mere dimensionality reduction, as it unearths underlying patterns in data.
It accomplishes this by assigning a rank to these components, contingent upon the fraction of the total variance they account for. This procedure enables a deeper interpretation of multifaceted datasets, facilitating a more detailed comprehension of the interrelations and structures embedded within the data.

2.4. Model Generation and Results

In the pursuit of creating an optimized model for forecasting diabetes diagnoses, the study utilized AutoML to analyze the Pima Indian Diabetes dataset. For the purpose of maintaining a controlled environment, each model was subject to the same training and testing datasets. In Figure 4, AutoML has identified the top nine models best suited for the dataset: Naïve Bayes, Logistic Regression, Decision Tree, Gradient Boosted Trees, Generalized Linear Model, Support Vector Machine, Fast Large Margin, Deep Learning, and Random Forest.
It is crucial to highlight that these models underwent recalibration with diverse combinations of feature sets. This comprehensive approach resulted in 40,423 distinct models, derived from an expansive 5262 unique feature set combinations. The core aim of this study is to determine the most effective model based on performance metrics such as accuracy, recall, precision, and AUC, to name a few. It should be noted that RapidMiner offers additional metrics that might become critical during the model’s deployment stage. These metrics can encompass variations experienced by a model when trained with different feature set combinations, the training duration, the scoring time, and the consequent gains. For instance, our analysis could explore the holistic performance of each model under a multitude of feature variations, drawing comparisons between model differences and the associated training durations. As shown in Figure 4, standard deviation bars are included to depict the variability or spread of the data. These bars provide insights into the stability and consistency of the model’s performance across different iterations and training sets. A model with smaller standard deviation bars suggests consistent results, while larger bars indicate variability. From the wide pool of 40,423 models evaluated, our AutoML system has strategically narrowed down to nine machine learning models deemed most promising, including the following:
  • Naïve Bayes: a simple yet effective probabilistic classifier based on Bayes’ Theorem with strong independence assumptions between features. Given a class variable Y and dependent feature vectors X1 through Xn, Naïve Bayes assumes that each feature is independent. The formula is typically given as: P ( Y | X 1 , . . . , X n ) P ( Y ) Π P ( X i | Y ) .
  • Logistic Regression: a powerful statistical model used for predicting the probability of a binary outcome. Logistic Regression models the probability that Y belongs to a particular class. The Logistic Regression is given as: p ( X ) = e ^ ( b 0 + b 1 X ) / ( 1 + e ^ ( b 0 + b 1 X ) ) .
  • Decision Tree: an intuitive model that predicts outcomes by splitting the dataset into subsets based on feature values, akin to a tree structure. Decision Trees do not have a general equation, as they work by partitioning the feature space into regions and assigning a class value to each region. The partitioning process is based on specific criteria, such as Gini impurity or information gain.
  • Gradient Boosted Trees: an ensemble learning method that constructs a robust model by optimizing a set of weak learners in a stage-wise fashion, using the gradient descent algorithm. Gradient Boosted Trees do not have a single formula as such. The method builds an ensemble of shallow and weak successive trees with each tree learning and improving on the previous one.
  • Generalized Linear Model (GLM): a flexible generalization of ordinary linear regression that allows for response variables that have error distribution models other than a normal distribution. A GLM generalizes linear regression by allowing the linear model to be related to the response variable via a link function: g ( E ( Y ) ) = η = X β , where E ( Y ) is the expected value of the response variable, η is the linear predictor, and X β is the matrix product of the observed values and their coefficients.
  • Support Vector Machine (SVM): a boundary-based model which finds the optimal hyperplane that distinctly classifies the data points in high-dimensional space. SVMs find the hyperplane that results in the largest margin between classes. For linearly separable classes, this can be represented as: Y ( X ) = W ^ T φ ( X ) + b , where W is the normal to the hyperplane, φ ( X ) is the transformed input, and b is the bias.
  • Fast Large Margin: a model that aims to ensure a large margin between decision boundary and data points, enhancing the robustness and generalization of the model. This method is commonly used in SVM. It aims to maximize the margin, which is represented in the SVM formula above.
  • Deep Learning: a neural network model inspired by the human brain, which excels at capturing intricate patterns in large datasets. Deep Learning models involve a series of linear and non-linear transformations, where each layer of hidden units is usually computed as f ( W X + b ) , where f is an activation function like R e L U or s i g m o i d , W is the weight matrix, X is the input, and b is the bias.
  • Random Forest: an ensemble learning method that fits a number of Decision Tree classifiers on various sub-samples of the dataset and uses averaging to improve the predictive accuracy and control over-fitting. Like the Decision Tree (DT), a random forest does not have a specific formula. It creates a collection of decision trees from a randomly selected subset of the training set and aggregates the votes from different DTs to decide the final class of the test object.

2.5. Model Evaluation

To ascertain the most effective algorithms for this specific dataset and to impartially assess the performance of each model, we implemented an extensive model evaluation process. This assessment utilized a comprehensive set of metrics that provide a multidimensional perspective on each model’s efficacy. The selected metrics included: precision, recall, accuracy, confusion matrices, receiver operator characteristic (ROC) curves, and area under the curve (AUC). These metrics were utilized to evaluate the performance of each model rigorously and holistically, thereby ensuring that the optimal algorithm was selected for our specific data context.
  • Precision: the ‘precision’ represents the proportion of correctly predicted true samples out of all predictions labelled as true, regardless of their actual truthfulness, as shown below,
P r e c i s i o n = T P ( T P / ( T P + F P )
where TP is true positive; FP is false positive; FN is false negative; and TN is true negative.
In the examination of the precision results illustrated in the Table 4, it becomes evident that the Logistic Regression model takes the lead in terms of performance, demonstrating a notable precision rate of 73.1%. It conspicuously surpasses the other models in the comparison. Trailing it is the Generalized Linear Model, registering a commendable precision rate of 66.5%. Following closely, the Decision Tree makes a decent showing with a precision rate of 66.0%.
2.
Recall: this metric provides the proportion of actual positive cases that were correctly classified, as shown in the formula below,
R e c a l l = T P T P + F N
where TP is true positive; FP is false positive; FN is false negative; and TN is true negative.
A careful examination of Table 5 reveals a discernible performance superiority displayed by the Generalized Linear Model, boasting an impressive recall rate of 61.8%. This model demonstrates significant outperformance when compared to its counterparts. Trailing behind it is the Fast Large Margin, which manages to yield a satisfactory recall rate of 60.8%. Following that, the Naïve Bayes model makes a decent showing with a recall rate of 55.2%.
3.
Accuracy: this broad metric provides a ratio of correctly predicted instances to the total instances in the dataset, as shown in the formula below,
A c c u r a c y = T P + T N T P + T N + F P + F N
where TP is true positive; FP is false positive; FN is false negative; and TN is true negative.
The data delineated in Table 6 afford a compelling comparative analysis of the effectiveness of various predictive models. An examination of the figures reveals that both the Generalized Linear Model and Logistic Regression take precedence, achieving an exceptional accuracy rate of 79.2%. This performance significantly exceeds that of the other models under scrutiny. A comprehensive exploration of the accuracy results can be visualized through the use of a confusion matrix. This matrix, a powerful tool for accuracy assessment, offers a clear and concise snapshot of the performance of our predictive model, effectively illuminating the interplay between true and false, and positive and negative predictions.
4.
Confusion matrix for accuracy: the confusion matrix, an exemplary analytical instrument, portrays the intersection of actual and forecasted outcome classes derived from the testing set. The predicted class outcomes are typically displayed in a horizontal fashion across rows, while the actual class outcomes are organized vertically in columns [59]. This matrix, also referred to as a truth table, can be efficiently scrutinized by focusing on the diagonal line running from the top left to the bottom right. Ideal classification performance is indicated by entries exclusively populating this main diagonal, with the anticipation that all off-diagonal components would hold zero values.
Table 7 illustrates the confusion matrix for the accuracy of each of these nine models. The confusion matrix encapsulates the comprehensive performance of a predictive model. It acts as a quantifier of the fraction of instances that have been accurately forecasted. The construction of this matrix involves a calculation derived from the summation of true positive and true negative predictions.
Evaluation metrics like precision, recall, and accuracy provide an aggregate view, serving to illustrate an averaged representation of the classifier’s performance across the entire dataset. This characteristic, however, can sometimes veil disparities in model performance. For instance, it is plausible for a classifier to showcase high accuracy over the entire dataset but concurrently underperform in terms of class-specific recall and precision. To select the most effective model, we extended our evaluation to additional metrics. This decision was driven by the need to unmask potential trade-offs and provide a more nuanced, comparative analysis of model performance, such as the receiver operator characteristic (ROC) curve along with the resultant area under the curve (AUC).
5.
The receiver operating characteristics (ROC) curve, and the area under the curve (AUC): these two metrics serve as critical performance indicators for classification models, effectively encapsulating the degree to which classes can be separated. ROC curves, which originated in the field of signal detection, plot the true positive rate (sensitivity) against the false positive rate (1—specificity) at varying threshold settings. The area under the ROC curve (AUC-ROC) serves as a robust indicator of model performance, allowing us to compare different models and identify the one that offers the best balance between sensitivity and specificity. By broadening our examination to include such comprehensive metrics, we are better positioned to identify the optimal model—one that not only excels in general performance, but also demonstrates proficiency in handling the diverse challenges posed by our data [60]. In the context of AUC, it could be interpreted as the probability that a model will rank a randomly selected positive instance above a randomly chosen negative one. The AUC measures the full two-dimensional area beneath the entire ROC curve, spanning from (0.0) to (1.1), with the maximum attainable value being 1. An ROC curve is plotted by setting the fraction of TPs (TP rate) against the fraction of FPs (FP rate), as shown in Figure 5.
While a preliminary overview of Figure 5 might suggest a marginal difference between the Generalized Linear Model (GLM) and the Logistic Regression model, given their area under curve (AUC) values of 82.4% and 84.1%, respectively, a more granular analysis uncovers a noteworthy superiority of the GLM. At first glance, the close AUC values of the two models may appear to offer similar performance metrics. However, it is crucial to remember that AUC primarily provides an overall measure of performance across varying threshold levels. The true differentiation surfaces when we delve deeper into individual metric assessments—an approach of paramount importance in our domain where the high cost associated with false negatives necessitates a focus on recall as a significant performance metric.
Table 8 provides an in-depth, comparative view of both models’ performance across all pertinent metrics. Notably, it reveals that the GLM outshines the Logistic Regression model in terms of recall, registering an impressive rate of 61.8% compared to the latter’s 52.5%. In our specific context, where a premium is placed on minimizing false negatives, the recall metric assumes a heightened significance. Consequently, our decision to favor the Generalized Linear Model as the optimal choice for our project is influenced not merely by its marginally higher AUC, but more critically by its considerably superior recall rate. By delivering a robust performance on this vital metric, the GLM is far better equipped to align with, and effectively meet, our project’s core objectives.

2.6. Model Optimization—Prescriptive Analytics

In the realm of predictive modeling, the norm is to utilize algorithms with the aim of forecasting a specific outcome based on given inputs. Yet, a more intriguing and potentially sophisticated technique reimagines this traditional approach. Instead of starting with the input to predict an output, this innovative methodology embarks from a model and a desired outcome, with the goal to determine an optimized input that fulfills the desired target. This novel strategy is commonly recognized as prescriptive analytics. Unlike its traditional predictive counterparts, AutoML opens the door to prescriptive analytics. It goes beyond predicting outcomes. These sophisticated systems analyze an array of possible actions, pinpointing the optimal course to pursue, thereby delivering a bespoke action plan for a given situation. The overarching aim is to tailor the approach to meet a predetermined outcome, which often entails adjusting the confidence level for the preferred class to drive the desired result.
Delving into this case study, we leveraged the simulation tool (depicted in Figure 6) to bifurcate the outcome into two distinct categories. “True” denoted the presence of diabetes, whereas “false” signified its absence. By using prescriptive analytics, we can more effectively strategize and prescribe actions to reach the desired outcome.
After running the optimization (Figure 7 and Figure 8), for this case study we reached a model with 97% accuracy on the ‘diabetes’ class.

3. Discussion

Diabetes mellitus, a pervasive chronic metabolic disorder, affects countless individuals on a global scale, posing serious, persistent challenges to healthcare systems worldwide [1]. This relentless chronic affliction manifests either when the pancreas is incapable of producing sufficient insulin, or when the body’s ability to efficiently utilize the insulin produced is compromised. Despite extensive research and continuous medical advances, a definitive cure for this disease remains elusive.
The onset of diabetes is widely recognized as a result of an intricate interplay between genetic predispositions and environmental triggers [2]. Importantly, the absence of early detection methods for diabetes not only exacerbates the disease prognosis but also paves the way for the onset of additional chronic ailments such as kidney disease [4]. Hence, the necessity for improved early detection measures is highlighted, underscoring the importance of ongoing research in this area.
The principal aim of this research is to forecast the likelihood of diabetes in individuals, utilizing key attributes such as age, glucose levels, BMI, and other pertinent factors. The study discerned that the Generalized Linear Model exhibited exceptional efficacy in prognosticating diabetes diagnoses. The exploration of advances in AutoML for predictive and prescriptive modeling in diabetes diagnosis underscored their efficiency in discerning risk factors, optimizing treatment strategies, and ultimately enhancing patient health outcomes.
For entities like the National Institute of Diabetes and Digestive and Kidney Diseases [13] and other potential users, the AutoML model generated from this study could be considered a robust foundational tool. It is recommended that medical professionals and institutions scrutinize the attributes employed in this dataset when predicting diabetes occurrence in individuals. Furthermore, the identification and analysis of similar attributes could substantially aid in refining the model and bolstering its diagnostic capabilities.
While the findings are indeed promising, it is crucial to bear in mind that this scenario is associated with the critical realm of human health. Accurate predictions can facilitate timely treatment and mitigate health complications, thereby fostering healthier lives.
Although no model is flawless, the current model provides valuable insights for stakeholders involved in predicting, treating, and managing patients at risk of diabetes. The model could be further improved through contributions from the National Institute of Diabetes and Digestive and Kidney Diseases and healthcare professionals who have a profound comprehension of the variables linked to diabetes and their impacts on diagnosis. This would enable the model’s more reliable utilization in informed decision making concerning patient health.
The strategy for disseminating the model to the general public holds immense potential to raise awareness about the myriad factors associated with an increased risk of diabetes. By doing so, individuals can make well-informed health-related decisions and engage in preventative measures as necessary.

4. Final Reflections

4.1. Health Inequity and the Role of AI

Despite the promising advancements in AI and deep learning for predictive modeling in diabetes diagnosis, several challenges remain. Issues such as data privacy, algorithmic bias, and the interpretability of AI models need to be addressed to ensure the ethical and effective deployment of these technologies in clinical settings [61]. Moreover, fostering collaboration between AI researchers, clinicians, and patients is essential for the development of robust, patient-centered AI solutions for diabetes diagnosis and management [62].
The COVID-19 pandemic profoundly underscored the interwoven relationship between inequity and health, revealing a stark disparity in disease burden among individuals from ethnically diverse backgrounds. This disproportionate impact was manifested through elevated mortality rates, an increased incidence of Intensive Care Unit (ICU) admissions, and heightened hospitalization figures, a phenomenon investigated by Bambra, et al., 2020 [63].
Inequity, however, is far from a novel occurrence within global society. It represents an entrenched, multifaceted issue pervading across international lines, a ubiquitous phenomenon that fundamentally undermines human rights and hampers overall societal progress. A plethora of interconnected factors actively contribute to the perpetuation of these inequities, thereby entrenching the health disparities observed. Foremost among these factors is poverty, a prevailing societal issue that is inextricably linked to detrimental health outcomes. It propagates a cycle of deprivation where those living in economically disadvantaged conditions are predisposed to poor health and limited access to quality healthcare services. Environmental and climatic factors further exacerbate this issue, with changes in the climate disproportionately affecting communities that lack the resources to adapt effectively.
The ramifications are widespread, with alterations in disease patterns and heightened risks of natural disasters, among other issues. Furthermore, an individual’s vulnerability to trauma—be it psychological, physical, or societal—is also a significant determinant of health outcomes.
Traumatic events, especially those recurring or persistent, can lead to long-lasting physical and mental health problems, further exacerbating disparities. Gender and racial imbalances serve as another pivot in the inequity equation. These deep-seated biases and discriminations, both systemic and institutional, have tangible impacts on health. They affect everything from access to healthcare services to disease outcomes and life expectancy. Societal norms, which define and dictate acceptable behaviors and attitudes within a community, also play a significant role. Norms that propagate discrimination, suppress individual freedoms, or limit opportunities based on race, gender, class, or other factors contribute to the creation and continuation of health inequities.
In summary, the intersectionality of these numerous, complex factors produces a formidable challenge to health equity worldwide. The onus is on all stakeholders to address these issues proactively and holistically, in an effort to alleviate the health disparities entrenched within our societies.

4.2. AutoML and Sustainability

Our findings surrounding the application of AutoML techniques in diabetes diagnosis have crucial implications, not only for healthcare outcomes but also for sustainability in the healthcare sector.
To begin with, environmental sustainability can be impacted indirectly through the more efficient utilization of resources. For instance, AutoML techniques can rapidly parse through and analyze large volumes of patient data, making the diagnosis process more efficient. This efficiency could translate into a reduction in the use of physical resources in healthcare settings, including less need for physical storage as data can be more effectively managed and utilized. Additionally, quicker and more accurate diagnoses could potentially reduce the need for excessive testing, thereby reducing waste.
Economic sustainability is also a vital consideration. The application of AutoML techniques in healthcare, especially in the diagnosis of diseases like diabetes, can lead to cost savings for both healthcare providers and patients. By leveraging machine learning algorithms for diagnosis, it could streamline the process, reduce manual labor, and consequently decrease healthcare delivery costs. These savings could be redirected towards other critical areas within healthcare, supporting more sustainable economic growth within the sector.
Finally, in terms of social sustainability, the implications are profound. Improved diagnostic accuracy and speed through AutoML can enhance patient outcomes and experiences, potentially reducing the societal burden of diseases like diabetes. More accurate and earlier diagnoses could lead to more effective treatment plans, reducing complications, morbidity, and mortality associated with the disease. The reduced healthcare burden can result in a better quality of life, echoing the principles of social sustainability.
Lytras et al. [64] emphasized the revolutionary influence of Big Data and Data Analytics on contemporary business strategies. As various sectors assimilate these profound insights, the evolution of AutoML and generative AI is set to usher in transformative shifts in the near future. It’s clear that ‘Artificial Intelligence and Big Data Analytics for Smart Healthcare’ stands as a pivotal reference for healthcare practitioners, highlighting the transformative capabilities of emergent technologies such as AI, machine learning, and data science [65,66]. Pioneering tools like AutoML, which optimize machine learning processes, alongside generative AI with its ability to create new data instances, offer immense potential to elevate healthcare efficiency and resilience.
In conclusion, while our research presents promising insights into the potential of AutoML in diabetes diagnosis, we recommend further studies to understand and optimize these techniques for greater sustainability benefits. Future research could focus on quantifying the potential savings and benefits across the environmental, economic, and social dimensions to provide a comprehensive view of the role of AutoML in sustainable healthcare.

Author Contributions

Conceptualization, L.P.Z. and M.D.L.; methodology, L.P.Z. and M.D.L.; software, L.P.Z. and M.D.L.; validation, L.P.Z. and M.D.L.; formal analysis, L.P.Z. and M.D.L.; investigation, L.P.Z. and M.D.L.; resources, L.P.Z. and M.D.L.; data curation, L.P.Z. and M.D.L.; writing—original draft preparation, L.P.Z. and M.D.L.; writing—review and editing, L.P.Z. and M.D.L.; visualization, L.P.Z. and M.D.L.; supervision, L.P.Z. and M.D.L.; project administration, L.P.Z. All authors have read and agreed to the published version of the manuscript.

Funding

This research received no external funding.

Institutional Review Board Statement

Not applicable.

Informed Consent Statement

Not applicable.

Data Availability Statement

This study uses the Pima Indian Diabetes Dataset. The dataset, sourced from Kaggle (https://www.kaggle.com/uciml/pima-indians-diabetes-database), is openly accessible under a Public Domain License (accessed on 10 January 2023).

Conflicts of Interest

The authors declare no conflict of interest. The sponsors had no role in the design, execution, interpretation, or writing of the study.

References

  1. Saeedi, P.; Petersohn, I.; Salpea, P.; Malanda, B.; Karuranga, S.; Unwin, N.; Colagiuri, S.; Guariguata, L.; Motala, A.A.; Ogurtsova, K. Global and regional diabetes prevalence estimates for 2019 and projections for 2030 and 2045: Results from the International Diabetes Federation Diabetes Atlas. Diabetes Res. Clin. Pract. 2019, 157, 107843. [Google Scholar] [CrossRef] [PubMed]
  2. Bonnefond, A.; Unnikrishnan, R.; Doria, A.; Vaxillaire, M.; Kulkarni, R.N.; Mohan, V.; Trischitta, V.; Froguel, P. Monogenic diabetes. Nat. Rev. Dis. Primers 2023, 9, 12. [Google Scholar] [CrossRef]
  3. Tsao, C.W.; Aday, A.W.; Almarzooq, Z.I.; Alonso, A.; Beaton, A.Z.; Bittencourt, M.S.; Boehme, A.K.; Buxton, A.E.; Carson, A.P.; Commodore-Mensah, Y. Heart disease and stroke statistics—2022 update: A report from the American Heart Association. Circulation 2022, 145, e153–e639. [Google Scholar] [CrossRef] [PubMed]
  4. Pareek, N.K.; Soni, D.; Degadwala, S. Early Stage Chronic Kidney Disease Prediction using Convolution Neural Network. In Proceedings of the 2023 2nd International Conference on Applied Artificial Intelligence and Computing (ICAAIC), Salem, India, 4–6 May 2023; IEEE: Piscataway, NJ, USA, 2023; pp. 16–20. [Google Scholar]
  5. Khunti, K.; Valabhji, J.; Misra, S. Diabetes and the COVID-19 pandemic. Diabetologia 2023, 66, 255–266. [Google Scholar] [CrossRef]
  6. Esteva, A.; Robicquet, A.; Ramsundar, B.; Kuleshov, V.; DePristo, M.; Chou, K.; Cui, C.; Corrado, G.; Thrun, S.; Dean, J. A guide to deep learning in healthcare. Nat. Med. 2019, 25, 24–29. [Google Scholar] [CrossRef] [PubMed]
  7. Nazir, S.; Dickson, D.M.; Akram, M.U. Survey of explainable artificial intelligence techniques for biomedical imaging with deep neural networks. Comput. Biol. Med. 2023, 156, 106668. [Google Scholar] [CrossRef]
  8. Saranya, A.; Subhashini, R. A systematic review of Explainable Artificial Intelligence models and applications: Recent developments and future trends. Decis. Anal. J. 2023, 7, 100230. [Google Scholar]
  9. Tschandl, P.; Codella, N.; Akay, B.N.; Argenziano, G.; Braun, R.P.; Cabo, H.; Gutman, D.; Halpern, A.; Helba, B.; Hofmann-Wellenhof, R. Comparison of the accuracy of human readers versus machine-learning algorithms for pigmented skin lesion classification: An open, web-based, international, diagnostic study. Lancet Oncol. 2019, 20, 938–947. [Google Scholar] [CrossRef]
  10. Leslie, D.; Mazumder, A.; Peppin, A.; Wolters, M.K.; Hagerty, A. Does “AI” stand for augmenting inequality in the era of covid-19 healthcare? BMJ 2021, 372, n304. [Google Scholar] [CrossRef]
  11. Smith, J.W.; Everhart, J.E.; Dickson, W.; Knowler, W.C.; Johannes, R.S. Using the ADAP learning algorithm to forecast the onset of diabetes mellitus. In Proceedings of the Annual Symposium on Computer Application in Medical Care, Washington, DC, USA, 6–9 November 1988; American Medical Informatics Association: Bethesda, MD, USA, 1988; p. 261. [Google Scholar]
  12. Larabi-Marie-Sainte, S.; Aburahmah, L.; Almohaini, R.; Saba, T. Current techniques for diabetes prediction: Review and case study. Appl. Sci. 2019, 9, 4604. [Google Scholar] [CrossRef]
  13. The National Institute of Diabetes and Digestive and Kidney Diseases. Available online: https://www.niddk.nih.gov/ (accessed on 4 April 2023).
  14. Dwivedi, Y.K.; Kshetri, N.; Hughes, L.; Slade, E.L.; Jeyaraj, A.; Kar, A.K.; Baabdullah, A.M.; Koohang, A.; Raghavan, V.; Ahuja, M. “So what if ChatGPT wrote it?” Multidisciplinary perspectives on opportunities, challenges and implications of generative conversational AI for research, practice and policy. Int. J. Inf. Manag. 2023, 71, 102642. [Google Scholar] [CrossRef]
  15. American Artificial Intelligence Research Laboratory. Available online: https://openai.com/ (accessed on 1 August 2023).
  16. Popova Zhuhadar, L. A Comparative View of AI, Machine Learning, Deep Learning, and Generative AI. Available online: https://commons.wikimedia.org/wiki/File:Unraveling_AI_Complexity_-_A_Comparative_View_of_AI,_Machine_Learning,_Deep_Learning,_and_Generative_AI.jpg (accessed on 30 March 2023).
  17. Zhang, C.; Lu, Y. Study on artificial intelligence: The state of the art and future prospects. J. Ind. Inf. Integr. 2021, 23, 100224. [Google Scholar] [CrossRef]
  18. Mosavi, A.; Salimi, M.; Faizollahzadeh Ardabili, S.; Rabczuk, T.; Shamshirband, S.; Varkonyi-Koczy, A.R. State of the art of machine learning models in energy systems, a systematic review. Energies 2019, 12, 1301. [Google Scholar] [CrossRef]
  19. Fregoso-Aparicio, L.; Noguez, J.; Montesinos, L.; García-García, J.A. Machine learning and deep learning predictive models for type 2 diabetes: A systematic review. Diabetol. Metab. Syndr. 2021, 13, 148. [Google Scholar] [CrossRef] [PubMed]
  20. Chen, H.; Wang, Y.; Guo, T.; Xu, C.; Deng, Y.; Liu, Z.; Ma, S.; Xu, C.; Xu, C.; Gao, W. Pre-trained image processing transformer. In Proceedings of the IEEE/CVF Conference on Computer Vision and Pattern Recognition, Nashville, TN, USA, 20–25 June 2021; pp. 12299–12310. [Google Scholar]
  21. Monga, V.; Li, Y.; Eldar, Y.C. Algorithm unrolling: Interpretable, efficient deep learning for signal and image processing. IEEE Signal Process. Mag. 2021, 38, 18–44. [Google Scholar] [CrossRef]
  22. Wang, Y.; Wang, D.; Geng, N.; Wang, Y.; Yin, Y.; Jin, Y. Stacking-based ensemble learning of decision trees for interpretable prostate cancer detection. Appl. Soft Comput. 2019, 77, 188–204. [Google Scholar] [CrossRef]
  23. Monshi, M.M.A.; Poon, J.; Chung, V. Deep learning in generating radiology reports: A survey. Artif. Intell. Med. 2020, 106, 101878. [Google Scholar] [CrossRef] [PubMed]
  24. Chen, C.; Zhang, P.; Zhang, H.; Dai, J.; Yi, Y.; Zhang, H.; Zhang, Y. Deep learning on computational-resource-limited platforms: A survey. Mob. Inf. Syst. 2020, 2020, 8454327. [Google Scholar] [CrossRef]
  25. Goodfellow, I. Nips 2016 tutorial: Generative adversarial networks. arXiv 2016, arXiv:1701.00160. [Google Scholar]
  26. Goodfellow, I.J. On distinguishability criteria for estimating generative models. arXiv 2014, arXiv:1412.6515. [Google Scholar]
  27. Shannon, C.E. A mathematical theory of communication. Bell Syst. Tech. J. 1948, 27, 379–423. [Google Scholar] [CrossRef]
  28. Yang, Z.; Jin, S.; Huang, Y.; Zhang, Y.; Li, H. Automatically generate steganographic text based on markov model and huffman coding. arXiv 2018, arXiv:1811.04720. [Google Scholar]
  29. Van Der Merwe, A.; Schulze, W. Music generation with markov models. IEEE MultiMedia 2010, 18, 78–85. [Google Scholar] [CrossRef]
  30. Yokoyama, R.; Haralick, R.M. Texture pattern image generation by regular Markov chain. Pattern Recognit. 1979, 11, 225–233. [Google Scholar] [CrossRef]
  31. Berger, M.A. Images generated by orbits of 2-D Markov chains. Chance 1989, 2, 18–28. [Google Scholar] [CrossRef]
  32. Giret, A.; Julian, V.; Carrascosa, C. AI-supported Digital Twins in applications related to sustainable development goals. In Proceedings of the International FLAIRS Conference Proceedings, Clearwater Beach, FL, USA, 14–17 May 2023; p. 36. [Google Scholar]
  33. Abou-Foul, M.; Ruiz-Alba, J.L.; López-Tenorio, P.J. The impact of artificial intelligence capabilities on servitization: The moderating role of absorptive capacity-A dynamic capabilities perspective. J. Bus. Res. 2023, 157, 113609. [Google Scholar] [CrossRef]
  34. Batista, E.; Lopez-Aguilar, P.; Solanas, A. Smart Health in the 6G Era: Bringing Security to Future Smart Health Services. IEEE Commun. Mag. 2023; early access. [Google Scholar]
  35. Barrett, J.S.; Goyal, R.K.; Gobburu, J.; Baran, S.; Varshney, J. An AI Approach to Generating MIDD Assets Across the Drug Development Continuum. AAPS J. 2023, 25, 70. [Google Scholar] [CrossRef] [PubMed]
  36. Rezaei, M.; Rahmani, E.; Khouzani, S.J.; Rahmannia, M.; Ghadirzadeh, E.; Bashghareh, P.; Chichagi, F.; Fard, S.S.; Esmaeili, S.; Tavakoli, R. Role of Artificial Intelligence in the Diagnosis and Treatment of Diseases. Kindle 2023, 3, 1–160. [Google Scholar]
  37. Lin, J.; Ngiam, K.Y. How data science and AI-based technologies impact genomics. Singap. Med. J. 2023, 64, 59. [Google Scholar]
  38. Flower, F.L.L. AI and Bioinformatics for Biology; Bharathiar University: Coimbatore, India, 2023. [Google Scholar]
  39. Xie, J.; Luo, X.; Deng, X.; Tang, Y.; Tian, W.; Cheng, H.; Zhang, J.; Zou, Y.; Guo, Z.; Xie, X. Advances in artificial intelligence to predict cancer immunotherapy efficacy. Front. Immunol. 2023, 13, 1076883. [Google Scholar] [CrossRef] [PubMed]
  40. Fischer, L.H.; Wunderlich, N.; Baskerville, R. Artificial intelligence and digital work. In Proceedings of the Hawaii International Conference on System Science, Maui, HI, USA, 3–6 January 2023. [Google Scholar]
  41. Korke, P.; Gobinath, R.; Shewale, M.; Khartode, B. Role of Artificial Intelligence in Construction Project Management. In Proceedings of the E3S Web of Conferences, Yogyakarta, Indonesia, 9–10 August 2023; EDP Sciences: Les Ulis, France, 2023; Volume 405, p. 04012. [Google Scholar]
  42. Popova Zhuhadar, L. AutoML Workflow. Available online: https://commons.wikimedia.org/wiki/File:AutoML_diagram.png (accessed on 30 March 2023).
  43. Zöller, M.-A.; Huber, M.F. Benchmark and survey of automated machine learning frameworks. J. Artif. Intell. Res. 2021, 70, 409–472. [Google Scholar] [CrossRef]
  44. Yao, Q.; Wang, M.; Chen, Y.; Dai, W.; Li, Y.-F.; Tu, W.-W.; Yang, Q.; Yu, Y. Taking human out of learning applications: A survey on automated machine learning. arXiv 2018, arXiv:1810.13306. [Google Scholar]
  45. Shorten, C.; Khoshgoftaar, T.M.; Furht, B. Text data augmentation for deep learning. J. Big Data 2021, 8, 101. [Google Scholar] [CrossRef] [PubMed]
  46. Zhou, J.; Zheng, L.; Wang, Y.; Wang, C.; Gao, R.X. Automated model generation for machinery fault diagnosis based on reinforcement learning and neural architecture search. IEEE Trans. Instrum. Meas. 2022, 71, 3501512. [Google Scholar] [CrossRef]
  47. Tamez-Pena, J.G.; Martinez-Torteya, A.; Alanis, I.; Tamez-Pena, M.J.G.; Rcpp, D.; Rcpp, L. Package ‘fresa. cad’. 2023. Available online: https://vps.fmvz.usp.br/CRAN/web/packages/FRESA.CAD/FRESA.CAD.pdf. (accessed on 30 March 2023).
  48. Reichenberger, S.; Sur, R.; Sittig, S.; Multsch, S.; Carmona-Cabrero, Á.; López, J.J.; Muñoz-Carpena, R. Dynamic prediction of effective runoff sediment particle size for improved assessment of erosion mitigation efficiency with vegetative filter strips. Sci. Total Environ. 2023, 857, 159572. [Google Scholar] [CrossRef] [PubMed]
  49. Obermeyer, Z.; Powers, B.; Vogeli, C.; Mullainathan, S. Dissecting racial bias in an algorithm used to manage the health of populations. Science 2019, 366, 447–453. [Google Scholar] [CrossRef] [PubMed]
  50. Obermeyer, Z.; Emanuel, E.J. Predicting the future—Big data, machine learning, and clinical medicine. N. Engl. J. Med. 2016, 375, 1216. [Google Scholar] [CrossRef]
  51. Ravì, D.; Wong, C.; Deligianni, F.; Berthelot, M.; Andreu-Perez, J.; Lo, B.; Yang, G.-Z. Deep learning for health informatics. IEEE J. Biomed. Health Inform. 2016, 21, 4–21. [Google Scholar] [CrossRef] [PubMed]
  52. Kavakiotis, I.; Tsave, O.; Salifoglou, A.; Maglaveras, N.; Vlahavas, I.; Chouvarda, I. Machine learning and data mining methods in diabetes research. Comput. Struct. Biotechnol. J. 2017, 15, 104–116. [Google Scholar] [CrossRef]
  53. Udler, M.S.; McCarthy, M.I.; Florez, J.C.; Mahajan, A. Genetic Risk Scores for Diabetes Diagnosis and Precision Medicine. Endocr. Rev. 2019, 40, 1500–1520. [Google Scholar] [CrossRef] [PubMed]
  54. Miotto, R.; Wang, F.; Wang, S.; Jiang, X.; Dudley, J.T. Deep learning for healthcare: Review, opportunities and challenges. Brief. Bioinform. 2018, 19, 1236–1246. [Google Scholar] [CrossRef]
  55. Goyal, P.; Choi, J.J.; Pinheiro, L.C.; Schenck, E.J.; Chen, R.; Jabri, A.; Satlin, M.J.; Campion, T.R., Jr.; Nahid, M.; Ringel, J.B. Clinical characteristics of COVID-19 in New York city. N. Engl. J. Med. 2020, 382, 2372–2374. [Google Scholar] [CrossRef]
  56. Chavez, S.; Long, B.; Koyfman, A.; Liang, S.Y. Coronavirus Disease (COVID-19): A primer for emergency physicians. Am. J. Emerg. Med. 2021, 44, 220–229. [Google Scholar] [CrossRef]
  57. Zia, U.A.; Khan, N. An Analysis of Big Data Approaches in Healthcare Sector. Int. J. Tech. Res. Sci. 2017, 2, 254–264. [Google Scholar]
  58. Bollier, D.; Firestone, C.M. The Promise and Peril of Big Data; Aspen Institute, Communications and Society Program: Washington, DC, USA, 2010. [Google Scholar]
  59. Provost, F.J.; Fawcett, T.; Kohavi, R. The case against accuracy estimation for comparing induction algorithms. In Proceedings of the ICML, Madison, WI, USA, 24–27 July 1998; pp. 445–453. [Google Scholar]
  60. Green, D.M.; Swets, J.A. Signal Detection Theory and Psychophysics; Wiley: New York, NY, USA, 1966; Volume 1. [Google Scholar]
  61. Vayena, E.; Blasimme, A.; Cohen, I.G. Machine learning in medicine: Addressing ethical challenges. PLoS Med. 2018, 15, e1002689. [Google Scholar] [CrossRef] [PubMed]
  62. Chen, J.H.; Asch, S.M. Machine learning and prediction in medicine—Beyond the peak of inflated expectations. N. Engl. J. Med. 2017, 376, 2507. [Google Scholar] [CrossRef] [PubMed]
  63. Bambra, C.; Riordan, R.; Ford, J.; Matthews, F. The COVID-19 pandemic and health inequalities. J. Epidemiol. Community Health 2020, 74, 964–968. [Google Scholar] [CrossRef] [PubMed]
  64. Lytras, M.D.; Raghavan, V.; Damiani, E. Big data and data analytics research: From metaphors to value space for collective wisdom in human decision making and smart machines. Int. J. Semant. Web Inf. Syst. IJSWIS 2017, 13, 1–10. [Google Scholar] [CrossRef]
  65. Lytras, M.D.; Visvizi, A. Artificial intelligence and cognitive computing: Methods, technologies, systems, applications and policy making. Sustainability 2021, 13, 3598. [Google Scholar] [CrossRef]
  66. Lytras, M.D.; Visvizi, A.; Sarirete, A.; Chui, K.T. Preface: Artificial intelligence and big data analytics for smart healthcare: A digital transformation of healthcare Primer. Artif. Intell. Big Data Anal. Smart Healthc. 2021, xvii–xxvii. [Google Scholar]
Figure 1. A comparative view of AI, machine learning, deep learning, and generative AI (source [16]).
Sustainability 15 13484 g001
Figure 2. AutoML workflow (source: [42]).
Sustainability 15 13484 g002
Figure 3. Scatterplot of attributes.
Sustainability 15 13484 g003
Figure 4. Model generation.
Sustainability 15 13484 g004
Figure 5. ROC comparison.
Sustainability 15 13484 g005
Figure 6. Generalized Linear Model—simulator.
Sustainability 15 13484 g006
Figure 7. Optimization framework.
Sustainability 15 13484 g007
Figure 8. Generalized Linear Model after optimization.
Sustainability 15 13484 g008
Table 1. Data dictionary.
AttributeDescriptionData TypeRange
PregnanciesNumber of times the individual has been pregnant. Range (0,17). integer(0, 17)
GlucosePlasma glucose concentration (mg/dL) after 2 h in an oral glucose tolerance test.integer(0, 199)
BloodPressureDiastolic blood pressure (mm Hg).integer(0, 122)
SkinThicknessTriceps skinfold thickness (mm)—a measure of body fat.integer(0, 99)
Insulin2 h serum insulin level (mu U/mL).integer(0, 846)
BMIBody mass index. real(0, 67.1)
DiabetesPedigreeFunctionA function that scores the likelihood of diabetes based on family history. Higher values indicate a higher risk.real(0.078, 2.42)
AgeAge of the individual in years.integer(21, 8)
OutcomeDiagnosis of diabetes. Encoded as ‘1’ for ‘diagnosed with diabetes’ and ‘0’ for ‘not diagnosed with diabetes’.Categorical (binary)(0, 1)
Table 2. Statistical summary.
AttributeMin.1st qu.MedianMean3rd qu.Max
Pregnancies0133.845617
Glucose099117120.9140.2199
BloodPressure0627269.1180122
SkinThickness002320.543299
Insulin0030.579.8127.2846
BMI027.33231.9936.667.1
DiabetesPedigree
Function
0.0780.24370.37250.47190.62622.42
Age21242933.244181
Table 3. Correlation matrix.
AttributesAgeBloodPressureBMIDiabetesPedigreeFunctionGlucoseInsulinOutcome = FalsePregnanciesSkinThickness
Age10.2400.0360.0340.264−0.042−0.2380.544−0.114
BloodPressure0.24010.2820.0410.1530.089−0.0650.1410.207
BMI0.0360.28210.1410.2210.198−0.2930.0180.393
DiabetesPedigreeFunction0.0340.0410.14110.1370.185−0.174−0.0340.184
Glucose0.2640.1530.2210.13710.331−0.4670.1290.057
Insulin−0.0420.0890.1980.1850.3311−0.131−0.0740.437
Outcome = false−0.238−0.065−0.293−0.174−0.467−0.1311−0.222−0.075
Pregnancies0.5440.1410.018−0.0340.129−0.074−0.2221−0.082
SkinThickness−0.1140.2070.3930.1840.0570.437−0.075−0.0821
Table 4. Precision results.
ModelPrecisionStandard DeviationGainsTotal Time
Naive Bayes56.5%±20.9%206 min 49 s
Generalized Linear Model66.5%±10.8%367 min 4 s
Logistic Regression73.1%±20.5%367 min 6 s
Fast Large Margin66.0%±14.1%347 min 0 s
Deep Learning58.3%±28.1%188 min 20 s
Decision Tree66.0%±17.6%266 min 57 s
Random Forest54.9%±24.6%187 min 58 s
Gradient Boosted Trees53.0%±26.5%128 min 0 s
Support Vector Machine55.8%±21.5%227 min 15 s
Table 5. Recall results.
ModelRecallStandard DeviationGainsTotal Time
Naive Bayes55.2%±17.3%206 min 49 s
Generalized Linear Model61.8%±13.2%367 min 4 s
Logistic Regression52.5%±14.0%367 min 6 s
Fast Large Margin60.8%±10.5%347 min 0 s
Deep Learning46.4%±21.1%188 min 20 s
Decision Tree44.5%±15.6%266 min 57 s
Random Forest49.4%±17.3%187 min 58 s
Gradient Boosted Trees49.1%±16.5%128 min 0 s
Support Vector Machine48.8%±18.3%227 min 15 s
Table 6. Accuracy results.
Model AccuracyStandard DeviationGainsTotal Time
Naive Bayes77.6%±5.1%206 min 49 s
Generalized Linear Model79.2%±3.7%367 min 4 s
Logistic Regression79.2%±6.3%367 min 6 s
Fast Large Margin78.7%±3.6%347 min 0 s
Deep Learning77.1%±4.0%188 min 20 s
Decision Tree76.5%±5.1%266 min 57 s
Random Forest75.0%±6.9%187 min 58 s
Gradient Boosted Trees75.4%±2.4%128 min 0 s
Support Vector Machine76.1%±6.9%227 min 15 s
Table 7. Confusion matrix for accuracy.
Naïve Bayes true falsetrue trueclass precision
pred.false1132283.70%
pred.true192960.42%
class recall85.61%56.86%
LogisticRegression true falsetrue true class precision
pred.false1152681.56%
pred.true123071.43%
class recall90.55%53.57%
Decision Tree true falsetrue true class precision
pred.false1153178.77%
pred.true122567.57%
class recall90.55%44.64%
Gradient Boosted Trees true falsetrue true class precision
pred.false1112482.22%
pred.true212756.25%
class recall84.09%52.94%
Generalized Linear Model true falsetrue true class precision
pred.false1102183.97%
pred.true173567.31%
class recall86.61%62.50%
Support Vector Machine true falsetrue true class precision
pred.false1122780.58%
pred.true172862.22%
class recall86.82%50.91%
Fast Large Margin true falsetrue true class precision
pred.false1102283.33%
pred.true173466.67%
class recall86.61%60.71%
Deep Learning true falsetrue true class precision
pred.false1162681.69%
pred.true162560.98%
class recall87.88%49.02%
Random Forest true falsetrue true class precision
pred.false1102780.29%
pred.true192859.57%
class recall85.27%50.91%
Table 8. Overall performance.
Generalized Linear ModelLogistic Regression Model
CriterionValueStandard DeviationCriterionValueStandard Deviation
Accuracy79.2%±3.7%Accuracy79.2%±6.3%
Classification Error20.8%±3.7%Classification Error20.8%±6.3%
AUC82.4%±5.0%AUC84.1%±7.2%
Precision66.5%±10.8%Precision73.1%±20.5%
Recall61.8%±13.2%Recall52.5%±14.0%
F Measure63.5%±9.7%F Measure60.0%±13.0%
Sensitivity61.8%±13.2%Sensitivity52.5%±14.0%
Specificity86.5%±4.1%Specificity90.3%±6.1%
Disclaimer/Publisher’s Note: The statements, opinions and data contained in all publications are solely those of the individual author(s) and contributor(s) and not of MDPI and/or the editor(s). MDPI and/or the editor(s) disclaim responsibility for any injury to people or property resulting from any ideas, methods, instructions or products referred to in the content.

