1. Introduction
Environmental deterioration and global warming have become significant issues in recent years. In order to enhance energy efficiency, establish low-carbon cities, and protect the environment, China has announced the “double carbon” objective of reaching carbon peaking by 2030 and achieving carbon neutrality by 2060. Rapid urbanization has made energy conservation and emission reduction in cities the primary focus of sustainable development initiatives in many nations. Urban carbon emissions, which can be used to assess the level of energy consumption and its impact on the environment, play a significant role in national carbon emissions. Currently, the primary sources of urban carbon emissions include energy, industry, agriculture, transportation, and buildings [
1,
2]. The primary methods for reducing urban emissions include the optimization of energy consumption patterns, industrial organization, and urban development. In the field of urban planning and construction, researchers are increasingly focusing on the carbon emissions generated by urban construction activities. These emissions are associated with energy consumption costs in urban areas.
Studies that have already been conducted, based on the interdisciplinary growth of the environment, economics, planning, and architecture fields, demonstrate that the economy, demographics, technology, and policy aspects—including essential factors such as economic and population size [
3,
4], the urbanization process [
5,
6], and energy consumption [
7,
8]—all interact to produce carbon emissions. A systematic approach to low-carbon urban planning has been developed, as shown in
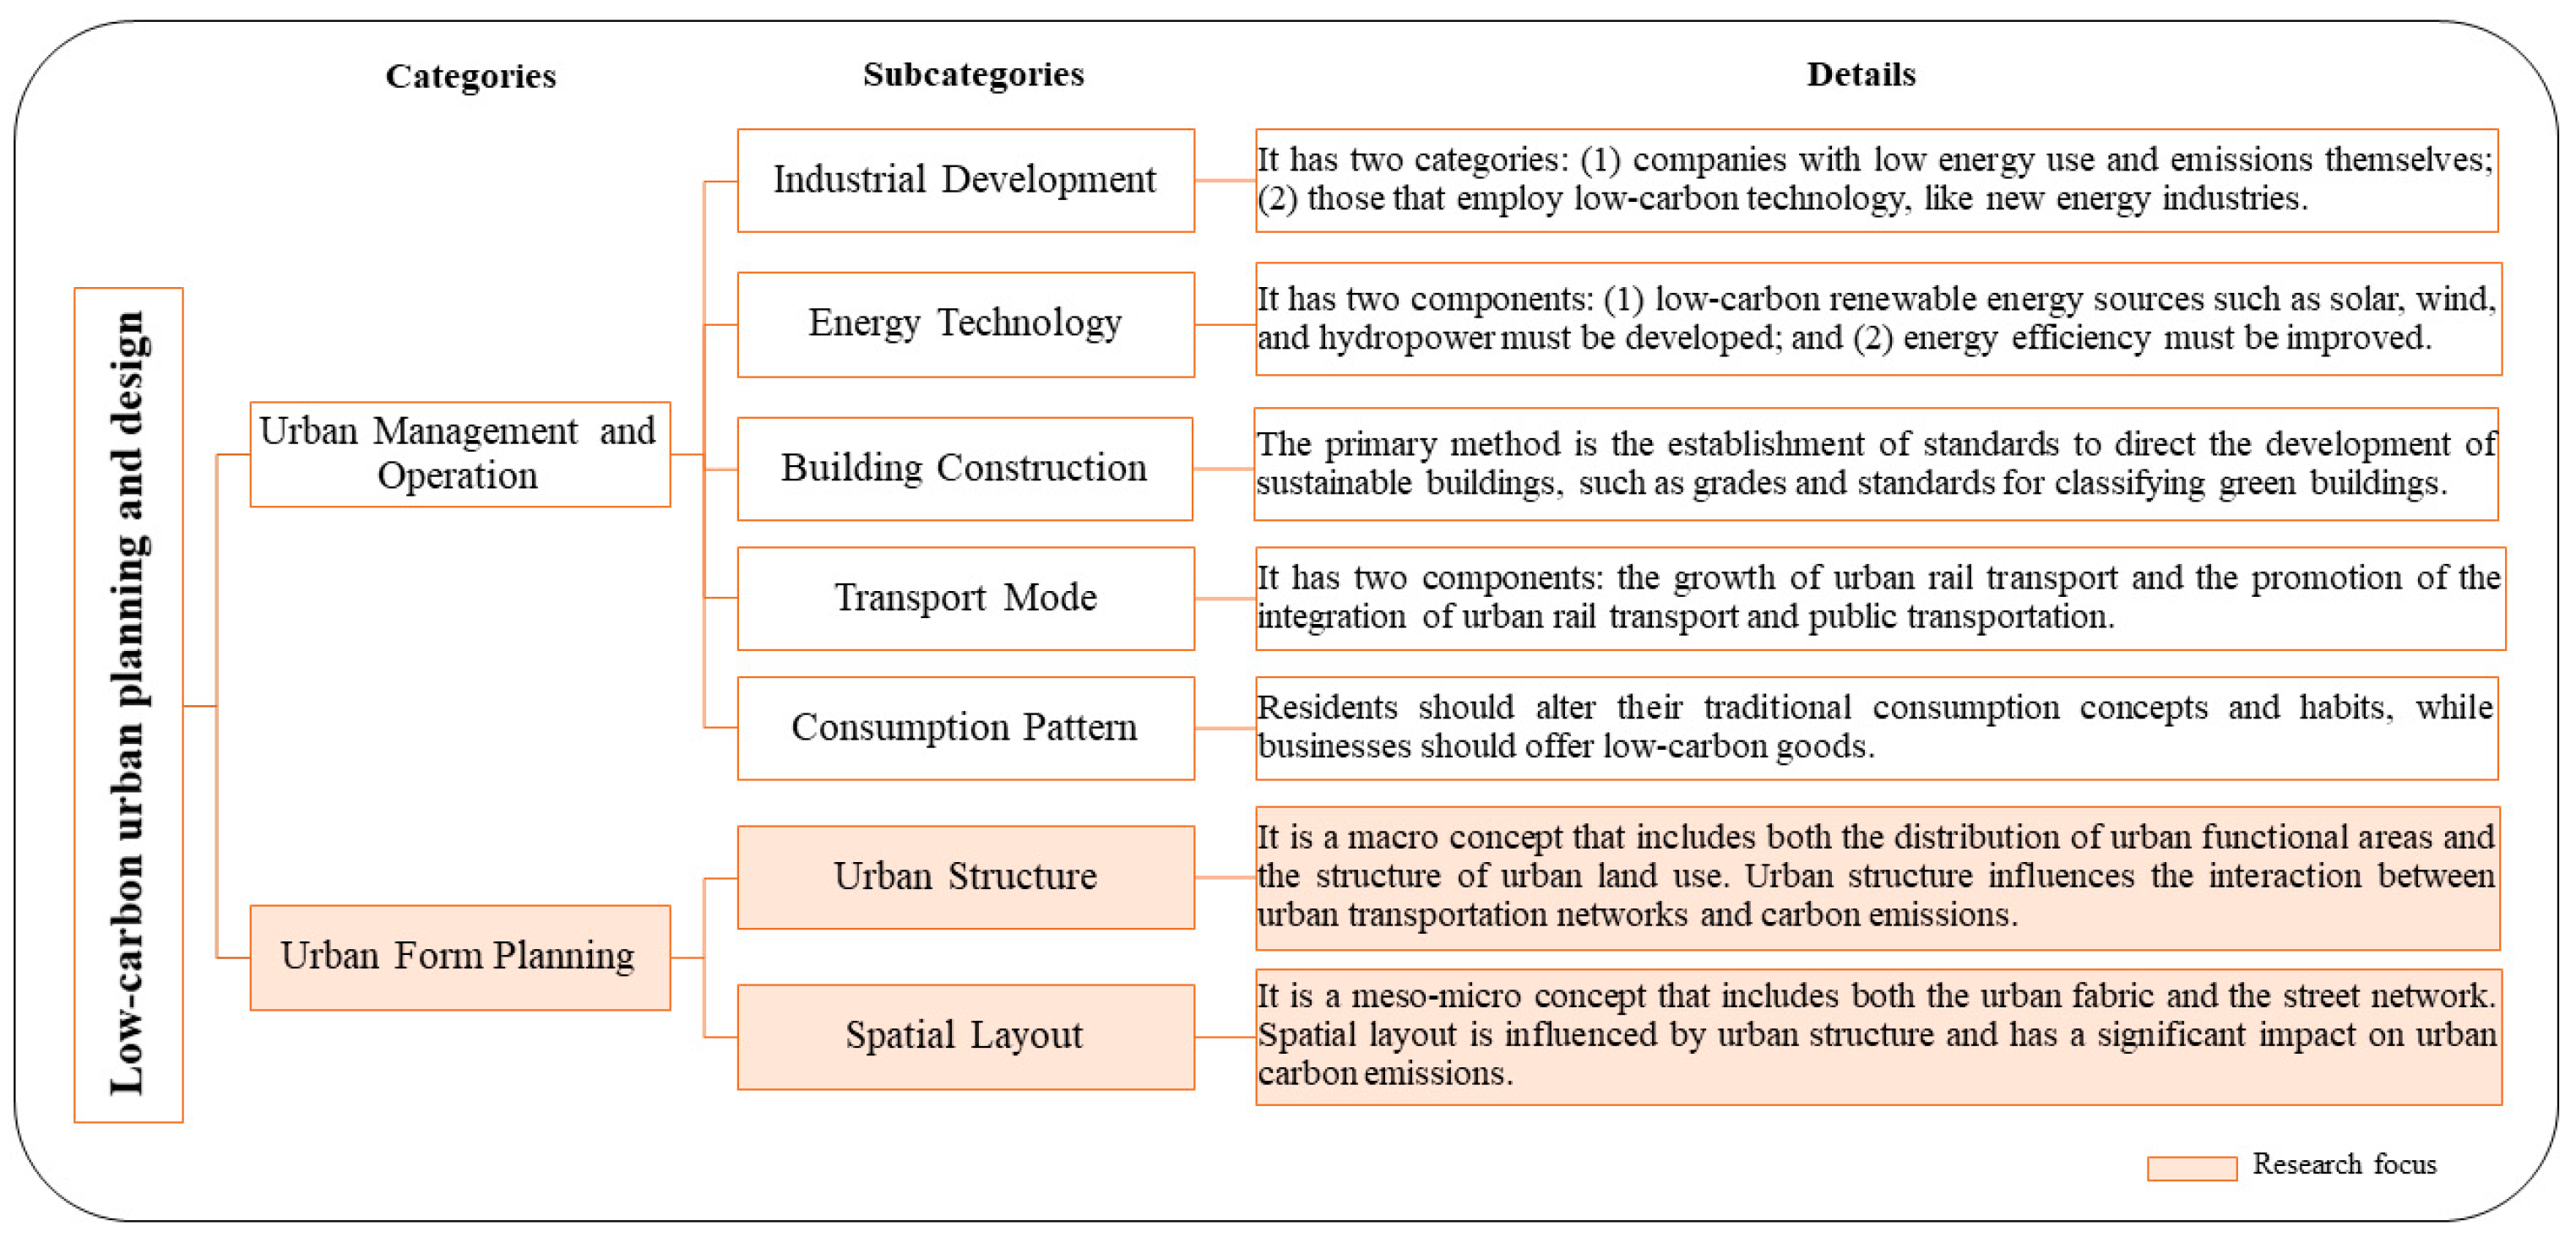
Figure 1, from two perspectives: (1) urban management and operation, and (2) urban form planning, which includes energy use, transportation, building construction, spatial layout, and other aspects [
9,
10,
11,
12]. Among these concepts, urban management and operation encompass various aspects such as demographic, economic, technological, and social management. On the other hand, urban form planning, which is a crucial element of urban physical space planning, serves as the primary focus of research and a key aspect for planners to consider. In particular, urban form is chosen as the subject of environmental assessment because it can be directly manipulated and improved by disciplines such as architecture, urban design, and urban planning. In contrast to other carbon-related factors in economic and social planning, such as macro-industry or energy structure, changing urban form is a relatively rapid and cost-effective approach to achieving improvements in the urban environment, including reducing carbon emissions. Therefore, conducting a comprehensive study on the relationship between urban form and carbon emissions is crucial. The findings from this study will provide direct scientific support for low-carbon city planning.
In recent years, research on the correlation between urban form and carbon emissions has significantly increased, moving from qualitative description to quantitative analysis. Early research has examined the impact of the built environment on energy consumption in buildings and transportation [
13,
14,
15]. Later, as the greenhouse effect became a growing concern, studies began to explore the relationship between urban form and carbon emissions. These studies built upon the existing foundation and incorporated a wider and more in-depth range of influencing factors [
16,
17]. Ying Huang focuses on the relationship between the built environment and transport carbon emissions, noting that research in this field is expanding [
18]. Changlong Sun uses bibliometric analysis to summarize the impact of urban form on carbon emissions into four components [
19], but it lacks comprehensiveness. Meng Cai performs a systematic review from a spatial modeling perspective [
20], but the research area is limited to China. He Zhang reviews the research on the spatial planning–carbon emissions relationship, synthesizes seven key influencing factors, and proposes an analytical model [
21]. The study provides a thorough explanation of the scales and indicators of spatial planning, but it fails to define and categorize carbon emissions. Overall, despite the value of their research, there are a few limitations. First, some of the reviews are written in Chinese, which makes it difficult for Western scholars to gain a comprehensive understanding of the research progress. Second, some bibliometric analyses of the reviews only discuss information such as authors, journals, and keywords, without exploring their intrinsic connections or providing in-depth analysis. To further their research, it is necessary to conduct a thorough review of the current research and identify future directions.
Using bibliometric analysis along with a literature review, this article collects papers on the correlation between urban form and carbon emissions from the CNKI and Web of Science databases. The article first identifies the research hotspots in the field. Second, it categorizes the calculations and objects related to carbon emissions. Third, it highlights the key conclusions of multi-scale research on the correlation between urban form and carbon emissions, including the analysis methodologies. Finally, it suggests a framework and development trend for future research on urban form and carbon emissions.
This research aims to answer the following questions: (1) Over the past 20 years, how has research on the correlation between urban form and carbon emissions evolved? (2) What types of carbon emissions are related to urban form, and how are these emissions typically calculated? (3) What urban form indicators are related to carbon emissions, and how do they impact carbon emissions? (4) What is the conceptual framework for exploring the relationship between urban form and carbon emissions in the low-carbon urban planning research system?
The contributions of this paper, which add to previous research, are as follows: (1) Providing a more extensive and in-depth review than before. This study combines bibliometric and literature review methodologies to ensure both a broad and deep review. Bibliometric analyses can provide a comprehensive overview of the research field, while a literature review allows for a detailed analysis of the issues in the area. (2) Major issues and future research directions are discussed, and a more detailed research framework is developed. (3) A more interdisciplinary study that incorporates both urban planning and environmental sciences, including research on multi-scale urban form and multi-category carbon emissions.
The primary structure of this paper is as follows: it combines bibliometric analyses with a literature review. The bibliometric analysis is included in
Section 2 and
Section 3 to provide a comprehensive overview of the research field.
Section 2 presents the research methodology, including the software used and the literature search.
Section 3 shows the findings of the bibliometric analysis. The literature review method is then used in the latter sections, specifically
Section 4,
Section 5 and
Section 6, for an in-depth understanding.
Section 4 explores the concepts and measurements of carbon emissions to establish a reliable research foundation for quantitative studies. Based on this,
Section 5 thoroughly analyzes the impact of urban form on carbon emissions at various scales. It examines indicators, research methodology, and main conclusions, with the significance of providing references for future research.
Section 6 discusses future research directions and proposes a research framework that encompasses the findings in
Section 3,
Section 4 and
Section 5. Additionally,
Section 7 provides a summary of the work and indicates its limitations.
2. Materials and Methods
2.1. Bibliometric Analysis
Bibliometric analysis is a quantitative research technique that utilizes diverse textual data and a range of indicators to elucidate the characteristics and trends of a particular topic or study. Commonly used analysis data includes keywords, citations, authors, institutions, and their affiliations [
22]. The strengths of bibliometric research include literature processing, academic results evaluation, and data visualization. Therefore, researchers often use bibliometric methods to investigate patterns of publication evolution, author collaboration networks, research hotspots, and trends [
23]. This study is based on bibliometric analysis to provide readers with a thorough understanding of the knowledge structure of urban form and carbon emissions.
There are several software tools available for bibliometric analysis, including VOSviewer, CiteSpace, and BibExcel. CiteSpace is a Java-based knowledge map visualization tool created by Chen Chaomei that can assess the structure of scientific publication networks [
24]. The advantage of Citespace is that it can efficiently process a large amount of literature and present it visually. After analyzing the retrieved literature, Citespace can generate knowledge maps to identify the key literature and research interests in a particular scientific field. Many scholars use it to conduct quantitative literature reviews, including in the fields of architecture and urban planning. Therefore, this paper utilizes CiteSpace software version 6.2. R3 (64-bit) to evaluate and visualize studies on urban form and carbon emissions.
2.2. Data Collection
This article used the Web of Science (WOS) and China National Knowledge Infrastructure (CNKI) databases as its primary sources to retrieve literary data from 2000 to 2023 (search deadline: 7 May 2023). This time span was chosen because there were scarcely any publications available on the relevant topics before 2000. The WOS database is a Clarivate platform that provides access to numerous publications, including thousands of reputable and high-impact scholarly articles from around the world [
25,
26]. It should be emphasized that the WOS database contains results from numerous Chinese authors, confirming that Chinese scholars have made important contributions. Therefore, in order to enhance the depth and reliability of the review, we also conducted a search of relevant Chinese articles from the CNKI database, which is the most comprehensive and widely used database in China, even though the English literature from the WOS database made up the majority of the bibliometric analyses.
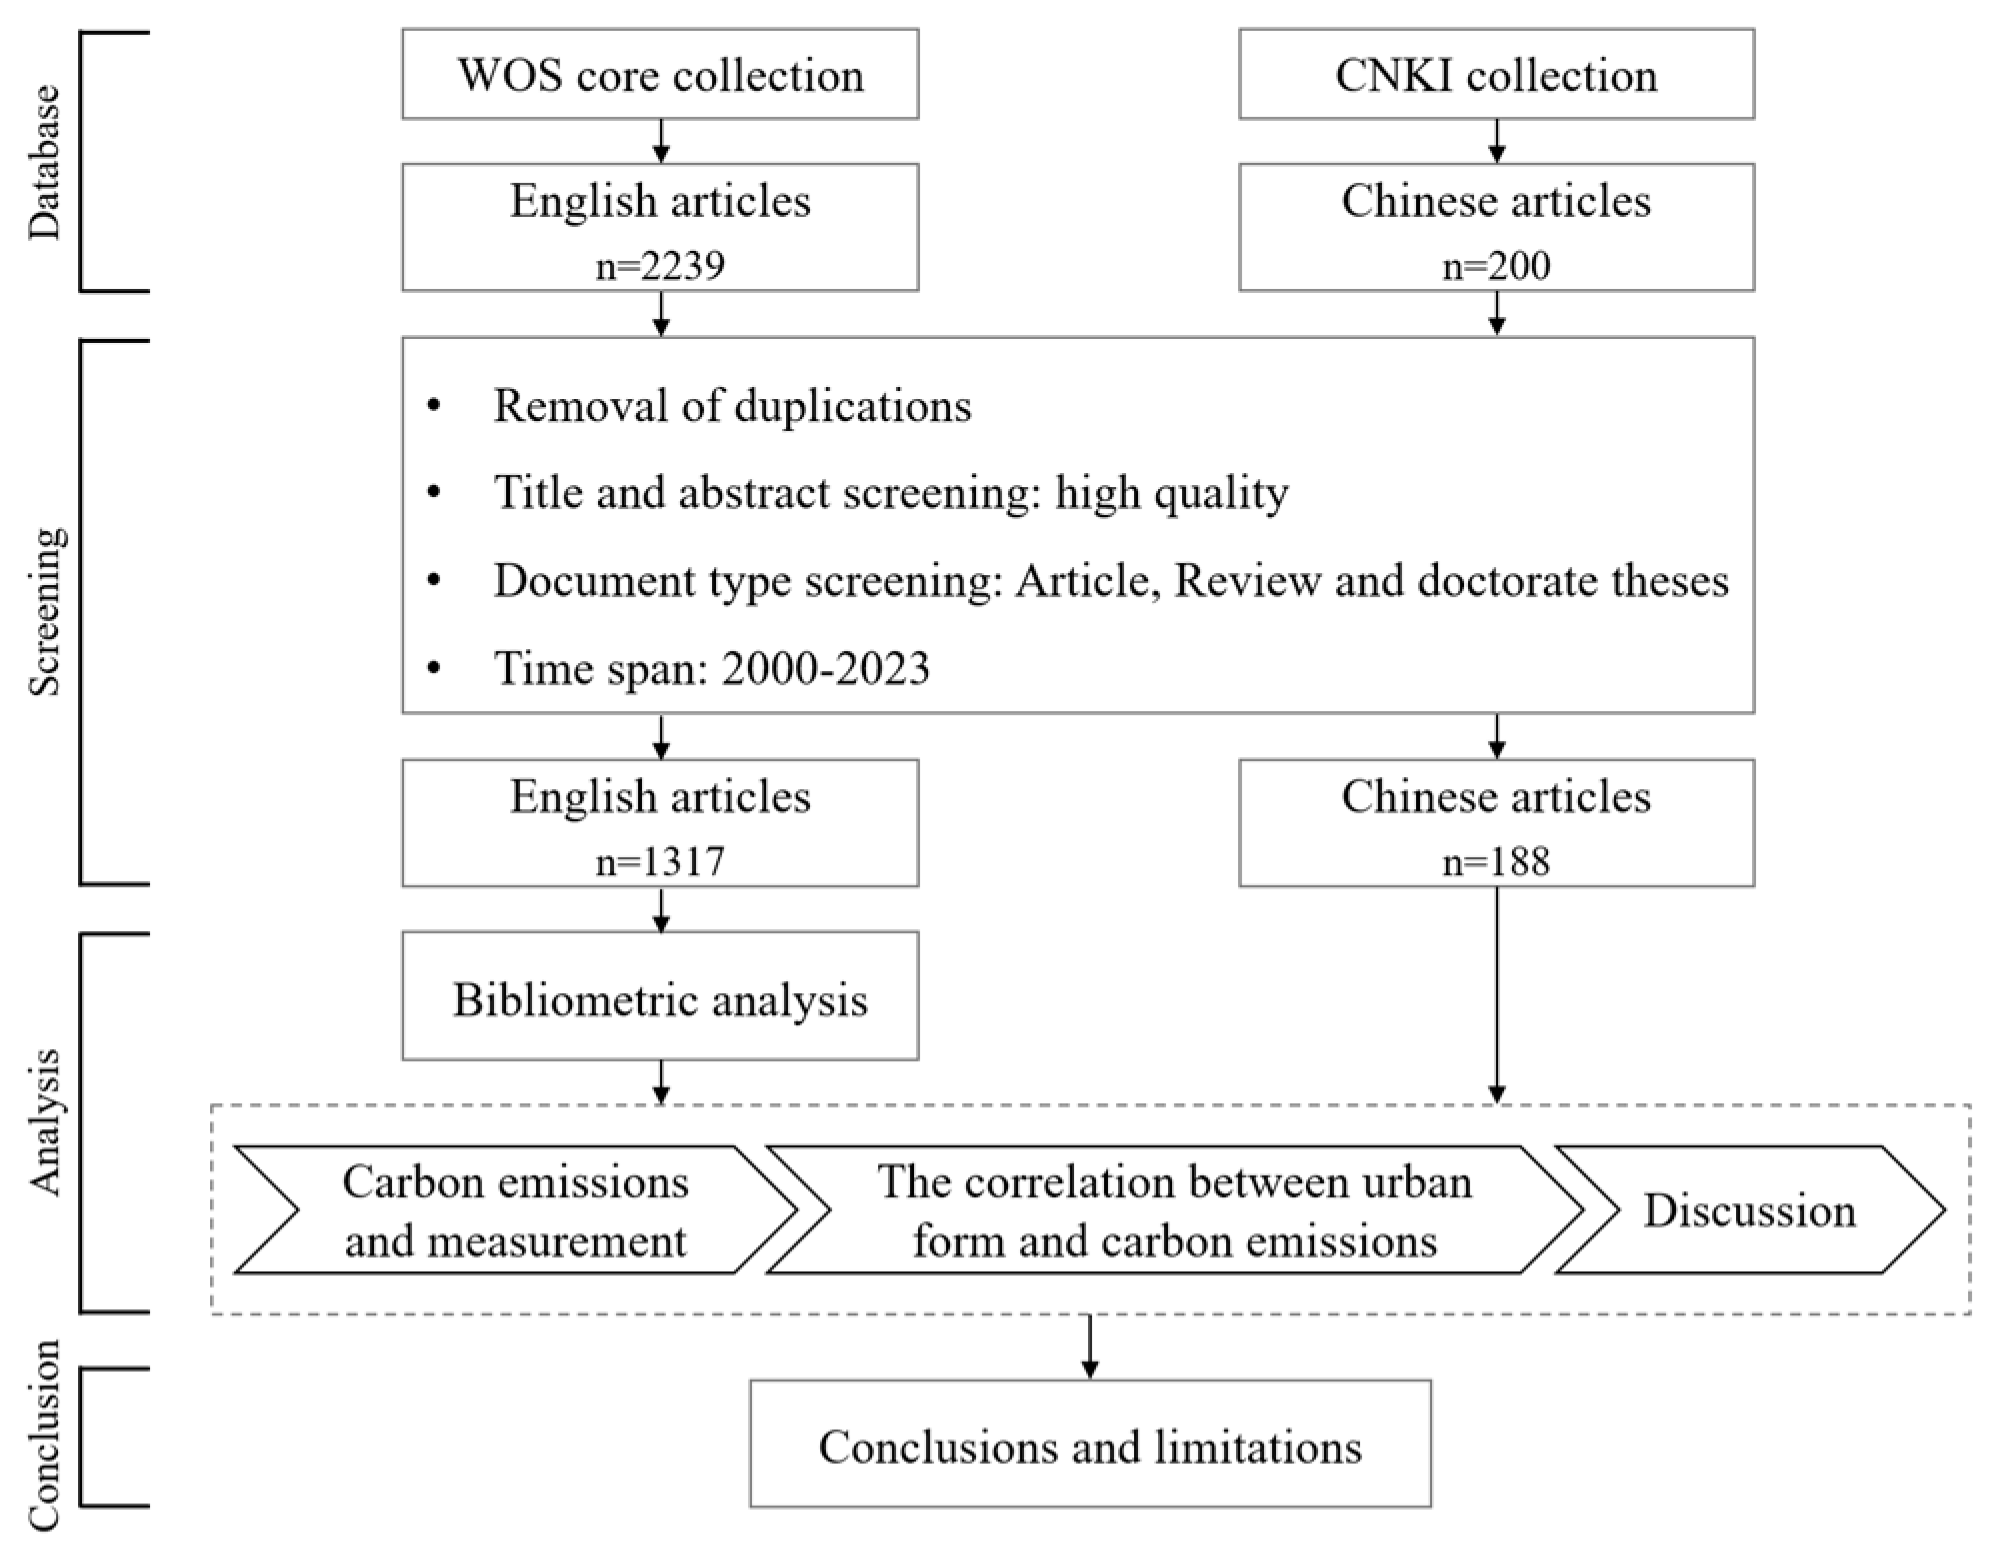
The search terms, “(TS = (urban form) OR TS = (urban morphology) OR TS = (urban spatial structure)) AND (TS = (carbon emission) OR TS = (CO
2 emission) OR TS = (GHG emission) OR TS = (greenhouse gas emission))”, were used to conduct an advanced search in the WOS database. The core collection database was selected, and the types of literature were restricted to articles and reviews; 2239 pieces of literature in English were then retrieved. After manual screening, 1317 pieces of English literature were determined to be valid. The search term, “(urban form + urban spatial structure) * (carbon emissions + greenhouse gas emissions)”, was used to conduct an advanced search in the CNKI database. After searching through 200 Chinese articles, reviews, and doctoral theses, 188 pieces of authentic Chinese literature were eventually found after manual screening. The research flowchart is shown in
Figure 2.
3. Results
3.1. Analysis of Publication Trends
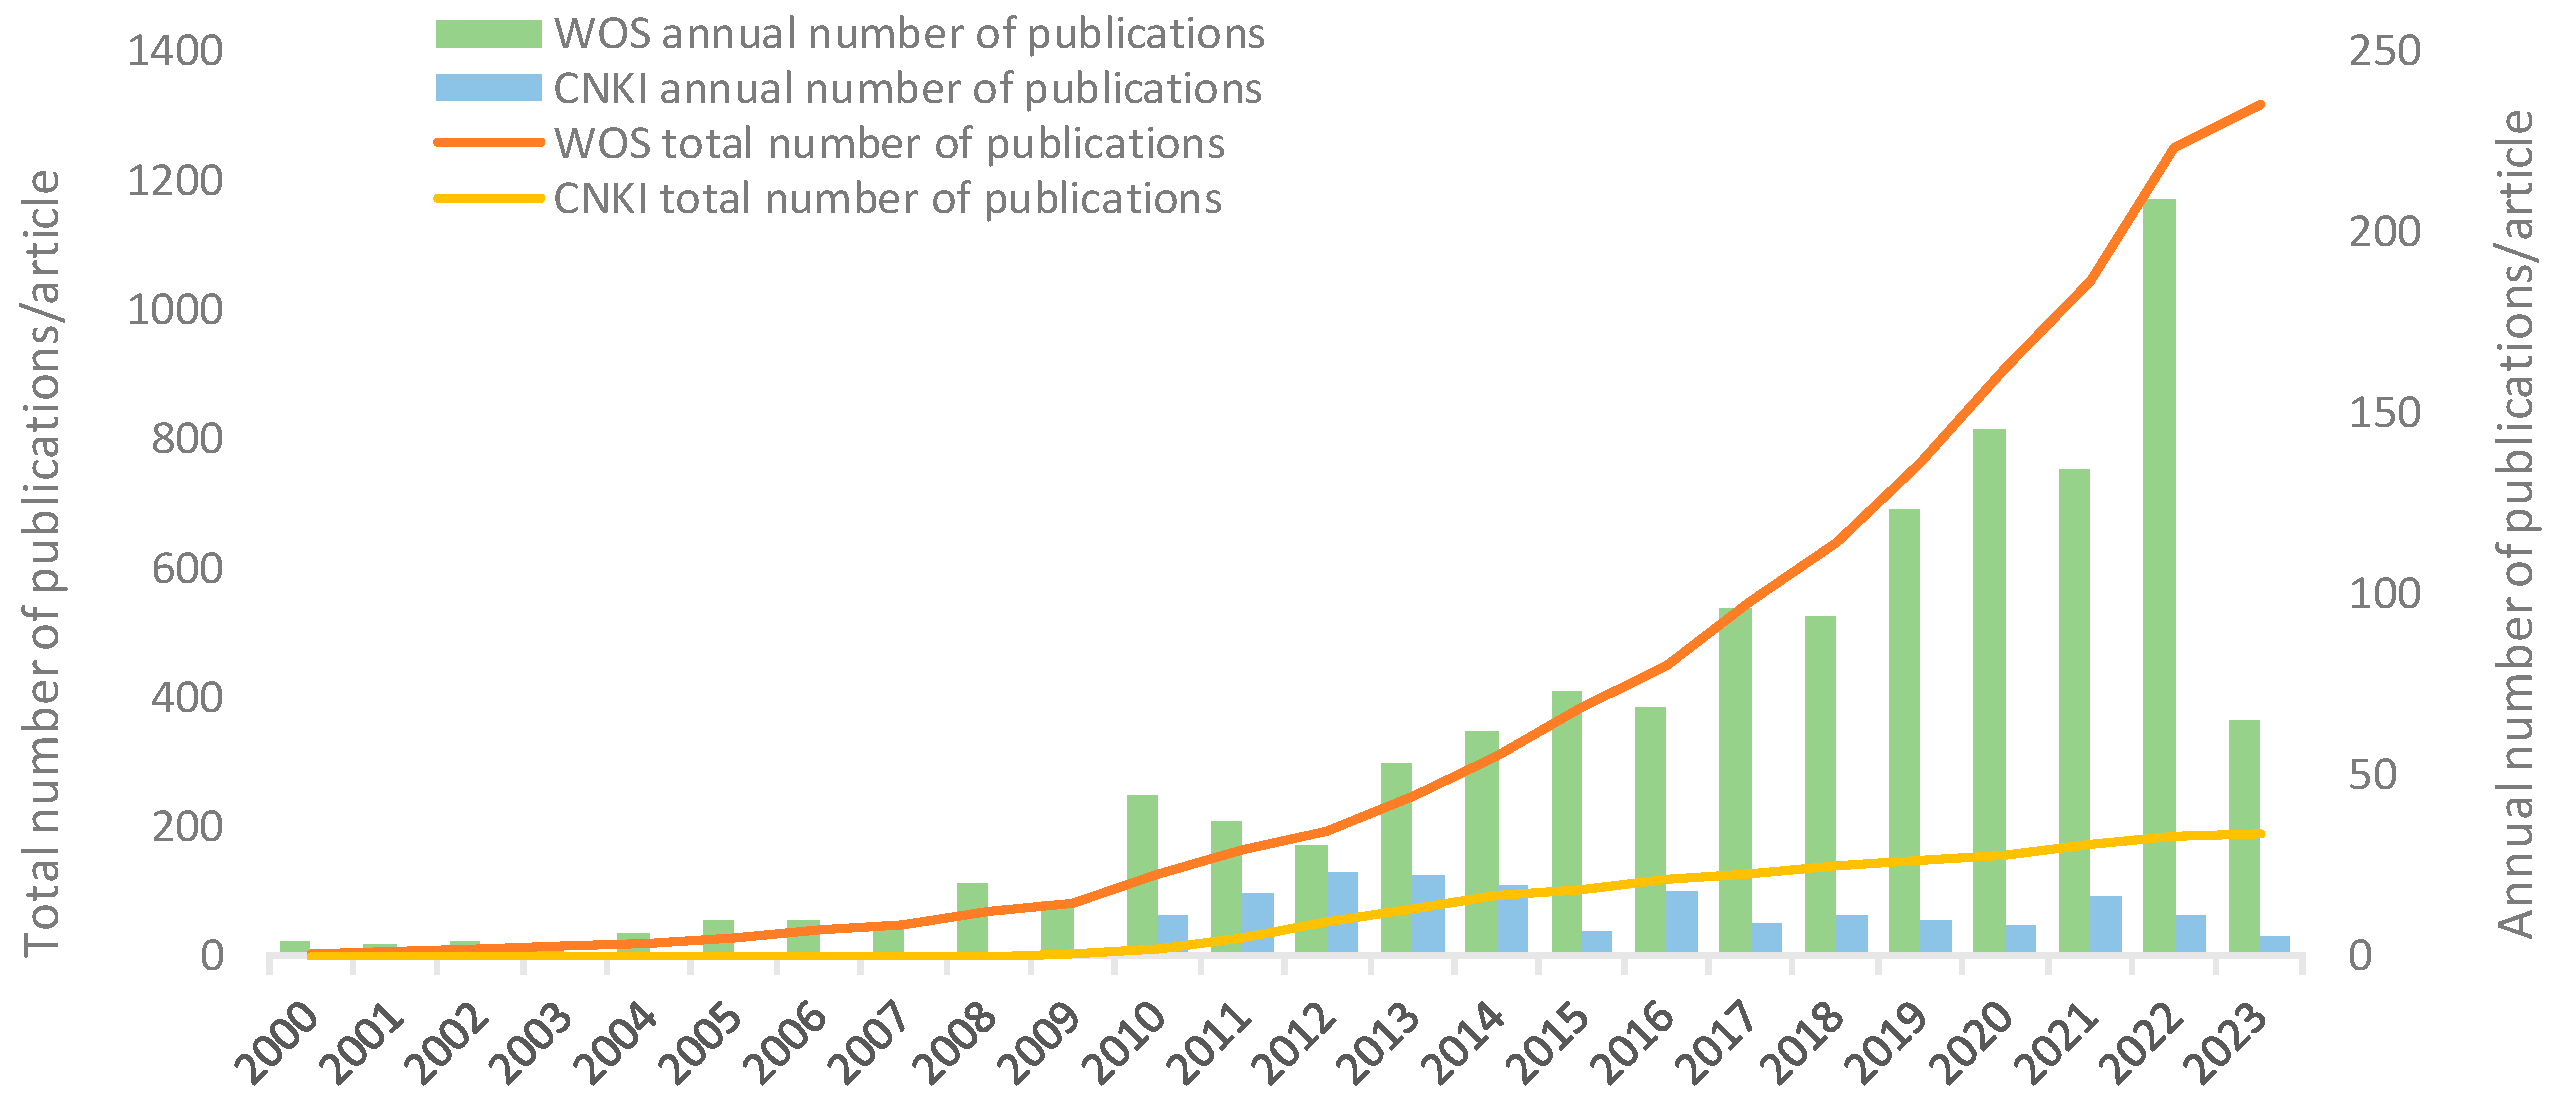
Analyzing the number of publications reveals how the significance and interest in a research area have changed over time. Globally, more research is being published each year on the correlation between urban form and carbon emissions, with Chinese studies starting later but expanding quickly (
Figure 3). The research in this area can be loosely divided into three stages up until the year 2023. (1) Start-up phase (2000–2009): Prior to 2009, there was a scarcity of literature, all of which was written in English. However, with the advent of the Kyoto Protocol in 2005, the number of publications began to slowly increase. (2) Steady growth phase (2010–2021): The number of articles increased gradually. With the establishment of low-carbon city pilot projects in China in 2011, research in this area first appeared and developed in Chinese. As a result, there was an increase in the representation of Chinese authors in the literature. (3) Rapid development phase (2022–2023): From 2022 onwards, publications have dramatically increased, peaking at 262 in 2022. This indicates that there is a growing interest in climate change and greenhouse gas emissions, both domestically and internationally, which has sparked a research boom.
3.2. Key Journals and Disciplines
The English-language literature on urban form and carbon emissions comes from over 300 journals focusing on environmental sciences, green sustainable science technology, and energy fuels. Among these journals, Sustainability (ISSN: 2071-1050) has the largest number of articles, with 90, followed by
The Journal Of Cleaner Production (ISSN: 0959-6526) with 86 (
Table 1). It is obvious that there is a growing trend towards more multidisciplinary research on the topics of urban form and carbon emissions, particularly in the fields of environmental science, energy, and economic management.
3.3. Collaboration Network Analysis
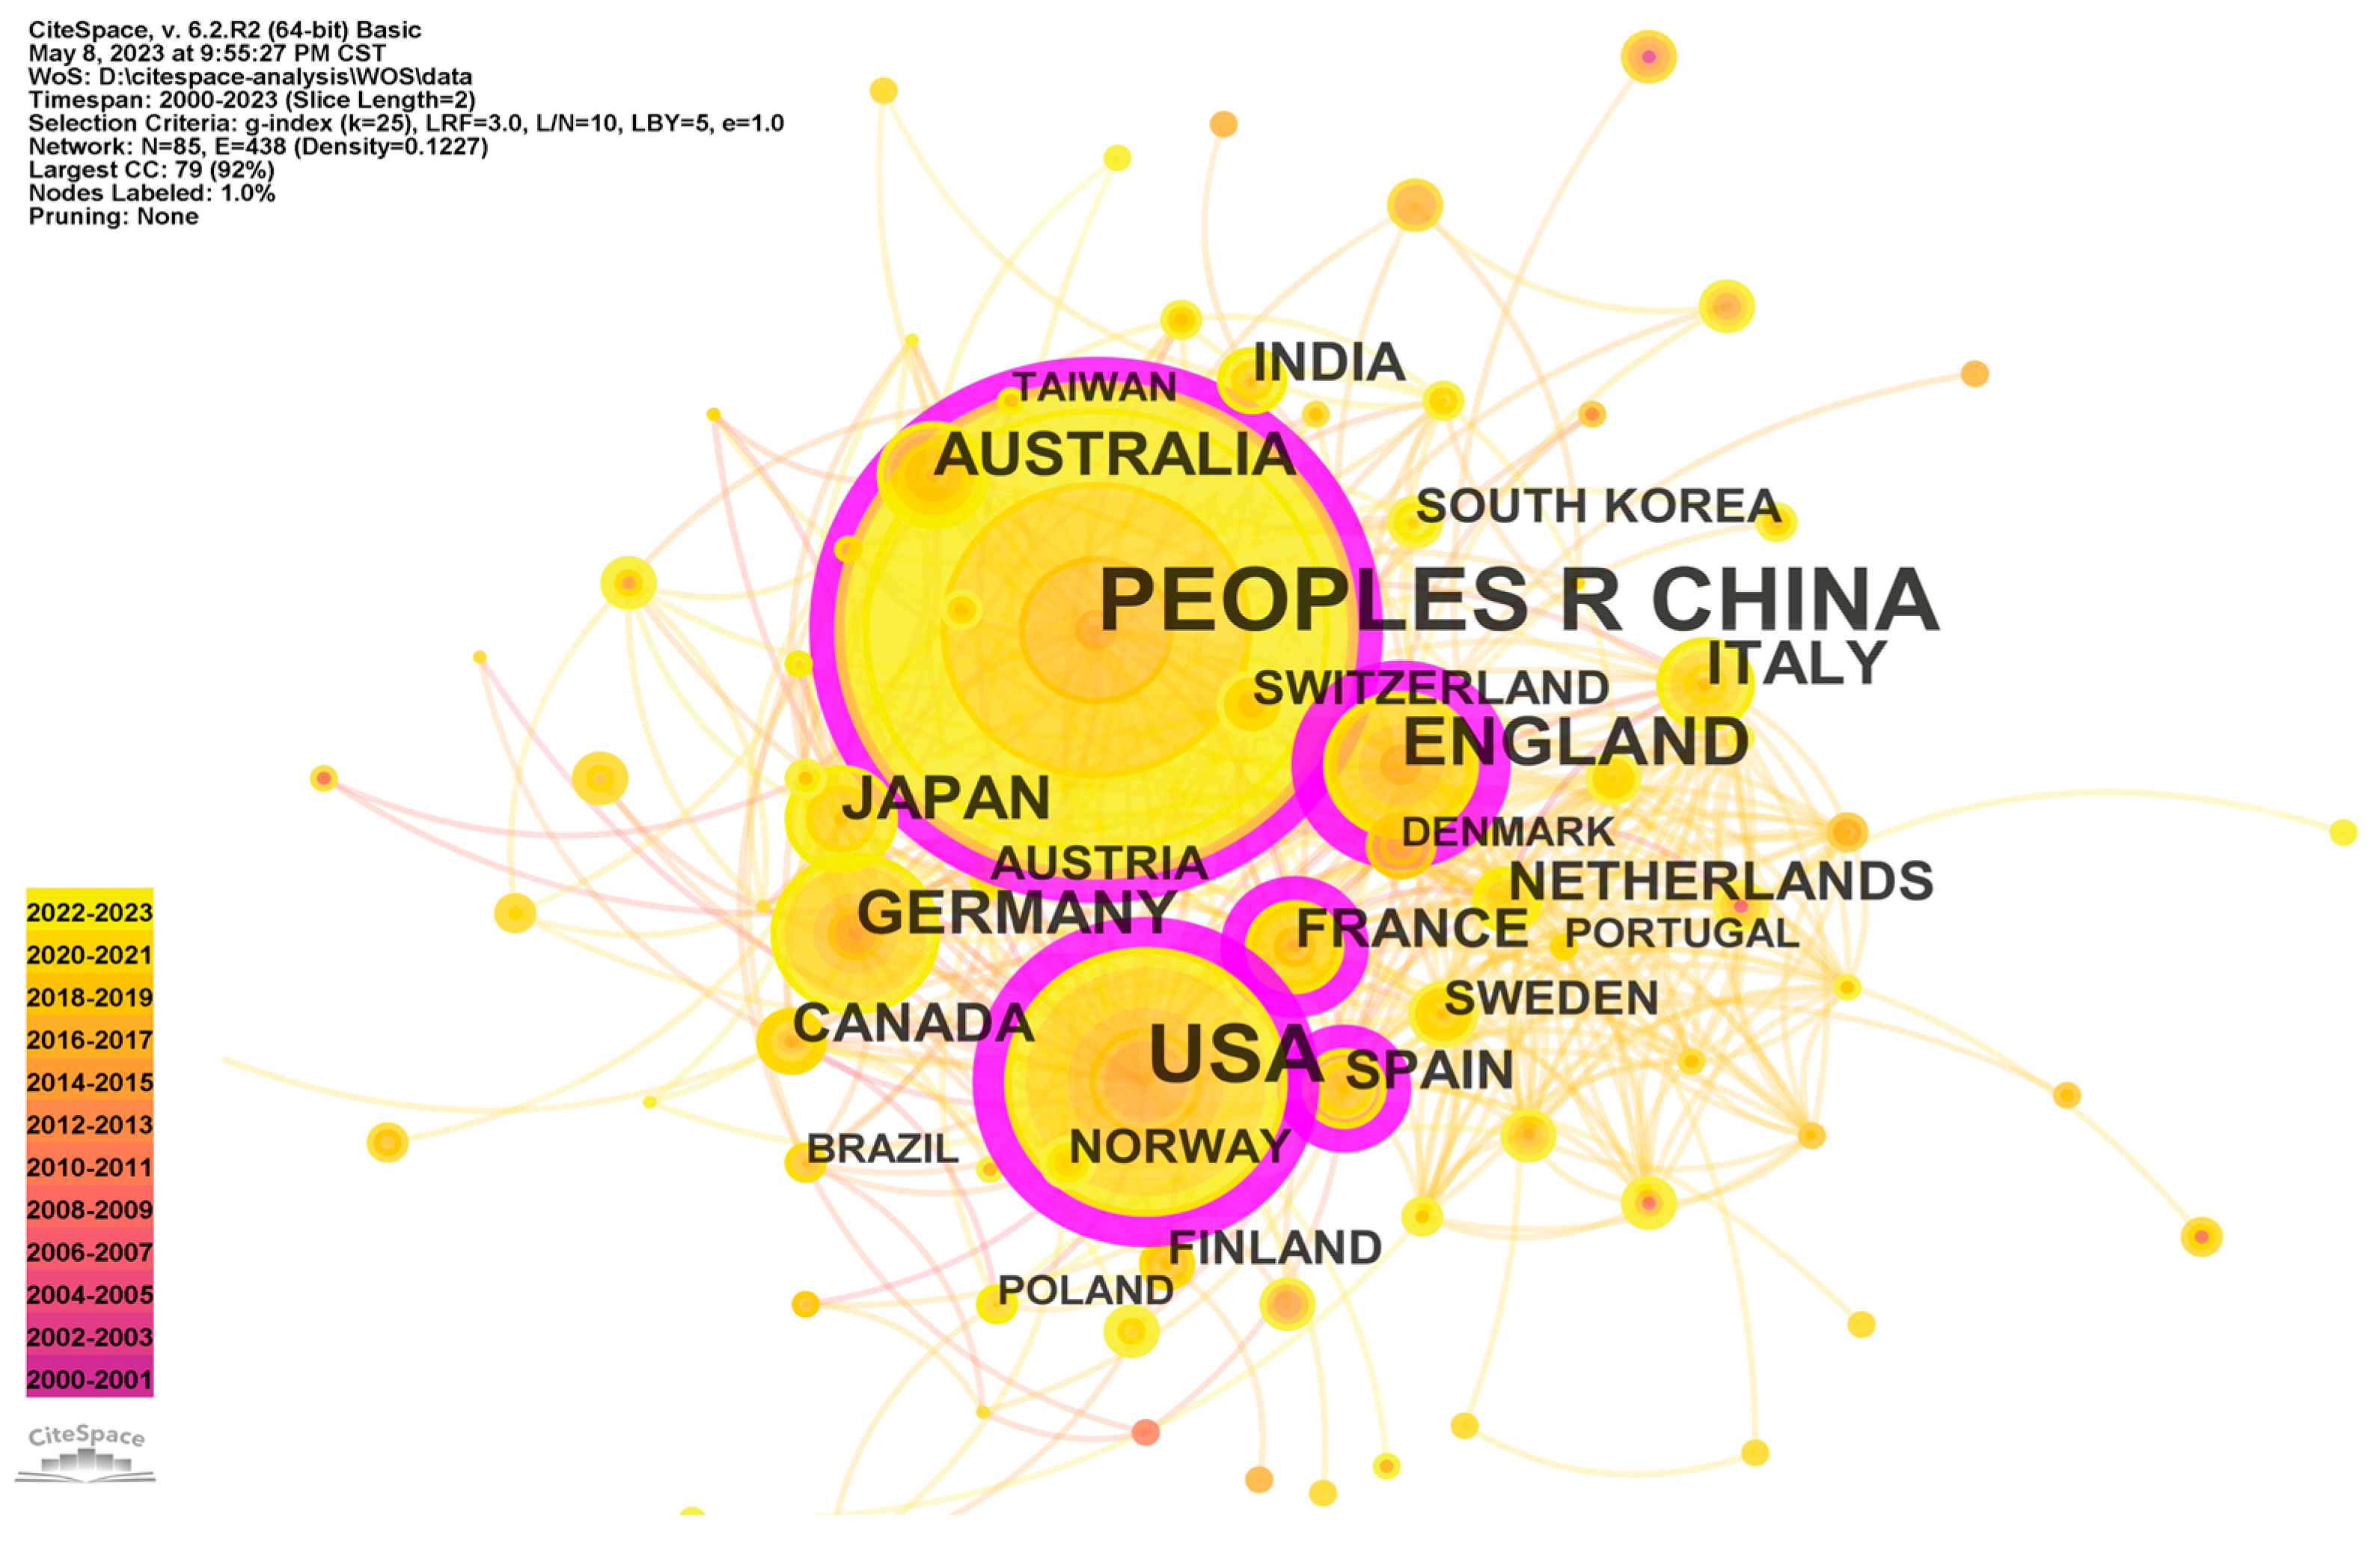
The analysis of collaborative networks helps to understand which countries, organizations, and researchers are currently concentrating on urban form and carbon emissions. According to the current global perspective, developed countries such as the US, UK, and those in Europe lead research efforts and are more essential to studies on carbon emissions (
Figure 4). This is largely because these countries experience environmental changes and pollution issues earlier than developing countries due to their faster rate of industrial and economic development.
Table 2 reveals that China (517) and the US (281) are the two countries with the highest number of publications. China contributed 27.12% of the total number of papers, making it one of the major contributors in this field. Centrality is used to describe the possibility of any shortest path through a node in the network, and a node is considered significant if its centrality is greater than 0.1. The US (0.4), England (0.31), and China (0.17) are the three nations with the highest centralities, indicating that these countries have contributed more to international cooperation. Overall, Chinese research took a while to gain momentum, but it has accelerated in the last three years, with many Chinese academics now participating in fields related to carbon emissions.
Table 2.
Top five contributing countries and territories from 2000 to 2023 (WOS).
Table 2.
Top five contributing countries and territories from 2000 to 2023 (WOS).
| # | Country/Territory | Publications | Percentage | Centrality |
|---|
| 1 | China | 517 | 27.12% | 0.17 |
| 2 | USA | 281 | 14.74% | 0.4 |
| 3 | England | 102 | 5.35% | 0.31 |
| 4 | Germany | 83 | 4.35% | 0.08 |
| 5 | Japan | 71 | 3.73% | 0.07 |
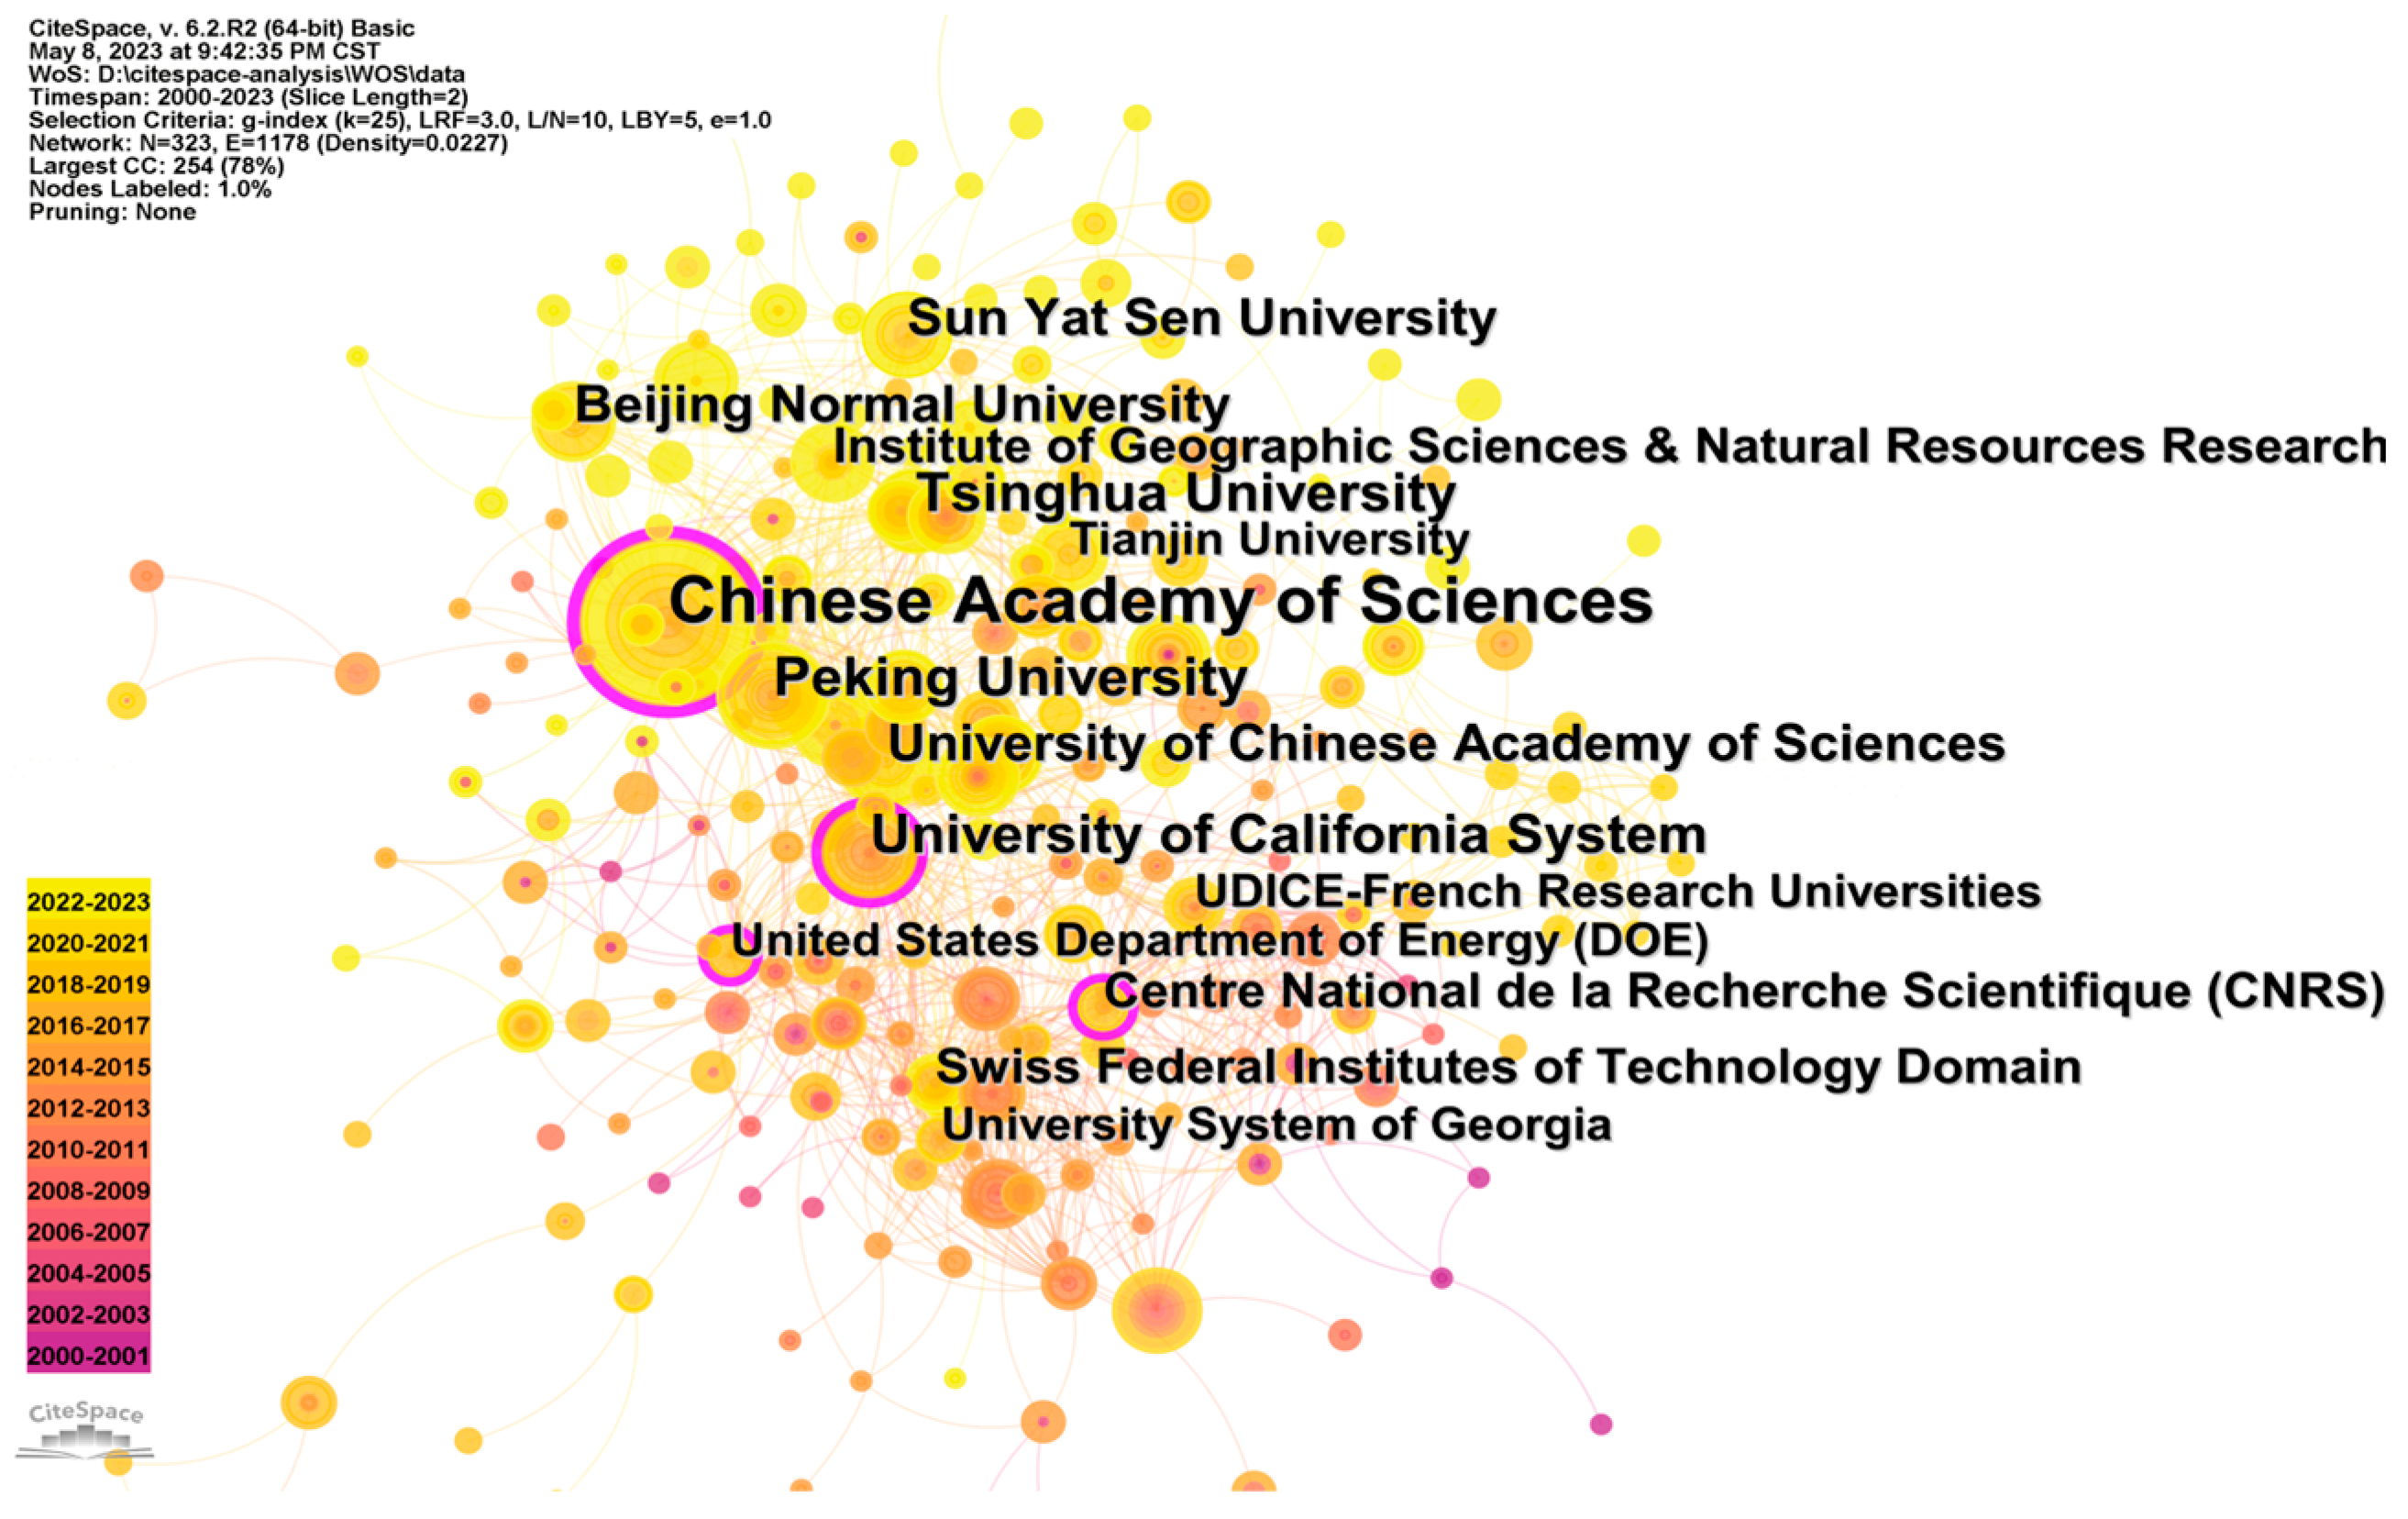
Figure 5 and
Table 3 show that there is a close network of cooperation among the different institutions in each country. The Chinese Academy of Sciences (CAS), Tsinghua University, Peking University, and the University of California are the institutions with the largest number of English-language scholarly publications. Among them, CAS has the most publications (90) and the greatest centrality (0.3), reflecting the significance and recognition of its achievements. The number of nodes (research institutions) (N = 323) and the number of connected lines (institutional cooperation) (E = 1178) demonstrate that the trend in future research on carbon emissions in urban form is cross-regional and multi-institutional cooperation, which allows research groups to leverage each other’s strengths and make significant advancements.
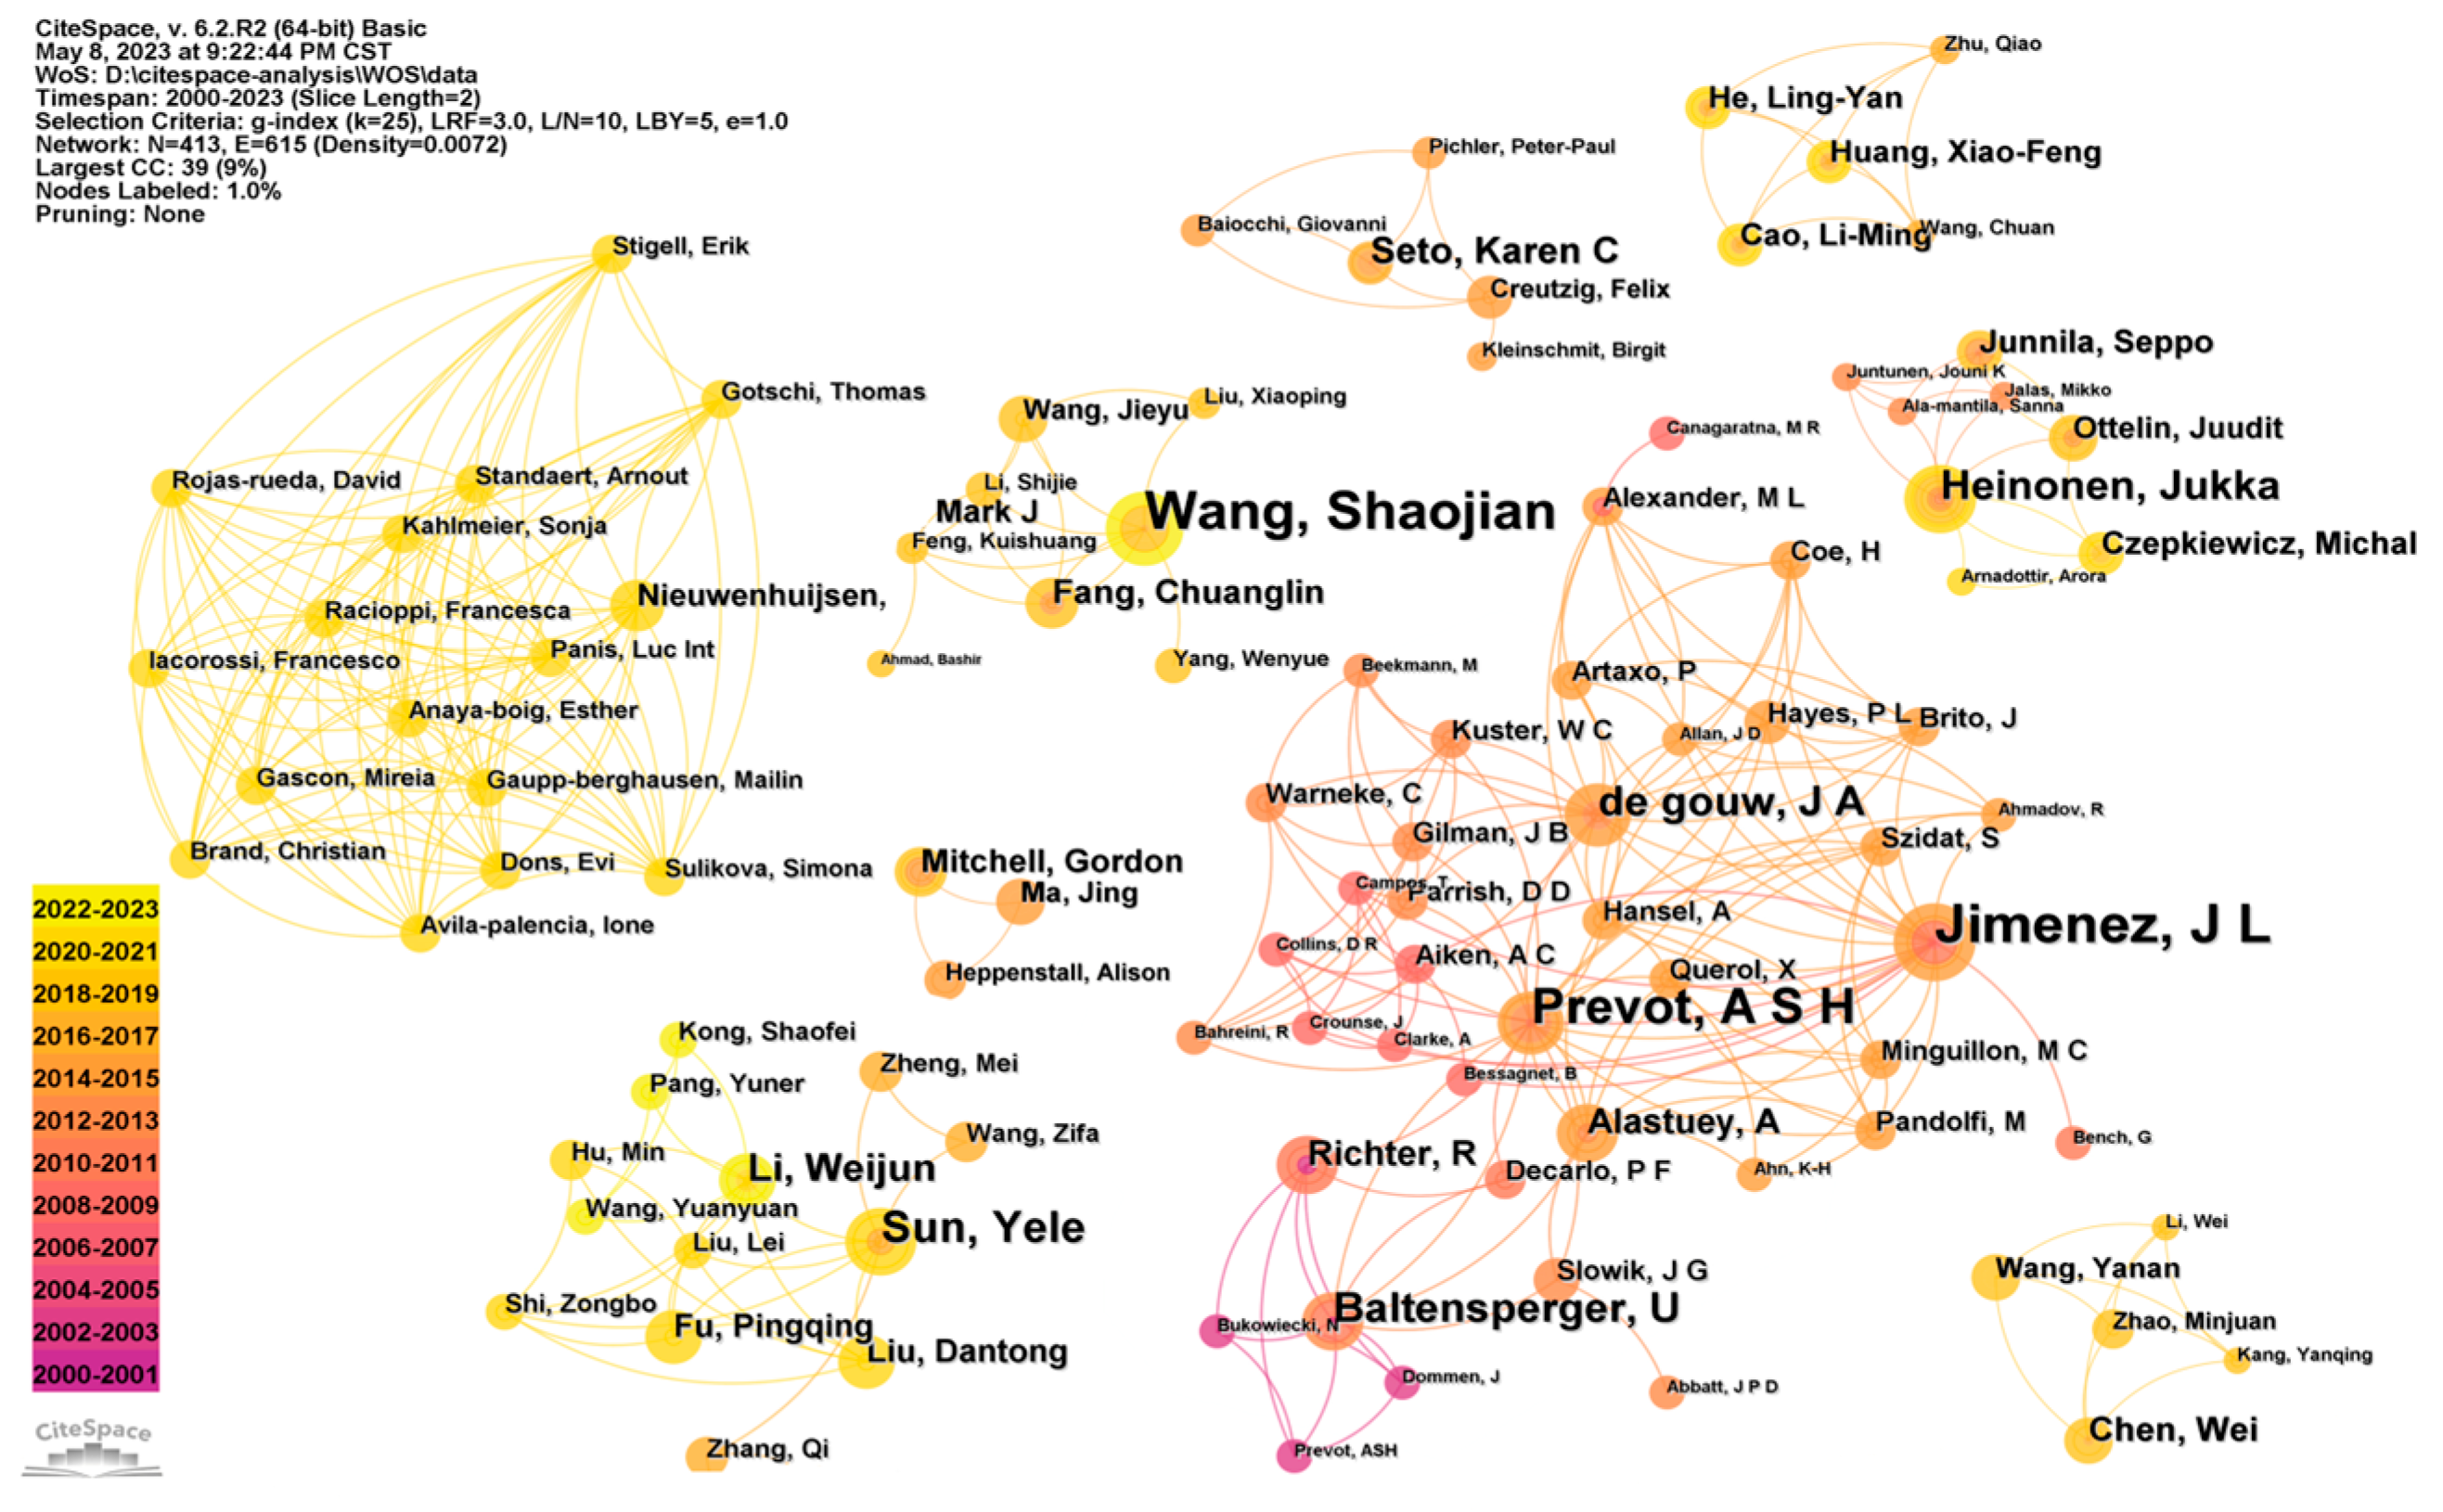
The most important and productive researchers in the field were identified by mapping the collaboration networks of authors.
Figure 6 shows that Jimenez, J.L., Heinonen Jukka, and Wang Shaojian are three of the most prolific authors, each having established a collaborative network in a specific area of research. Jimenez, J.L., was among the first to conduct a study on the sources of carbon emissions in cities and the environmental effects of these emissions. Heinonen Jukka’s collaborative network is focused on evaluating carbon footprints based on spatial consumption and its influencing factors, including the relationship between the built environment and carbon emission intensity. Wang Shaojian is a member of an increasingly active collaborative network. This group of researchers focuses on the spatial characteristics of carbon emissions at the macro-city scale. They investigate the effects of urbanization, economic growth, urban form, land use, and energy consumption on carbon emission efficiency and air pollution.
Table 3.
Top five contributing institutions from 2000 to 2023 (WOS).
Table 3.
Top five contributing institutions from 2000 to 2023 (WOS).
| # | Country | Institution | Publications | Percentage | Centrality |
|---|
| 1 | China | Chinese Academy of Sciences | 90 | 5.55% | 0.3 |
| 2 | China | Tsinghua University | 37 | 2.28% | 0.08 |
| 3 | China | Peking University | 35 | 2.16% | 0.05 |
| 4 | USA | University of California System | 34 | 2.10% | 0.15 |
| 5 | China | Sun Yat Sen University | 31 | 1.91% | 0.06 |
3.4. Keywords and Research Hot Topics
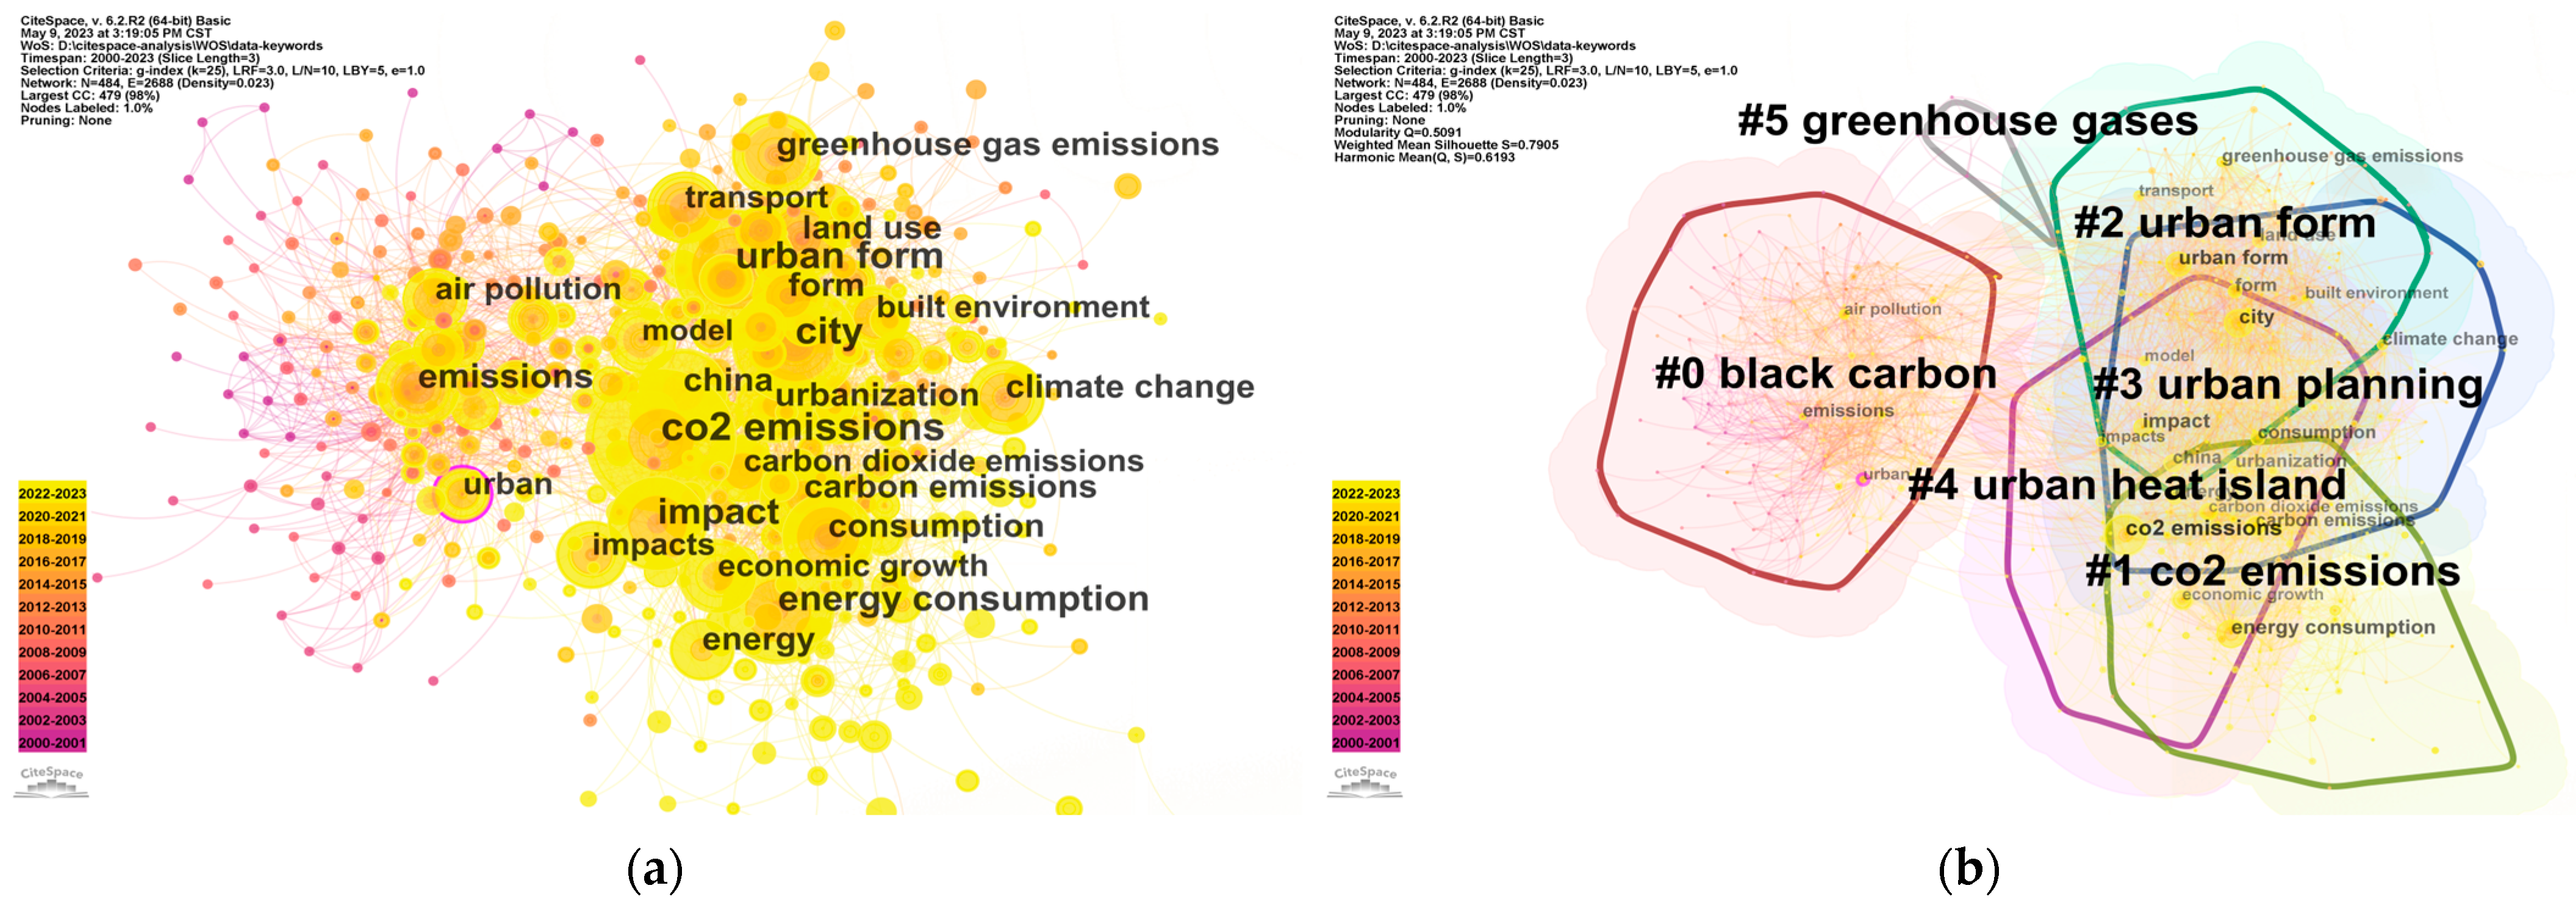
Keyword co-occurrence and clustering analysis can reveal the hot research topics in the field. Larger clustering nodes indicate that the represented topic is a significant research issue (
Figure 7). The literature data were initially submitted to keyword co-occurrence analysis to generate a keyword co-occurrence network (
Table 4), and the results were subsequently grouped and displayed based on keyword form. The silhouette is the primary indicator of network homogeneity, and clustering is considered appropriate when the silhouette score is greater than 0.5 [
27].
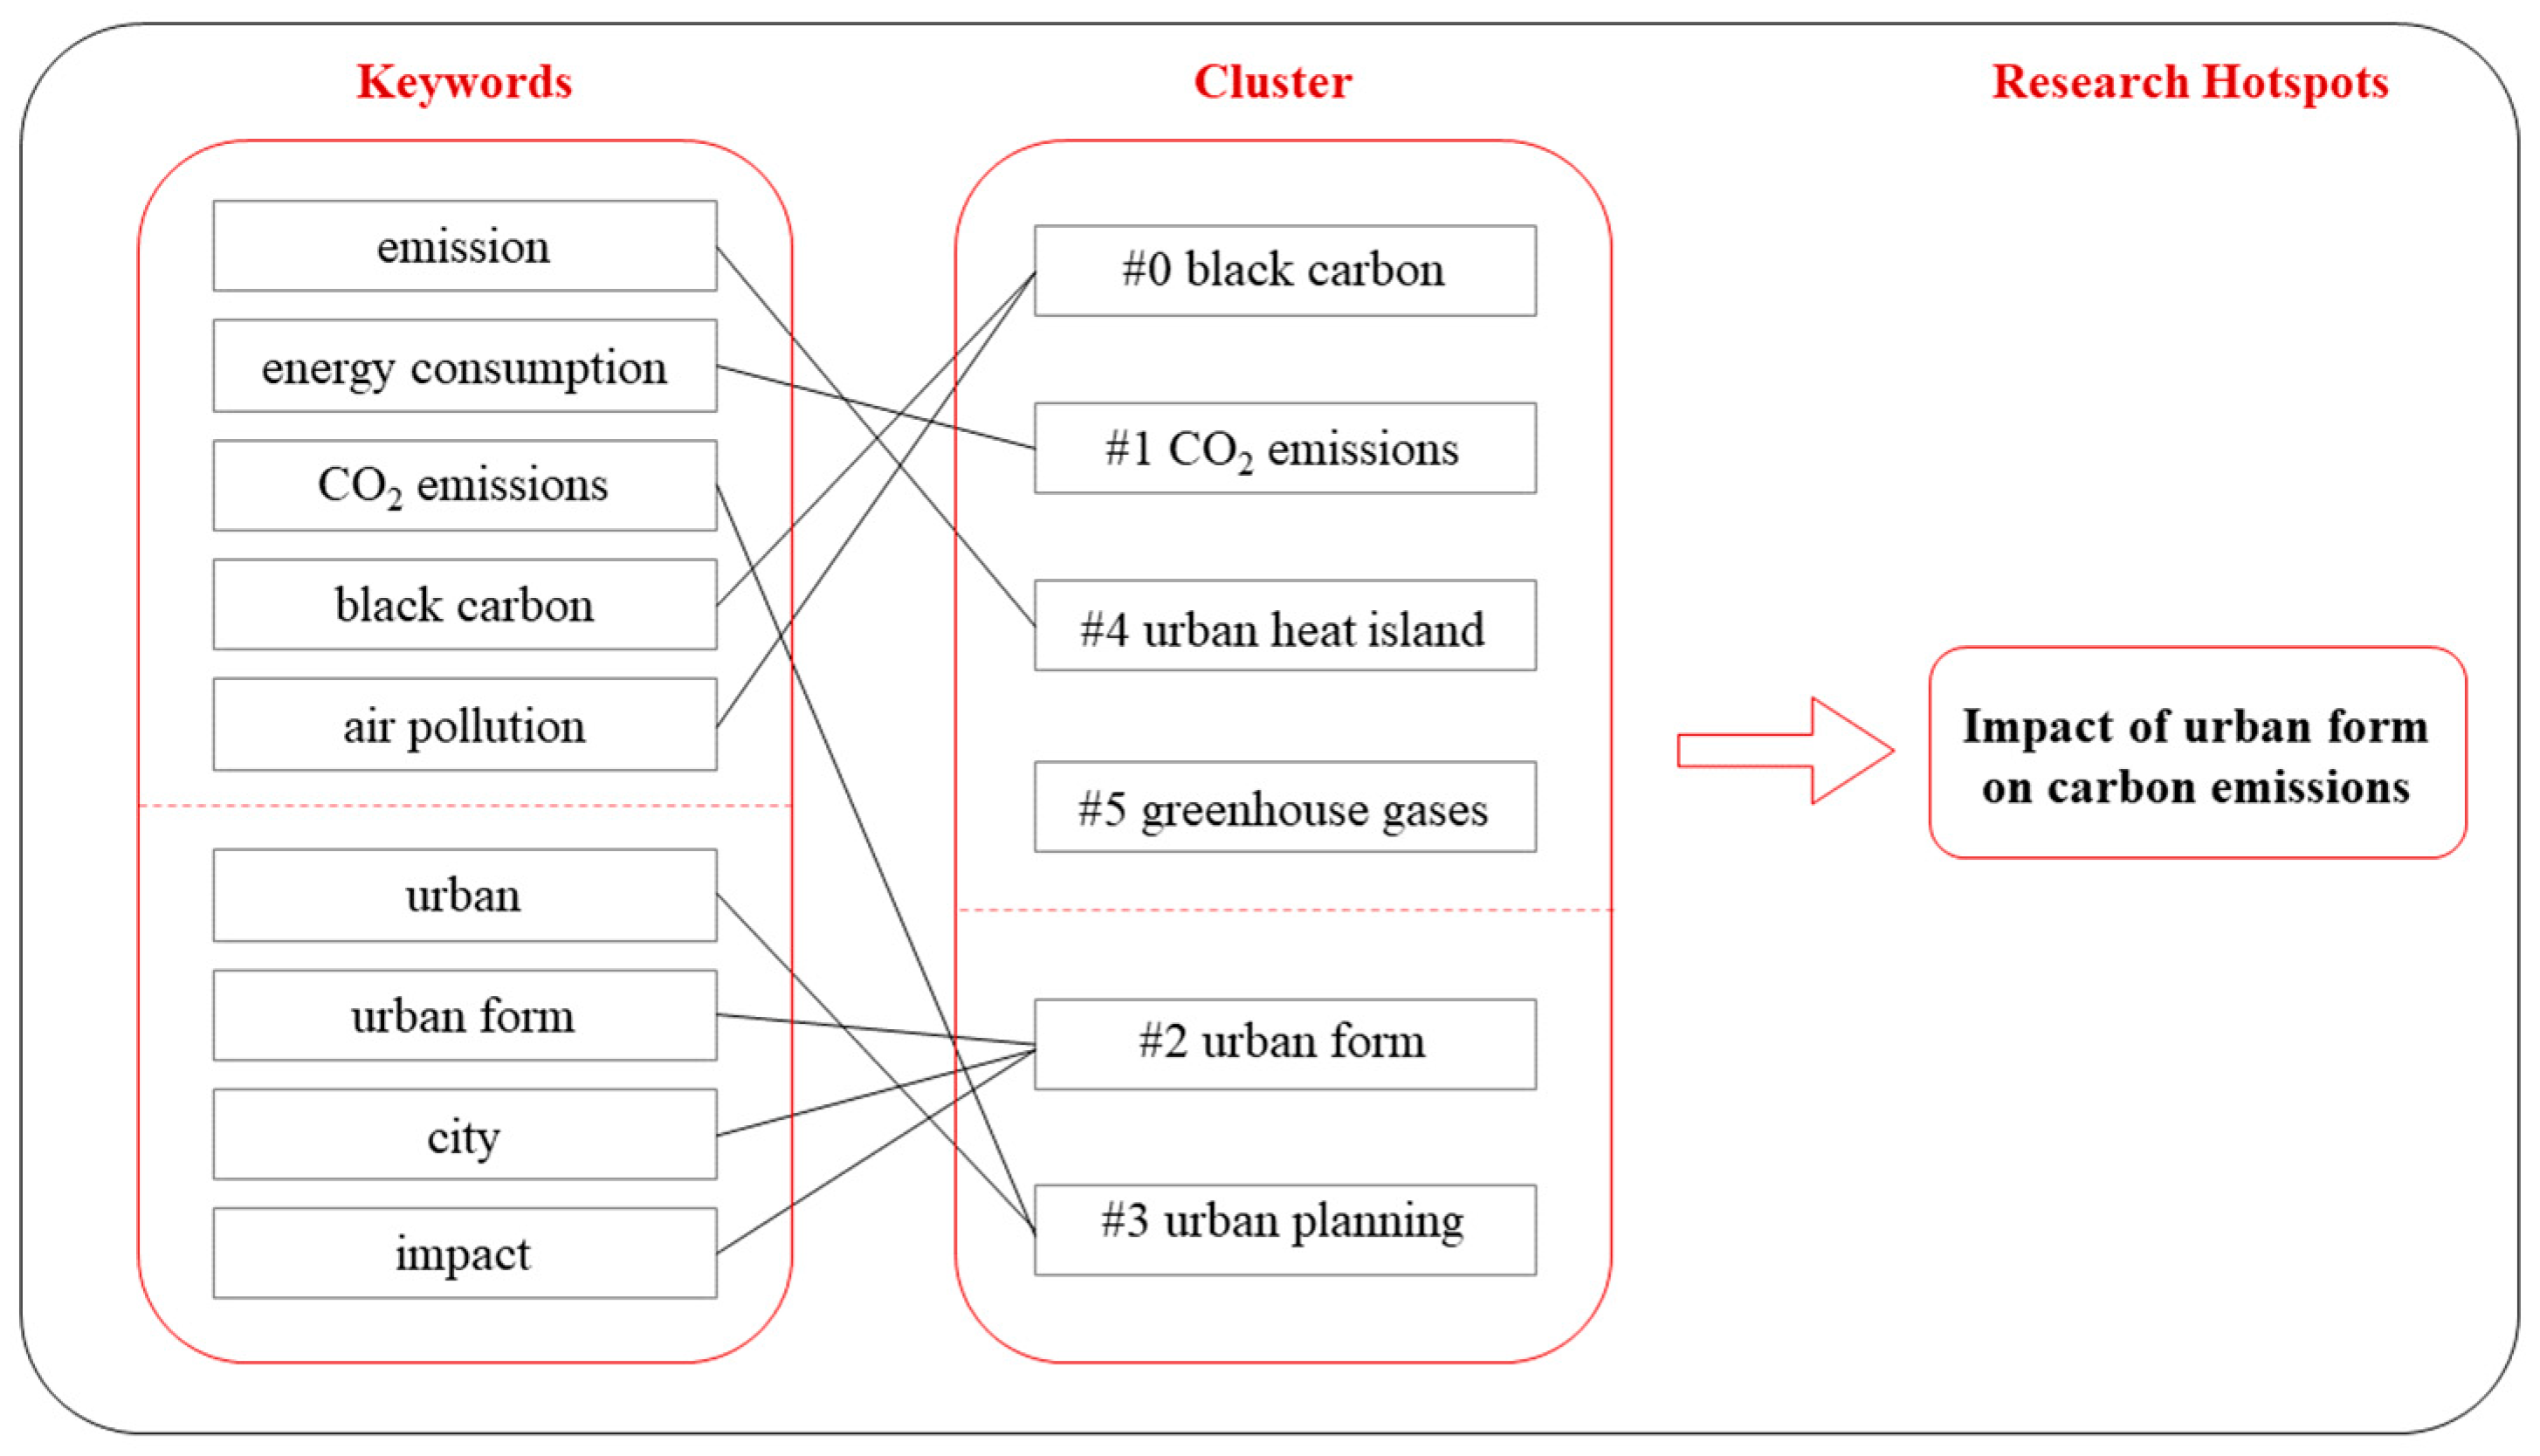
Table 5 shows that six major keyword clusters were generated, including #0 black carbon, #1 CO
2 emissions, #2 urban form, and so on.
To study the research topics of the clusters, it is necessary to examine both the cluster name and its primary keywords. Cluster #0 (black carbon) is an early and autonomous study topic, including keywords such as aerosol, air quality, and air pollutants. Black carbon is a carbonaceous material that is released into the atmosphere as a result of burning fuels, which may impact urban population health and visibility [
28]. In this topic, the research focuses on the measurement of environmental pollutants, formation processes, and treatment approaches. Additionally, other research hotspots have significant overlap and associations. Cluster #1 (CO
2 emissions) and Cluster #5 (greenhouse gas) include energy consumption, carbon, carbon footprint, and other keywords. This research topic covers the concept of carbon emissions, measurement methods, and influencing factors. Cluster #2 (urban form) and Cluster #3 (urban planning) are topics about city construction, including keywords like city, impact, model, land use, transport, and economic growth. This topic focuses on indicators of urban form, quantitative approaches, analytical models, and their effects on the environment.
3.5. Analysis of Research Trends
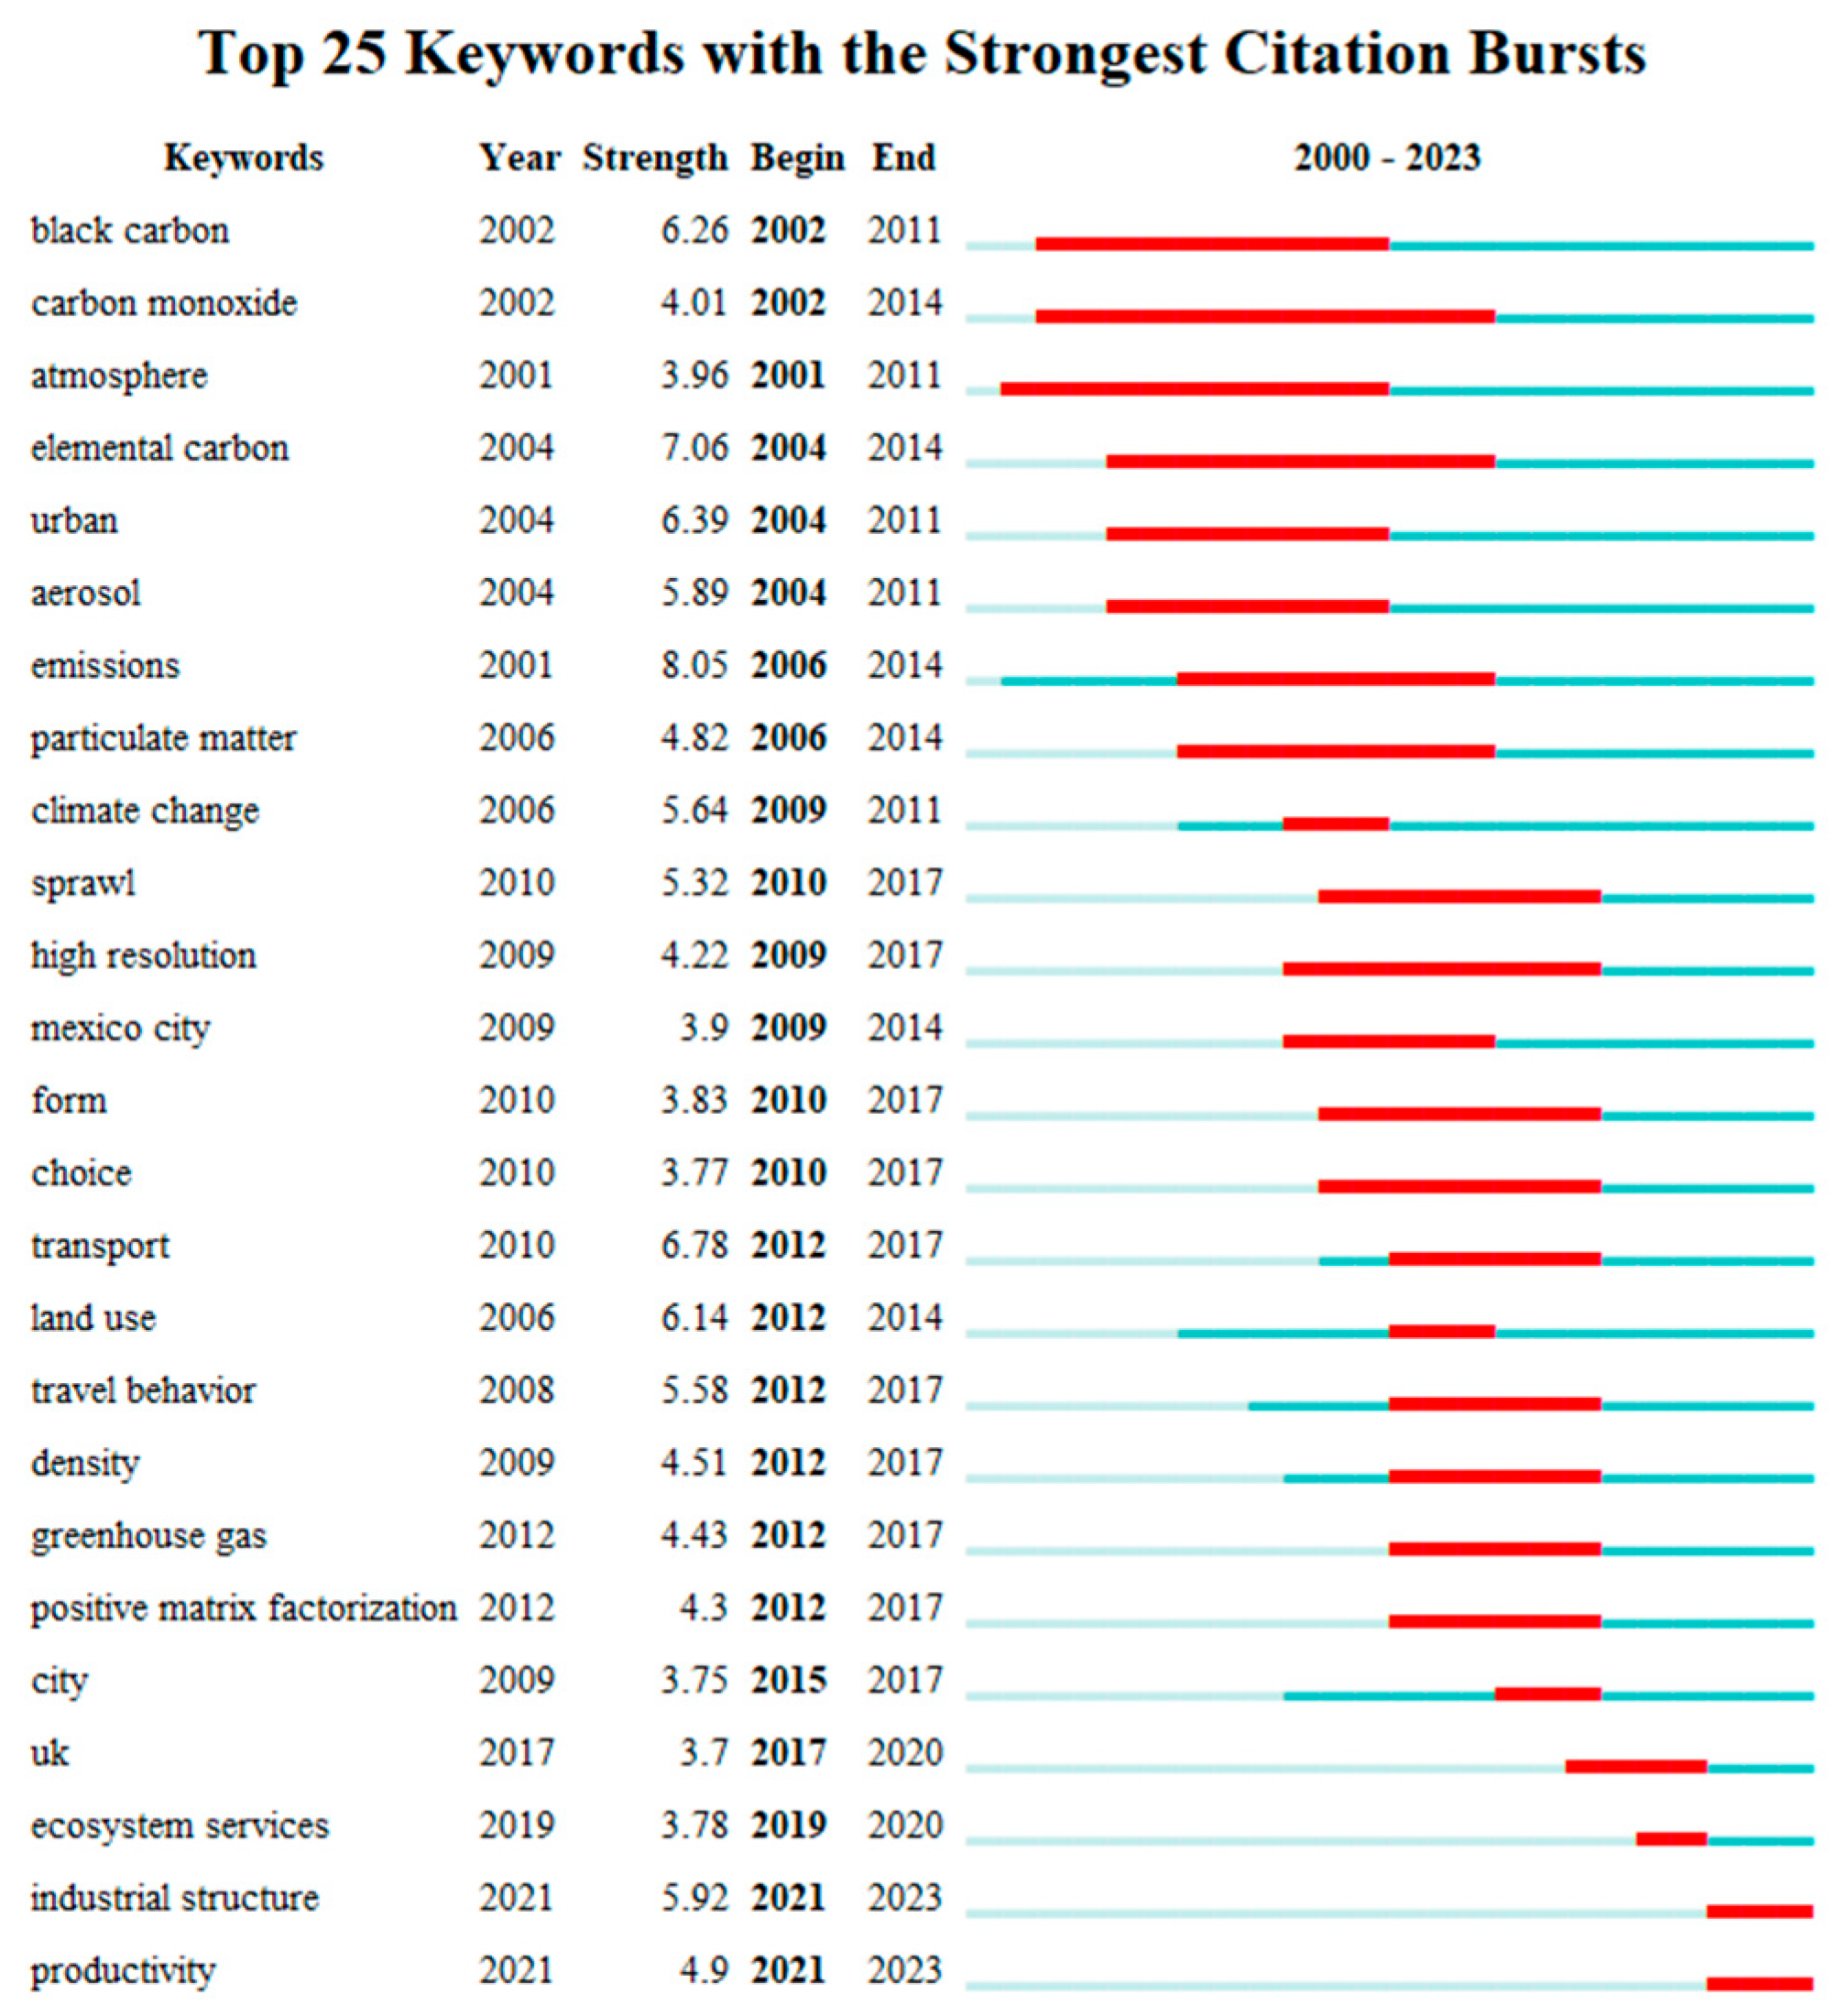
The keyword burst analysis reveals the attention and life cycle of various keywords through time, showing changes and trends in scientific research topics.
Figure 8 illustrates the initial usage and duration of each keyword. The blue lines show the duration of the entire research period, with the start of the dark blue lines indicating the emergence of the keyword. The red lines show the duration of the citation burst [
29]. Additionally, the term, “strength”, refers to burst strength, which identifies research topics that have experienced an abrupt rise in activity or interest. This may indicate significant breakthroughs [
30]. With a strength of more than 6, the keywords that have appeared in this field include emission, elemental carbon, transport, urban, and land use, showing that these topics have been extensively researched in the field for quite some time.
Overall, the development of research hotspots can be roughly divided into three stages: research on the fundamental characteristics of carbon emissions, research on the relationship between urban form and carbon emissions, and the development of a framework for studying the variables that influence carbon emissions. (1) From 2000 to 2009, the primary focus was on studying carbon elements and carbon emissions, with an emphasis on the autocorrelation characteristics of carbon emissions in spatial distribution and their impact on the atmospheric environment. This research involved multiple disciplinary fields, including the environment, atmosphere, and urban planning. (2) Between 2010 and 2020, numerous study findings were generated, mostly exploring the relationship between urban form and carbon emissions. The specific components include multi-scale investigations, key influencer weighting studies, direct and indirect pathway studies, and other quantitative studies that involve a variety of influencing factors such as urban form, transportation, choice, travel behavior, land use, and density. (3) After 2021, the primary emphasis will be on developing research frameworks and systems. Keywords such as industrial structure and productivity are prominent at this stage, indicating that future research will focus on developing an integrated framework that encompasses the various factors influencing carbon emissions.
In general, research on the relationship between urban form and carbon emissions has proliferated in recent years, demonstrating that low-carbon, sustainable urban form is gaining attention globally and that Chinese and international researchers are collaborating to become significant contributors in this field. Regarding research hotspots, the main topics of current research focus on exploring how urban form affects carbon emissions (
Figure 9), particularly in terms of the significance of each influencing factor, the pathways of impact, and the establishment of a research framework system. The scope of the study is broad, encompassing a variety of urban form indicators and carbon emissions at both macro and meso–micro scales. However, the results of the research need further improvement, as it is still in the exploratory stage.
Through
Section 3, we have developed a basic understanding of the broad overview of the field. However, bibliometric analysis cannot adequately explain the main research difficulties. Therefore, a more in-depth analytical discussion of the literature review is provided afterwards. It is important to note that we cannot analyze the essential components of carbon emissions until we have clarified their composition, and we cannot determine the impact of urban form without first understanding how it is measured. As a result, the latter half of the paper first describes the components and measurement of carbon emissions (
Section 4), and then it addresses the research goal of investigating the relationship between urban form and carbon emissions (
Section 5).
4. Carbon Emissions and Measurement
This section first describes the basic concepts and measurement boundaries associated with carbon emissions. Second, it covers the commonly used methods for measuring carbon emissions, including their application, advantages, and drawbacks. Finally, this section discusses typical methodologies and data sources for calculating urban carbon emissions from the perspective of urban form studies, considering various research scales and carbon sources.
4.1. Carbon Emission Related Concepts
Carbon emissions, also known as carbon dioxide emissions or greenhouse gas emissions, are the release of carbon dioxide from carbon-based sources into the atmosphere. As carbon dioxide accumulates in the atmosphere, the concentration of greenhouse gases rises, which disrupts the initial heat balance and causes global warming. Urban carbon emissions are the carbon dioxide emissions generated by the energy consumption of industries, transportation, housing, and other related elements in urban areas.
Urban carbon emissions can be categorized in two general ways: by sector of the national economy for the purposes of national economic development statistics, or by object of production and consumption for the purposes of statistics on the urban production-consumption structure. (1) According to the sectoral classification, the five major sources of carbon emissions are energy, industry, building construction, transportation, and agriculture. Carbon emissions from building construction are generated during five stages: production, transportation, construction, usage and maintenance, demolition, and waste disposal. Carbon emissions from transportation are caused by the use of fossil fuels in national aviation, road and rail transportation, shipping, navigation, road construction, and vehicle manufacturing. (2) From a production–consumption perspective, carbon emissions can be divided into emissions from the urban industrial production sector and emissions from urban residential end-use. Studies show that the share of energy consumption in household activities is growing rapidly, and household consumption has a large potential to reduce emissions. Therefore, reducing household carbon emissions has become an important target for carbon reduction efforts. This includes, in particular, carbon emissions generated in the daily lives of urban residents through activities such as using gas, electricity, lighting, and other equipment, traveling, and consumption behavior.
Overall, from an urban planning standpoint, residential household carbon emissions are most closely related to urban form and are the main focus of research. This is because carbon emissions from the production sector are generally related to production technologies and materials, while residential consumption is related to energy consumption in buildings and transportation.
Studies assess carbon emissions in various ways and often categorize them into two types: total and average. The total consists of total urban carbon emissions (million metric tons) [
31], direct CO
2 emissions of urban residents [
32], total carbon emissions of community residents (kg) [
33], total carbon emissions of households (kg/year) [
34], etc.; the average consists of annual carbon emissions per capita in the city (tons/person) [
35], carbon emissions from travel per capita (kg, kg/km) [
36], average per-capita family lifetime transportation CO
2 emissions (metric tons) [
37], etc.
4.2. General Methodology for Measuring Carbon Emissions
Carbon emission measurement is the process of calculating carbon emissions using data from the economy, energy consumption, and other relevant sources. The Life Cycle Approach, the Input–Output Analysis, and the Emission Factor Approach are some of the frequently used methods for calculating carbon emissions.
Table 6 lists the calculation equations, goals, benefits, and drawbacks of different approaches.
The IPCC Carbon Emission-Factor Approach is the most popular and widely acknowledged technique for calculating carbon emissions across various sectors. To calculate the carbon emissions, the energy consumption data is multiplied by the corresponding carbon emission factor. The emission factors refer to the 2006 IPCC Guidelines for National Greenhouse Gas Inventories published by the United Nations Intergovernmental Panel on Climate Change (IPCC), which offer a detailed methodology for calculating greenhouse gas emissions to ascertain the environmental impact of each greenhouse gas. Numerous nations have developed a set of relevant coefficient specifications adapted to their own national conditions. As a result, due to geographical variations, the carbon emission parameters may need to be revised, and the findings of the study may differ [
38]. The calculation formula is as follows:
where Em is GHG emissions, AD is energy data, and EF is emission factor.
- 2.
Life Cycle Approach (LCA).
The Life Cycle Approach, also known as the Process Analysis Approach, calculates the total cost of a product from “beginning to end”, which primarily involves the carbon emissions produced from its production to consumption. The approach typically relies on product life cycle inventories and “business-consumption” flowcharts to separate product input and output data [
39]. The first step is to construct a product flow diagram and define the boundaries. Then, collect the data and calculate the formula as follows:
where E is the carbon emissions of the product, Qi is the i substance or activity data (mass/volume/km/kWh), and Ci is the carbon emission factor (CO
2 eq/unit).
As a result, it is mostly suitable for analyzing systems with distinct boundaries or products with clearly defined manufacturing processes. The calculation procedure is more detailed and is frequently used in carbon emissions calculations at the micro-level, such as the carbon footprint calculator. This method, however, is intended to quantify carbon emissions in the context of environmental management of products or services and is not suitable for calculating carbon emissions of urban residents from the perspective of urban form.
- 3.
Input–Output Analysis (IOA).
The input–output approach, which is based on the principle of carbon mass conservation and uses economic input–output tables to calculate carbon emissions, can show the relationship between inputs and outputs and is frequently used to track carbon emissions within a specific sector of the economy or between sectors [
40]. The calculation formula is as follows:
where G input is the raw material input, G output is the total amount of product obtained, and G loss is the total amount of process loss.
The extended Economic Input–Output Life Cycle Approach (EIO-LCA) is frequently used in existing studies to estimate the carbon emissions from companies or households from a life-cycle perspective. This approach is a beneficial combination of the advantages of the two methods. Hui Wu used the input–output approach to establish a framework for evaluating relative carbon emissions. The study revealed that urban compactness can improve the efficiency of urban carbon emissions [
41]. The input-output approach, frequently used in macroscopic calculations of urban carbon emissions, can better account for direct and indirect carbon emissions compared to the first two methods, particularly carbon emissions from consumption activities (i.e., indirect carbon emissions) [
42].
- 4.
Actual measurement Approach.
The actual measurement approach for carbon emissions is based on actual data collected in the field. This method relies on a monitoring system as the data source, but it is less commonly used due to the difficulty and high cost of access [
43]. The calculation formula is as follows:
where G is the emission of a gas, Q is the medium flow rate, C is the concentration of a gas in the medium, and K is the unit conversion factor.
4.3. Measurement of Carbon Emissions Related to Urban Form
This section provides an overview of the characteristics, approaches, and data sources for estimating carbon emissions from an urban form viewpoint (
Table 7). The aim is to enhance understanding of the approach used to measure carbon emissions in the field of urban form.
4.3.1. Building Carbon Emissions
Carbon emissions from buildings include both embodied emissions and operational emissions. Embodied emissions, also known as implicit emissions from buildings, include carbon emissions from the production, transport, construction, and demolition of buildings. Operational emissions, on the other hand, include carbon emissions from direct energy consumption, such as indoor cooking, lighting, electrical appliances, and heating. In the field of urban form, most studies have used the Emission-Factor Approach to measure the operational carbon emissions of buildings.
According to different research scales and data sources, the calculation of carbon emissions from building operations can be categorized into two dimensions: macro building groups and micro building units. Macro-building carbon emission measurement for buildings is generally based on economic and construction yearbook statistics to calculate the total carbon emissions of buildings within a certain region. Micro-building carbon emissions are generally calculated through household surveys to collect data on residents’ daily consumption of electricity, gas, and other energy. Additionally, the simulation approach is frequently used to obtain the energy consumption and carbon emissions required for building operations from a microscopic perspective. This can be achieved through direct thermal engineering simulation or by incorporating microclimate into energy consumption coupling simulation [
44].
4.3.2. Transport Carbon Emissions
Carbon emissions from transport are typically categorized into two groups: travel carbon emissions, which include energy consumption from household travel and carbon emissions from overall transportation; and other carbon emissions, which include carbon emissions from road construction, vehicle production technology, and the operation of transportation facilities. In the field of urban form, the Emission-Factor Approach is commonly employed to calculate travel carbon emissions, while other carbon emissions are typically only calculated within the transportation sector.
Depending on the type of data, there are two methods to calculate carbon emissions from travel based on energy consumption and distance, respectively. Travel energy consumption includes fuel and electricity used for travel, which can be obtained from national fuel consumption data or household travel surveys. Travel distance is mainly obtained from travel survey questionnaires. In addition, the simulation method can also be used to calculate and predict household travel energy consumption, generally from a micro-perspective. This method involves simulating the spatial and temporal trajectories of household travel to forecast changes in travel carbon emissions [
45].
4.3.3. Household Carbon Emissions
Household carbon emissions generally refer to the carbon emissions generated by the daily consumption of residents, which include direct carbon emissions and indirect (implied) carbon emissions. Direct carbon emissions refer to the carbon emissions from the consumption of energy (such as gas, electricity, fuel, etc.) during the daily activities and travel of residents. Indirect carbon emissions, on the other hand, refer to the hidden carbon emissions from the consumption of non-energy goods and services (such as clothing, food, communication, education, entertainment, etc.).
In addition, the indirect carbon emissions of residential life contribute to a large proportion of carbon emissions. To address this issue, researchers have developed the Consumer Lifestyle Approach (CLA), which combines both the Emission-Factor Approach and the Input-Output Analysis (IOA) [
46]. The CLA is a consumption-oriented approach that provides a comprehensive framework for calculating carbon emissions from residential consumption [
47]. The practical applicability of CLA approaches in this field, however, is limited due to the weak correlation between indirect carbon emissions and urban form, the difficulty in obtaining data, and the uncertainty within the calculation boundaries. Therefore, the Emission-Factor Approach, which calculates direct carbon emissions, continues to be the primary measurement method in the field of urban form.
4.3.4. Summary
In the field of urban form and carbon emissions, the Emission-Factor Approach (EFA) is mainly used to calculate carbon emissions, while some macro-studies also use the input-output method. Depending on the scale of the study, data sources for calculating carbon emissions can be categorized as “top-down” macro data or “bottom-up” micro data. Macro data generally refers to statistical energy data from national and regional governments and related organizations, including aggregate or average cross-sectional data as well as time series data, which may be incomplete, not publicly available, and difficult to use. Micro data are generally based on energy consumption data from household or community surveys or questionnaires. The advantage is that they can provide accurate information, such as residential consumption by family, household socio-economic characteristics, and more. The disadvantage is that data collection is more difficult and sample selection is more influential.
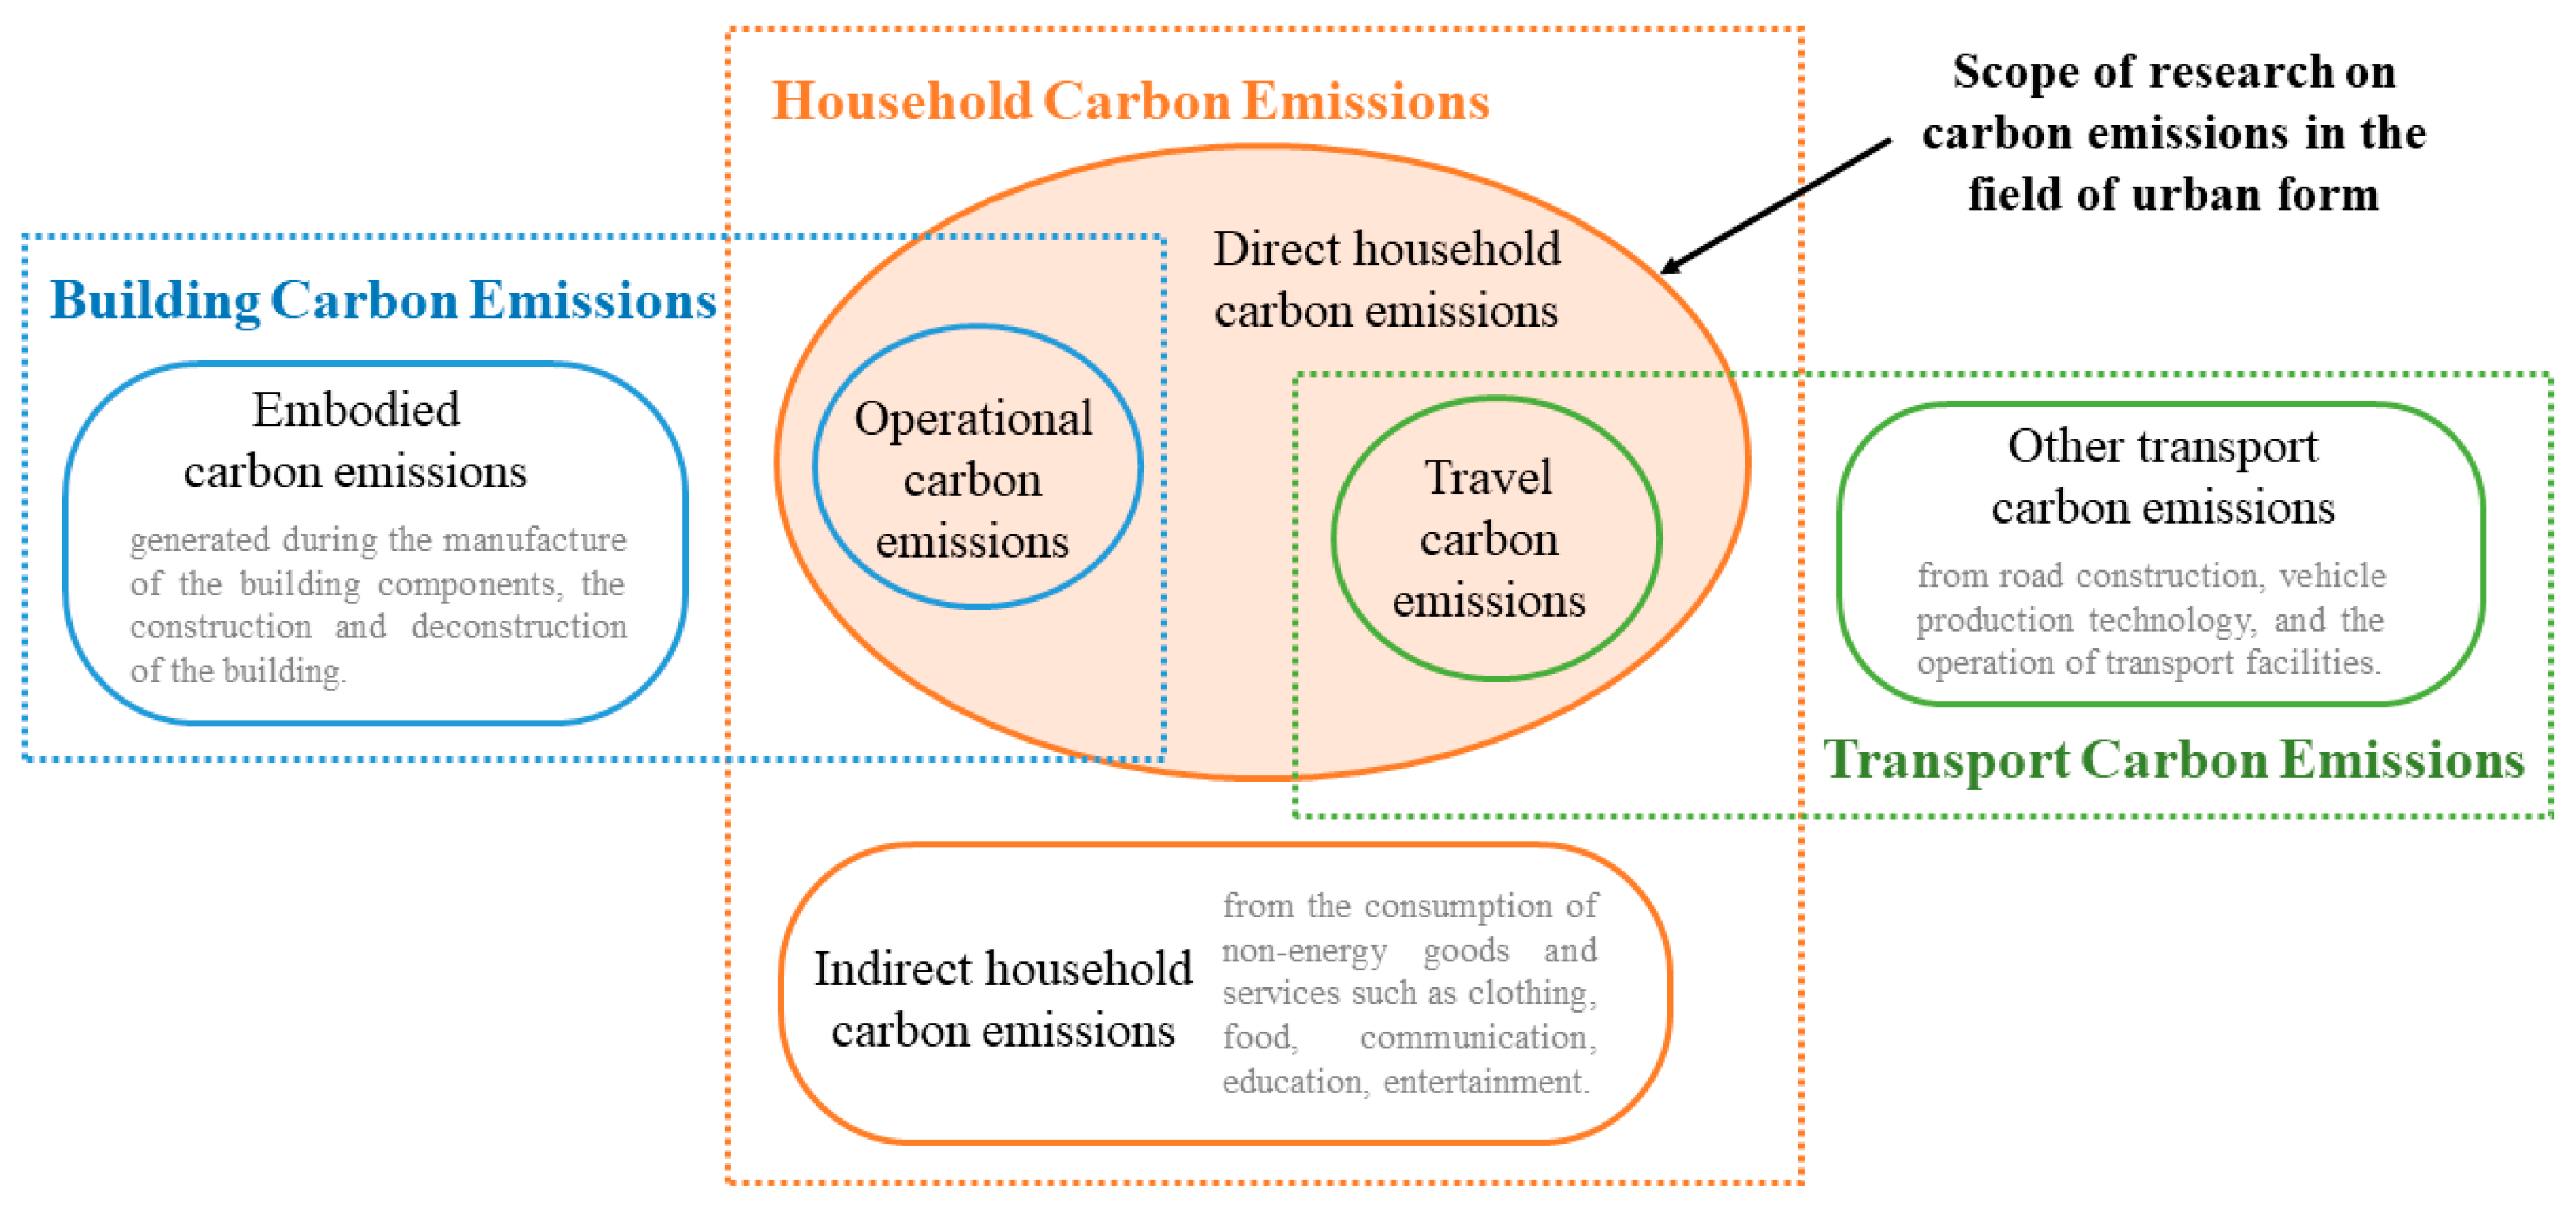
In urban planning studies, related carbon emissions can typically be categorized into three groups: building emissions, transportation emissions, and household emissions. Specifically, carbon emissions from buildings and transportation are based on national sectoral classifications and are related to urban development; household carbon emissions come from an economic standpoint and are closely tied to urban consumption. The relationship between the three categories is depicted in
Figure 10. It can be seen that household emissions include some emissions from buildings and transportation as well. In this basic classification of carbon emissions, the most important research objects related to urban form are direct household carbon emissions, building operational carbon emissions, and direct transport carbon emissions. These carbon emissions are caused by urban residents’ direct energy use for living and transportation, which is influenced by the urban spatial form.
In conclusion, it is clear that the main contribution of this section is the separation of carbon emissions related to urban form from the conventional three classifications. Additionally, it provides an overview of research on common measurement techniques and data sources. This establishes the foundation and framework for analyzing the relationship between urban form and carbon emissions, as well as for understanding the role that urban form plays in the larger national economic system in terms of carbon emissions.
5. The Correlation between Urban Form and Carbon Emissions
This section first establishes a multi-scale urban form indicator system, clarifies the operational objectives of urban material space that affect carbon emissions, and then compares the latest developments in research on the relationship between urban form and carbon emissions at the macro and meso–micro scales, respectively. Secondly, it summarizes the existing research methods and presents the key factors and pathways of urban form on carbon emissions. Finally, it provides a framework for researching the impact of low-carbon urban planning on carbon emissions.
5.1. Urban Form Indicators Related to Carbon Emissions
The concept of urban form has received significant attention in the fields of architecture, urban planning, and geography. Different scholars define the term differently, with European countries using the term “urban form” (UF) and the US preferring the term “urban morphology” (UM). Bourne (1971) provides a more classical definition of urban form as the combination of location, topography, and internal morphology [
48]. Conzen defines urban morphology as the study of the built environment and the changes associated with urban structures, land use, construction, open spaces, and road patterns [
49]. According to Silva, the arrangement, appearance, and use of buildings are the three main components that determine urban form [
50].
In a broad sense, urban form refers to the spatial structure and form of an urban layout, including the road network, site arrangement, landscaping, and the spatial organization and appearance of buildings within a city. With sustainable development, the study of urban form is evolving into a multidisciplinary field that is crucial for urban vitality, energy consumption, and environmental sustainability [
51,
52].
Regarding urban indicators and their quantitative methodologies, modern research can provide scientific descriptions of urban form by utilizing appropriate indices based on scale division. The study of urban form can generally be divided into two scales: macro-scale and meso–micro-scale. The macroscopic scale generally encompasses the entire city or region, focusing on urban scale, urban structure, land use, urban density, urban road network, and other related aspects. The microscopic scale typically centers around the neighborhood as the fundamental unit of the city, focusing on neighborhood types, architectural texture, service facilities, and other areas of research.
In this section, we analyze the research objects and results at both the macroscopic city-regional scale and the micro-neighborhood community scale. We also provide a summary of the urban form indicators and their measurement methods in the multi-scale correlation studies (
Table 8).
5.1.1. Macro-Scale Studies
Macroscopic studies focus on countries, regions, cities, and provinces. Their morphometric indicators are relatively consistent. Most studies have used urban size, urban structure, and urban spatial pattern as classifications, with the urban landscape pattern index being an important indicator [
53], which is a set of quantitative indicators that express the geometric characteristics of the urban landscape, describing urban sprawl, compactness, and complexity. Landsat TM scenes are used for general urban landscape pattern data, and remote sensing images are used for different land use classifications and locations.
Macro-scale research on urban form and carbon emissions started early and has obtained a wealth of findings, which can be broadly divided into two research phases. (1) Phase 1: Confirming the correlation between urban form and carbon emissions. Early studies examined whether urban form had an impact on carbon emissions. The majority of studies analyzed the socio-economic, population density, and urban form’s impact on carbon emissions, finding that factors such as urban size and structure, urban density, land use, and transport systems involved in urban form are important factors influencing carbon emissions [
54,
55,
56,
57]. It is important to note that in urban planning and design, factors such as urban structure, land use, transportation, and road network design are highly operational and controllable, meaning they can be planned to directly reduce urban emissions. This emphasizes the practical value of urban form as a significant influencing factor. (2) Phase 2: Identifying the urban form factors that affect carbon emissions. In recent years, research has focused on the correlation between urban structure, urban expansion, urban compactness, and carbon emissions. Most of the research findings indicate that compact cities are lower-carbon urban forms, and good compactness and continuity can help reduce carbon emissions. Conversely, urban sprawl and fragmentation can negatively affect carbon emission efficiency [
58,
59,
60]. According to Wang Shaojian’s investigation into the impact of urban form on economic and social carbon efficiency in the Pearl River Delta region of China, compact cities can increase carbon efficiency, while urban sprawl and disorder can decrease it [
61]. Some studies have also examined the pathways and discovered that each compactness indicator primarily influences carbon emissions through the building area and transportation energy use [
62,
63].
Research on urban form and carbon emissions at the macroscale has the following characteristics: (1) There is already an abundance of research results at the macroscale that have formed a relatively unified understanding. (2) The focus of research has shifted from individual cities to urban agglomerations and regions, exploring the influence of inter-city relationships on carbon emissions. (3) Research data have evolved from cross-sectional comparisons among cities to simultaneous cross-sectional and temporal studies, exploring the dynamic changes between urban form and carbon emissions. (4) Urban morphological factors have transitioned from a single dimension to an integrated one. As the concept of urban compactness encompasses three dimensions—urban population, economy, and space—it includes not only geometric and morphological indicators such as urban size, structure, and form but also integrated indicators such as population density and level of economic development. However, there are still gaps in this area of research. At present, macro-scale research is still dominated by studies of developed cities, such as the Yangtze River Delta and Pearl River Delta regions in China [
64], and there is a lack of empirical research on developing small and medium-sized cities. In the future, it will be important to strengthen comparative empirical research on the factors that influence carbon emissions in cities at different stages of development and urbanization.
5.1.2. Meso–Micro-Scale Studies
Meso–micro research includes different types of urban neighborhoods and residential areas, which have a wider range of morphological measuring indicators. With the development of technology, it is now possible to accurately describe the morphology of neighborhoods using GIS, high-resolution remote sensing images, and other technologies. Depending on the research objective, there are significant differences in the measurement of neighborhood form, and currently, there is no standardized index system in place. Indicators of neighborhood form can, however, generally be divided into three categories: density, mix, and street design. The type of housing can also serve as an indicator of residential form. In addition, when studying carbon emissions from household consumption, it is important to consider the influence of social characteristics, economic level, and personal preferences of residents, which can collectively be referred to as household characteristic indicators.
Compared to the macro-scale, research at the meso–micro-scale started later and has produced fewer results. However, some studies also indicate that neighborhood form has a significant impact on carbon emissions. Shudi Zuo classified urban form indicators into three categories: external form (macro), internal characteristics (meso–micro), and development intensity, and conducted a study on carbon emissions in several urban centers in China. The results show that external characteristics of urban form influenced 45% of urban carbon emissions, followed by the positive influence of internal characteristic indicators (such as density and functional mix). These findings highlight the complex impact of urban form on carbon emissions [
65], confirming the importance of the meso–micro-scale study. There are two categories of meso–micro investigations: (1) Identification of neighborhood form factors that influence carbon emissions Most researchers agree that a reasonable floor area ratio, building and street density, a higher mix of functions and services, and good accessibility to bus stops and the public transport network will have a positive impact on neighborhood energy consumption and carbon emissions. (2) Analysis of the influence and pathways of intermediate factors With the advancement of meso–micro-scale studies, researchers have uncovered intricate connections between neighborhood form and carbon emissions, with urban heat island effect, neighborhood type, social characteristics of residents, and travel behavior serving as crucial intermediary factors [
66]. Thus, neighborhood form presents both direct and indirect mechanisms for reducing carbon emissions.
In general, research on the relationship between urban form and carbon emissions at the meso–microscale has the following characteristics: (1) there are relatively few results so far, and the studies cover a wide range of urban form indicators, resulting in a lack of consensus; (2) the impact of urban form on carbon emissions is more complex at the meso–micro scales, with intermediate factors such as urban heat islands and travel behavior playing a role; (3) selecting an appropriate analysis method to study the intensity of the impact of neighborhood morphology on carbon emissions has become a challenge in research, as meso–micro studies are often more complex than macro studies due to the influence of factors such as socio-economic characteristics and personal preferences. In fact, as urbanization progresses, urban development is increasingly focused on the meso–micro scale, with urban communities becoming the standard unit of construction. On the one hand, urban neighborhoods serve as an appropriate scale for the flow of energy and materials. On the other hand, neighborhoods also serve as the fundamental units of residents’ daily lives and travel. Therefore, conducting research at the meso–microscale is of the utmost importance in enhancing residents’ quality of life and minimizing energy consumption in cities.
5.2. Methodological Approach to Investigate the Impact of Urban Form on Carbon Emissions
This section summarizes the methodology and main findings of studies on the relationship between urban form and carbon emissions. Specifically, it includes research findings on urban form and carbon emissions from buildings, transportation, and household consumption, respectively. Existing research has found that urban form, particularly the spatial pattern of neighborhoods at the meso–micro scale, can indirectly affect urban carbon emissions through certain intermediary factors. Therefore, the analysis in this section contributes to summarizing the framework for low-carbon urban planning, which also helps in mapping the complex pathways through which urban form affects carbon emissions.
5.2.1. Research Methods
The main research methods include multiple linear regression analysis, ordinary least squares (OLS), correlation analysis, and STIRPAT model [
67] analysis. Geographically weighted regression (GWR), cluster analysis, and spatial autocorrelation analysis are commonly used to analyze the spatial characteristics of carbon emissions. Among these, the STRIRPAT model analysis is a commonly used method in the field of carbon emission influencing factors. However, due to its comprehensive and comparative nature, which includes economic and social factors, it cannot analyze the detailed influence pathway of each factor. As a result, it is less frequently employed in the study of urban form.
Many novel analytical methods have been developed in recent years as a result of research advancements, including structural equation models (SEM), partial least squares models (PLS) [
68], and decision tree models. Among these methods, structural equation models are the most widely used. The benefit of this model is that it does not assume any sample distribution and can analyze the relationship between various independent variables and dependent variables, as well as compare the influence of intermediate factors [
69]. This makes it possible to analyze the weight and path of influence of urban form factors on carbon emissions more accurately. Fajle Rabbi Ashik discovered through SEM modeling that household income and the built environment are the primary indicators of car ownership, which directly impact commuting carbon emissions [
70].
In addition, other researchers have found that the impact of urban form on carbon emissions is not solely linear, and there are certain thresholds where non-linear adjustments occur. Feng Dong used differential generalized moment models (Diff-GMM) and systematic generalized moment models (Sys-GMM) to examine the impact of urbanization on urban carbon emissions on a macroscopic level. He found that there is an inverted U-curve relationship between land urbanization and carbon emissions [
71]. At the meso–micro level, Xinyi Wu used a gradient boosting decision tree (GBDT) model to examine the correlation between the built environment and transport carbon emissions, finding that the distance to the nearest bus stop, the density of employment, and land use diversity are not simply linearly related to carbon emissions. Instead, the findings illustrated the presence of a threshold effect in the built environment indicators [
72]. It can be seen that future research should also focus on exploring additional potential connections in the pathway between urban form and carbon emissions.
5.2.2. Key Impact Factors and Pathways
Existing studies on the impact of urban form on building carbon emissions have mostly been conducted from a meso–micro perspective, considering the energy consumption and carbon emissions of individual buildings, as well as buildings in settlements and neighborhoods. Factors such as floor area ratio, land use mix, street density, building type, and green space ratio are generally considered to be the primary environmental factors that influence building carbon emissions [
73,
74]. Additionally, economic and social factors, such as residential population density, household characteristics, and living space, also play a significant role. Research has also noted urban heat islands and different housing types as significant intermediary factors [
75]. Ewing Rong is regarded as one of the pioneers in assessing the relationship between urban form and energy consumption, arguing that urban form affects building energy consumption through its influence on electricity transmission losses, housing types, and urban heat islands. This argument is supported by correlation modeling analysis [
76]. Ke Liu also found significant correlations between building density, open space ratio, average perimeter area ratio, and building energy intensity in the neighborhood using software simulation methods coupled with urban microclimate indicators [
77].
- 2.
Urban form and transport carbon emissions.
Compared to studies on building carbon emissions, research on the characteristics and influencing factors of transport carbon emissions began earlier and is more extensive. Land use mix, distance to employment centers, infrastructure level, and accessibility to transportation stations are generally considered important factors that influence transport carbon emissions [
78,
79,
80,
81]. Additionally, travel distance, travel mode, travel purpose, personal attributes [
82], and household vehicle ownership [
83,
84] are regarded as significant intermediate factors. The purpose of travel is generally divided into two categories: commuting and non-commuting trips. Ma Jing studied the impact of urban form on individual travel behavior and carbon emissions from both work and non-work trips. The research suggests that work-related trips have a larger variation than non-work trips across neighborhoods [
85]. Wenyue Yang found that social characteristics have a greater impact on carbon emissions from commuting, while the built environment has a greater influence on carbon emissions from leisure travel [
86].
Although existing studies have elucidated the mechanisms by which behavior affects carbon emissions, fewer studies have analyzed the combination of urban form, travel behavior, and transport carbon emissions. Liu Zhilin studied the relationship between urban form, residents’ behavior, and carbon emissions from travel. The study revealed that urban form, such as the distribution of facilities around settlements, has a significant impact on residents’ daily travel and urban transport carbon emissions [
87]. Sungwon Lee found that travel mileage and travel behavior were important intermediate factors when studying carbon emissions from residential travel [
88]. In general, these studies have primarily focused on environmental behavior, specifically examining ‘resident behavior’ as the main explanatory variable, and have explored the relationship between behavior and carbon emissions. There has been limited research on the influence of urban form factors on resident behavior, which indirectly impacts transport carbon emissions. Therefore, further investigation is needed to understand the relationship and mechanisms between these three factors.
- 3.
Urban form and household carbon emissions.
Research on household carbon emissions focuses on two aspects: the spatial and temporal characteristics of carbon emissions [
89,
90], and the influencing factors. Research on the spatial characteristics of carbon emissions is dominated by macro-city and regional studies, which frequently include spatial autocorrelation analysis and spatial regression analysis [
91,
92]. In studies on the influencing factors, researchers generally consider urban compactness, complexity, centrality, land use, building density in residential areas, accessibility to peripheral facilities, accessibility to employment, household characteristics, and consumption behavior to have a significant impact [
93,
94,
95].
In addition, several studies also compare residential carbon emissions with travel-related carbon emissions and analyze the influencing factors separately. Gordon Mitchel used an “urban form-transport” interaction model to simulate building and transport carbon emissions in three cities in the UK in 2030. The study revealed that land use mainly affects transport carbon emissions, while building form has a greater impact on residential carbon emissions [
96]. Qunfeng Ji found, through field research, that building energy consumption in a Wuhan neighborhood is four times higher than transport energy [
97], which shows that carbon emissions from building operations are a major component of household carbon emissions, highlighting the importance of building design in urban form design.
6. Discussion and Directions for Future Study
Only by understanding the relationship between urban form and carbon emissions can we effectively implement low-carbon urban planning practices. As the field of urban planning has begun to explore the factors that impact carbon emissions, various international studies on low-carbon urban planning have been conducted. Over 20 years of research have led to a widespread consensus on the causes of carbon emissions. Researchers also recommend developing a thorough research framework to help decision-makers choose the most effective mitigation strategies [
98]. To establish a framework for low-carbon cities on a large scale, researchers have devised a three-layer framework for low-carbon cities (LCC), involving city carbon emission-related indicators, influencing factors, and implementation pathways [
99,
100]. Meanwhile, existing low-carbon urban design methodologies are being developed in two aspects: urban management and operation, and urban form planning [
101,
102]. In particular, urban management and operation encompass urban energy systems and consumption patterns, industrial development, building construction, and transportation modes. Urban form, on the other hand, pertains to the spatial and physical characteristics of the constituent cities, which directly impact the energy consumption of urban construction and urban carbon emissions. Therefore, under the current three-layer and two-aspect low-carbon city research framework, this paper focuses on the theoretical framework for urban form and carbon emissions, including the specific contents, methodologies, and pathways for enhancement and expansion.
- 2.
Carbon emission measurement approaches.
From the perspective of carbon emissions, existing research mainly focuses on carbon emissions from energy consumption, and there are many relevant calculation methods, with the Emission-Factor Approach being the most widely used. However, in general, there are still problems with unclear carbon emission calculation objects and boundaries, inappropriate calculation approaches, and incomplete data access due to the difficulty of obtaining data at meso–microscales, which makes it difficult to conduct research.
In the future, researchers can use new data access and research methodologies to address this gap. In terms of data gathering, the advancement of big data and big models allows for the supplementation and enhancement of existing research through the combination of multi-scale and multi-source data, including GPS location and network map data [
103]. In terms of carbon emission modeling, the accuracy of classical physical simulations can be increased [
104]. Meanwhile, new technological tools such as machine learning and artificial neural networks in artificial intelligence (AI) can also be used to support the optimization of urban emission reduction through forecasting and scenario simulation. These tools can compensate for existing data gaps and help to understand the complex relationship between urban form and carbon emissions [
105].
- 3.
Increased research focus towards meso–micro-scale research.
While there is a lot of macro-level urban research, there is still a lack of meso-level research on communities and neighborhoods. At the macro level, regulating economic and demographic factors to achieve the goal of reducing carbon emissions is not an immediate task but rather a long-term strategy and development direction. At the meso- and micro- levels, there are various factors that can be easily adjusted and improved through urban planning, urban design, and green building design to reduce carbon emissions. This means that the impact of reducing carbon emissions can be observed in the short term. Furthermore, neighborhoods, as the basic unit of residents’ activities, play a crucial role in low-carbon urban construction, which has a significant and wide-ranging impact on improving urban energy efficiency and promoting residents’ low-carbon lifestyles. It follows that future research must concentrate on low-carbon planning and neighborhood design, as meso–microscale research holds significant practical value and can be a beneficial complement to macroscale studies.
Furthermore, when examining energy efficiency and emissions reduction through the lens of urban form, it is important to consider non-geometric factors, such as household characteristics and residents’ preferences, in addition to primarily geometric factors. It is necessary to consider how these non-geometric aspects can be integrated with the geometric ones, for example, by assigning a weight to each parameter or by conducting additional independent research. This is a topic that requires further research.
- 4.
Urban form factors and their influencing mechanisms.
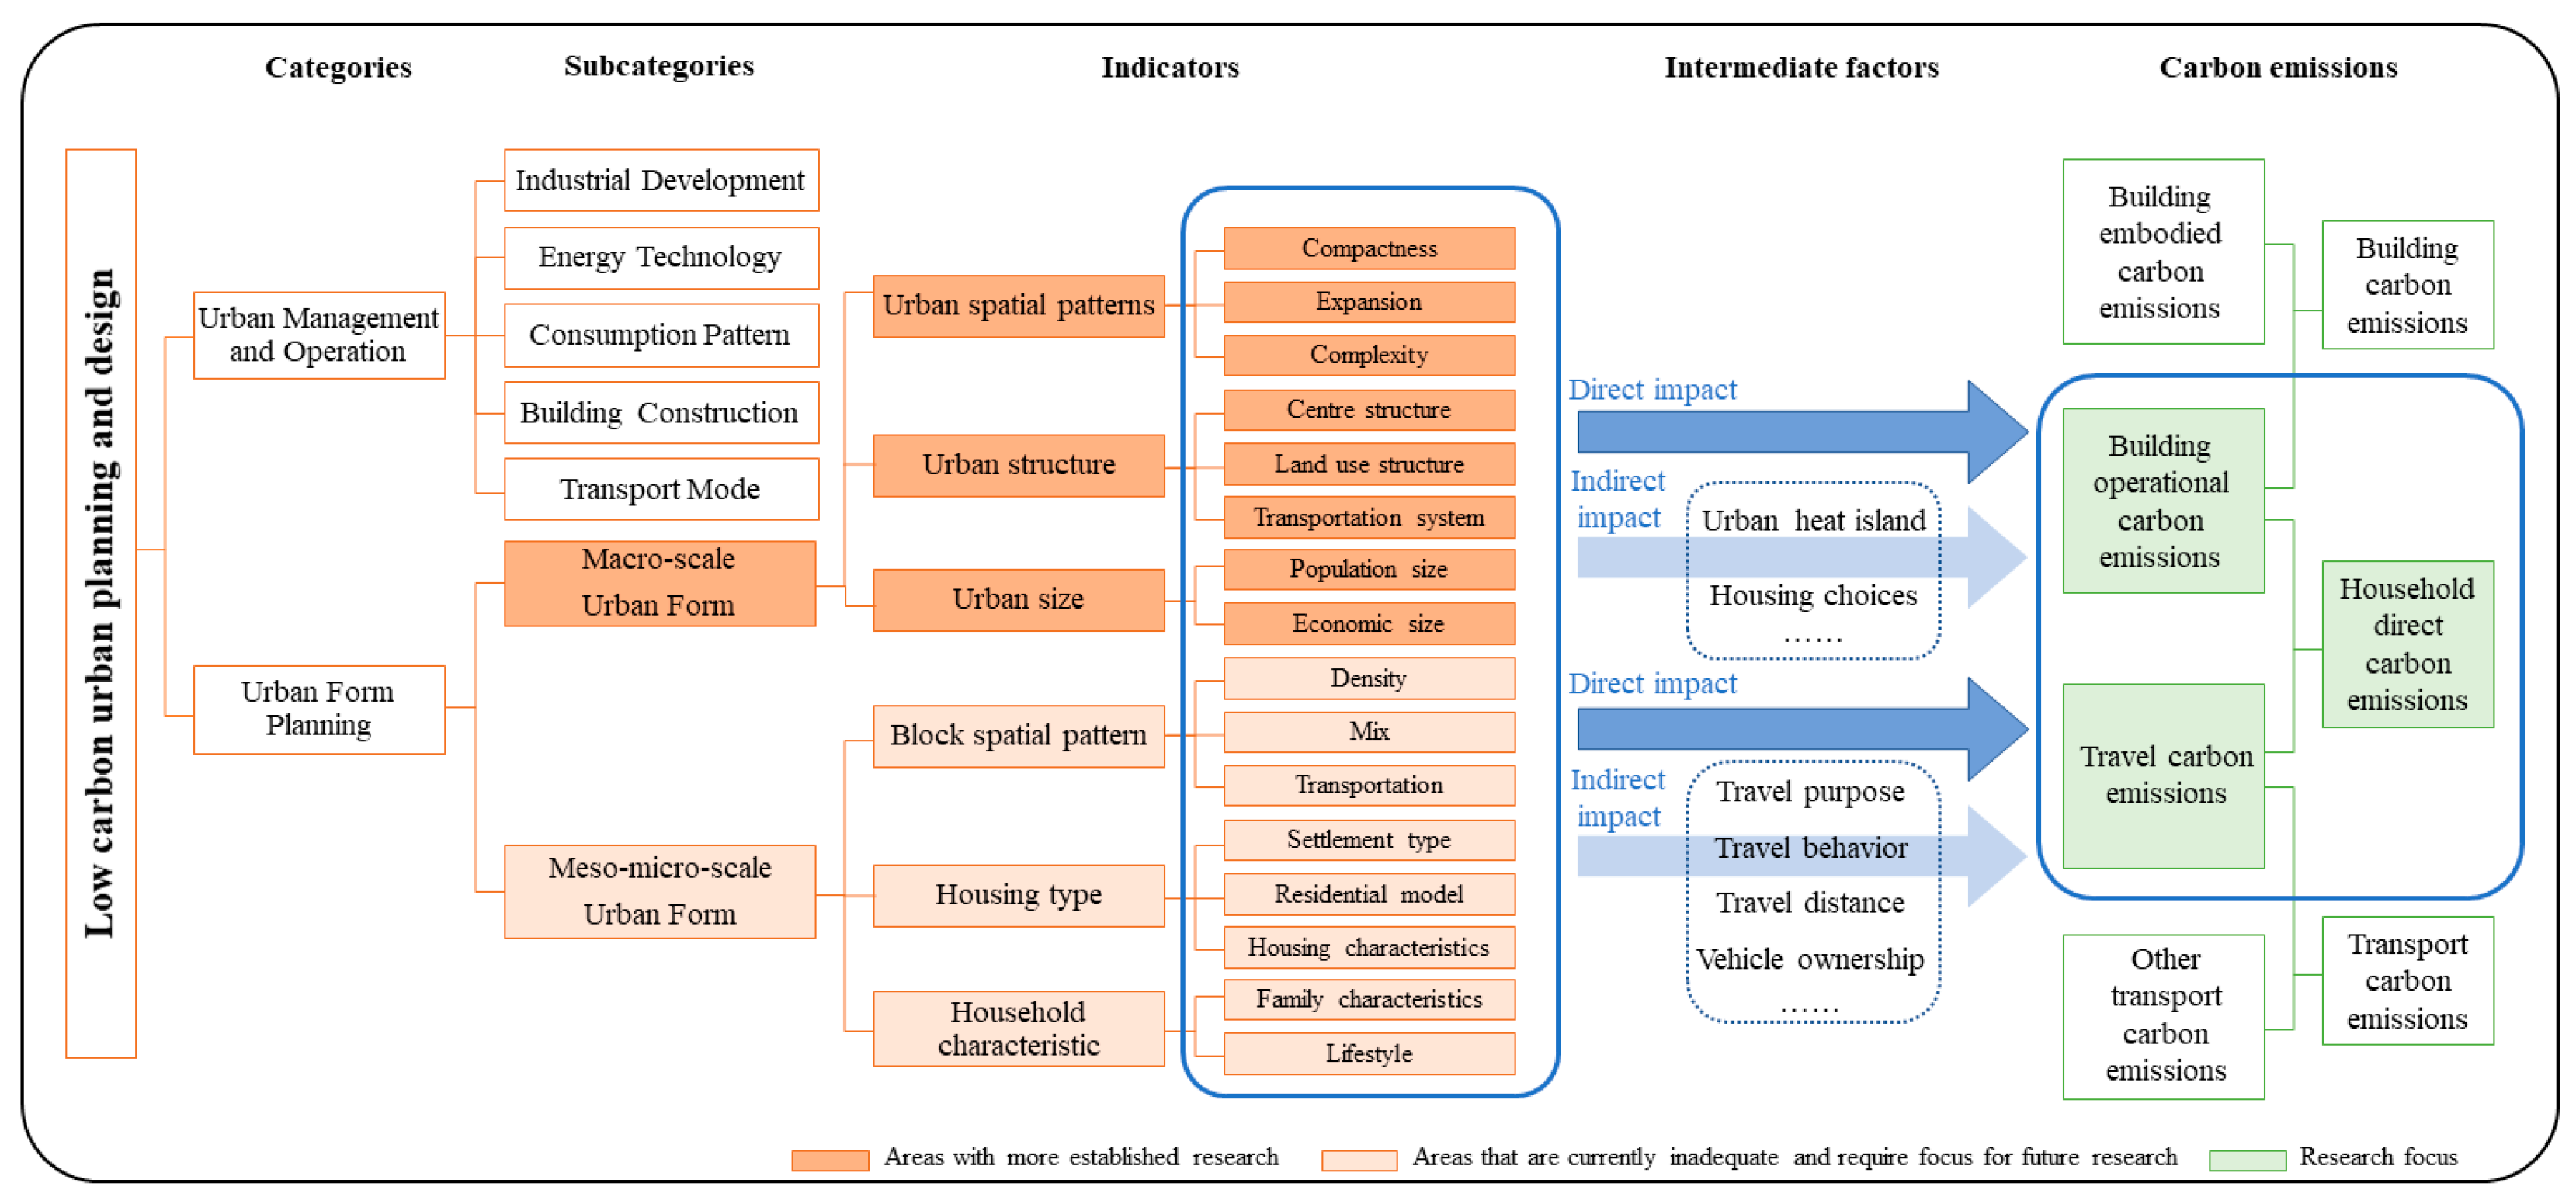
The main factors influencing various types of carbon emissions have been described in previous studies, which have transitioned from single-factor to multi-factor integrated impact studies. However, the intensity and weight of each indicator, as well as the impact effect, are variable, and a general consensus has not been reached. Regarding the impact of urban form on carbon emissions, existing research has revealed that urban form affects carbon emissions both directly and indirectly. Key intermediary factors, such as housing type, urban heat island, and travel choices, play a significant role. However, further development is needed to refine the models, mechanisms, and analytical frameworks.
In general, the majority of existing research has demonstrated that there is a clear spatial dependency and aggregation of urban carbon emissions. Additionally, there are numerous complex mechanisms through which urban form influences carbon emissions. The impact of “travel behavior” on carbon emissions related to transportation has been the primary focus of recent research on intermediate factors [
106,
107,
108]. However, less attention has been paid to the effects of factors such as urban microclimate. Therefore, as shown in
Figure 11, this research first establishes an overall framework for studying the impact of urban planning on carbon emissions. It then focuses on the mechanisms through which urban form affects carbon emissions, specifically the attributes and functions of intermediary factors. Only by developing an overall and comprehensive research framework can we conduct in-depth research scientifically. This will help us understand the significance of urban planning and spatial morphology in the context of low-carbon cities and provide guidance for more proactive and effective decisions.
7. Conclusions
This paper reviews the progress of research on urban form and carbon emissions over the last two decades. It compares the main research findings, summarizes the measurement of carbon emissions associated with urban form, and discusses the impact of multi-scale urban form on carbon emissions. Additionally, it proposes a framework for future research.
Overall, research on the relationship between urban form and carbon emissions is expanding. According to the perspective of urban spatial form, this research primarily focuses on direct carbon emissions, which include emissions from households, operating buildings, and travel, as these direct emissions are more influenced by urban physical space and have greater research significance. The Emission-Factor Approach (EFA), which is the most popular and widely used method for calculating carbon emissions, simplifies the calculation of direct carbon emissions from urban energy use and allows for data collection from various sources. This article determines the impact of urban form on carbon emissions at multiple levels by categorizing urban form indicators at different scales. Building density, service mix, and street design are significant factors that affect residential carbon emissions at the meso–micro level, while urban scale, urban structure, and compactness are significant factors that affect urban carbon emissions at the macro level. Numerous studies have found that urban form can indirectly affect carbon emissions through intermediary factors, thanks to the more detailed focus of meso–microscopic research. In particular, neighborhood floor area ratio and building density can affect the urban micro-environment and residents’ preferences, consequently affecting the carbon emissions of building operations. Service facility mix and street design can affect residents’ travel behavior, consequently affecting travel carbon emissions. As a result, we should continue researching the complex pathways through which urban form impacts carbon emissions at the meso and micro scales and develop a systematic framework for low-carbon urban planning and design methodologies.
The research significance of this paper lies in its ability to evaluate the status of research in this field and provide insightful analysis. These findings can help scholars better comprehend the key aspects of this particular field, as well as help researchers make more informed and intelligent decisions regarding research topics, content, and methodologies.
The limitations of this paper should also be noted. The choice and number of databases limit the scope of the data. However, other databases, such as Scopus, which also cover papers on related topics, may offer additional insights. Furthermore, due to software limitations, changing parameter settings may result in different analysis results. To conduct a more targeted analysis, it is recommended to combine specific data with alternative approaches in future studies.


