
Identification of Risk Influential Factors for Fishing Vessel Accidents Using Claims Data from Fishery Mutual Insurance Association


 ,
,  ,
,  ,
,
Abstract
:1. Introduction
2. Literature Review
3. Data
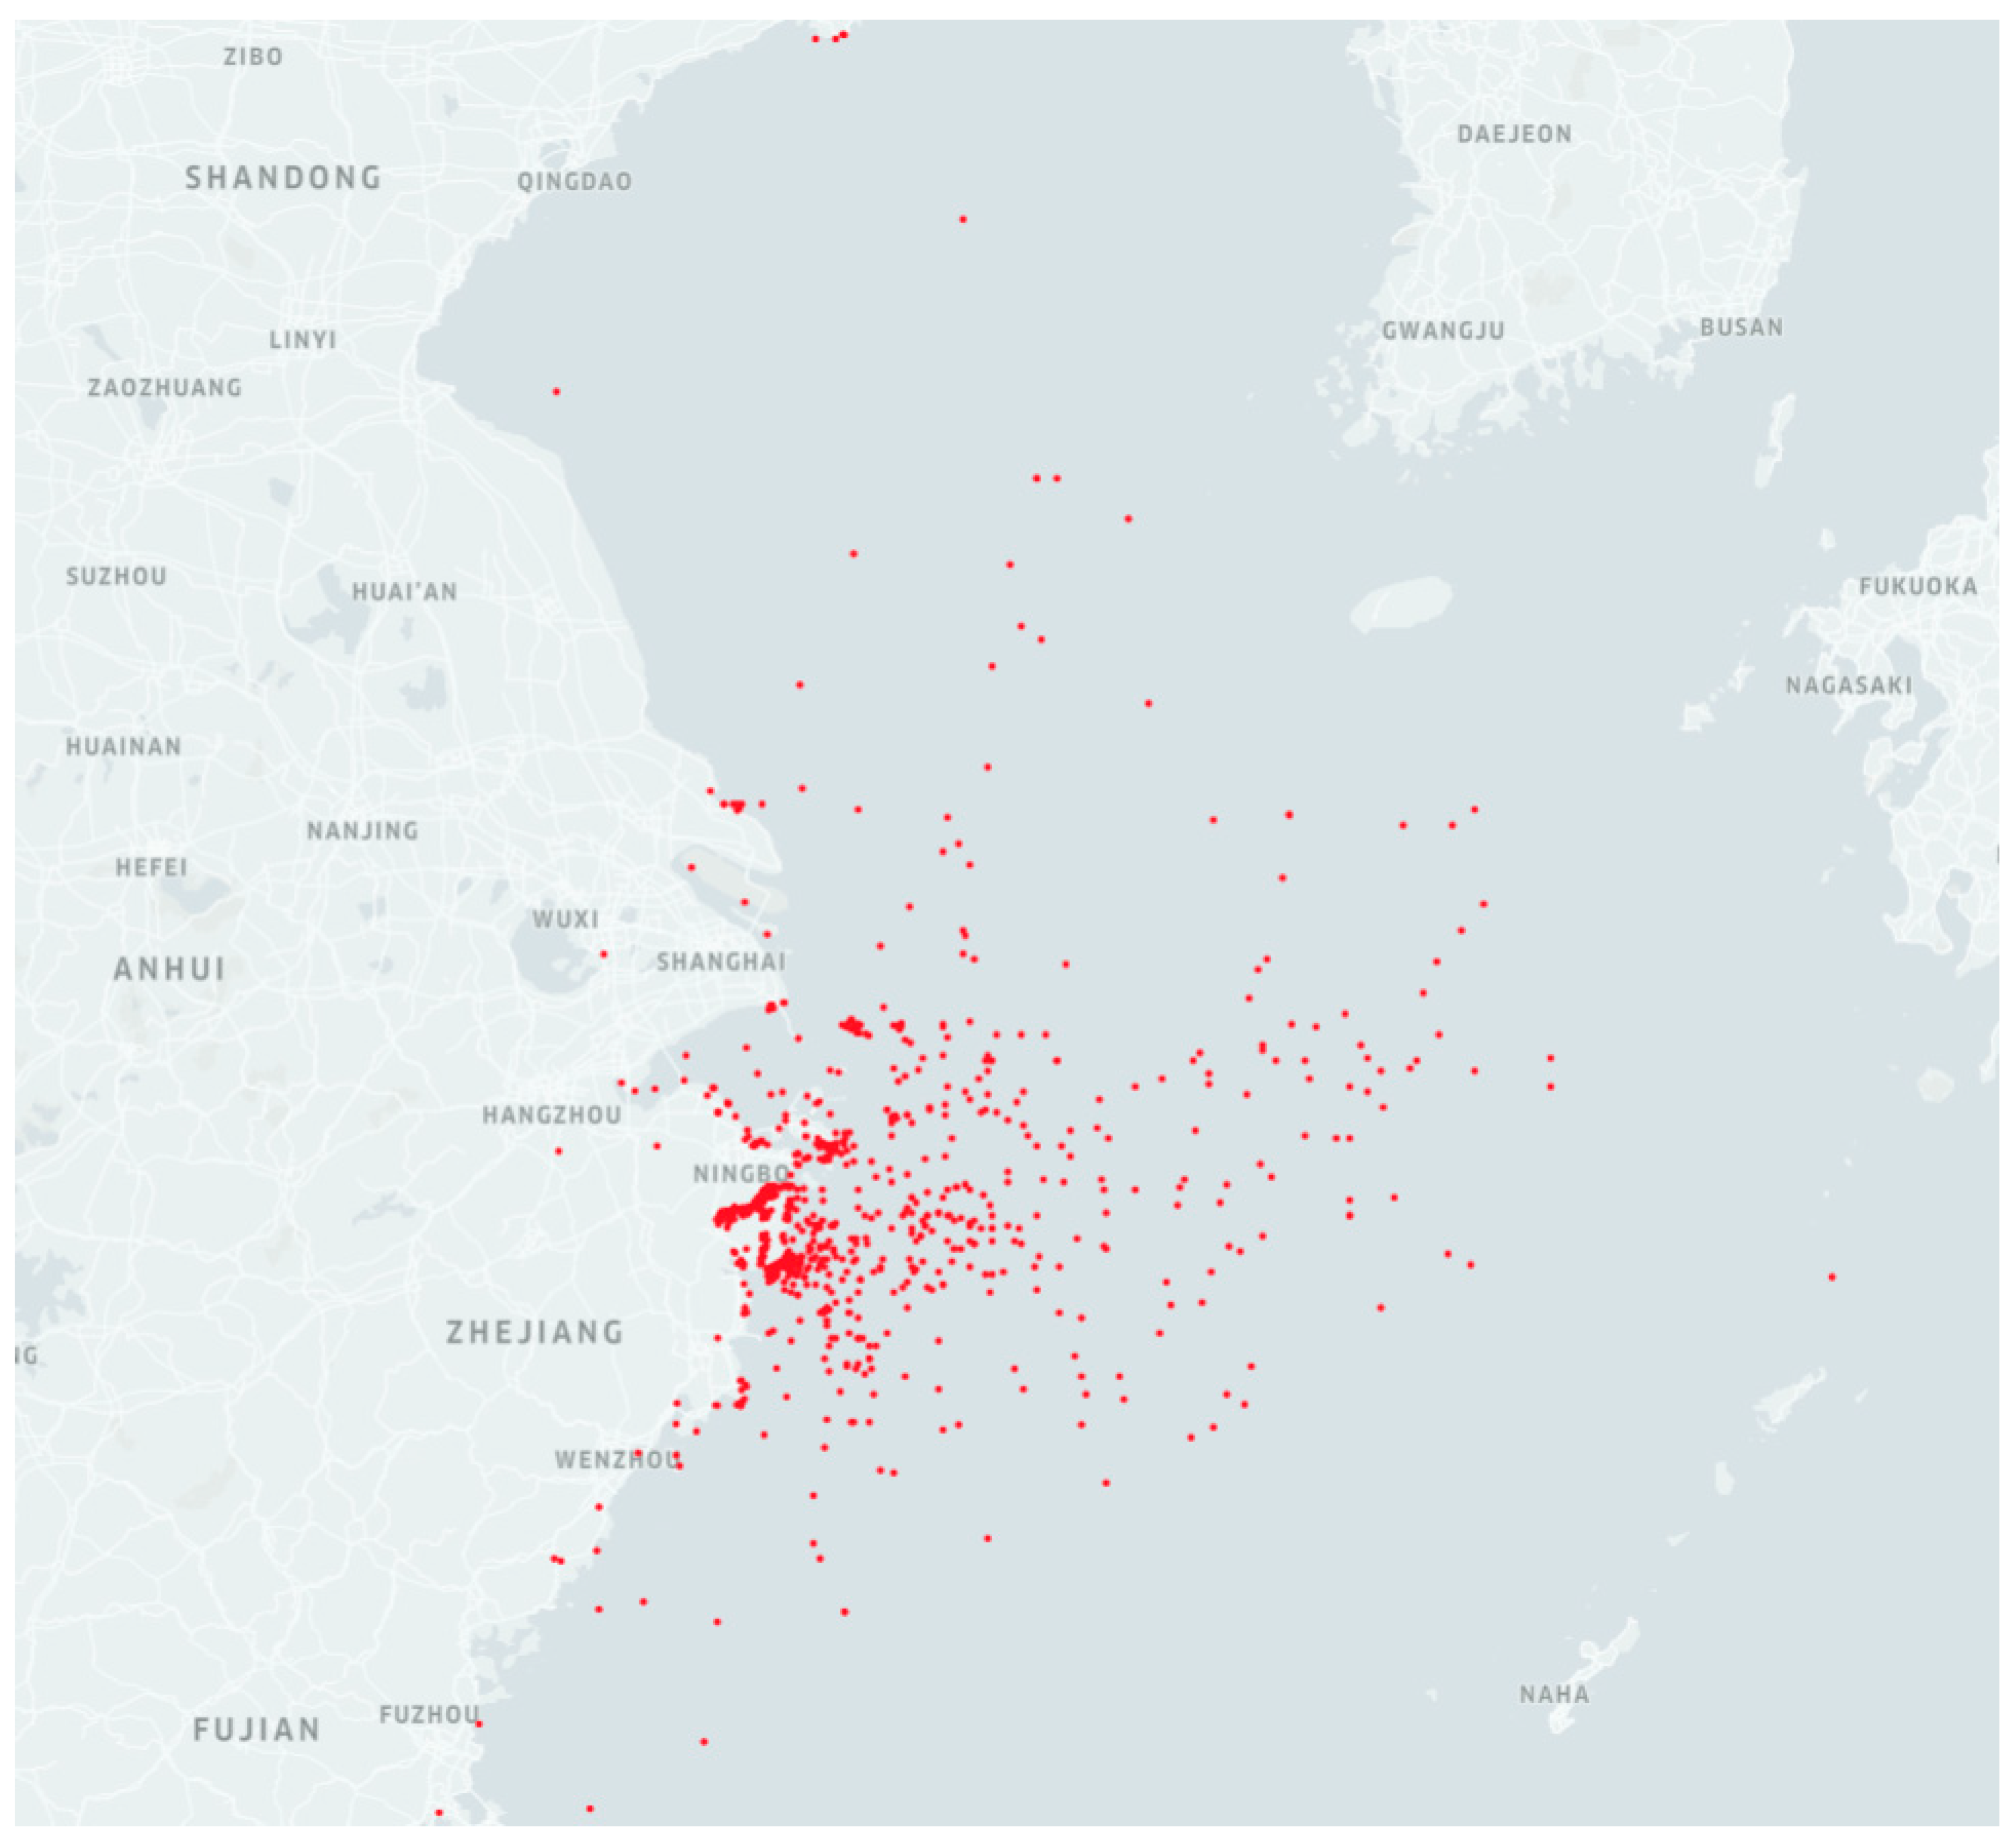
3.1. Database
3.2. Risk Influential Factors
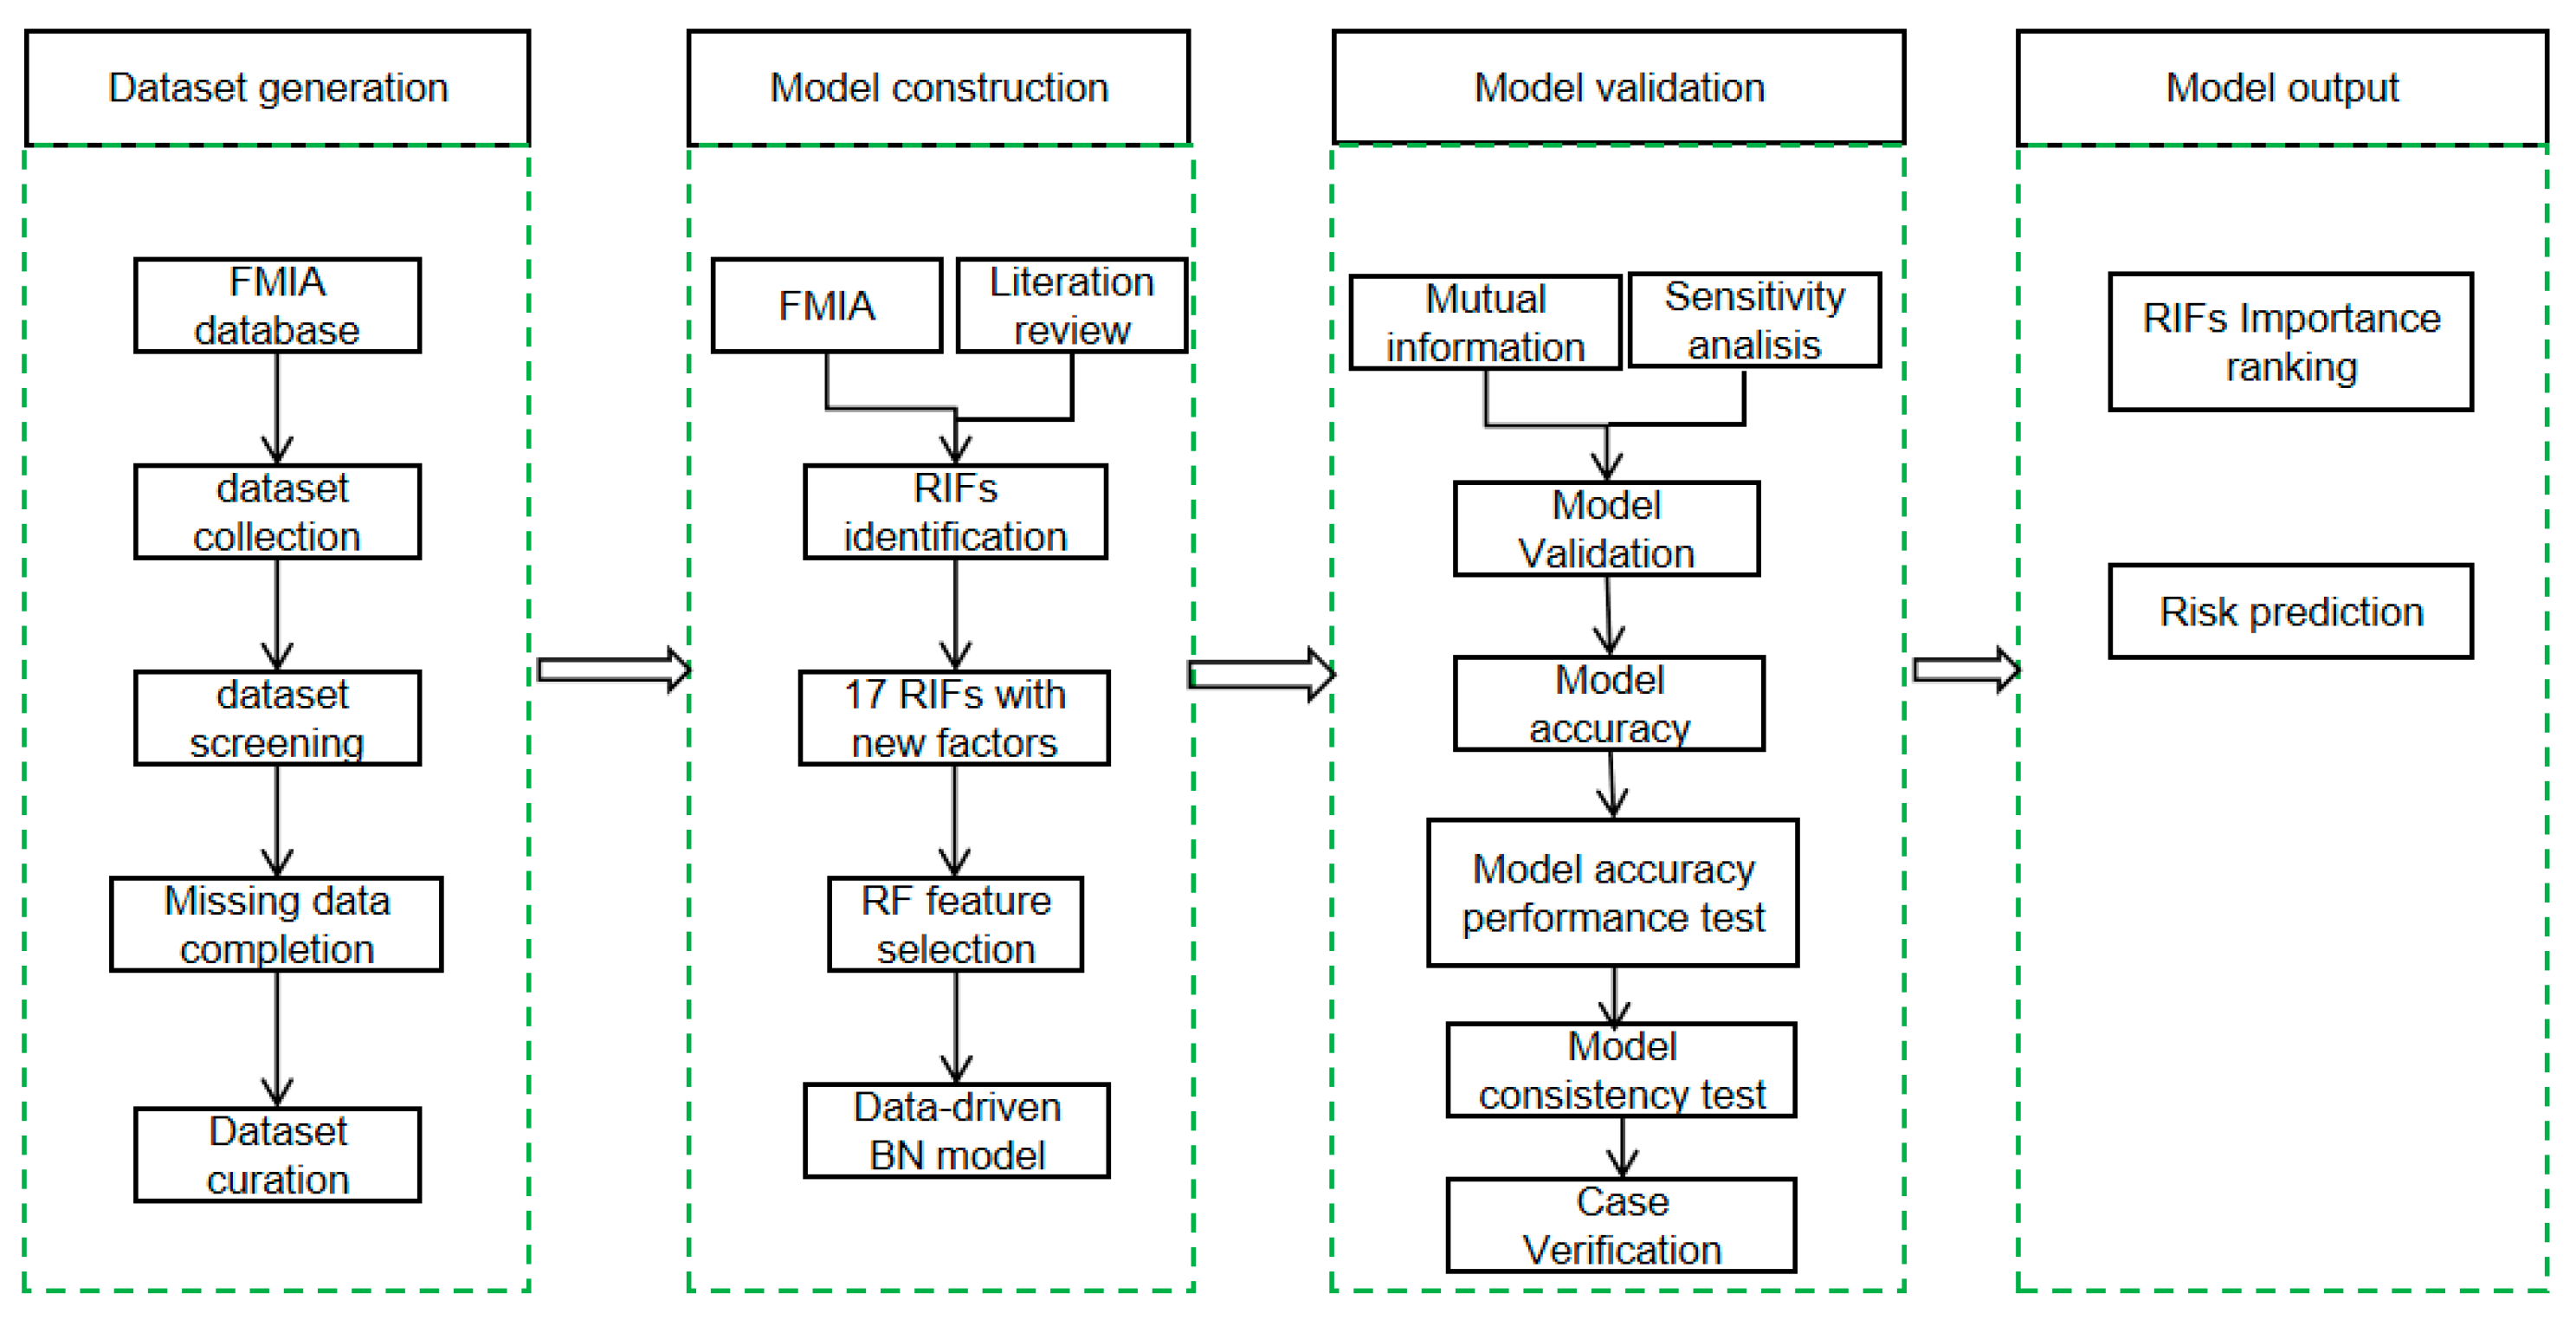
4. Research Methodology
4.1. Random Forest
4.2. Tree-Augmented Naive Bayes (TAN)
4.3. Model Validation
4.4. Sensitivity Analysis
- (1)
- Mutual Information
- (2)
- Sensitivity Analysis
4.5. Model Prediction Performance Evaluation
4.6. Model Consistency Verification
5. Results
5.1. RF-Based RIF Selection
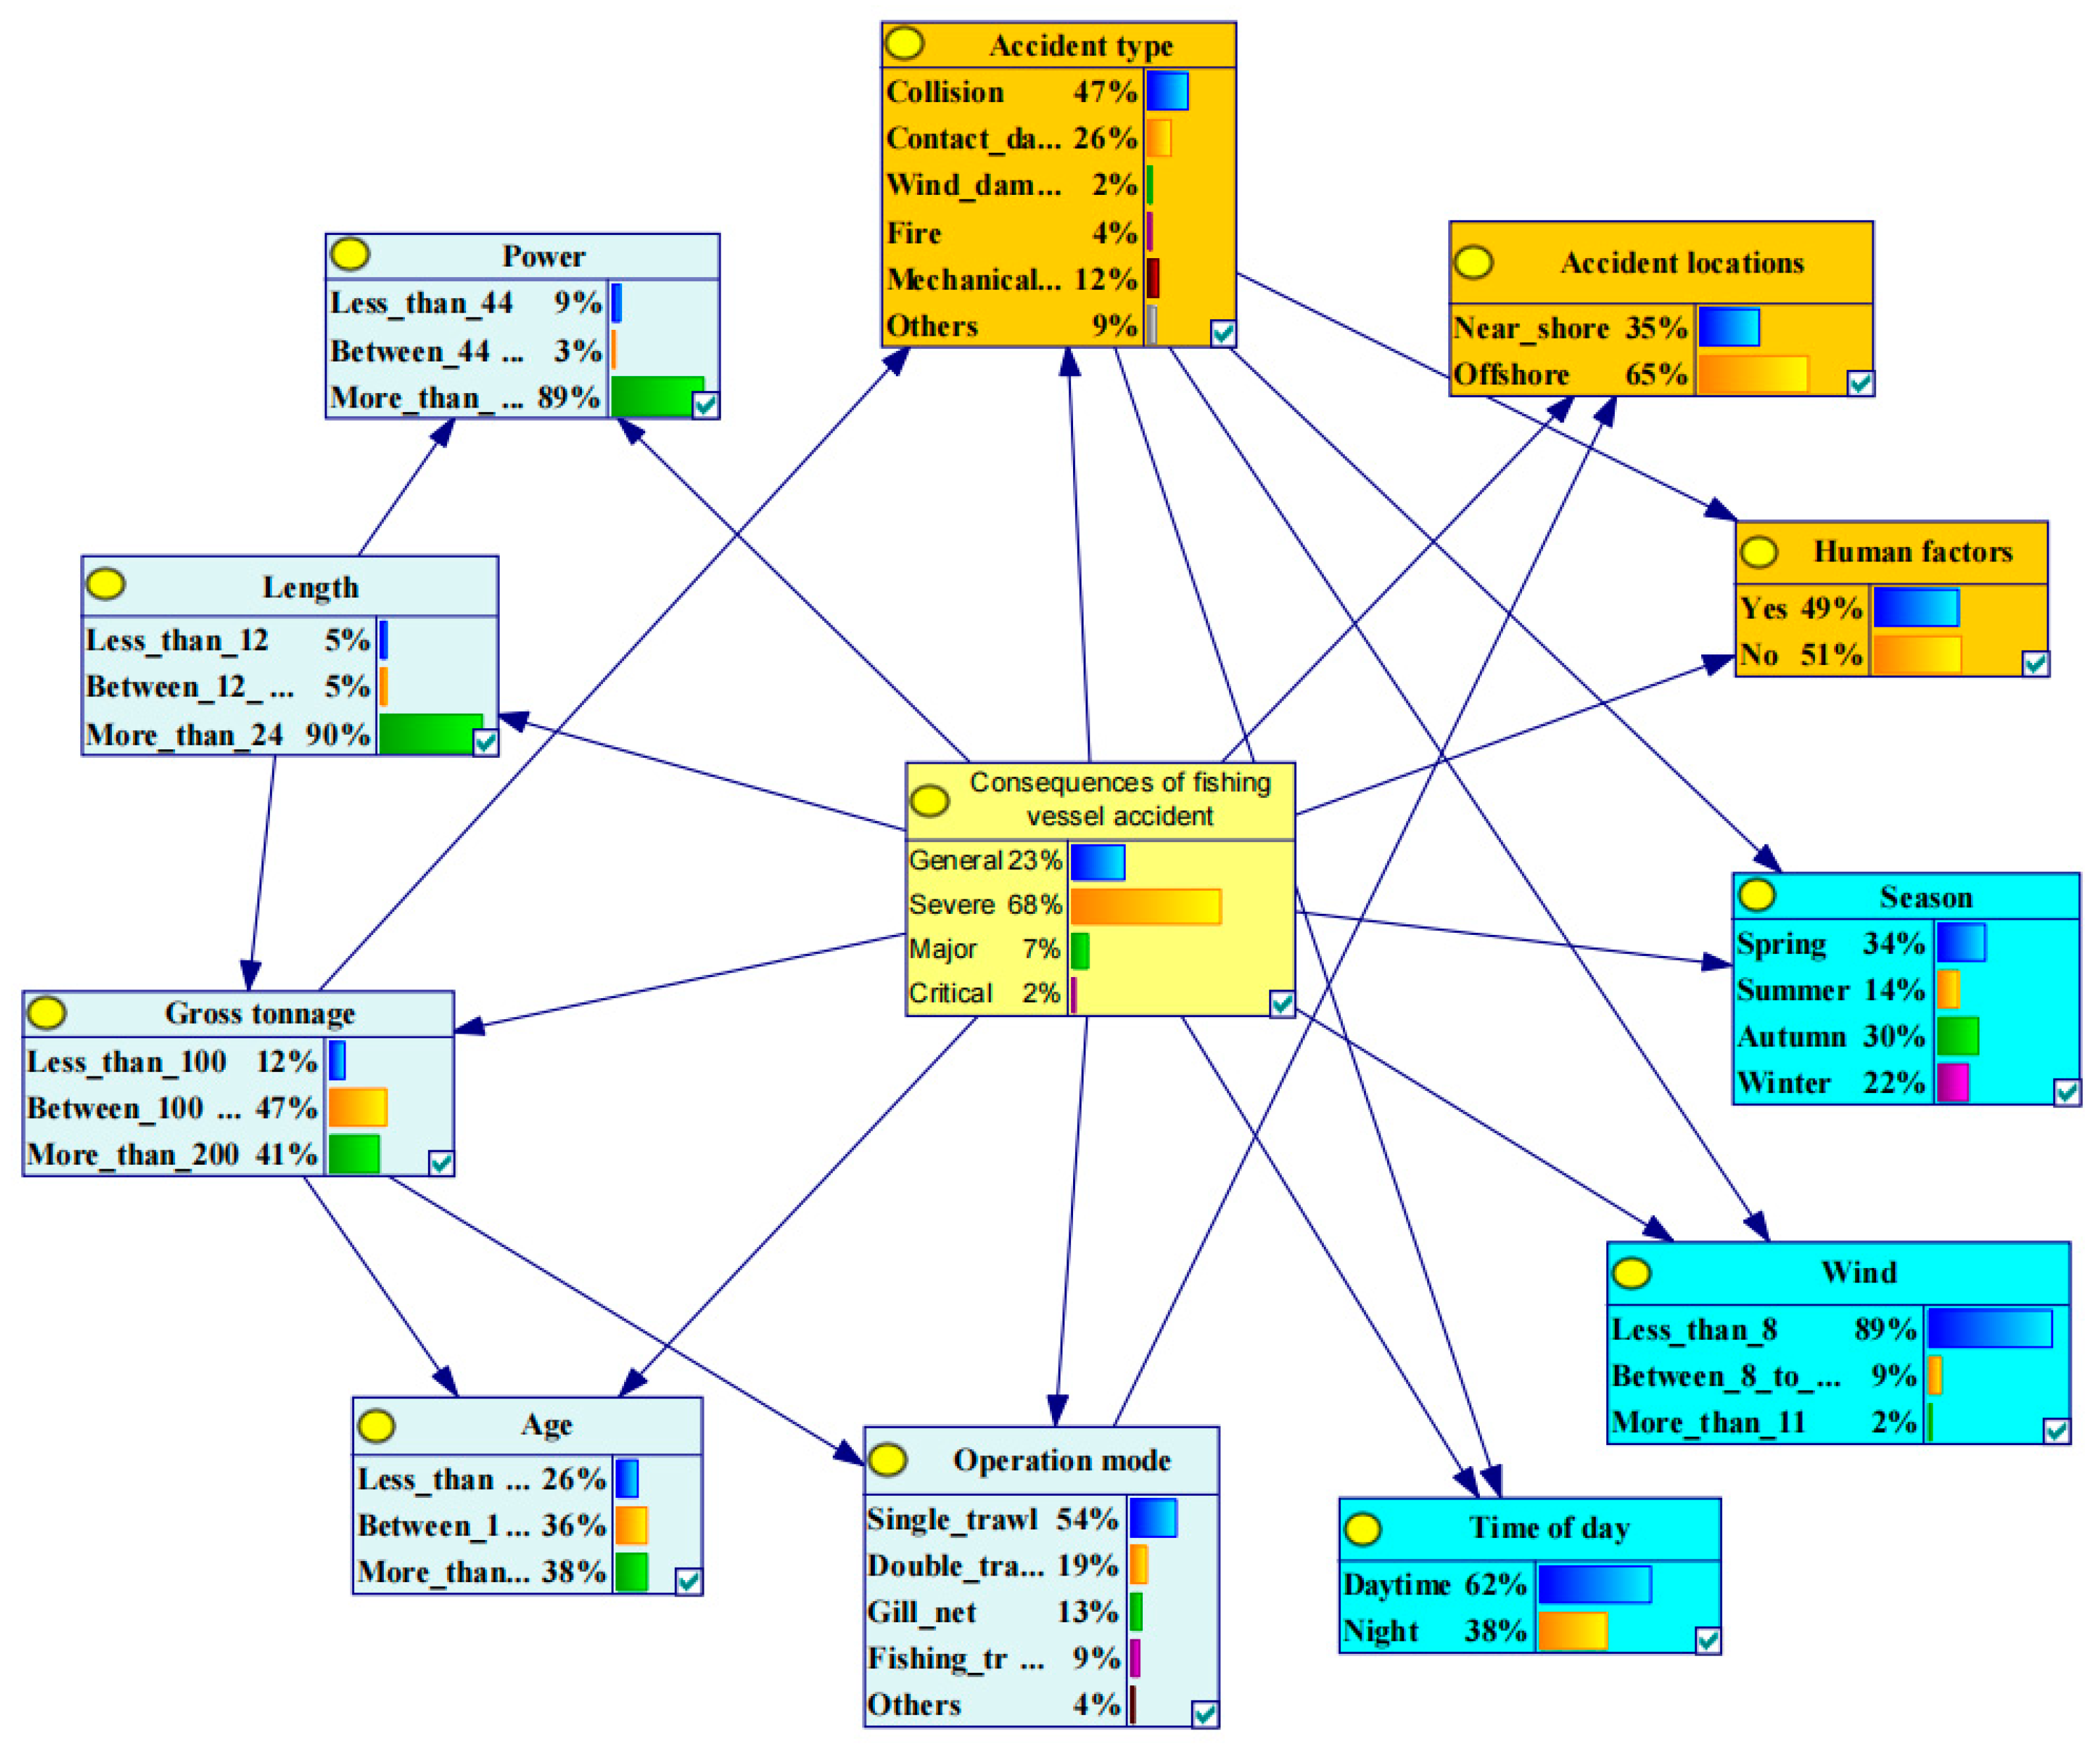
5.2. Bayesian Model
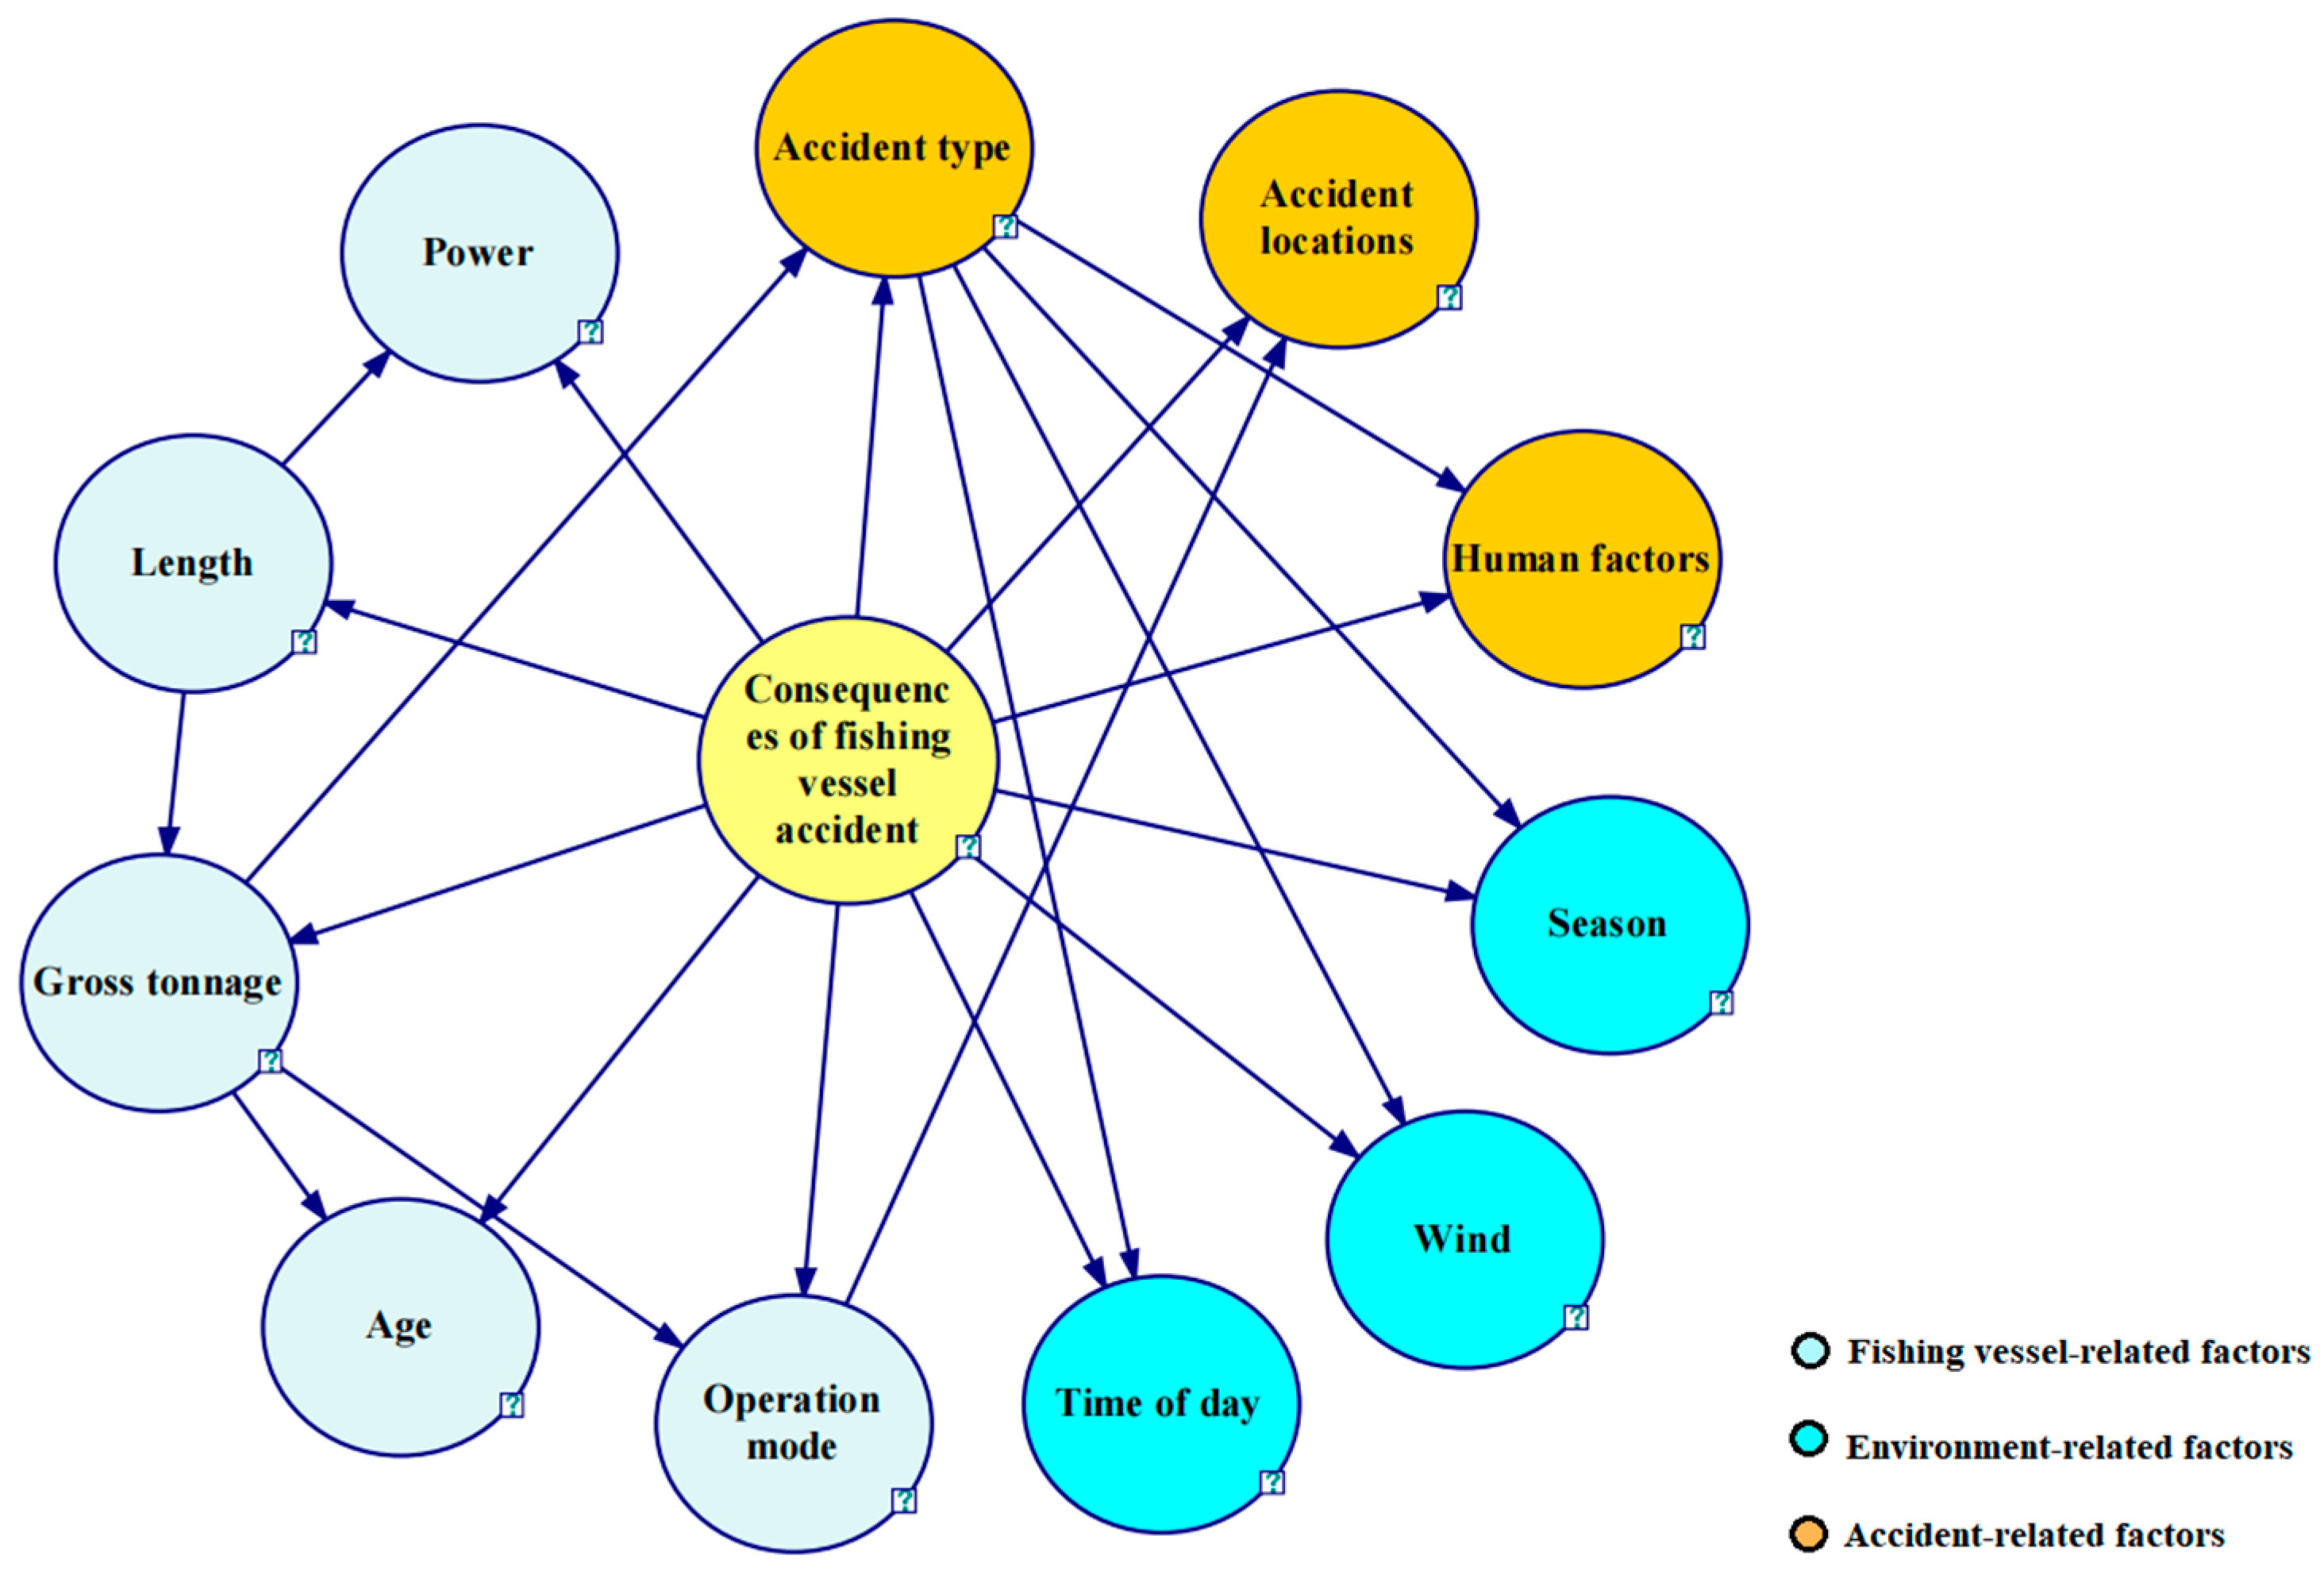
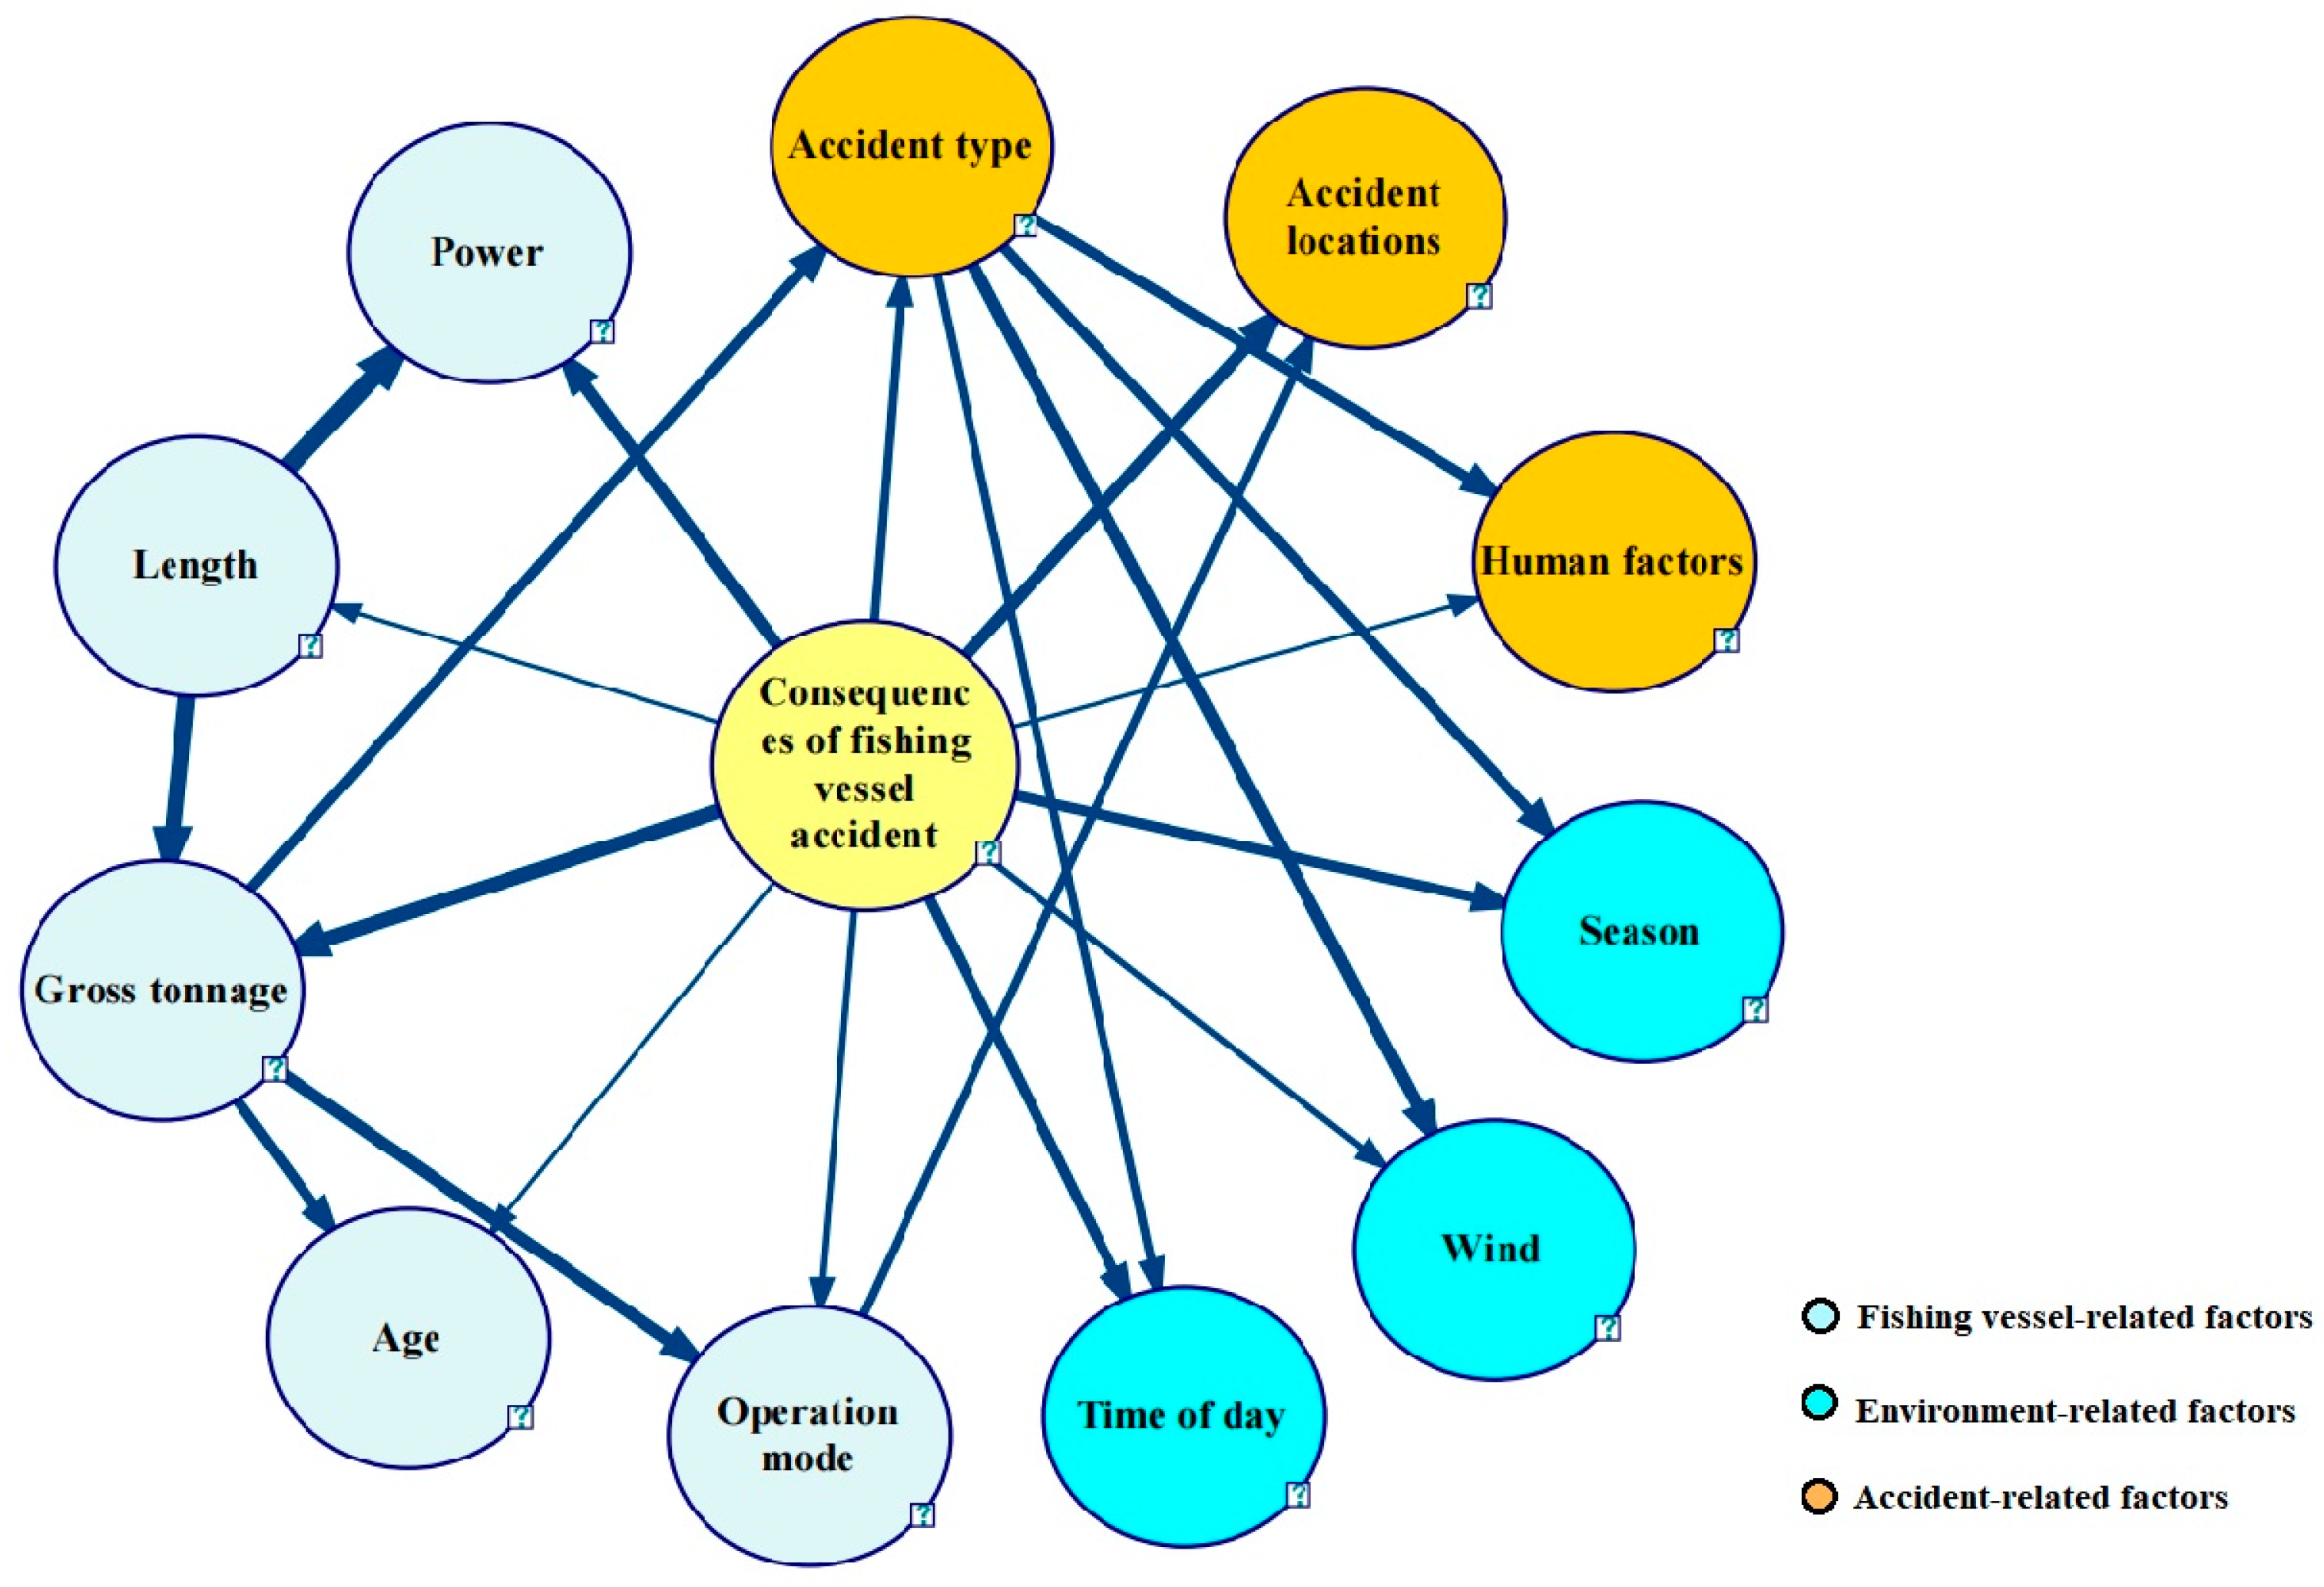
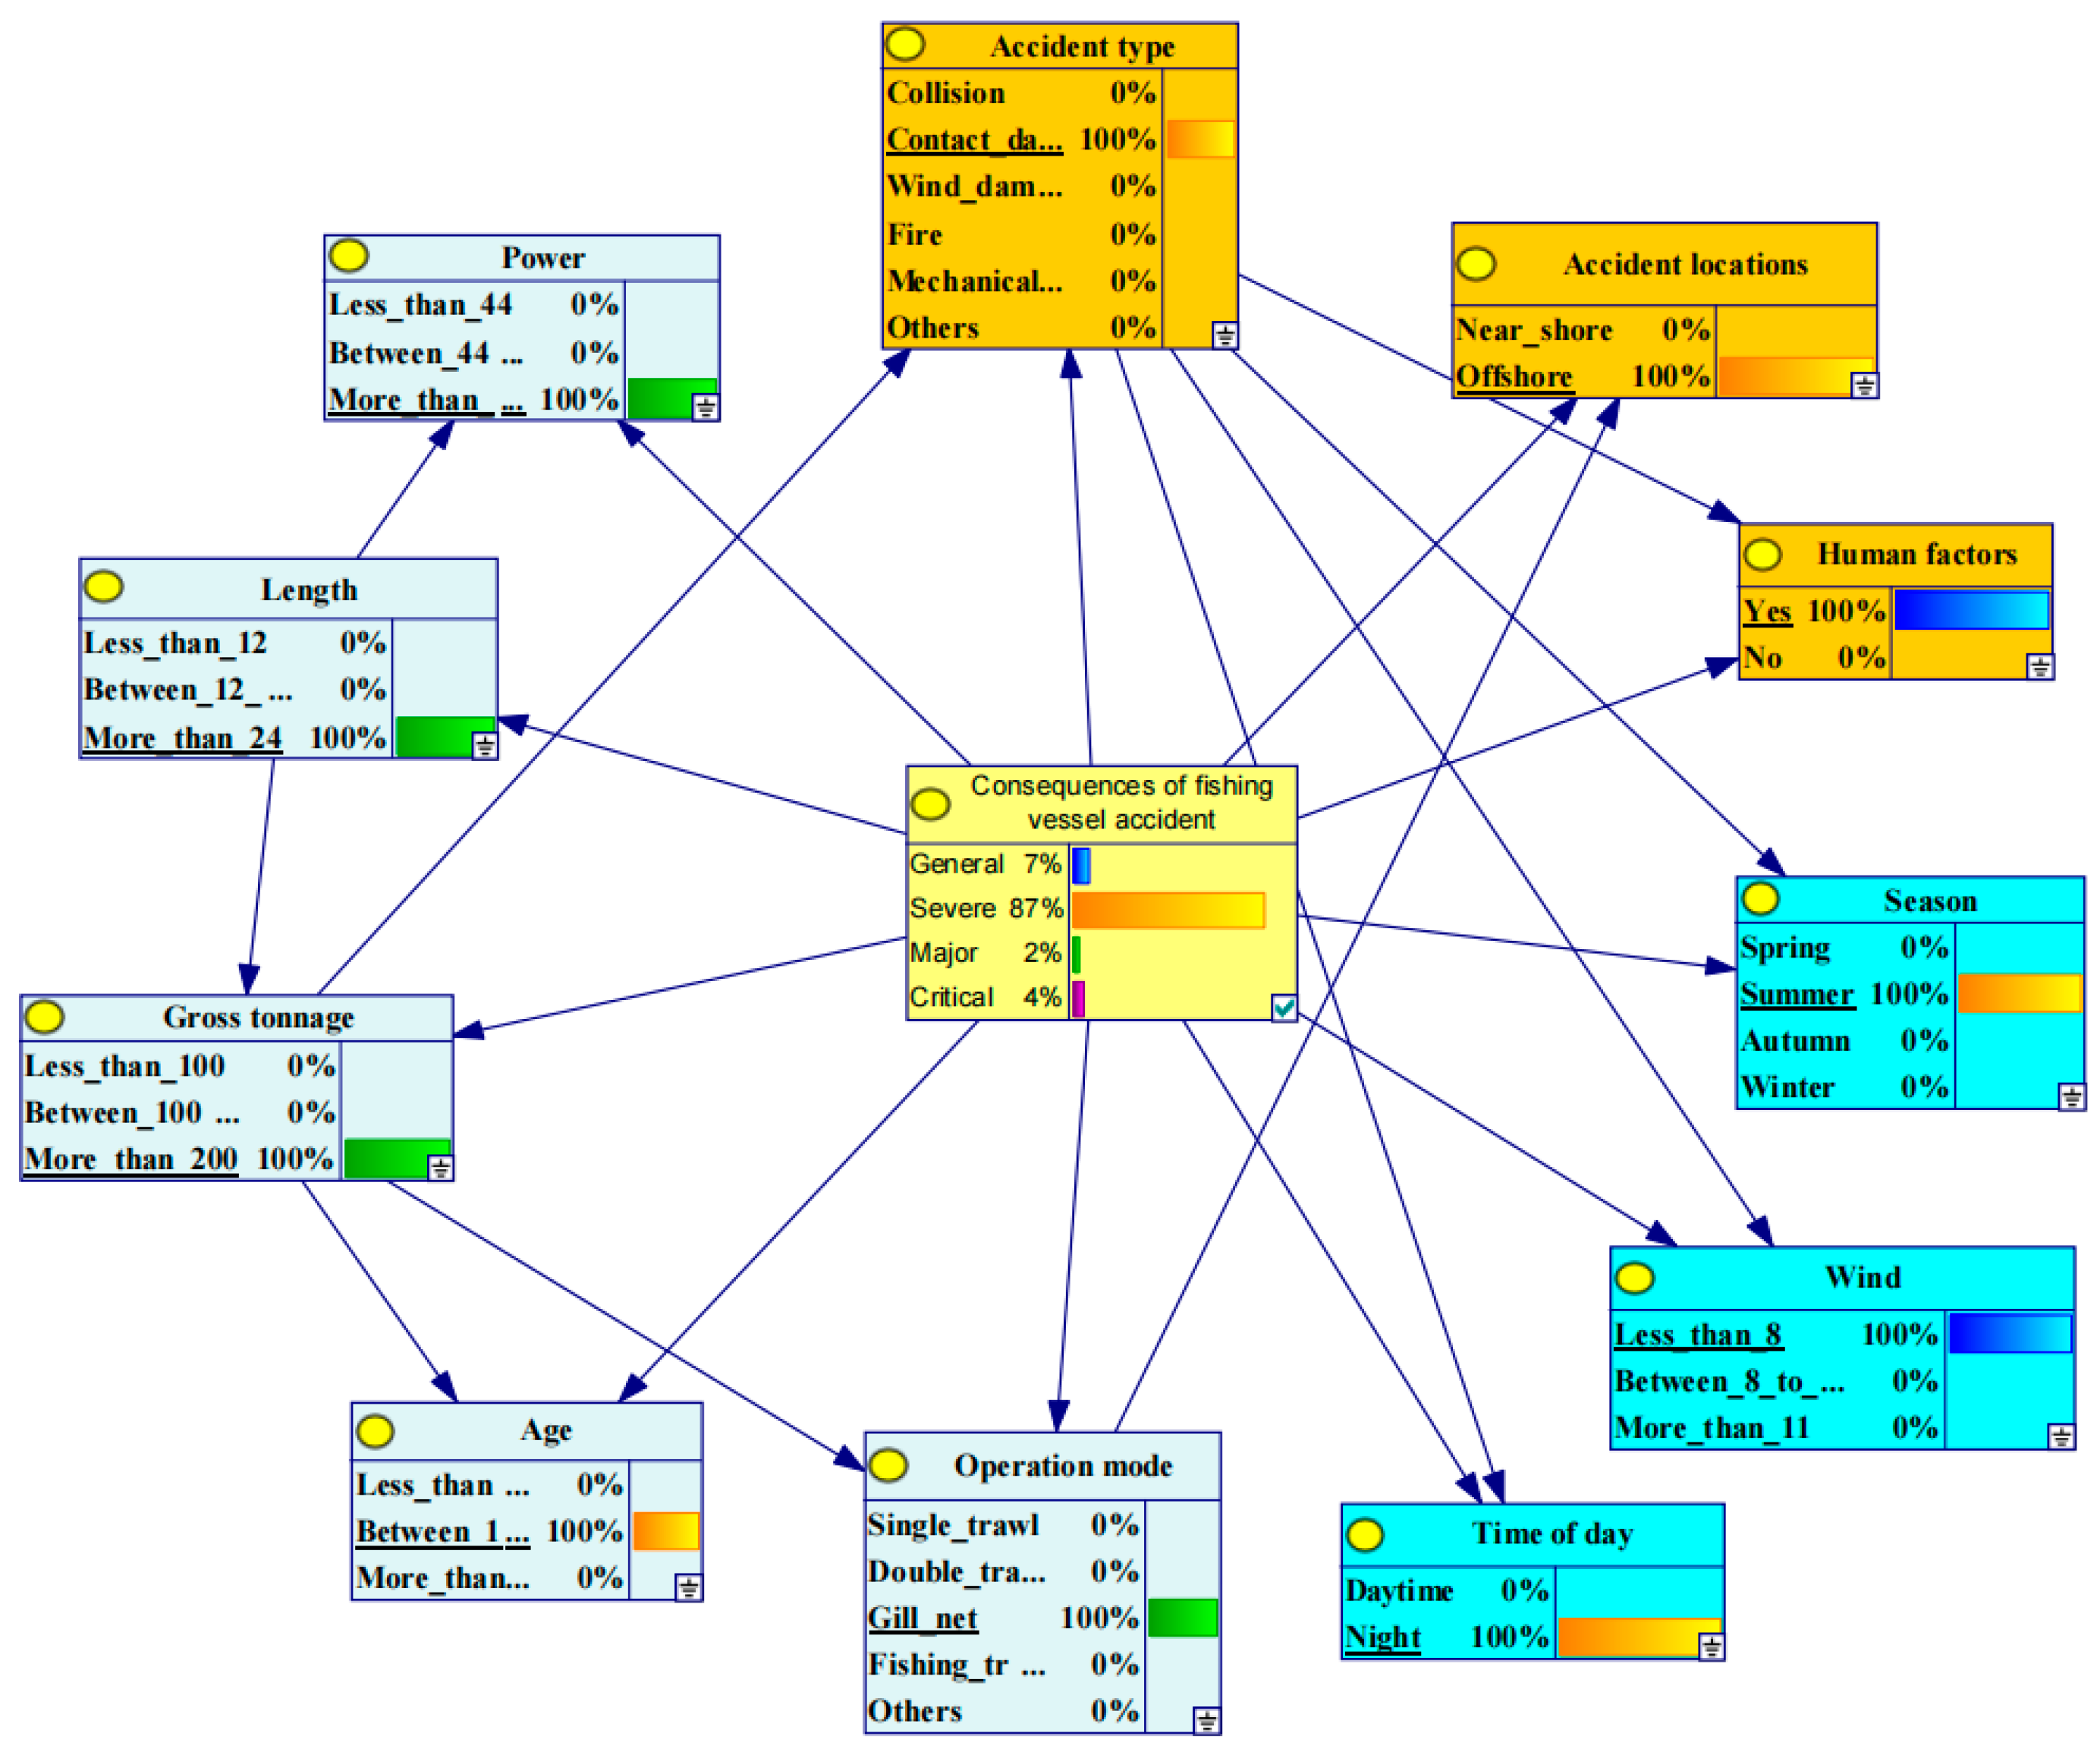
5.2.1. Bayesian Model Structure Learning
5.2.2. Bayesian Model Probabilistic Learning
5.3. Sensitivity Analysis
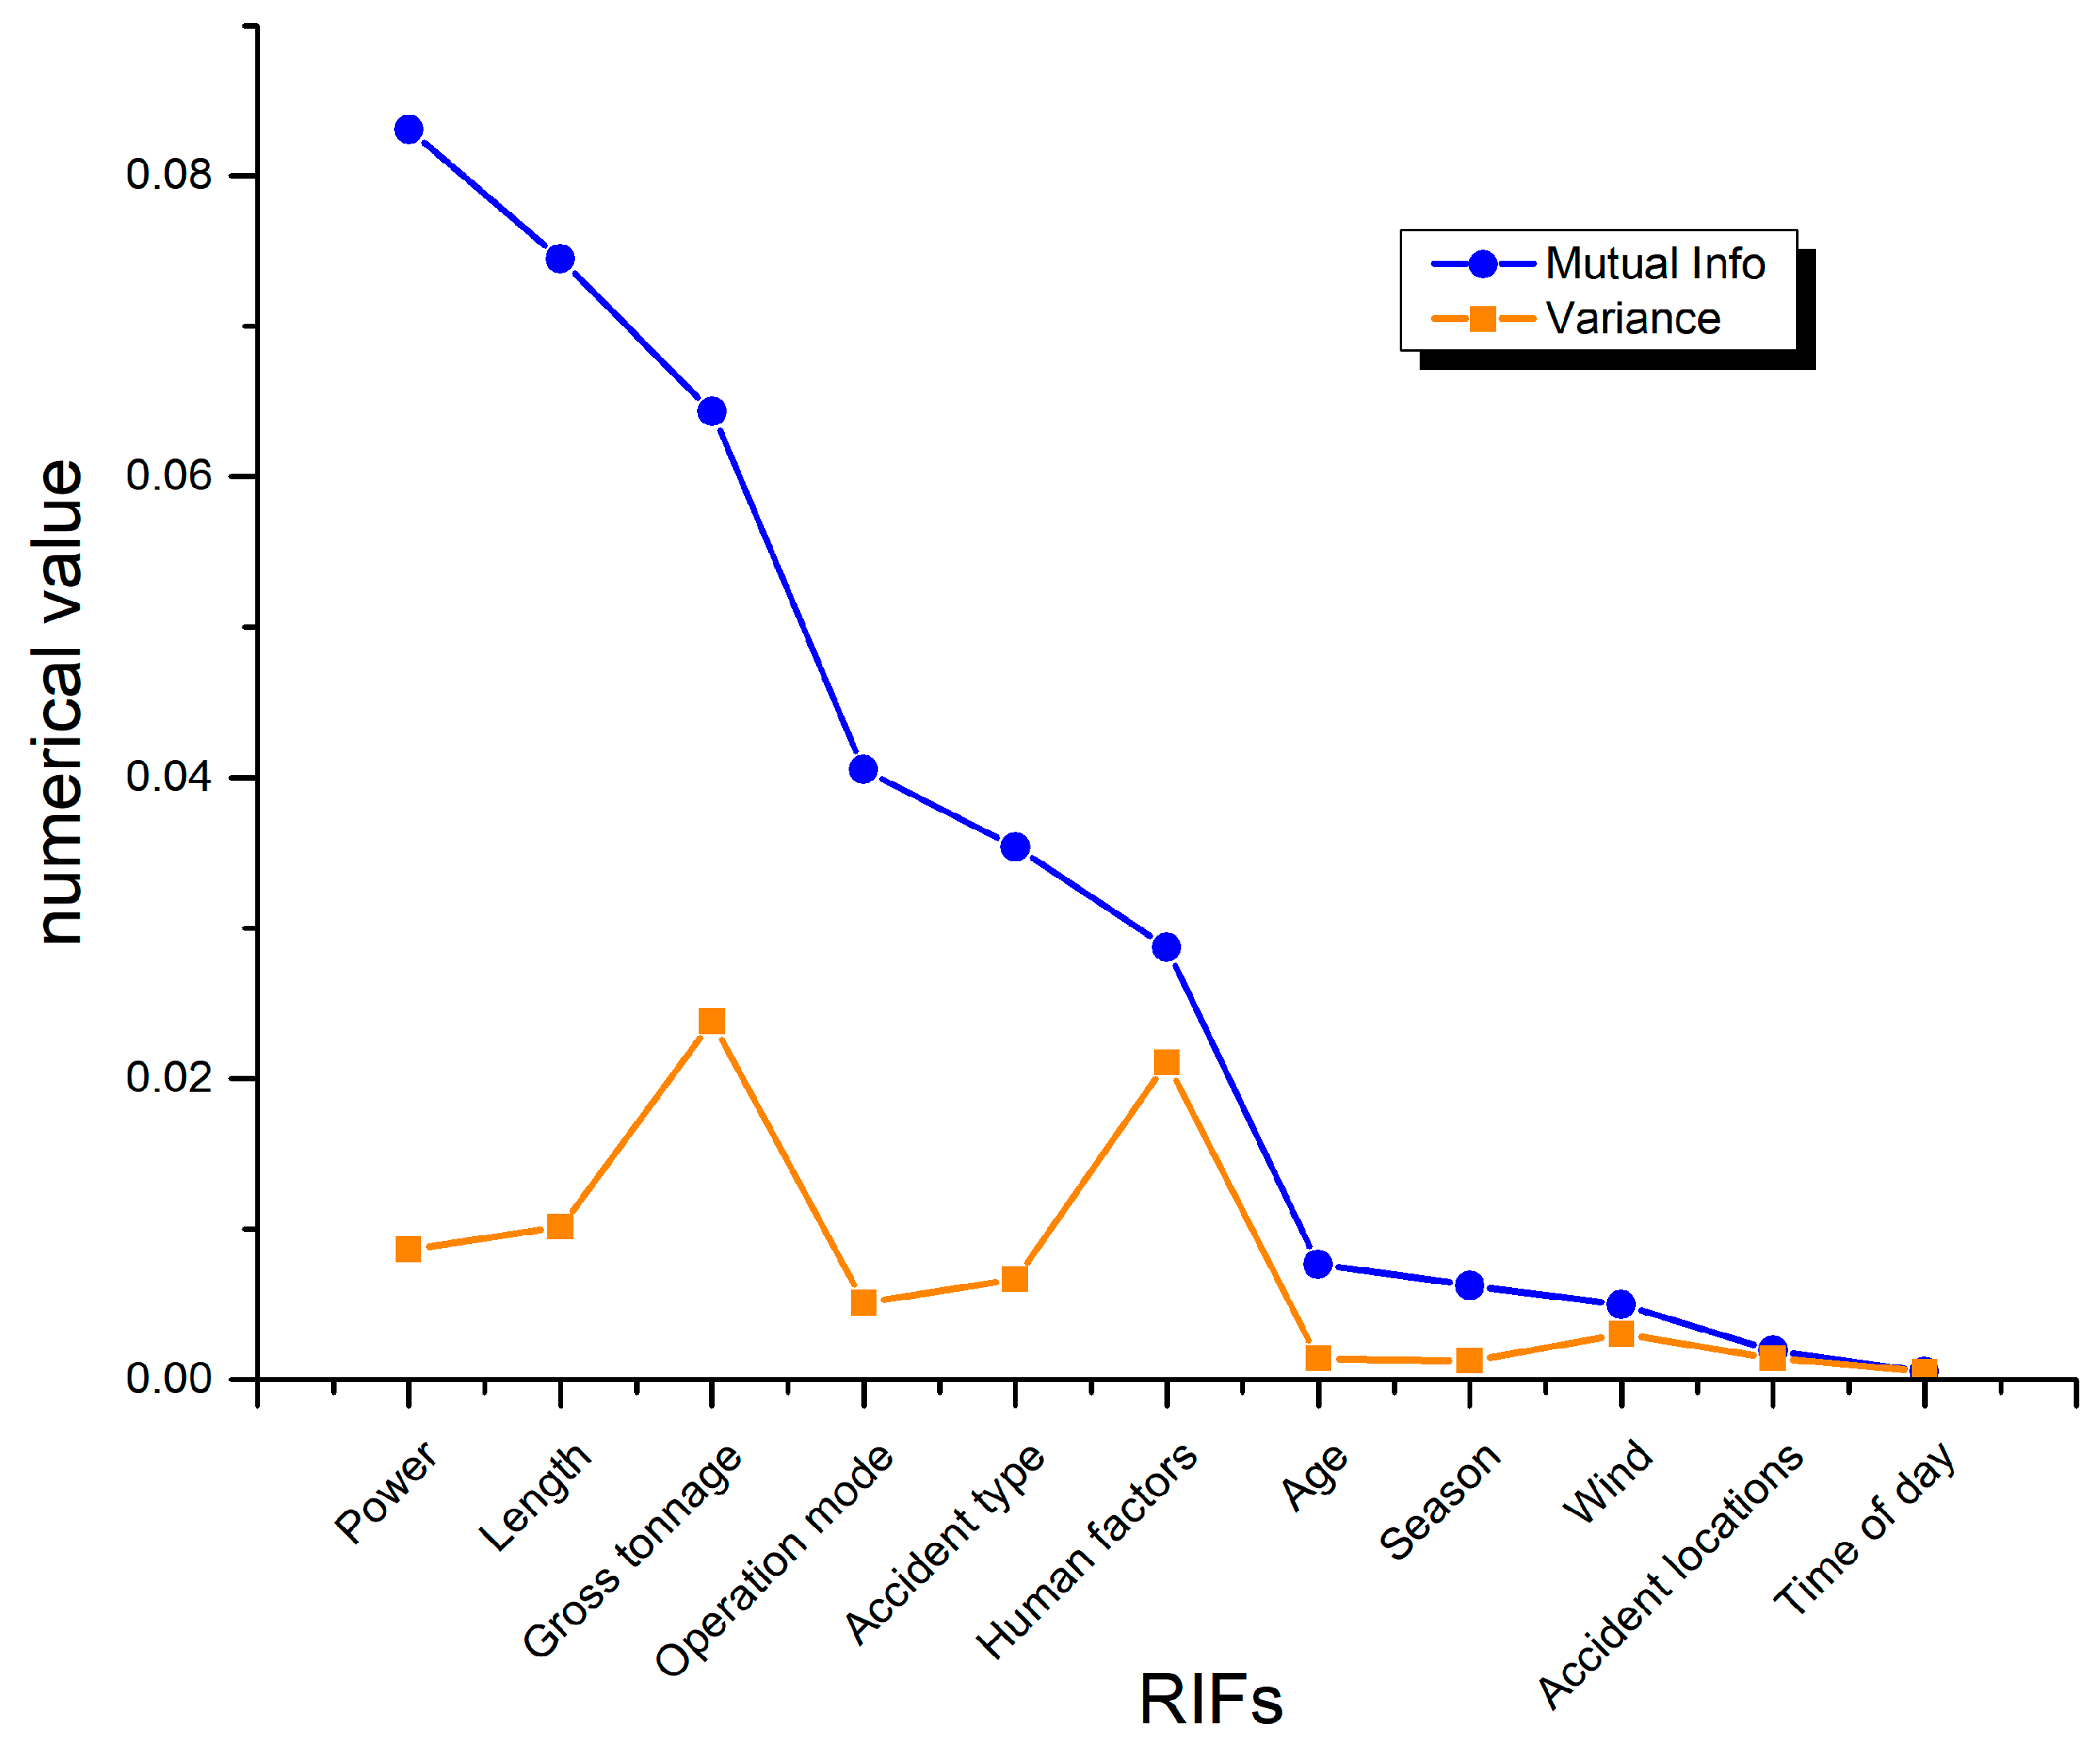
5.3.1. Mutual Information
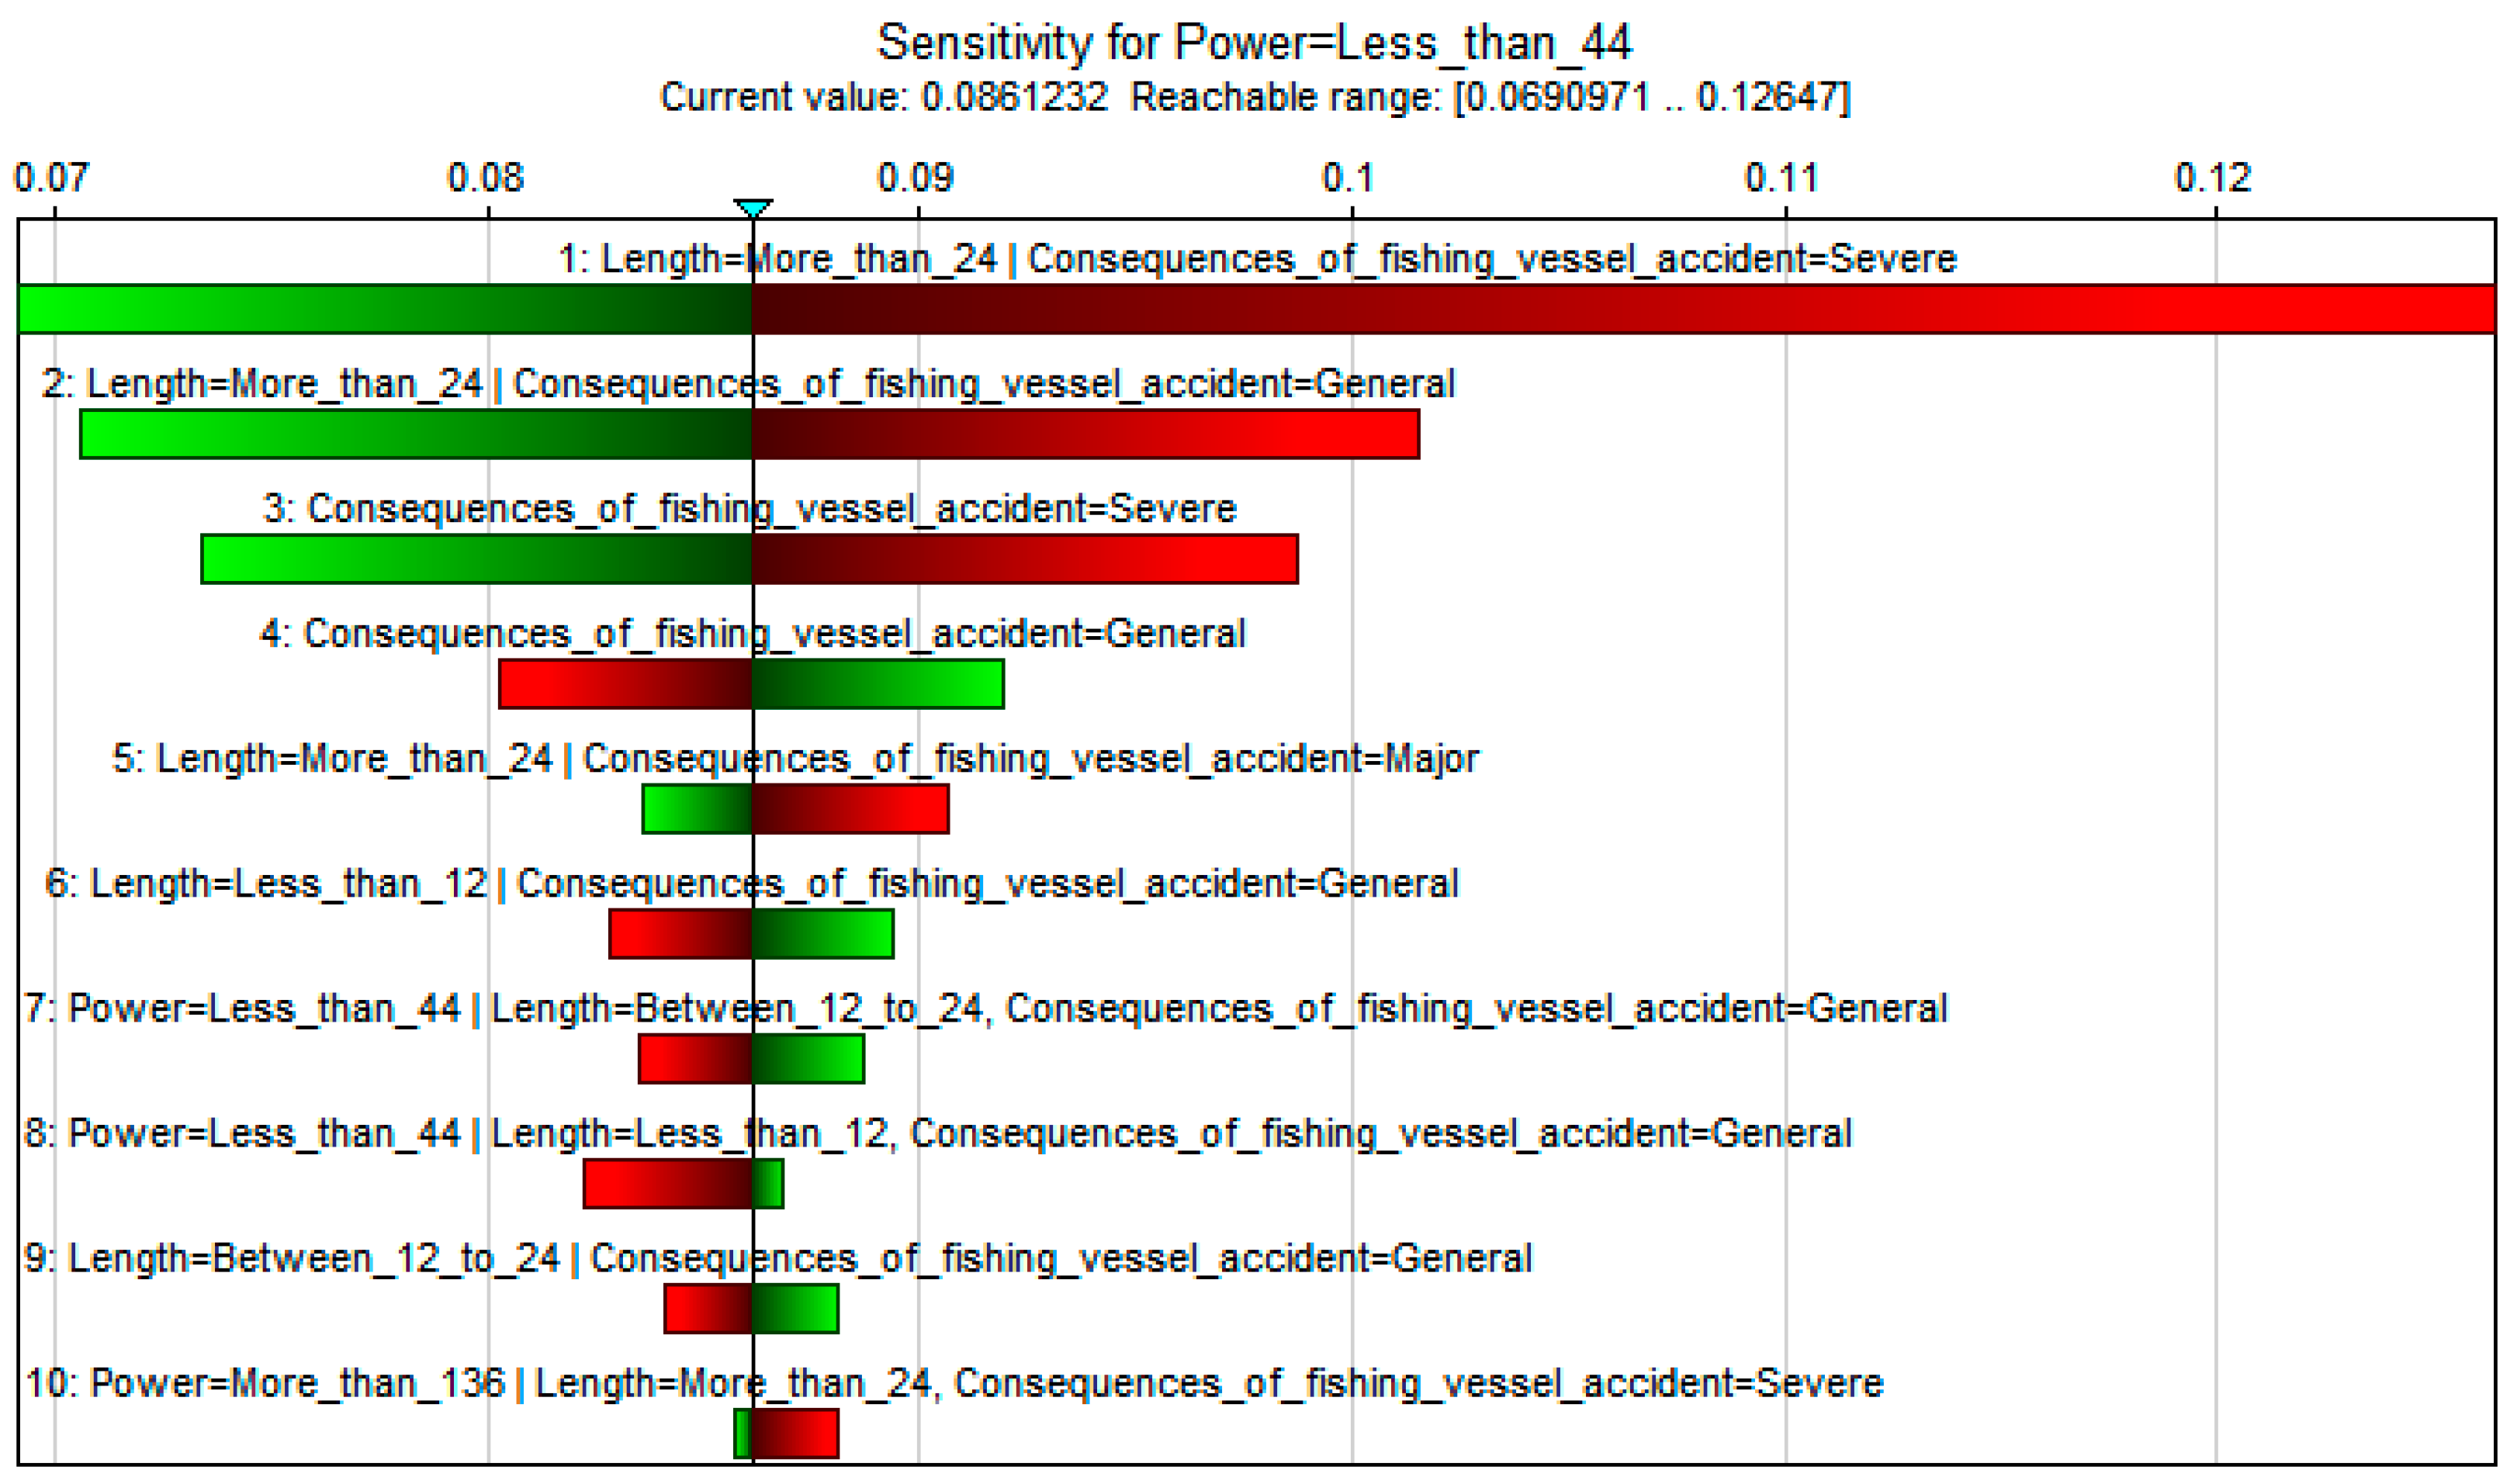
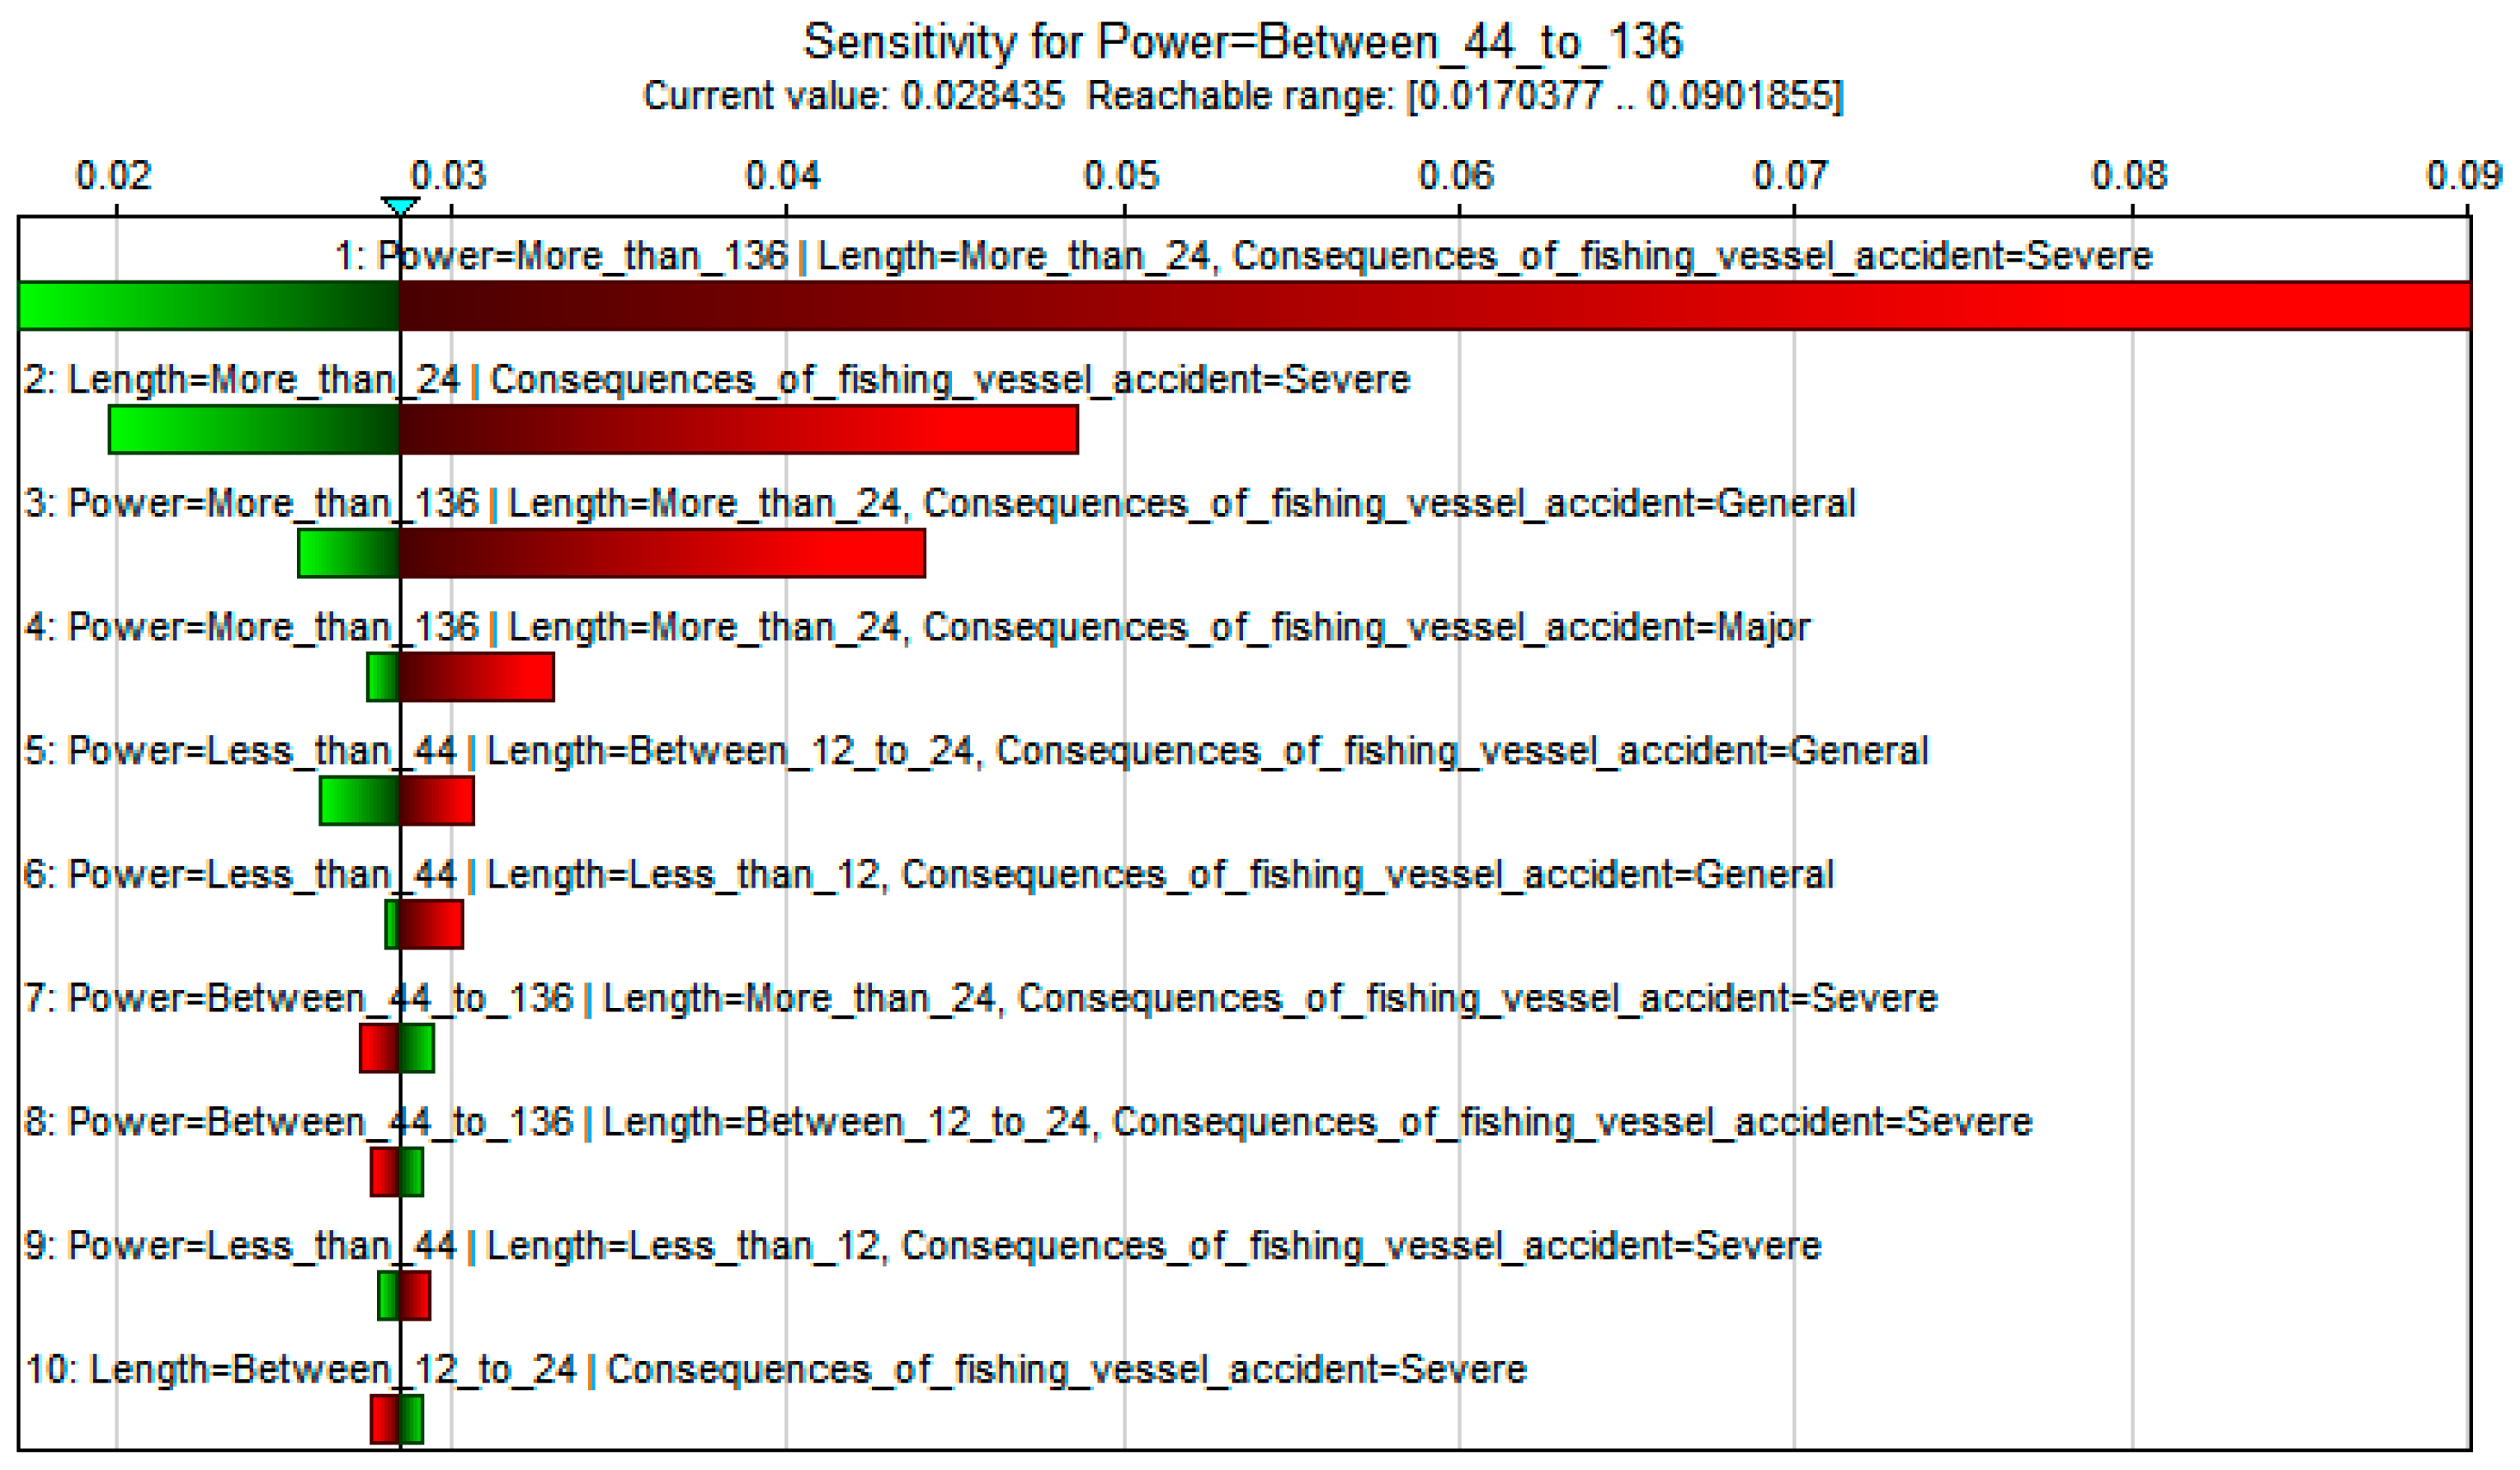
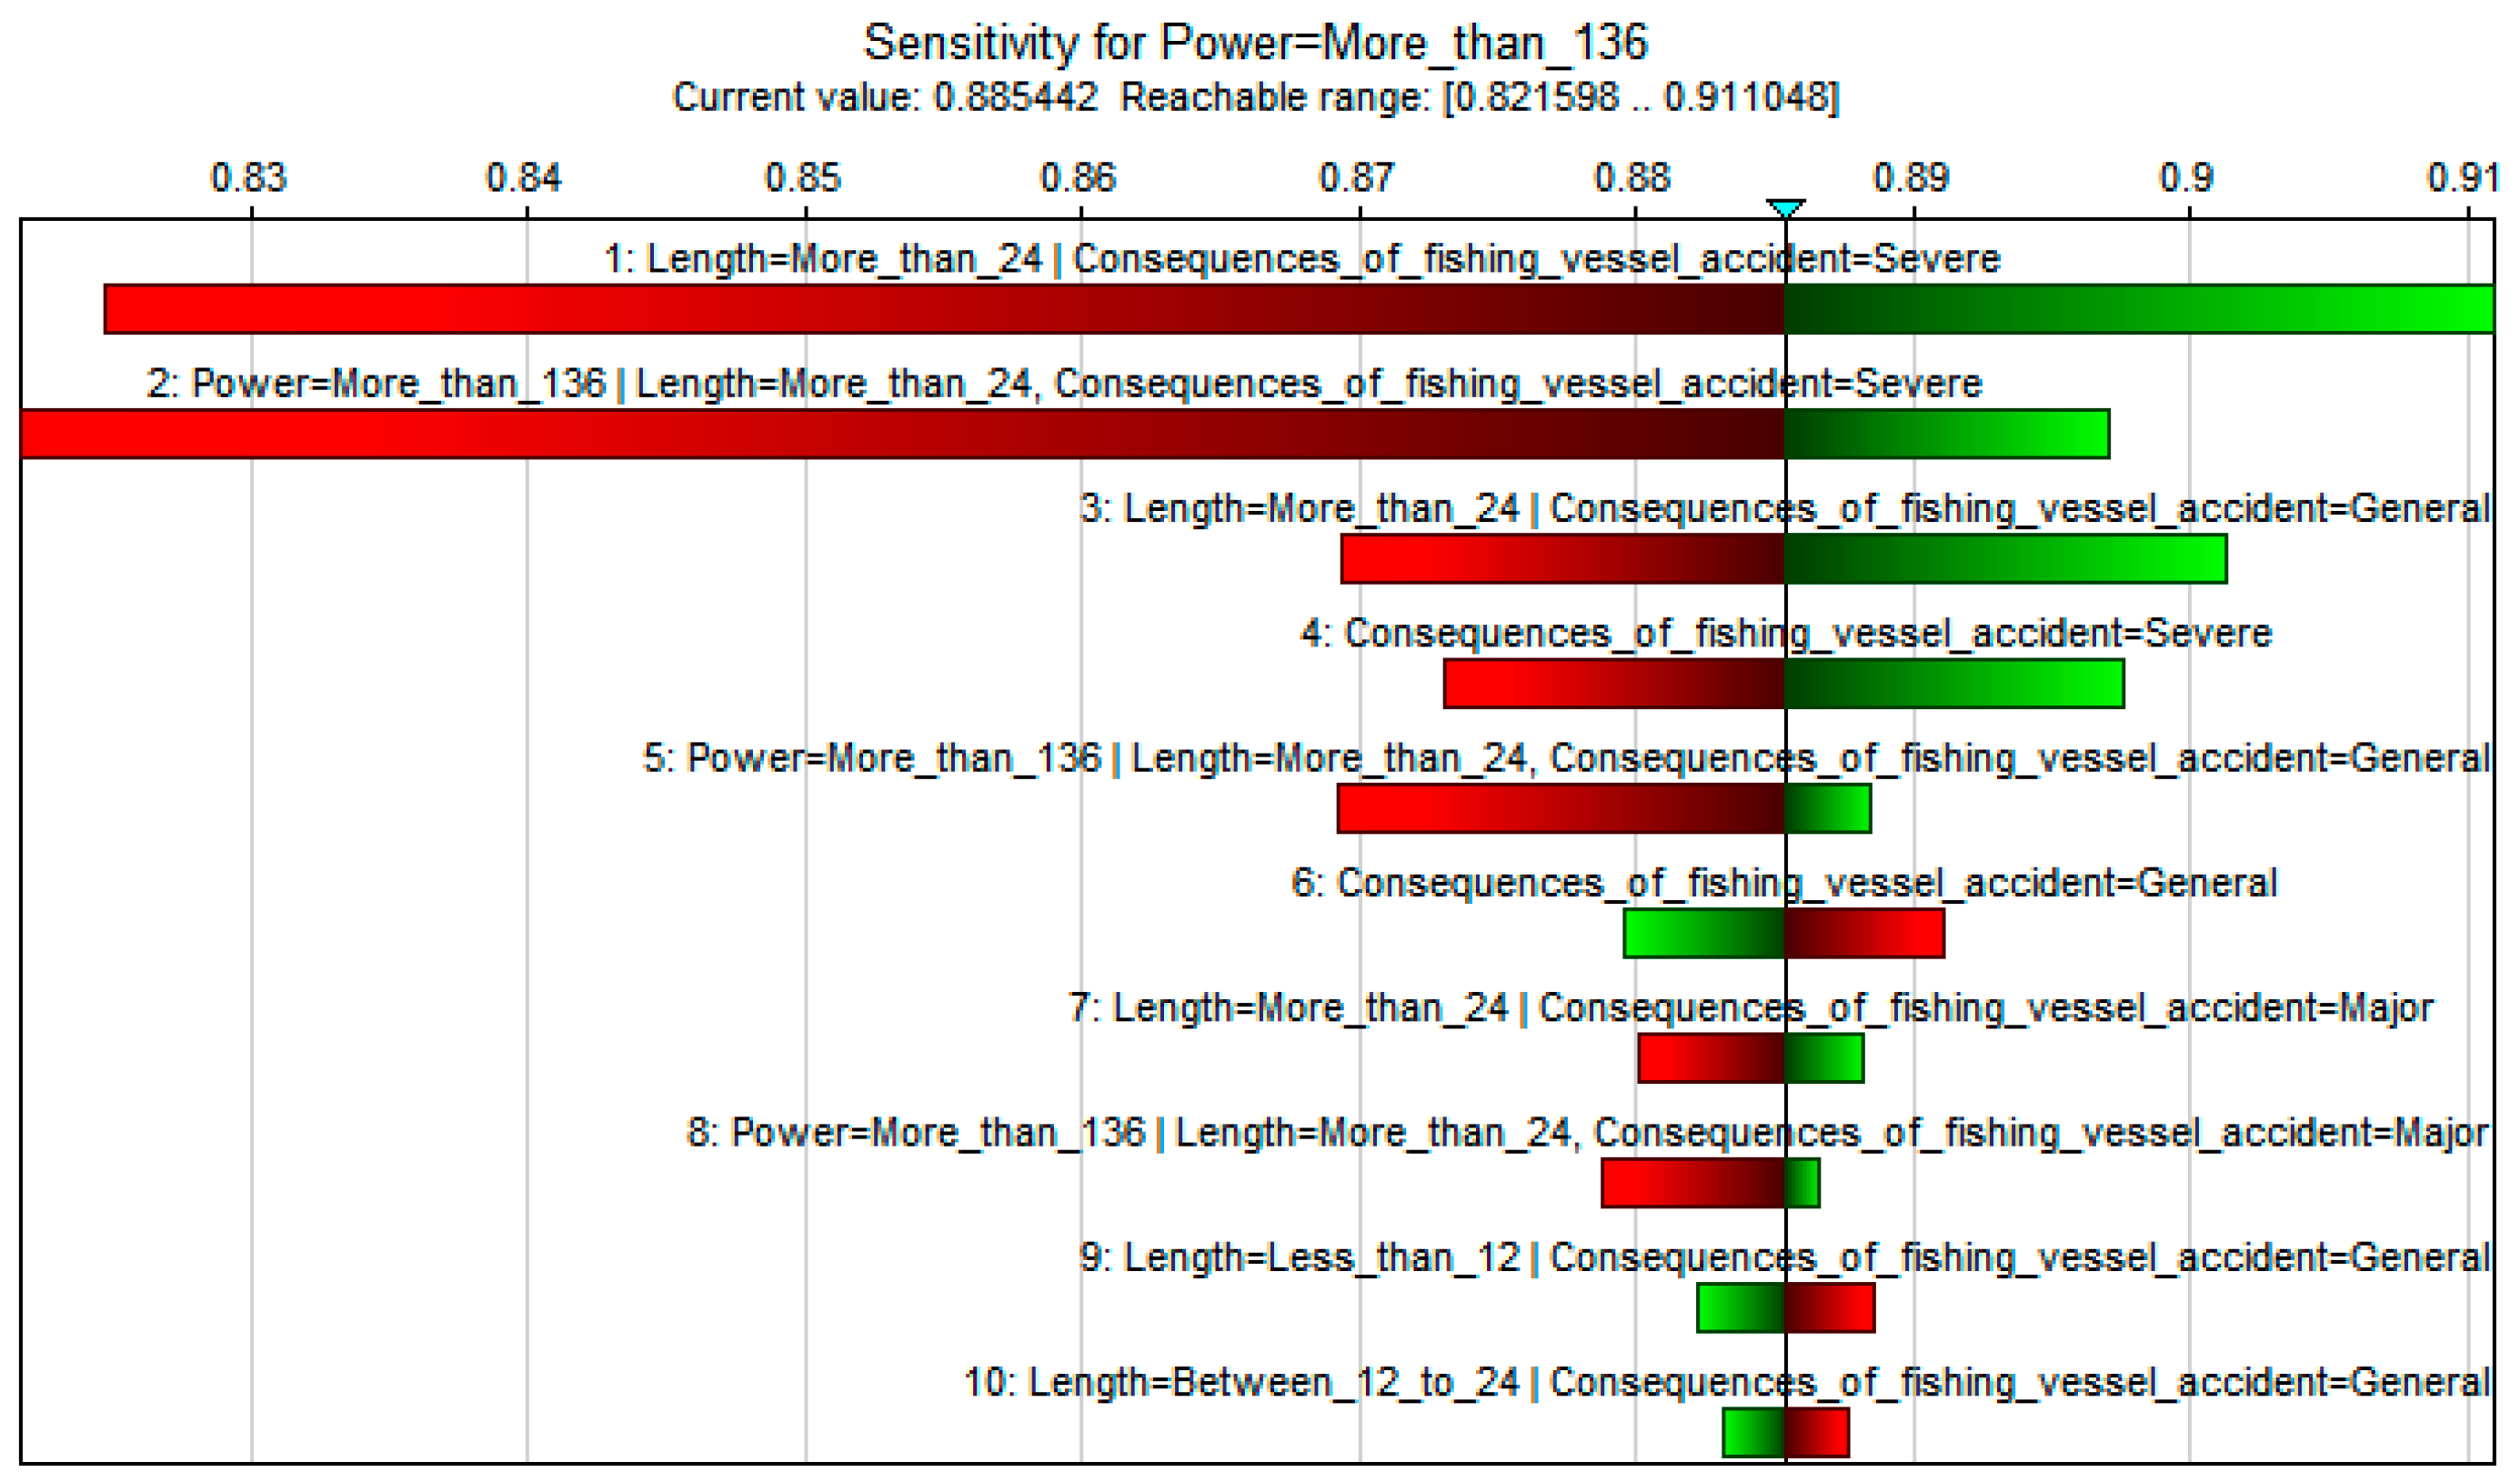
5.3.2. Sensitivity Analysis
5.4. Model Validation
5.4.1. Model Accuracy
5.4.2. Model Prediction Performance Test
5.4.3. Model Consistency Test
5.4.4. Case Verification
6. Discussion and Conclusions
6.1. Discussion
6.2. Conclusions
- (1)
- The 11 predominant factors for fishing vessel accidents were identified, including operation mode, season, age, accident type, wind, gross tonnage, time of day, human factors, power, accident locations, and length. Post-model sensitivity analysis further distilled the core factors to six: power, length, gross tonnage, operation mode, accident type, and human factors.
- (2)
- The data-driven Bayesian model incorporates an enhanced approach, achieving an impressive 89% prediction accuracy based on real-world case studies. This makes it a reliable tool for accident prevention.
- (3)
- The model provides comprehensive information for regulatory authorities and other stakeholders, delivering crucial insights for monitoring the conditions of fishing vessels and creating pertinent policies to ensure maritime safety during fishing operations.
Author Contributions
Funding
Institutional Review Board Statement
Informed Consent Statement
Data Availability Statement
Acknowledgments
Conflicts of Interest
References
- Jaremin, B.; Kotulak, E. Mortality in the Polish small-scale fishing industry. Occup. Med. 2004, 54, 258–260. [Google Scholar] [CrossRef]
- Jin, D.; Thunberg, E. An analysis of fishing vessel accidents in fishing areas off the northeastern United States. Saf. Sci. 2005, 43, 523–540. [Google Scholar] [CrossRef]
- FAO. World Review of Fisheries and Aquaculture, the State of World Fisheries and Aquaculture; Food and Agriculture Organization of the United Nations: Rome, Italy, 2014. [Google Scholar]
- Zhang, G.; Thai, V.V. Expert elicitation and Bayesian Network modeling for shipping accidents: A literature review. Saf. Sci. 2016, 87, 53–62. [Google Scholar] [CrossRef]
- Cao, Y.; Wang, X.; Wang, Y.; Fan, S.; Wang, H.; Yang, Z.; Liu, Z.; Wang, J.; Shi, R. Analysis of factors affecting the severity of marine accidents using a data-driven Bayesian network. Ocean Eng. 2023, 269, 113563. [Google Scholar] [CrossRef]
- Wang, L.; Yang, Z. Bayesian network modelling and analysis of accident severity in waterborne transportation: A case study in China. Reliab. Eng. Syst. Saf. 2018, 180, 277–289. [Google Scholar] [CrossRef]
- Li, H.; Ren, X.; Yang, Z. Data-driven Bayesian network for risk analysis of global maritime accidents. Reliab. Eng. Syst. Saf. 2018, 230, 8938. [Google Scholar] [CrossRef]
- National Research Council. Fishing Vessel Safety: Blueprint for a National Program; The National Academies Press: Washington, DC, USA, 1991. [Google Scholar]
- Amir, W.M.; Gobi, K.V.; Kasypi, M.; NurFadhlina, H.; Azlida, A. Comprehensive analysis of the factors that affecting inefficient management of vessels using LRM. Int. J. Eng. Appl. Sci. 2014, 5, 1–15. [Google Scholar]
- Talley, W.K. The safety of sea transport: Determinants of crew injuries. Appl. Econ. 1999, 31, 1365–1372. [Google Scholar] [CrossRef]
- Celik, M.; Cebi, S. Analytical HFACS for investigating human errors in shipping accidents. Accid. Anal. Prev. 2009, 41, 66–75. [Google Scholar] [CrossRef]
- Kose, E.K.; Dincer, A.C.; Durukanoglu, H.F. Risk Assessment of Fishing Vessels. Tr. J. Eng. Environ. Sci. 1998, 22, 417–428. [Google Scholar]
- Wróbel, K.; Montewka, J.; Kujala, P. Towards the assessment of potential impact of unmanned vessels on maritime transportation safety. Reliab. Eng. Syst. Saf. 2017, 165, 155–169. [Google Scholar] [CrossRef]
- Wang, H.; Liu, Z.; Wang, X.; Graham, T.; Wang, J. An analysis of factors affecting the severity of marine accidents. Reliab. Eng. Syst. Saf. 2021, 210, 107513. [Google Scholar] [CrossRef]
- Obeng, F.; Domeh, V.; Khan, F.; Bose, N.; Sanli, E. Capsizing accident scenario model for small fishing trawler. Saf. Sci. 2022, 145, 105500. [Google Scholar] [CrossRef]
- Lazakis, I.; Kurt, R.E.; Turan, O. Contribution of human factors to fishing vessel accidents and near misses in the UK. J. Shipp. Ocean. Eng. 2014, 4, 245–261. [Google Scholar]
- Jin, D. The determinants of fishing vessel accident severity. Accid. Anal. Prev. 2014, 66, 1–7. [Google Scholar] [CrossRef] [PubMed]
- Jin, D.; Kite-Powell, H.L.; Thunberg, E.; Solow, A.R.; Talley, W.K. A model of fishing vessel accident probability. J. Saf. Res. 2002, 33, 497–510. [Google Scholar] [CrossRef] [PubMed]
- Çakır, E.; Fışkın, R.; Sevgili, C. Investigation of tugboat accidents severity: An application of association rule mining algorithms. Reliab. Eng. Syst. Saf. 2021, 209, 107470. [Google Scholar] [CrossRef]
- Uğurlu, F.; Yıldız, S.; Boran, M.; Uğurlu, Ö.; Wang, J. Analysis of fishing vessel accidents with Bayesian network and Chi-square methods. Ocean Eng. 2020, 198, 106956. [Google Scholar] [CrossRef]
- Wang, J.; Pillay, A.; Kwon, Y.; Wall, A.; Loughran, C. An analysis of fishing vessel accidents. Accid. Anal. Prev. 2005, 37, 1019–1024. [Google Scholar] [CrossRef]
- Obeng, F.; Domeh, V.; Khan, F.; Bose, N.; Sanli, E. Analyzing operational risk for small fishing vessels considering crew effectiveness. Ocean Eng. 2005, 249, 110512. [Google Scholar] [CrossRef]
- Roberts, E.S. Occupational mortality in British commercial fishing, 1976–1995. Occup. Environ. Med. 2004, 61, 16–23. [Google Scholar]
- Laursen, L.H.; Hansen, H.L.; Jensen, O.C. Fatal occupational accidents in Danish fishing vessels 1989–2005. Int. J. Inj. Control Saf. Promot. 2008, 15, 109–117. [Google Scholar] [CrossRef]
- Davis, B.; Colbourne, B.; Molyneux, D. Analysis of fishing vessel capsizing causes and links to operator stability training. Saf. Sci. 2019, 118, 355–363. [Google Scholar] [CrossRef]
- Heij, C.; Knapp, S. Effects of wind strength and wave height on ship incident risk: Regional trends and seasonality. Transp. Res. Part D Transp. Environ. 2015, 37, 29–39. [Google Scholar] [CrossRef]
- Weng, J.; Yang, D. Investigation of shipping accident injury severity and mortality. Accid. Anal. Prev. 2015, 76, 92–101. [Google Scholar] [CrossRef]
- Rezaee, S.; Pelot, R.; Ghasemi, A. The effect of extreme weather conditions on commercial fishing activities and vessel incidents in Atlantic Canada. Ocean Coast. Manag. 2016, 130, 115–127. [Google Scholar] [CrossRef]
- Liu, K.; Yu, Q.; Yuan, Z.; Yang, Z.; Shu, Y. A systematic analysis for maritime accidents causation in Chinese coastal waters using machine learning approaches. Ocean Coast. Manag. 2021, 213, 105859. [Google Scholar] [CrossRef]
- Özaydın, E.; Fışkın, R.; Uğurlu; Wang, J. A hybrid model for marine accident analysis based on Bayesian Network (BN) and Association Rule Mining (ARM). Ocean Eng. 2022, 247, 110705. [Google Scholar] [CrossRef]
- Antão, P.; Soares, C.G. Analysis of the influence of human errors on the occurrence of coastal ship accidents in different wave conditions using Bayesian Belief Networks. Accid. Anal. Prev. 2019, 133, 105262. [Google Scholar] [CrossRef]
- Khan, B.R.; Yin, J.; Mustafa, F.H.; Liu, H. Risk assessment and decision support for sustainable traffic safety in Hong Kong waters. IEEE Access 2020, 8, 72893–72909. [Google Scholar] [CrossRef]
- Zhang, J.; Teixeira, P.; Soares, C.G.; Yan, X.; Liu, K. Maritime Transportation Risk Assessment of Tianjin Port with Bayesian Belief Networks. Risk Anal. 2016, 36, 1171–1187. [Google Scholar] [CrossRef]
- Khan, B.; Khan, F.; Veitch, B. A Dynamic Bayesian Network model for ship-ice collision risk in the Arctic waters. Saf. Sci. 2020, 130, 104858. [Google Scholar] [CrossRef]
- Fan, S.; Yang, Z.; Blanco-Davis, E.; Zhang, J.; Yan, X. Analysis of maritime transport accidents using Bayesian networks. Proc. Inst. Mech. Eng. Part O J. Risk Reliab. 2020, 234, 439–454. [Google Scholar] [CrossRef]
- Uğurlu, Ö.; Yıldız, S.; Loughney, S.; Wang, J.; Kuntchulia, S.; Sharabidze, I. Analysing of Collision, Grounding and Sinking Accident Occurring in the Black Sea Utilizing HFACS and Bayesian Networks. Risk Anal. 2020, 40, 2610–2638. [Google Scholar] [CrossRef] [PubMed]
- Yu, Q.; Teixeira, P.; Liu, K.; Rong, H.; Soares, C.G. An integrated dynamic ship risk model based on Bayesian Networks and Evidential Reasoning. Reliab. Eng. Syst. Saf. 2021, 216, 107993. [Google Scholar] [CrossRef]
- Fan, S.; Blanco-Davis, E.; Yang, Z.; Zhang, J.; Yan, X. Incorporation of human factors into maritime accident analysis using a data-driven Bayesian network. Reliab. Eng. Syst. Saf. 2020, 203, 107070. [Google Scholar] [CrossRef]
- Breiman, L. Random forests. Mach. Learn. 2001, 45, 5–32. [Google Scholar] [CrossRef]
- Ahmed, M.M.; Abdel-Aty, M.A. The viability of using automatic vehicle identification data for real-time crash prediction. IEEE Trans. Intell. Transp. Syst. 2012, 13, 459–465. [Google Scholar] [CrossRef]
- Blau, G.; Scornet, E. A random forest guided tour. Test 2016, 25, 197–227. [Google Scholar] [CrossRef]
- Chow, C.; Liu, C. Approximating discrete probability distributions with dependence trees. IEEE Trans. Inf. Theory 1968, 14, 462–467. [Google Scholar] [CrossRef]
- Zou, X.; Yue, W.L. A Bayesian Network Approach to Causation Analysis of Road Accidents Using Netica. J. Adv. Transp. 2017, 2017, 2525481. [Google Scholar] [CrossRef]
- Friedman, N.; Geiger, D.; Goldszmidt, M. Bayesian Network Classifiers. Mach. Learn. 1997, 29, 131–163. [Google Scholar] [CrossRef]
- Yang, Z.; Yang, Z.; Smith, J.; Robert, B.A.P. Risk analysis of bicycle accidents: A Bayesian approach. Reliab. Eng. Syst. Saf. 2021, 209, 107460. [Google Scholar] [CrossRef]
- Wang, S.; Yan, R.; Qu, X. Development of a non-parametric classifier: Effective identification, algorithm, and applications in port state control for maritime transportation. Transp. Res. Part B Methodol. 2021, 128, 129–157. [Google Scholar] [CrossRef]
- Ji, Z.; Xia, Q.; Meng, G. A Review of Parameter Learning Methods in Bayesian Network. Adv. Intell. Comput. Theor. Appl. 2015, 11, 3–12. [Google Scholar] [CrossRef]
- Swaminathan, H.; Gifford, J.A. Bayesian Estimation in the Rasch Model. J. Educ. Stat. 1982, 7, 175–191. [Google Scholar] [CrossRef]
- Landis, J.R.; Koch, G.G. The Measurement of Observer Agreement for Categorical Data. Biometrics 1977, 33, 159–174. [Google Scholar] [CrossRef]
- Fleiss, J.L. Measuring nominal scale agreement among many raters. Psychol. Bull. 1971, 76, 378–382. [Google Scholar] [CrossRef]

| RIFs | Number of References | References |
|---|---|---|
| Time of day | 14 | Cao et al. [5], Wang et al. [6], Li et al. [7], Jin [8], Lazakis et al. [14], Weng et al. [19], Liu et al. [21], Wang et al. [22], Antão et al. [31], Khan et al. [32], Zhang et al. [33], Khan et al. [34], Fan et al. [35], Uğurlu et al. [36], |
| Age | 9 | Jin [8], Uğurlu et al. [11], Heij et al. [18], Liu et al. [21], Wang et al. [22], Khan et al. [32], Fan et al. [35], Yu et al. [37], Fan et al. [38] |
| Wind | 13 | Jin et al. [2], Cao et al. [5], Wang et al. [6], Li et al. [7], Jin [8], Jin et al. [9], Wang et al. [12], Heij et al. [18], Rezaee et al. [20], Wang et al. [22], Obeng et al. [29], Khan et al. [32], Yu et al. [37] |
| Accident locations | 12 | Jin et al. [2], Cao et al. [5], Wang et al. [6], Jin [8], Jin et al. [9], Wang et al. [12], Lazakis et al. [14], Weng et al. [19], Wang et al. [22], Antão et al. [31], Khan et al. [32], Zhang et al. [33] |
| Sea condition | 5 | Cao et al. [5], Li et al. [7], Fan et al. [35], Yu et al. [37], Fan et al. [38] |
| Gross tonnage | 10 | Cao et al. [5], Wang et al. [6], Li et al. [7], Jin [8], Heij et al. [18], Liu et al. [21], Wang et al. [22], Fan et al. [35], Yu et al. [37], Fan et al. [38] |
| Length | 7 | Jin et al. [2], Wang et al. [6], Li et al. [7], Wang et al. [12], Liu et al. [21], Fan et al. [35], Fan et al. [38] |
| Power | 3 | Li et al. [7], Liu et al. [21], Wang et al. [22] |
| Width | 2 | Li et al. [7], Liu et al. [21] |
| Accident type | 9 | Cao et al. [5], Wang et al. [6], Jin et al. [9], Laursen et al. [16], Weng et al. [19], Liu et al. [21], Wang et al. [22], Antão et al. [31], Khan et al. [32] |
| Season | 8 | Jin et al. [2], Wang et al. [6], Jin [8], Wang et al. [12], Heij et al. [18], Liu et al. [21], Khan et al. [32], Zhang et al. [33] |
| Human factors | 9 | Cao et al. [5], Wang et al. [6], Li et al. [7], Uğurlu et al. [11], Obeng et al. [13], Obeng et al. [29], Antão et al. [31], Uğurlu et al. [36] |
| Visibility | 9 | Cao et al. [5], Wang et al. [6], Li et al. [7], Wang et al. [22], Liu et al. [29], Khan et al. [32], Zhang et al. [33], Khan et al. [34], Yu et al. [37] |
| Hull type | 6 | Wang et al. [6], Li et al. [7], Jin [8], Liu et al. [21], Fan et al. [35], Fan et al. [38] |
| Crew | 7 | Cao et al. [5], Wang et al. [6], Uğurlu et al. [11], Lazakis et al. [14], Weng et al. [19], Wang et al. [22], Khan et al. [32] |
| Equipment | 4 | Li et al. [7], Lazakis et al. [14], Fan et al. [35], Fan et al. [38] |
| Vessel type | 12 | Cao et al. [5], Wang et al. [6], Li et al. [7], Lazakis et al. [14], Weng et al. [19], Liu et al. [21], Wang et al. [22], Antão et al. [31], Khan et al. [32], Zhang et al. [33], Fan et al. [35], Yu et al. [37] |
| Number | RIFs | Description | Value |
|---|---|---|---|
| Fishing vessel-related factors | |||
| 1 | Operation mode | Single_trawl; Double_trawl; Gill_net; Fishing_transport; Others | 1, 2, 3, 4, 5 |
| 2 | Length (m) | Less_than_12; Between_12_to_24; More_than_24 | 1, 2, 3 |
| 3 | Width (m) | Less_than_2; Between_2_to_6; More_than_6 | 1, 2, 3 |
| 4 | Age (years) | Less_than_10; Between_10_to_20; More_than_20 | 1, 2, 3 |
| 5 | Power (kW) | Less_than_44; Between_44_to_136; More_than_136 | 1, 2, 3 |
| 6 | Hull type | Steel; wood | 1, 2, 3 |
| 7 | Gross tonnage (GT) | Less_than_100; Between_100_to_200; More_than_200 | 1, 2, 3 |
| 8 | Crew | Yes/No Manned as per regulations with an adequate/inadequate number of crew members holding valid certifications and qualifications | 1, 2 |
| 9 | Equipment | Yes/No Outfitted as per regulations with sufficient/insufficient fire-fighting, positioning, and emergency provisions. | 1, 2 |
| Environment-related factors | |||
| 10 | Wind (Beaufort Scale) | Less_than_4; Between_4_to_6; More_than_6 | 1, 2, 3 |
| 11 | Visibility (m) | Good: ≥1000; Poor: <1000 | 1, 2 |
| 12 | Time of day | Daytime: 07:00–18:59; Night: 19:00–06:59 | 1, 2 |
| 13 | Season | Spring; Summer; Autumn; Winter | 1, 2, 3, 4 |
| 14 | Sea condition (m) | Good: wave height < 2.5; Poor: wave height ≥ 2.5 | 1, 2 |
| Accident-related factors | |||
| 15 | Human factors | Yes/No This accident was caused by human violations or errors, such as fatigue, inadequate lookout, errors in judgment, improper operation, lack of experience or training, management and supervision deficiencies, etc. | 1, 2 |
| 16 | Accident locations | Near-shore: <3 nautical miles; Offshore | 1, 2 |
| 17 | Accident type | Collision; Contact damage; Wind damage; Fire; Mechanical failure; Others | 1, 2, 3, 4, 5, 6 |
| Actual Positive | Actual Negative | |
|---|---|---|
| Predicted Positive | True Positive (TP) | False Positive (FP) |
| Predicted Negative | False Negative (FN) | True Negative (TN) |
| Variables | Importance Score |
|---|---|
| Season | 0.1312 |
| Accident type | 0.1301 |
| Human factors | 0.1285 |
| Operation mode | 0.1095 |
| Wind | 0.0841 |
| Age | 0.0788 |
| Gross tonnage | 0.0701 |
| Length | 0.0495 |
| Accident locations | 0.0482 |
| Time of day | 0.0426 |
| Power | 0.0401 |
| Equipment | 0.0371 |
| Visibility | 0.0326 |
| Width | 0.0311 |
| Crew | 0.0271 |
| Sea condition | 0.0241 |
| Hull type | 0.0190 |
| Parent Node | Child Node | Average | Maximum | Weighted |
|---|---|---|---|---|
| Length | Power | 0.654292 | 0.979383 | 0.654292 |
| Length | Gross tonnage | 0.521862 | 0.834658 | 0.521862 |
| Gross tonnage | Operation mode | 0.385448 | 0.691647 | 0.385448 |
| Gross tonnage | Age | 0.362153 | 0.501135 | 0.362153 |
| Gross tonnage | Accident type | 0.273512 | 0.502921 | 0.273512 |
| Consequences_of_fishing_vessel_accident | Accident type | 0.252898 | 0.450760 | 0.252898 |
| Accident type | Wind | 0.237504 | 0.681575 | 0.237504 |
| Accident type | Human factors | 0.222467 | 0.556150 | 0.222467 |
| Consequences_of_fishing_vessel_accident | Accident locations | 0.218301 | 0.659821 | 0.218301 |
| Accident type | Season | 0.215234 | 0.522913 | 0.215234 |
| Consequences_of_fishing_vessel_accident | Season | 0.207052 | 0.540938 | 0.207052 |
| Consequences_of_fishing_vessel_accident | Gross tonnage | 0.198304 | 0.752166 | 0.198304 |
| Operation mode | Accident locations | 0.188381 | 0.457970 | 0.188381 |
| Consequences_of_fishing_vessel_accident | Power | 0.187248 | 0.693727 | 0.187248 |
| Operation mode | Time of day | 0.149066 | 0.416667 | 0.149066 |
| Consequences_of_fishing_vessel_accident | Wind | 0.142269 | 0.351061 | 0.142269 |
| Consequences_of_fishing_vessel_accident | Time of day | 0.133644 | 0.511364 | 0.133644 |
| Consequences_of_fishing_vessel_accident | Age | 0.130558 | 0.298494 | 0.130558 |
| Consequences_of_fishing_vessel_accident | Operation mode | 0.127574 | 0.381621 | 0.127574 |
| Consequences_of_fishing_vessel_accident | Length | 0.112940 | 0.221474 | 0.112940 |
| Consequences_of_fishing_vessel_accident | Human factors | 0.110528 | 0.283077 | 0.110528 |
| Node | Mutual Information | Entropy Reduction Percent/% | Variance of Beliefs |
|---|---|---|---|
| Power | 0.08309 | 7.840 | 0.0223723 |
| Length | 0.07446 | 6.360 | 0.0193670 |
| Gross tonnage | 0.06431 | 5.870 | 0.0161052 |
| Operation mode | 0.04053 | 3.500 | 0.0090452 |
| Accident type | 0.03541 | 3.180 | 0.0033807 |
| Human factors | 0.02873 | 1.460 | 0.0004962 |
| Age | 0.00767 | 0.757 | 0.0012194 |
| Wind | 0.00626 | 0.156 | 0.0012789 |
| Accident locations | 0.00499 | 0.140 | 0.0050074 |
| Season | 0.00195 | 0.133 | 0.0001943 |
| Time of day | 0.00052 | 0.015 | 0.0000040 |
| General | Severe | Major | Critical | |
|---|---|---|---|---|
| Variables | 23% | 68% | 7% | 2% |
| Power | ||||
| <44 | 75% (52↑) | 21% (−47↓) | 2% (−5↓) | 3% (1↑) |
| 44 to 136 | 58% (35↑) | 32% (−36↓) | 8% (1↑) | 2% (0-) |
| >136 | 20% (−3↓) | 71% (3↑) | 7% (0-) | 2% (0-) |
| Length | ||||
| <12 | 63% (40↑) | 31% (−37↓) | 4% (−3↓) | 2% (0-) |
| 12 to 24 | 33% (10↑) | 58% (−10↓) | 6% (−1↓) | 3% (1↑) |
| >24 | 18% (−5↓) | 72% (4↑) | 8% (1↑) | 2% (0-) |
| Gross tonnage | ||||
| <100 | 56% (33↑) | 36% (−32↓) | 6% (−1↓) | 2% (0-) |
| 100 to 200 | 20% (−3↓) | 70% (2↑) | 7% (0-) | 3% (1↑) |
| >200 | 19% (−4↓) | 72% (4↑) | 8% (1↑) | 1% (−1↓) |
| Operation mode | ||||
| Single trawl | 19% (−4↓) | 73% (4↑) | 7% (0-) | 2% (0-) |
| Double trawl | 20% (−3↓) | 71% (3↑) | 8% (1↑) | 1% (−1↓) |
| Gill net | 47% (24↑) | 46% (−22↓) | 4% (−3↓) | 3% (1↑) |
| Fishing transport | 14% (−9↓) | 77% (9↑) | 7% (0-) | 2% (0-) |
| Others | 31% (8↑) | 61% (−7↓) | 8% (0-) | 1% (−1↓) |
| Accident type | ||||
| Collision | 24% (1↑) | 70% (2↑) | 5% (−2↓) | 1% (−1↓) |
| Contact damage | 23% (0-) | 71% (3↑) | 5% (−2↓) | 1% (−1↓) |
| Wind damage | 60% (37↑) | 30% (−38↓) | 5% (−2↓) | 5% (3↑) |
| Fire | 18% (−5↓) | 60% (−8↓) | 18% (11↑) | 4% (2↑) |
| Mechanical failure | 9% (−14↓) | 75% (7↑) | 15% (8↑) | 1% (−1↓) |
| Others | 37% (14↑) | 45% (−23↓) | 8(1↑) | 10% (8↑) |
| Human factors | ||||
| Yes | 23% (0-) | 71% (3↑) | 5% (−2↓) | 1% (−1↓) |
| No | 24% (1↑) | 64% (−4↓) | 9% (2↑) | 3% (1↑) |
| Power | 5% | 5% | 5% | 5% | 5% | 5% |
|---|---|---|---|---|---|---|
| Length | 5% | 5% | 5% | 5% | 5% | |
| Gross tonnage | 5% | 5% | 5% | 5% | ||
| Operation mode | 5% | 5% | 5% | |||
| Accident type | 5% | 5% | ||||
| Human factors | 5% | |||||
| General (23%) | 26.1 | 28.4 | 30.6 | 32.2 | 33.4 | 33.7 |
| Severe (68%) | 69.8 | 72.1 | 72.2 | 72.5 | 72.8 | 73.2 |
| Major (7%) | 7.29 | 7.37 | 7.53 | 7.75 | 8.8 | 8.97 |
| Critical (2%) | 2.04 | 2.11 | 2.16 | 2.22 | 3.05 | 3.10 |
| Actual | General | Severe | Major | Critical | Total | Accuracy (%) | |
|---|---|---|---|---|---|---|---|
| Predicted | |||||||
| General | 129 | 15 | 14 | 2 | 160 | 80.6 | |
| Severe | 32 | 414 | 25 | 11 | 482 | 85.9 | |
| Major | 2 | 1 | 35 | 2 | 40 | 87.5 | |
| Critical | 0 | 1 | 1 | 6 | 8 | 75.0 | |
| Total | 163 | 431 | 75 | 21 | 690 | 84.6 | |
| General | Severe | Major | Critical | |
|---|---|---|---|---|
| Precision | 0.791 | 0.961 | 0.468 | 0.240 |
| Recall | 0.806 | 0.859 | 0.875 | 0.750 |
| F-measure | 0.799 | 0.907 | 0.608 | 0.363 |
| Specificity | 0.935 | 0.918 | 0.938 | 0.972 |
| FPR | 0.064 | 0.081 | 0.061 | 0.027 |
| RIFs | State | RIFs | State |
|---|---|---|---|
| Operation mode | Gill net | Accident type | Contact damage |
| Age | 15 | Gross tonnage | 285 |
| Wind | 6.5 | Season | Summer |
| Power | 220 | Accident locations | Offshore |
| Human factors | Yes | Time of day | Night |
| Length | 28.5 |
Disclaimer/Publisher’s Note: The statements, opinions and data contained in all publications are solely those of the individual author(s) and contributor(s) and not of MDPI and/or the editor(s). MDPI and/or the editor(s) disclaim responsibility for any injury to people or property resulting from any ideas, methods, instructions or products referred to in the content. |
© 2023 by the authors. Licensee MDPI, Basel, Switzerland. This article is an open access article distributed under the terms and conditions of the Creative Commons Attribution (CC BY) license (https://creativecommons.org/licenses/by/4.0/).
Share and Cite
Wang, F.; Du, W.; Feng, H.; Ye, Y.; Grifoll, M.; Liu, G.; Zheng, P. Identification of Risk Influential Factors for Fishing Vessel Accidents Using Claims Data from Fishery Mutual Insurance Association. Sustainability 2023, 15, 13427. https://doi.org/10.3390/su151813427
Wang F, Du W, Feng H, Ye Y, Grifoll M, Liu G, Zheng P. Identification of Risk Influential Factors for Fishing Vessel Accidents Using Claims Data from Fishery Mutual Insurance Association. Sustainability. 2023; 15(18):13427. https://doi.org/10.3390/su151813427
Chicago/Turabian StyleWang, Fang, Weijie Du, Hongxiang Feng, Yun Ye, Manel Grifoll, Guiyun Liu, and Pengjun Zheng. 2023. "Identification of Risk Influential Factors for Fishing Vessel Accidents Using Claims Data from Fishery Mutual Insurance Association" Sustainability 15, no. 18: 13427. https://doi.org/10.3390/su151813427
APA StyleWang, F., Du, W., Feng, H., Ye, Y., Grifoll, M., Liu, G., & Zheng, P. (2023). Identification of Risk Influential Factors for Fishing Vessel Accidents Using Claims Data from Fishery Mutual Insurance Association. Sustainability, 15(18), 13427. https://doi.org/10.3390/su151813427