1. Introduction
The current context of mobility is characterized by an increasing demand for sustainable, flexible, and integrated mobility services. Mobility as a service (MaaS) represents a promising solution to achieve these new mobility goals. In 2016, the European Environment Agency found that transportation systems account for 25% of total CO
2 emissions from human activities in Europe [
1]. Automobiles account for 60.7% of that percentage. In some areas of the world, high population growth rates and hyper-urbanization increase the negative externalities of road transport, i.e., local pollutants, greenhouse gas emissions, and congestion in urban areas. In recent years, mobility has changed profoundly, moving towards post-Fordian models. As environmental issues and the use of public space are gaining increasing attention, citizens tend to choose more eco-friendly and flexible solutions for their mobility. Alternative means are being explored particularly in terms of public transport and shared mobility. Flexible and reliable public transport is increasingly in demand, taking into consideration that the quality of public services [
2] does not always reflect the standards expected by users. Recent years have seen an increase in the supply and demand for shared mobility [
3]. Millennials seem to be less interested in owning a private car [
4,
5] than people born in the last century. The COVID-19 pandemic has further emphasized the need for more sustainable transportation systems, from the perspective of space, energy, and safety, highlighting the crucial role of technology in improving people’s daily lives [
6]. ICT technologies supporting mobility are constantly evolving, sometimes becoming part of intelligent transportation systems (ITSs) [
7], and services are mostly on-demand. An increasing number of mobility apps are available to facilitate mobility.
In light of the above considerations, the need for a change in mobility services is evident. The emerging paradigm of urban mobility needs to be based on MaaS to help increase the use of public transport, shared mobility services, plug-in services, park-and-ride, and micro-mobility services.
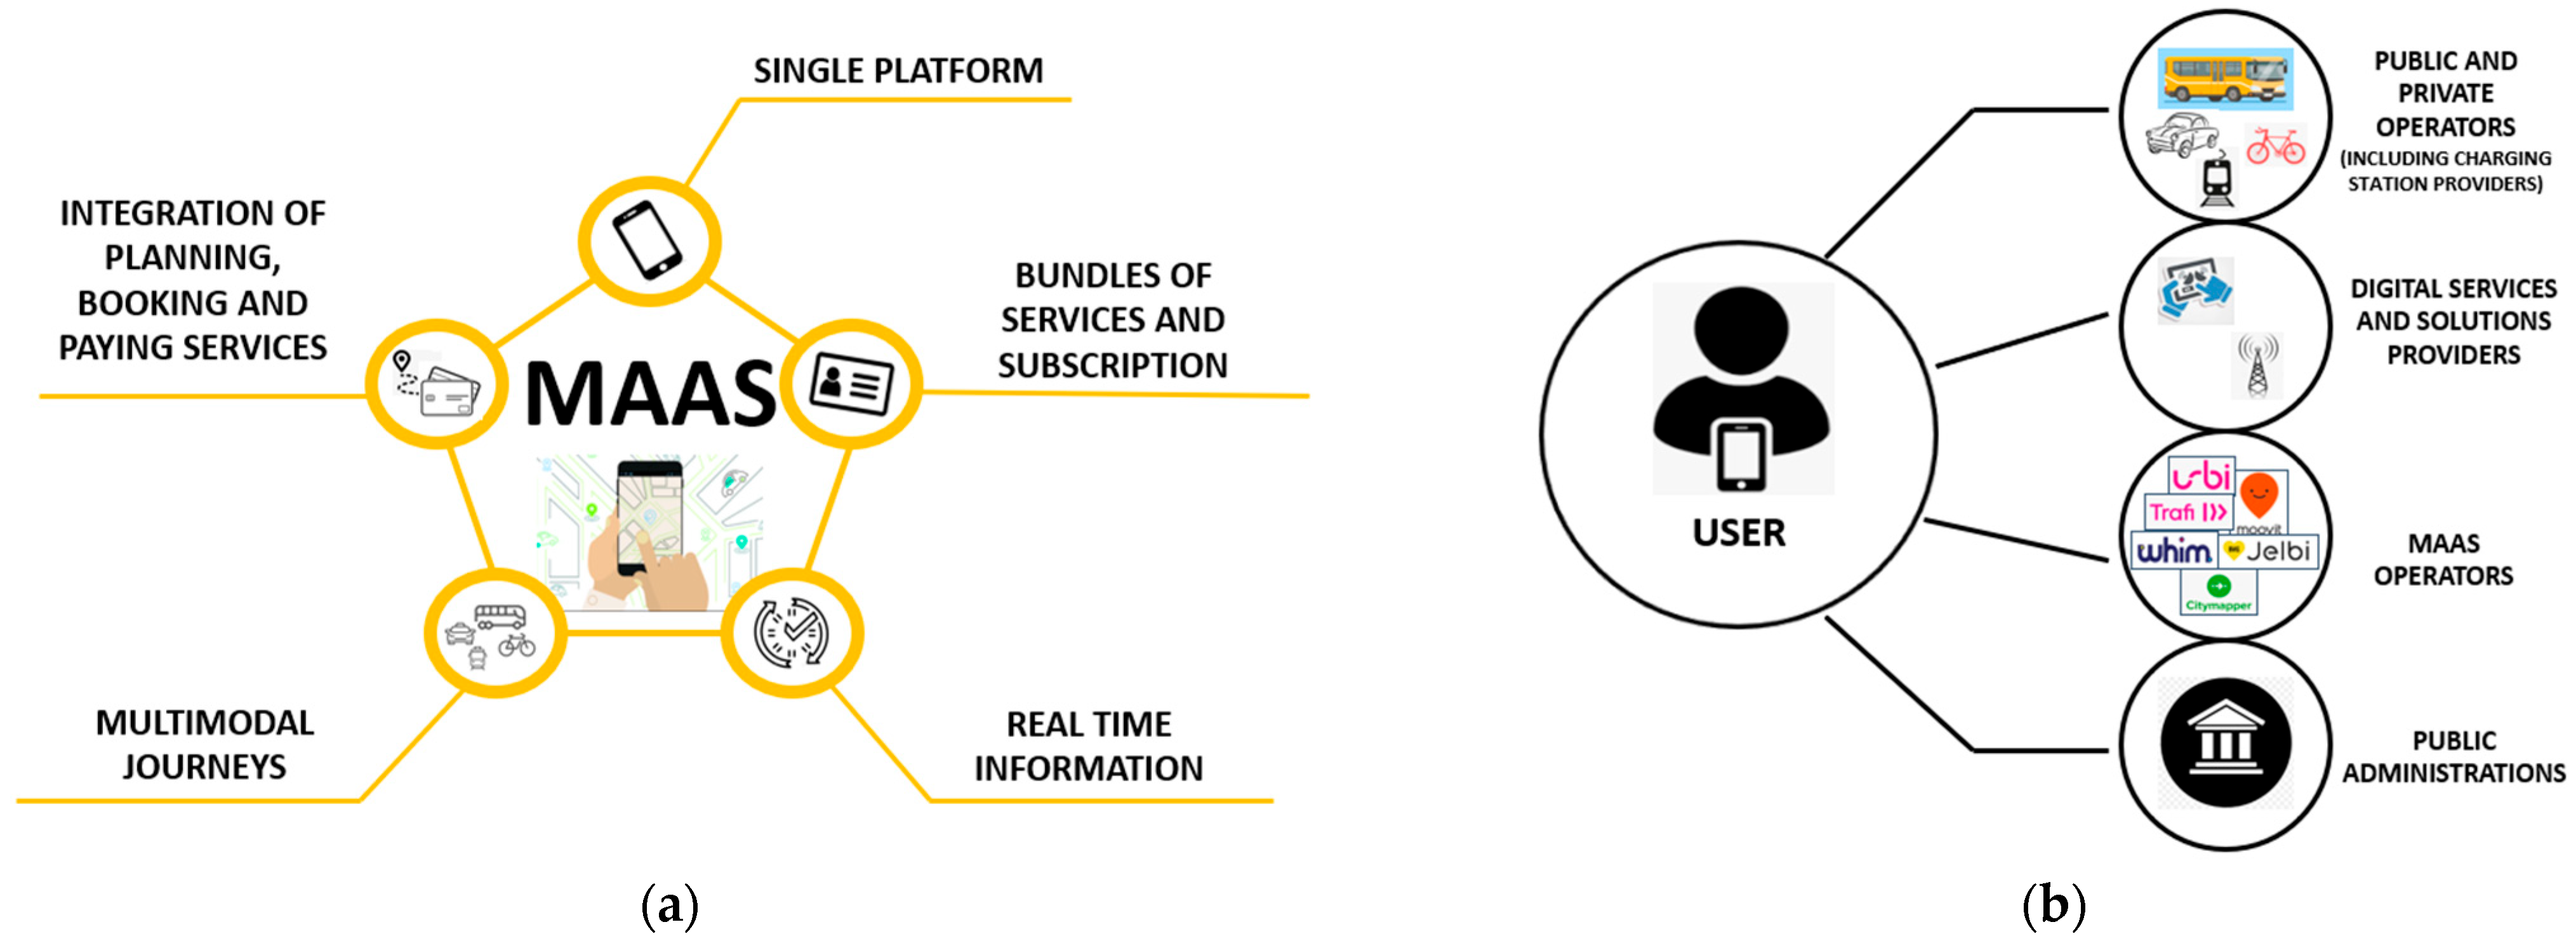
Figure 1 summarises the main features of MaaS, which offers user-friendly digital platforms, designed to provide integrated mobility services. The service should be delivered through a single platform that is typically a smartphone application (or a personal computer connected to the web). Five main actors cooperate to pursue the MaaS objectives to reach social, traffic-related, and environmental goals [
8].
Users are the centre of the ecosystem since their satisfaction is essential. Public and private transport operators represent the core business of the service including different means of transport such as buses, shared mobility services, carpooling, car rentals, and taxis. These four MaaS actors facilitate the match between supply and demand: different transport solutions are put together to create a single integrated offering for end users. This type of service is similar to those provided, for example, in the hotel sector through well-known digital platforms that match demand and aggregate supply of available accommodation solutions. Demand can be segmented in different ways to make the service more efficient. For example, specific offers can be created for students and pensioners, or targeted packages can be offered to the staff of large companies [
9].
The participation of public administration is crucial as it guarantees and regulates the mobility service, and guides the transition to MaaS [
10,
11]. Further important actors are energy providers, who are necessary when electric vehicles are included in MaaS [
12].
The MaaS ecosystem includes a large number of secondary stakeholders, such as insurance companies, investors, trade associations, and universities. These are all entities that are not directly connected to the provision of the service but that can be considered part of the system [
8].
There are several possible configurations of the MaaS ecosystem, depending on where it is implemented. The “Open Ecosystem” (“ecosystem, not egosystem”, [
13]) is frequently considered the winning model to enable the achievement of social, traffic, and environmental objectives: upon verification of some essential prerequisites, any MaaS operator can freely access any transport service available in a given territory. Competition among transport service providers increases the efficiency of the system and helps to achieve a better level of service. In a MaaS open ecosystem, the public entity assumes the role of regulator and enabler; business is based on defined rules that protect competition and enabling services made available to market participants according to fairness and neutrality.
Alongside the concept of mobility as a service, other paradigms are emerging to improve sustainability in the urban environment. One of these paradigms is the “15-min city”, an urban policy that aims to make all services available within 15 min of one’s home [
14,
15]. MaaS initiatives in urban settings can favour the “15-min city” policy by making travel more efficient and integrating different modes of transportation more quickly (local public transport but also shared mobility, especially micro-mobility).
The contribution of this paper is to present the results of the pilot of the BIPforMaaS project, the first highly developed Italian MaaS project with two distinctive features: regional scale and public governance. According to the comparative analysis conducted in this paper, no other current MaaS initiative in Europe has the same characteristics. This comparison of MaaS initiatives also provides useful insights into the state of the art of currently implemented MaaS systems.
The paper is structured as follows:
Section 2 presents a brief survey of the literature.
Section 3 analyses and compares different MaaS initiatives in Europe.
Section 4 presents the case study of the BIPforMaaS project through a SWOT analysis and a study of travel habits and mobility preferences in the region of Piedmont (Italy). The final part of
Section 4 includes the description and analysis of the pilot implemented as the final step of the project. Finally, some conclusions are presented in
Section 5.
2. A Survey of the Literature
Mobility as a service is a fairly recent and still evolving concept. Given its importance and potential, an increasing amount of literature on this topic has been published in recent years [
8,
16]. Each work emphasizes a particular aspect of MaaS, depending on the definition chosen. For example, the MaaS Alliance defines MaaS as “the integration of various forms of transport services into a single mobility service accessible on demand” (MaaS Alliance, n.a.); on the other hand, ref. [
17] defines MaaS as the combination of all modes of transportation except private cars.
The following steps were followed for the review of papers in the literature:
Table 1 provides a summary of the literature related to MaaS. In this highly complex system, numerous factors are at play, including business models [
18,
19], governance and policy [
10,
11,
17,
20,
21,
22], and customer preferences and travel behaviour [
23,
24,
25,
26,
27,
28,
29,
30]. To implement a better service, strengths, weaknesses, opportunities, and threats of MaaS systems should be considered [
8,
16,
23,
31,
32,
33,
34,
35,
36].
With regard to the papers analysed in category A (
Table 1), excluding this paper which includes a SWOT analysis specific to the BIPforMaaS project, none of the studies formally provide a SWOT analysis. These works mainly identify the benefits and challenges of MaaS; ref. [
31] provides a thematic map of the challenges and opportunities developed through an extensive literature review. Using the same methodology, ref. [
8] identifies the limitations and advantages of developing a MaaS system. Ref. [
23] highlights the advantages and limitations from the user’s perspective through interviews. Many of the studies mentioned in
Table 1 come to similar conclusions, pointing out that certain factors such as car dependency, difficulty in changing one’s travel habits, lack of trust [
23], technological aspects, regulation, and poor public–private collaboration [
8] limit the development of MaaS.
Regarding the governance and policymaking aspects (category D in
Table 1), the different authors agree that since MaaS is a relatively new concept, policy experimentation is crucial. In [
10], the authors propose dynamic adaptive policymaking (DAP) for the implementation of the system, as uncertainty is present at various levels. In [
20], the authors analyse policy experimentation in the development of MaaS in Finland, while ref. [
17] presents EU-wide policy initiatives in relation to MaaS. Ref. [
21] highlights the impacts determined by the type of MaaS developer entity on service development, identifying three scenarios: market-driven development, public-controlled development, and public–private development. Ref. [
11] examines how differences in institutional settings, stakeholder processes and perspectives, and technological development led to different approaches to regional governance in supporting systemic innovations in the transportation sector, by comparing two European regions (one in Finland and one in Switzerland) with established collaborative networks in the transportation sector.
In [
22], the authors point out that managing collaborative innovation is a complex task that may require new approaches to innovation policy and governance. A major challenge is the need to govern a new network of actors, and experimentation is key in this context. They provide a basis for analysing MaaS policy by introducing a framework that identifies the issues that these policies should address. Ref. [
35] describes some unforeseen social implications of governance and provides recommendations for policy and governance. Their findings suggest that the potential for governance is hampered by framing MaaS primarily as a business opportunity for the private sector, as the consequences extend far beyond mobility.
While most papers in the literature consider only one or a few aspects related to MaaS, this paper provides a more comprehensive view of MaaS by considering multiple aspects, such as strengths and weaknesses, user perspectives, MaaS features, and technical and governance aspects. Furthermore, very few papers in the literature compare MaaS development in different cities. In [
36], the authors compare MaaS initiatives only in relation to integrated services on the basis of their development scheme, while ref. [
34] analyses four cases in Northern Europe (Finland and Sweden) where the MaaS concept first emerged. Ref. [
37] compares three Italian cities only in relation to users’ interest in MaaS services. Instead, this paper provides a more detailed comparison introducing Sochor’s scheme as a starting point for developing a multi-criteria analysis, but also including other important features, i.e., the area and population covered by the service and the entity developing the MaaS. Furthermore, multiple cities belonging to different EU countries are considered in order to assess different contexts and highlight similarities and differences as well as best practices.
3. Comparisons among Some MaaS Initiatives in Europe
There are many MaaS initiatives in Europe, most of which are still in their early stages but are developing relatively quickly. Each project is different as it is adapted to the specific context. In this section, a comparison among several MaaS initiatives carried out in Europe is provided. Such a comparison can help identify common issues but also best practices. In fact, even if the development process of MaaS differs depending on the specific context in which it is implemented (local culture, travel behaviours, and infrastructure), MaaS must possess particular characteristics to be defined as such. In the process of choosing the cities to be included in the comparison, European cities were considered in which, based on desktop research, a clear willingness to develop MaaS services was evident (one per country). Since this paper presents an Italian case study (i.e., the BIPforMaaS project), more than one MaaS service implemented in Italy was considered and compared, in order to better contextualize the Italian situation, identify possible common challenges, and provide appropriate background to the case study analysed in
Section 4. Once a city was identified, only one MaaS operator was taken into consideration for comparative purposes, choosing the one most determined in the development of the service in that city, aiming at an increasing level of development. It should be pointed out that no monopoly situation was found.
Table 2 provides a comparative analysis of the MaaS initiatives considering the data that were available at the time of the study. The cities being compared are Berlin, Helsinki, London, Madrid, Saint-Étienne, Vienna, Bologna, Florence, Genoa, Milan, Palermo, and the Piedmont region.
The characteristics that were compared are:
- (a)
The operators/apps managing the MaaS service;
- (b)
The area covered by the MaaS service:
Urban area, including the city itself;
Metropolitan area (as defined in [
38]), including the city and the commuting zones;
Regional area, including more cities, rural areas, and non-densely populated areas;
- (c)
The service area covered in terms of land area (km2);
- (d)
The population living in the area considered;
- (e)
The developing entity which is representative of the type of governance (public, private, or mixed) related to the MaaS service analysed;
- (f)
The integrated transportation modes included in the system;
- (g)
The ticketing system that may or may not be integrated into the developed service;
- (h)
The eventual presence of mobility packages involving multiple transport modes included in the service;
- (i)
The possible segmentation of demand to create offerings able to satisfy different categories of users;
- (j)
The level of development of the system.
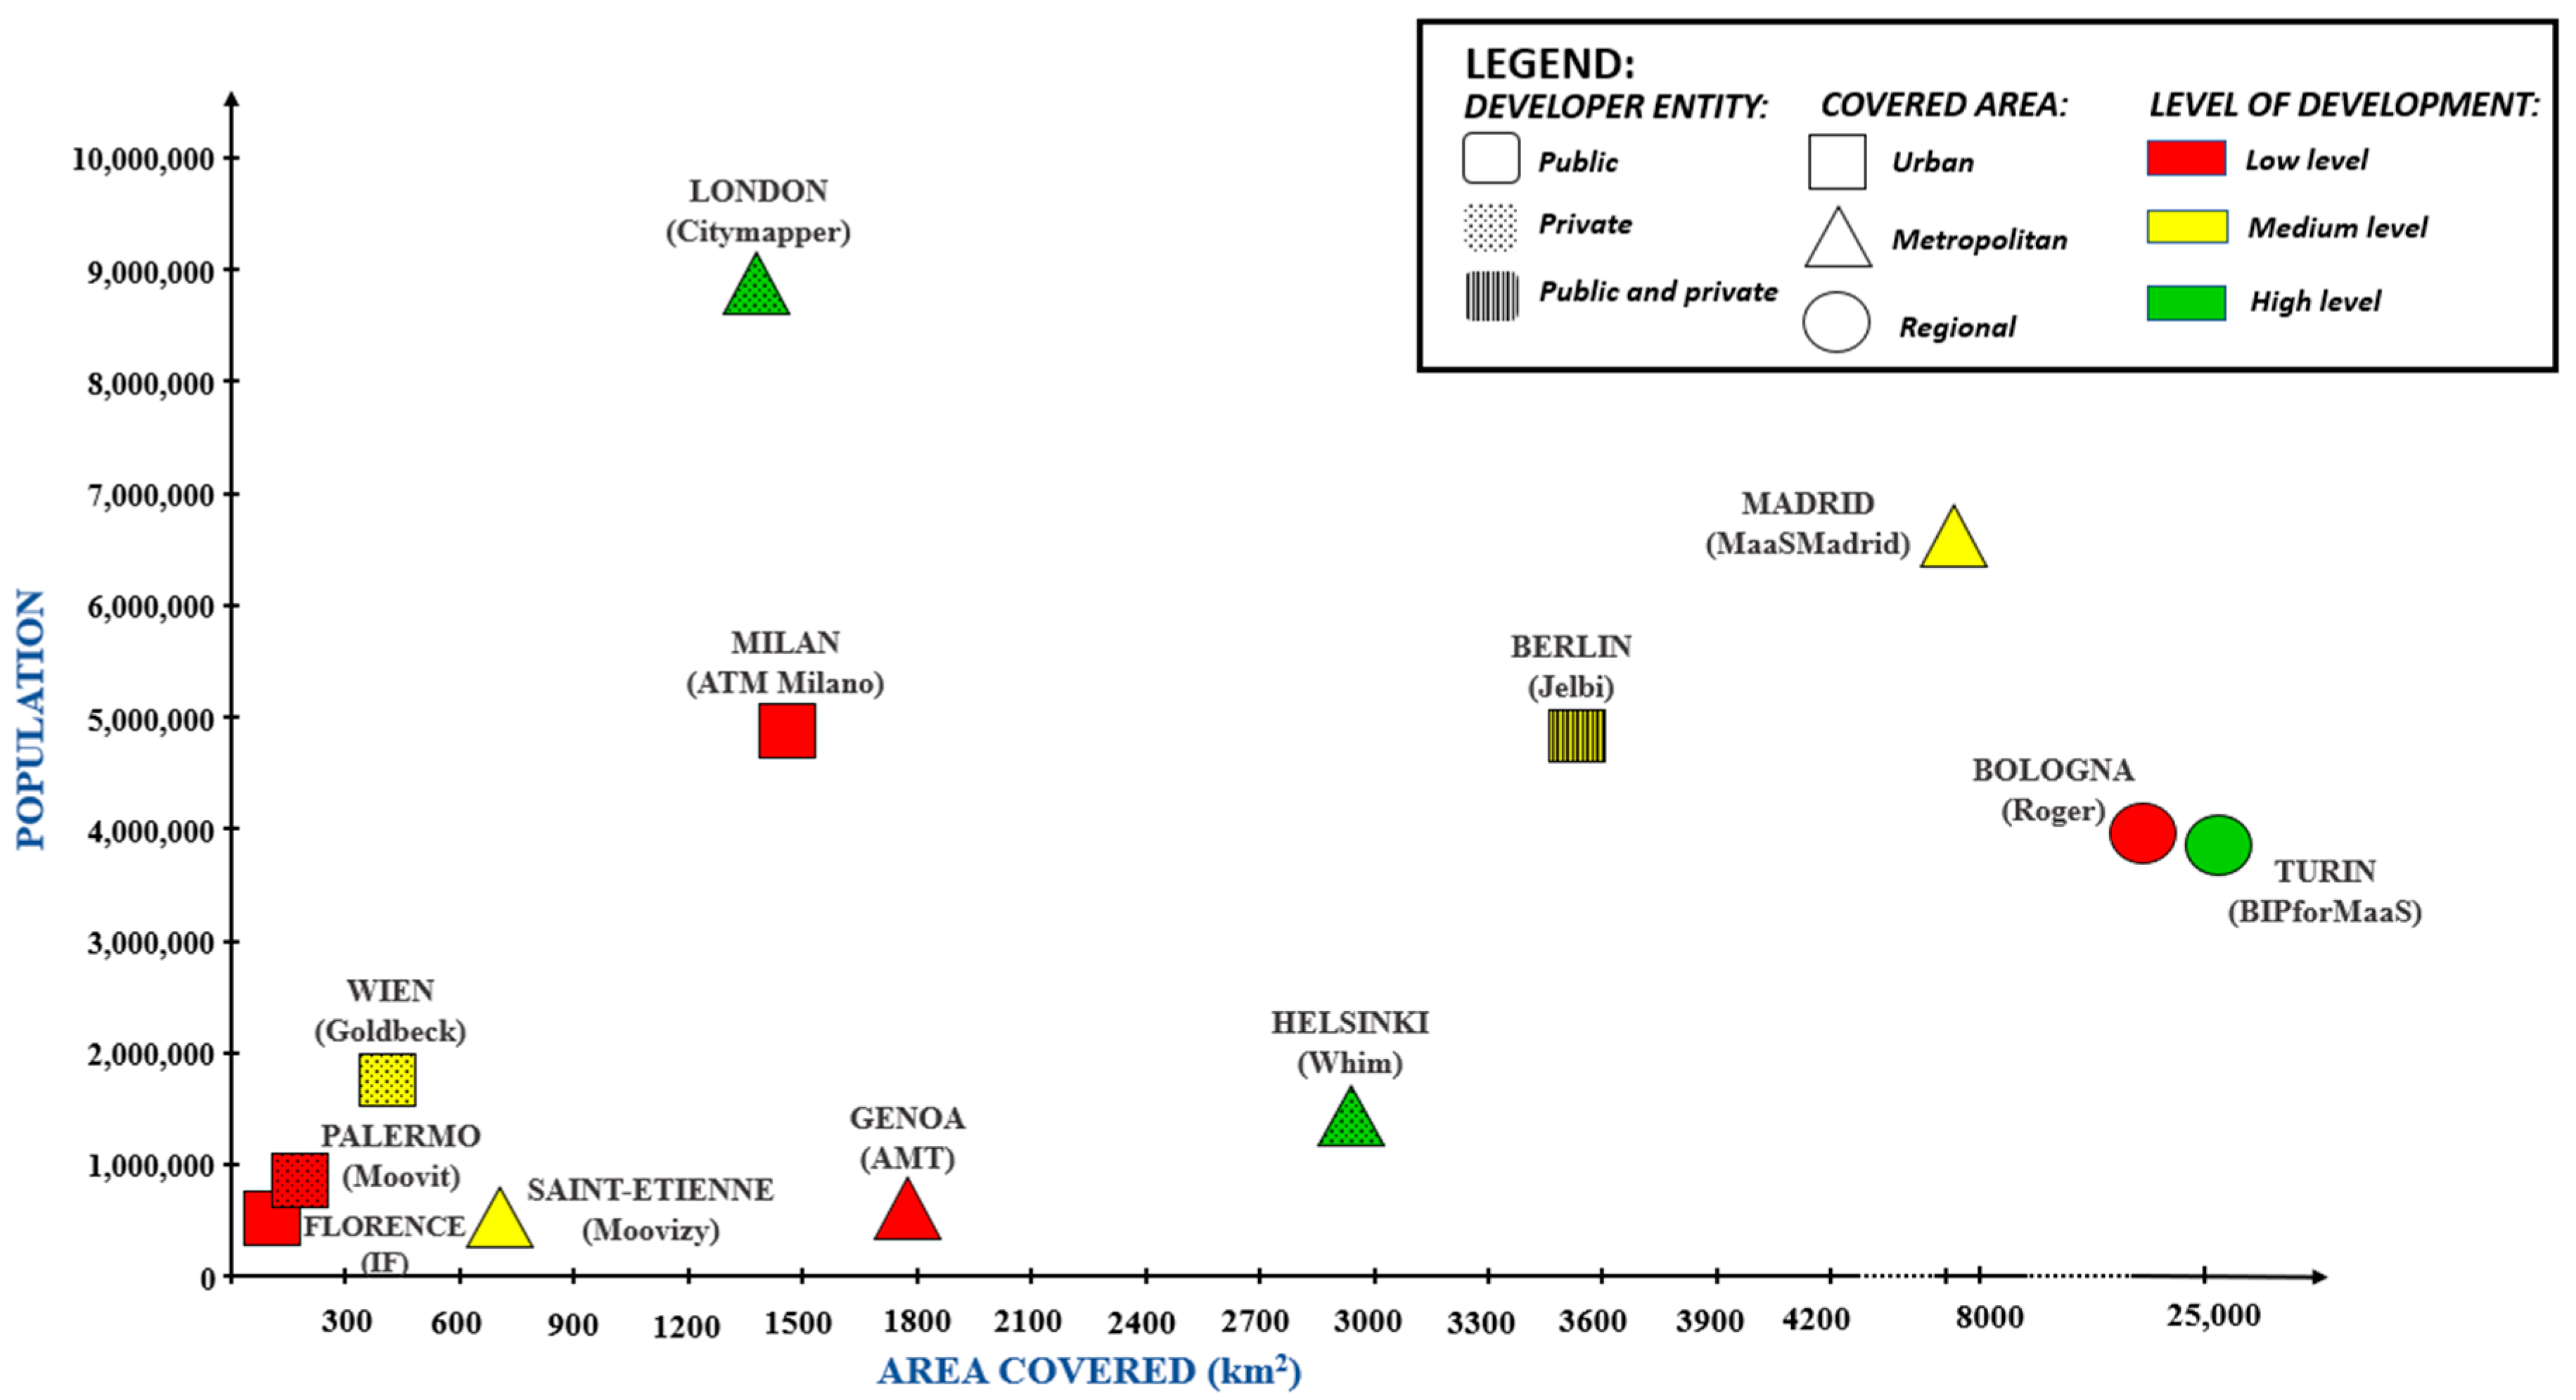
The categorization proposed in point (b) above (i.e., the division among urban, metropolitan, and regional development) makes it possible to define the type of territory affected by the proposed MaaS service. In the case of urban development, the service affects only the urban area of the individual city, while in the case of metropolitan development, in addition to the main city, less densely populated suburban areas and often some rural areas are included. In the case of service development in a regional area, multiple urban areas are included but also vast rural areas that are not densely populated and in which transport services often have little or no presence. In the case of MaaS development in metropolitan areas, but above all in regional areas, it will no longer be sufficient to provide urban public transport services; rather, it will be necessary to include and efficiently organize the provision of other mobility services in a more widespread manner throughout the territory, such as extra-urban public transport services, rail services, shared mobility services, and car rental. Still in relation to point (b), it should be reiterated that the specific difference between urban areas and metropolitan areas is not related to territorial coverage or population; in fact, there are urban areas that are larger and more populous than some metropolitan areas (
Table 2). For example, the urban area of Berlin is larger in population and territorial coverage than the metropolitan area of Saint-Étienne (
Table 2 and Figure 6). However, both service population and territorial coverage are important factors to consider when analysing MaaS initiatives. For these reasons, the three characteristics of territory type (point b), territorial coverage (point c), and population (point d) are related and compared in Figure 6.
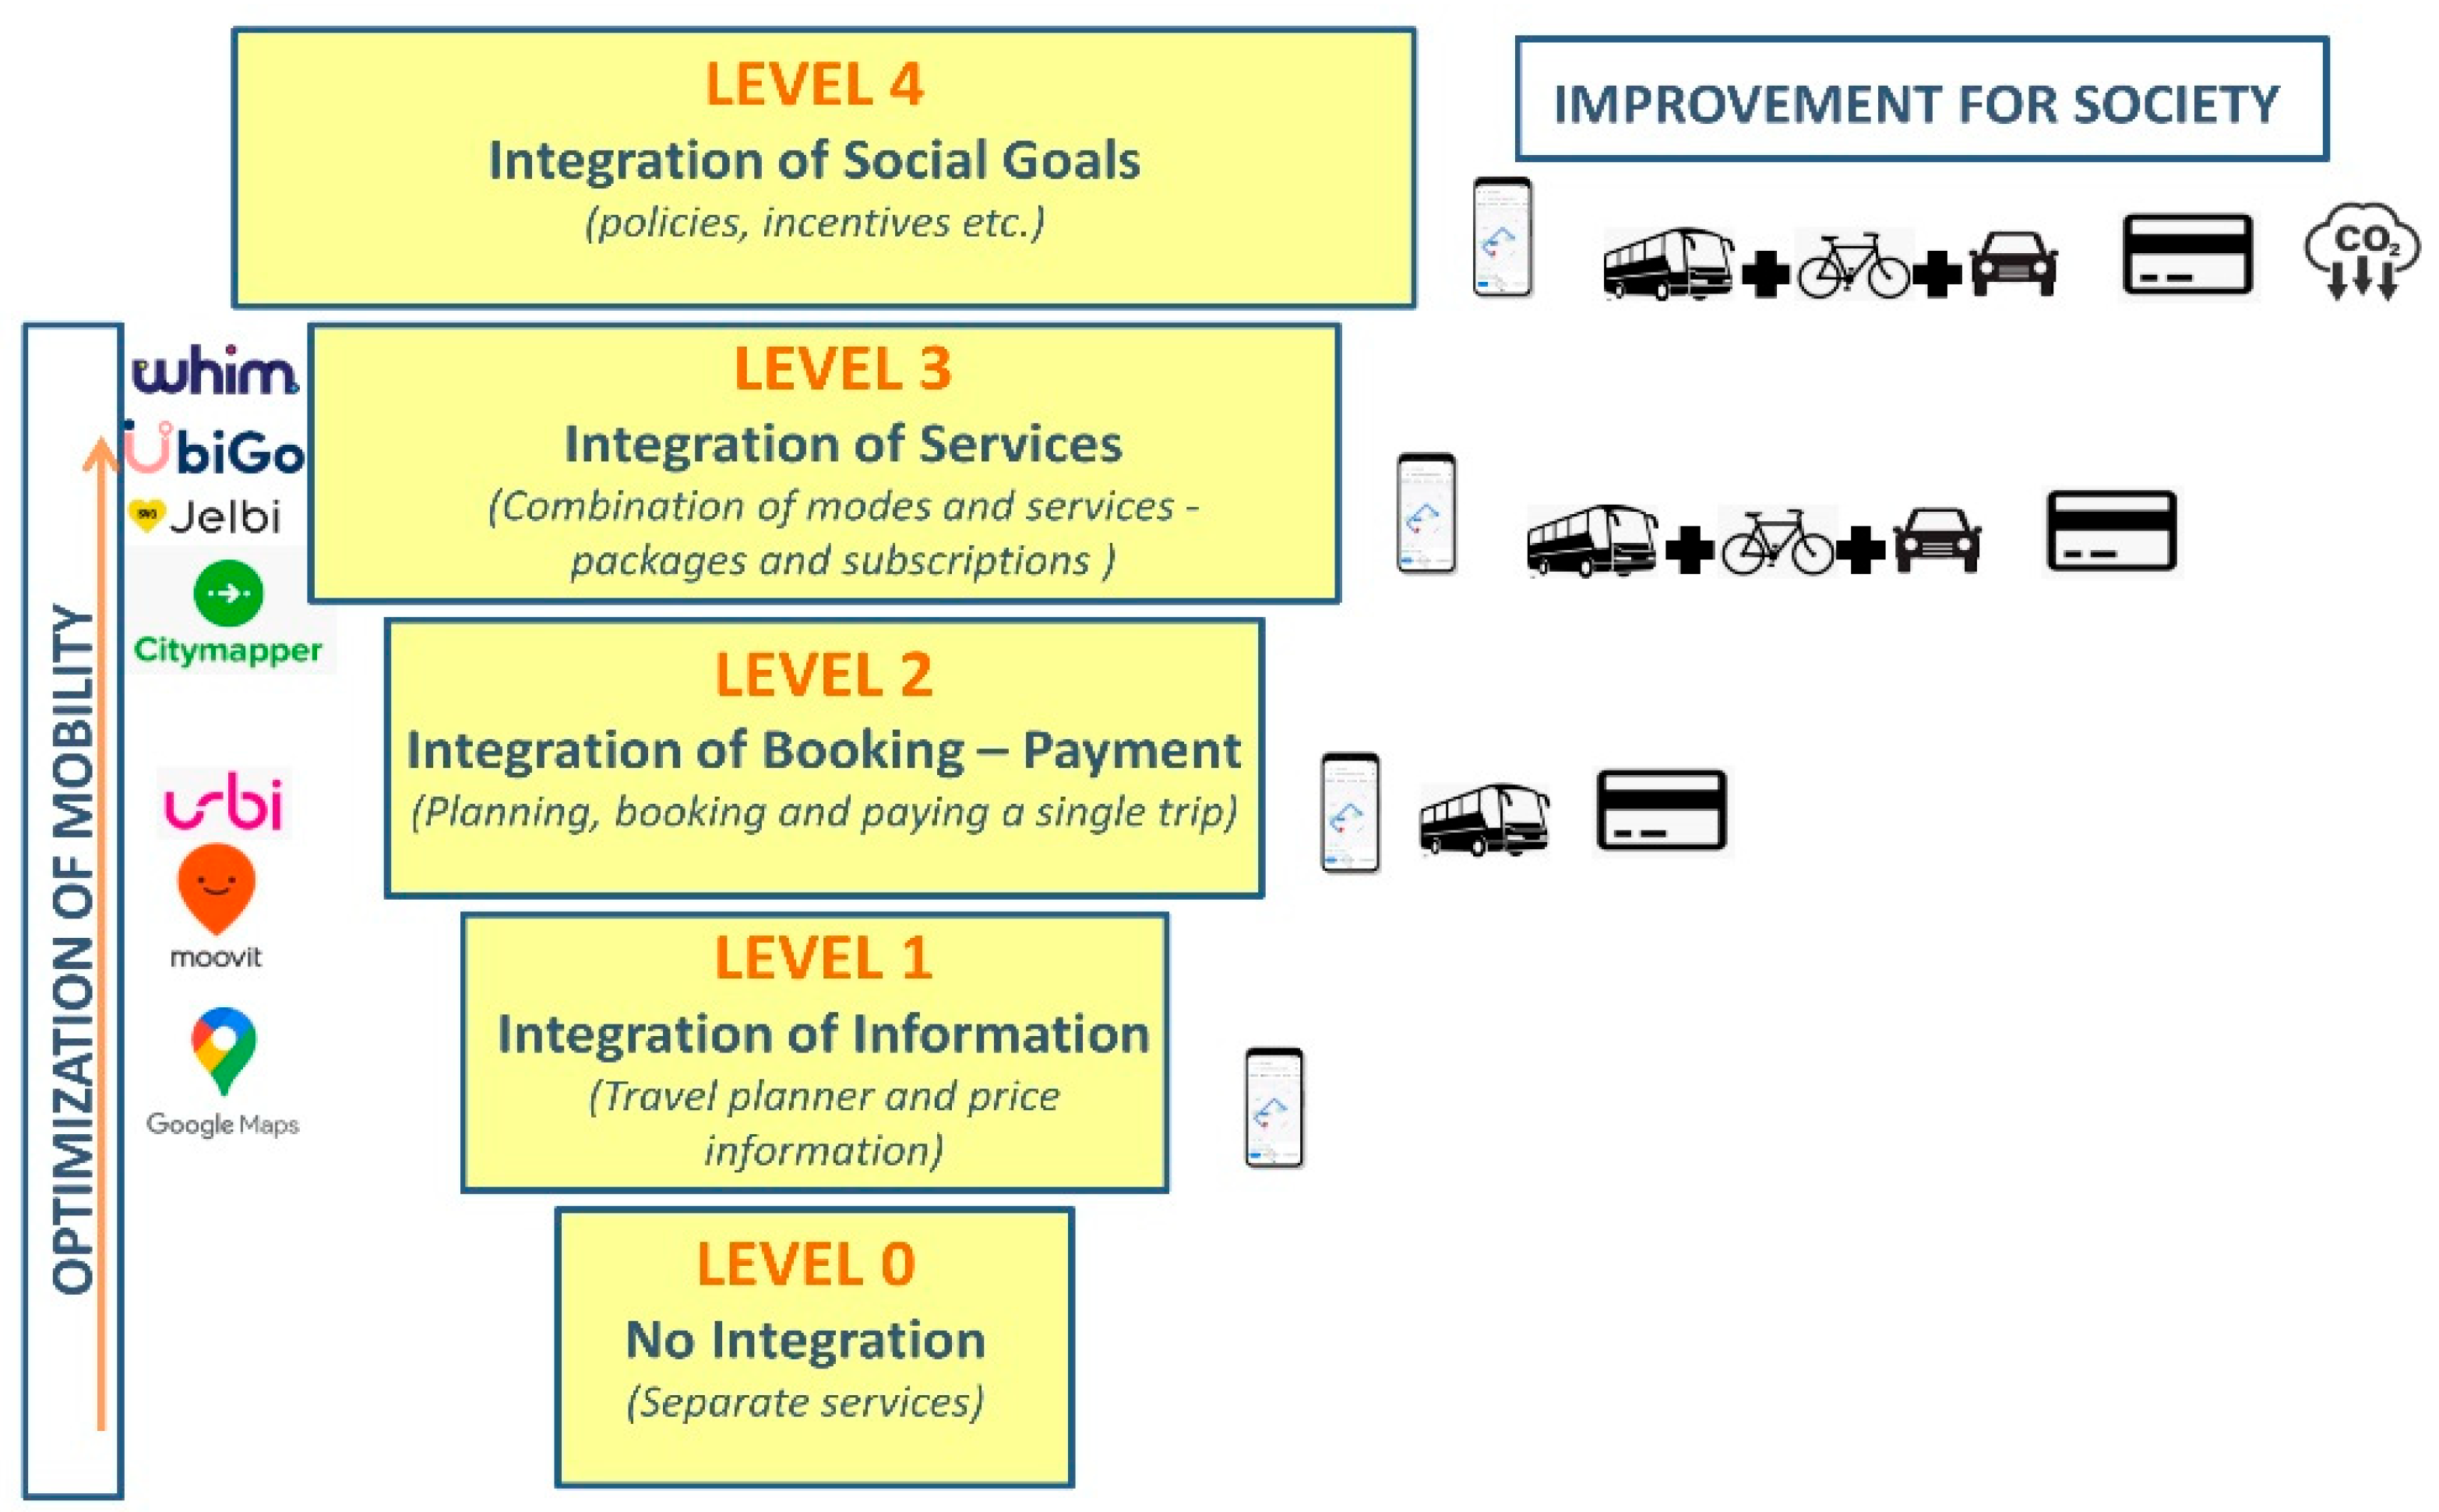
Regarding the last feature, i.e., the level of development of a MaaS initiative in a city/area, one way to measure it is to consider the level of system integration: a more integrated system equals a more developed system. The 0–4 level scheme provided by Sochor et al. (2018) was considered (
Figure 2). In this scheme, each level represents a different degree of integration of MaaS services:
Level 0—no integration.
Level 1—integration of information for planning purposes. The user can find different kinds of information in order to plan their trip.
Level 2—integration of booking and payment. At this stage, in addition to planning, the user can book and pay for a single trip. Many mobility providers are developing this kind of service to make travel easier, especially for those who are already using mobility apps, but also to attract new customers.
Level 3—integration of services. At this stage, different types of mobility services are integrated and there is a focus on providing a customized offering. This is considered a minimum level for a MaaS system in which subscriptions and bundled services are available.
Level 4—integration of social goals. Through policy and incentives, more sustainable transport solutions are sponsored. Private car use is reduced, there is less congestion, and CO2 emissions are lower, at least at the local level. At this stage, public authorities can make a difference as it is their responsibility to educate citizens about more sustainable behaviours.
The 0–4 level scheme provided by [
36] has some grey areas. Often, when considering a single MaaS initiative, it is difficult to make a clear distinction between two different levels of integration. For example, a MaaS application can combine different modes of transportation without providing subscriptions or service packages, in which case there would be a middle ground between Level 2 and Level 3; moreover, incentives could be integrated at any level. In light of these considerations, a multi-criteria analysis (MCA) was conducted to determine the level of development of the MaaS initiatives compared in this paper. The following criteria were considered:
Integration of information;
Integration of booking services;
Integration of payment services;
Integration of multiple transport modes;
Packages and subscription availability;
Policies/incentives to promote MaaS usage.
For each criterion, a binary value (0–1) was assigned to indicate the absence/presence of that specific service. The only exception was made for the criterion represented by the integration of transportation modes: in this case, one point was assigned for each transport mode included (public transport, shared mobility services, taxi/carpooling/car rental).
Given the hierarchical nature envisaged by the scheme in [
36] and the qualitative nature of the criteria, it was decided to use the analytic hierarchy process (AHP) method. In order to assign weights to the criteria, a focus group involving 5T and mobility service experts from the Piedmont region was organised (
Table 3).
As a result of the multi-criteria analysis, it was possible to assign a level of development (high–medium–low) to each MaaS operator (
Table 4) considered in the comparison analysis. The level of development was determined by dividing the score obtained from the MCA into three intervals of equal size, considering 1 as the maximum value obtainable at present conditions. Each analysed initiative is assigned to an interval.
As shown in
Table 4, in most Italian cities the level of MaaS development is still quite low. There is a need for greater integration, compliance with technological requirements (AVM—automatic vehicle monitoring, AVL—automatic vehicle location, etc.), and adequate business models capable of taking into account the interests of all stakeholders.
It should be specified that governance is not directly included in the MCA, as governance manages and regulates every aspect embedded in each level of integration described by [
36]. Each criterion of the MCA can be affected to varying degrees by governance, which is therefore implicitly already included in the analysis. Governance deals with aspects such as competition, data management and sharing, and, in general, guidelines for collaboration among the different stakeholders involved. Governance thus represents a higher layer than the individual MaaS initiatives analysed and influences the context in which MaaS is developed (
Figure 3). The same applies to other aspects such as the culture of the place where the service is implemented or the geographical conformation.
As far as governance is concerned, two pioneering projects in Italy stand out, namely those undertaken in Emilia-Romagna and the Piedmont region. In the first case, the regional public transport operator “TPER” developed the Roger app. The Emilia-Romagna Region and the Municipality of Bologna are the main shareholders of the public transport company. The project was developed with the other transport companies of the Emilia-Romagna region providing users with both a MaaS app and an EVM service. A great deal of governance work was therefore accomplished through the collaboration of public authorities, but only public transport was included, compromising the possibility of achieving high levels of service development.
The BIPforMaaS pilot project in the Piedmont region attained a good level of development thanks mainly to the public governance that allowed the system to be properly developed, as will be explained in detail in the following sections.
In Berlin, the collaboration between the transport authority BVG (Berliner Verkehrsbetriebe) and MaaS integrator Trafi led to the development of the MaaS Jelbi app, which was created in just six months. Trafi provided not only a plug-and-play white-label solution customized to BVG’s branding but also a sophisticated MaaS API system (backend) to power it.
Finally, in France Saint-Étienne Métropole and Transdev (a private company) collaborated to launch Moovizy 2—a new MaaS application that allows users to manage, book, and pay for all available modes of transport in the metropolitan area.
In the cases cited, collaboration between public authorities and private operators has been crucial to the development of MaaS services for the benefit of citizens. It is clear from these cases that the intervention of public governance in the processes of developing MaaS offerings is an important aspect so that the proposals that reach the market are responsive to the needs of users and not just aimed at the profit of private operators.
Figure 4 represents the number of MaaS initiatives categorized by developing entity, showing the level of development of each initiative calculated based on MCA.
Public initiatives outnumber private ones (
Figure 4). This is due to the fact that public bodies are more sensitive towards negative externalities, which are a social problem. Moreover, private initiatives are less numerous because the primary goal of private entities is profit and it is complicated to design a profitable business model in this context [
39]. This could also explain the fact that initiatives with a high level of development are mostly private: a more developed MaaS generates greater efficiency that can allow greater profits, and this leads to accelerated development. However, it should be taken into account that purely private initiatives need government support to regulate the sector.
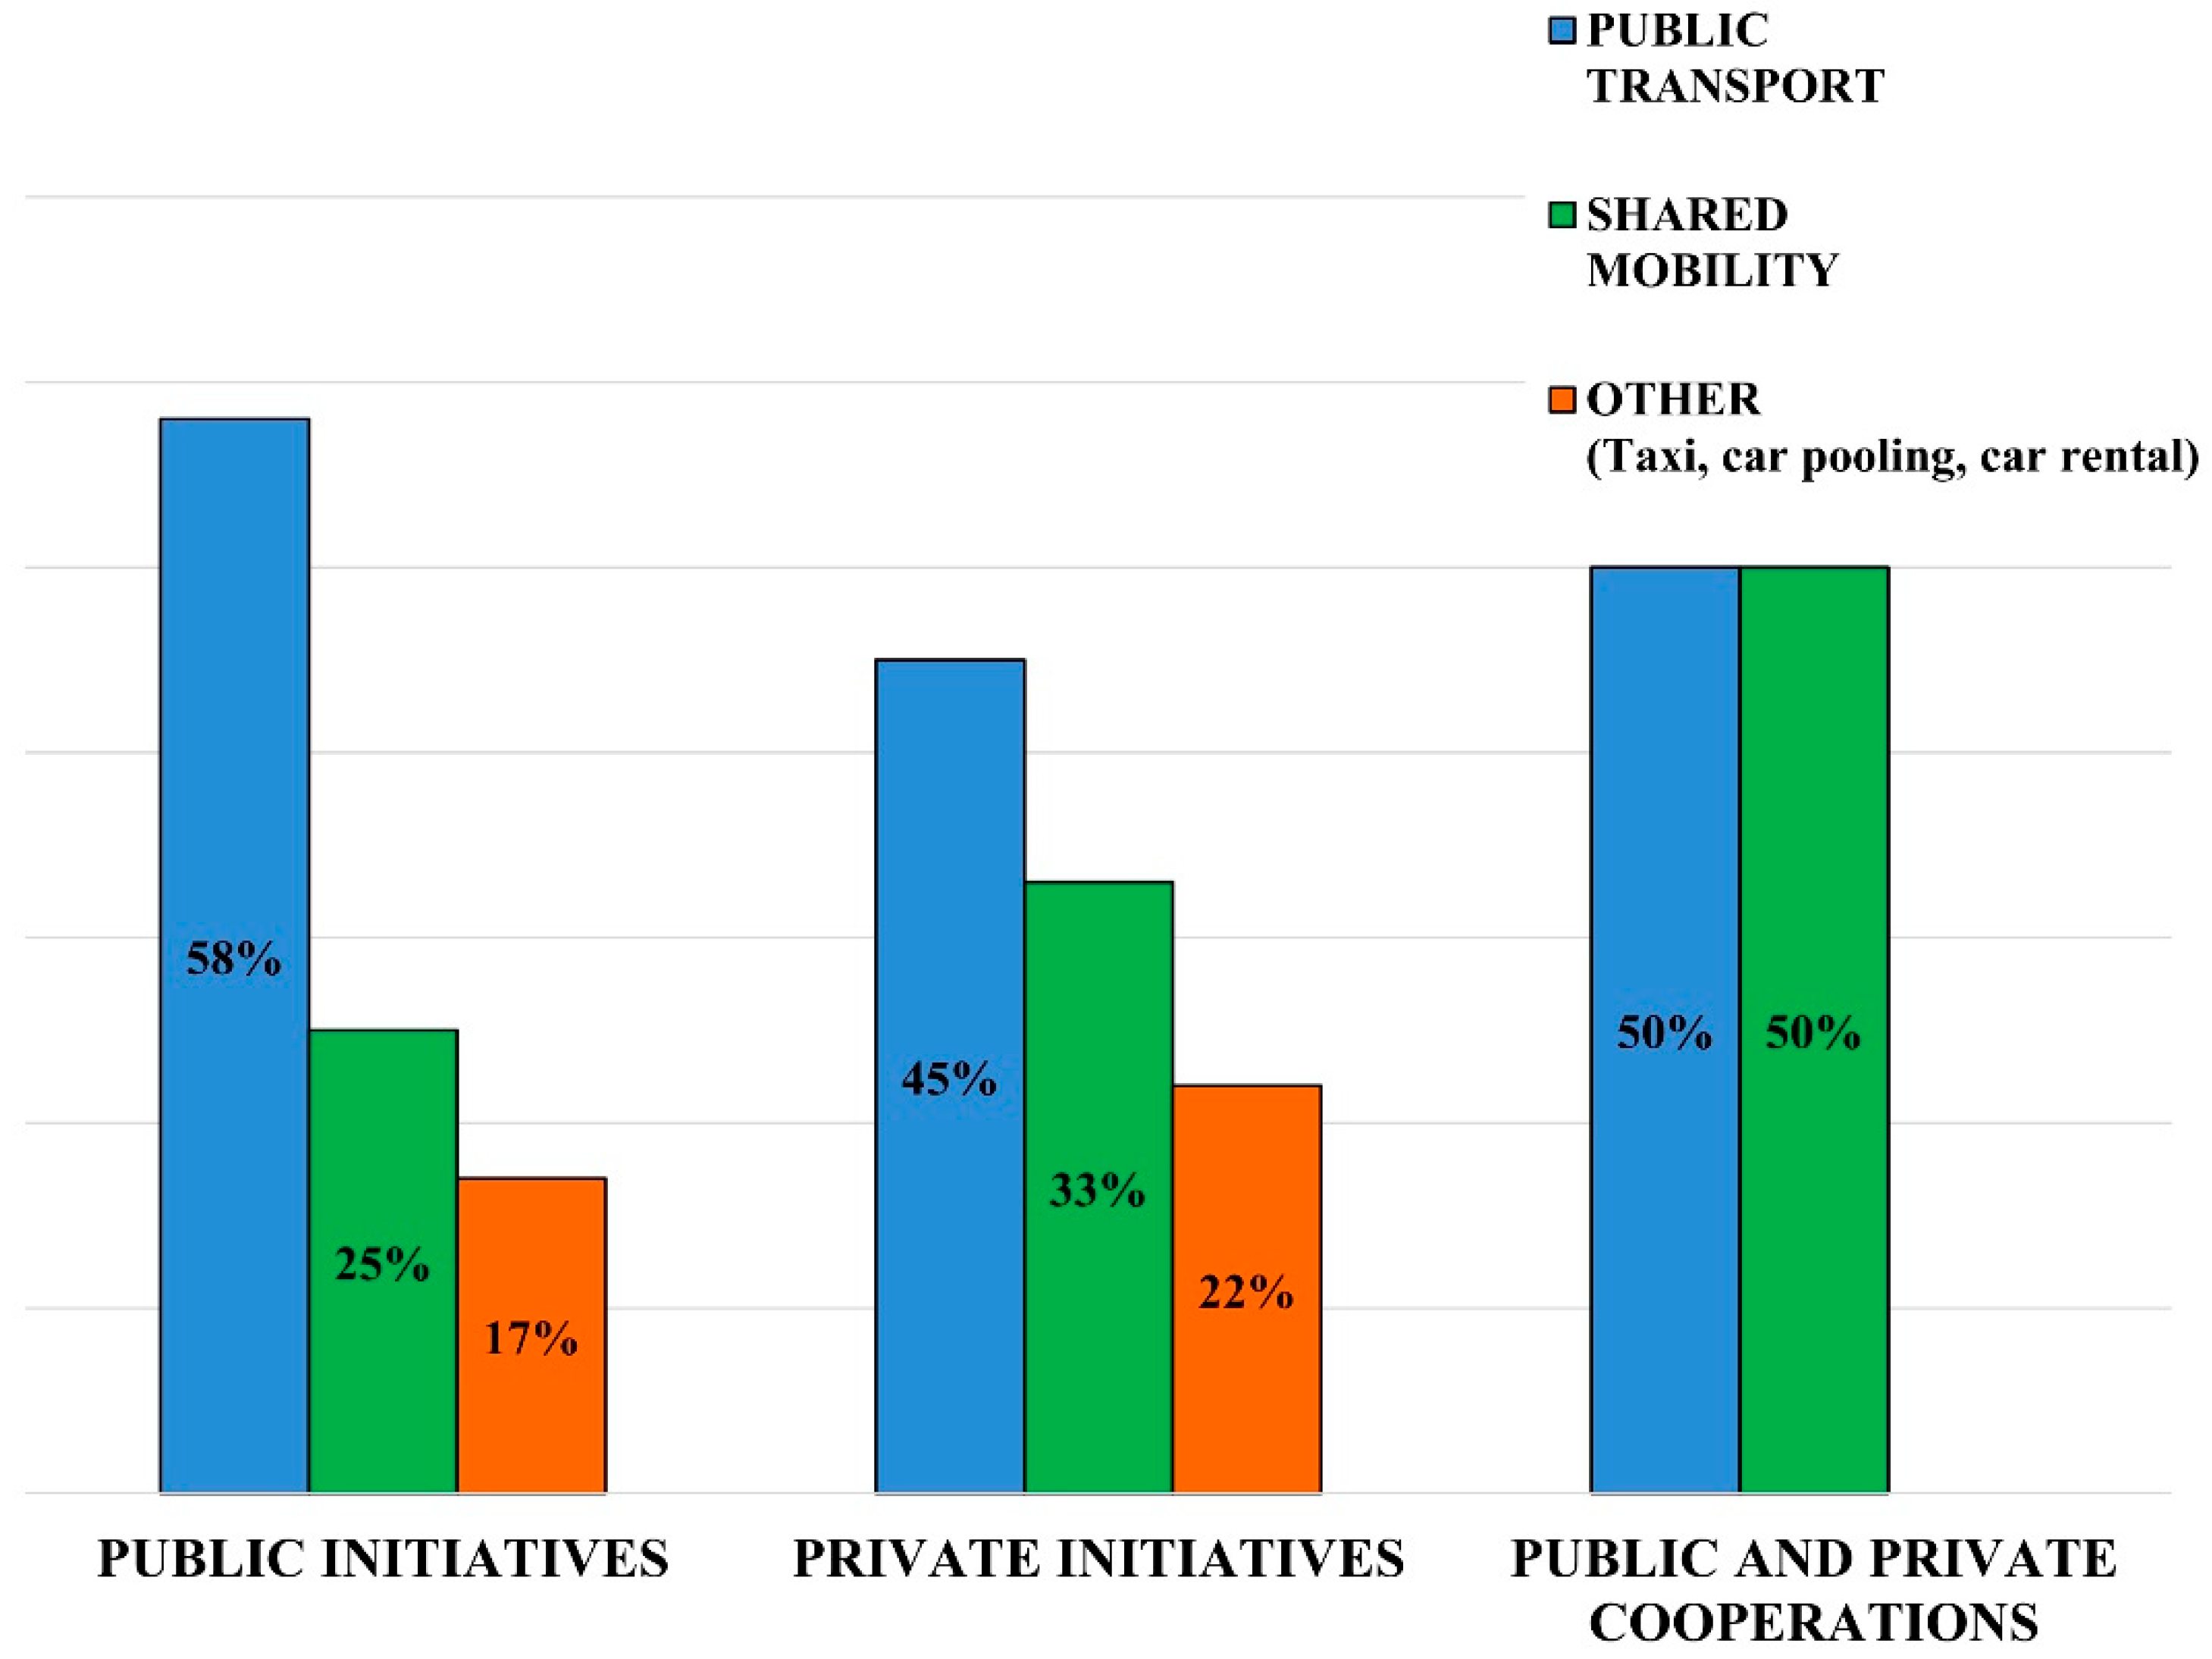
Public transport services are unanimously considered as the backbone of MaaS, and this is reflected in the fact that public transport modes always have priority in MaaS projects. This is also evident from
Table 2, where public transport always appears among the transportation modes offered.
Figure 5 relates the different modes of transport to the type of entity developing them: public initiatives manage to better integrate public transport in its entirety (urban and suburban buses, metro, and rail transport). Private initiatives, on the other hand, seem to succeed in integrating more services other than public transport, such as shared transport and taxis.
Since MaaS initiatives are mostly still at the low–medium development stage (
Table 4), often only public transport is included in the mobility packages as a mode of transport.
Intuitively, one might think that developing a MaaS service for a small population might be less complicated than having to meet the needs of a large population, which requires organising the service on a large scale. However,
Figure 6 shows that the number of users served does not influence the development of MaaS: there are small population centres that have not yet managed to develop an adequate MaaS system. It can be observed that in the range below 2 million inhabitants, there are very different initiatives in terms of level of development.
As the organizational complexity increases, in order for MaaS to properly develop over large territories, the direct involvement of public actors is necessary to coordinate the different public transport services in that territory. In
Figure 6, it can be observed that in most cities there is an urban or metropolitan service coverage; the city of Turin aims at a regional development of the MaaS system involving wider territorial coverage. In Emilia Romagna, an app called Roger exists in several cities in the region. However, although Roger was developed on a regional basis, unlike the BIPforMaaS project, which aims at providing guidelines to achieve a high level of MaaS development, this initiative is currently limited to bringing together only public transport services into a single platform, leaving out many private services (e.g., shared mobility services).
In terms of best practices, Helsinki records one of the most innovative MaaS initiatives, also considering that it is the city where MaaS was first developed. Helsinki integrates numerous mobility services (public and private) with the aim of satisfying different categories of users. In addition, it offers several service packages for which it is already possible to purchase a monthly subscription by choosing from several offerings. Citymapper is another good example of a MaaS initiative, integrating a few modes of transport in addition to urban public transport, and managing to serve a large population. The BIPforMaaS project is also a best practice as, once fully developed, it will be able to serve a large territory by integrating both public transport and shared mobility services.
4. The BIPforMaaS: A Regional Italian MaaS Project with Public Governance
In this section, the case study of the BIPforMaaS Italian project is analysed. This project, carried out by the Piedmont region in Italy, is compliant with ISO and CEN standards and is characterised by some innovative elements, including the regional framework and public governance. The Piedmont region is the first public administration in Italy to lead a MaaS project with the objective of creating a level 4 integration ecosystem [
36] to deliver a more integrated, accessible, and sustainable service to citizens. Following this, other Italian public administrations undertook MaaS projects and offered various experimental solutions to their citizens. In
Section 4.1 the stages of the project are presented. In
Section 4.2 a SWOT analysis of the BIPforMaaS project is provided in order to focus on key aspects which can influence the development of the project.
Section 4.3 presents the findings from a survey conducted to investigate user behaviour in the Piedmont region, with the aim of better designing the mobility services to be offered. The last part of the section concerns the implementation of a pilot experiment that took place in the period June–September 2022.
The company in charge of developing MaaS in the Piedmont region is 5T S.r.l. (hereinafter 5T), a local public participation company. 5T manages the regional service centre of the BIP system, which contains information regarding both the public transport service and the ticketing system. Besides 5T, which coordinates the project, there are other project partners: FIT Consulting, coordinator of the evaluating activities; LINKS, responsible for user engagement and the definition of pricing models; PWC, coordinator of business modelling activities; Avventura Urbana, responsible for stakeholder engagement activities; Bellissimo, responsible for the definition and coordination of the project communications; and Alessandro Nasi, responsible for digital transformation and service design coordination.
The project consists of five stages:
Learn: study and analyse the different MaaS aspects.
Share: discuss the topic with stakeholders and European MaaS developers.
Create: define regulations for the local MaaS ecosystem.
Engage: experiment with a new mobility system for the local community.
Communicate: report the results and objectives achieved.
According to the Manifesto written by 5T [
40], BIPforMaaS supports a MaaS open platform that offers simple, accessible, eco-sustainable, and tailor-made solutions to users. End users are placed at the centre of the system and made aware of the benefits of the system to society and the environment. Two aspects are distinctive and crucial for the success of BIPforMaaS: an active role of public governance, and collaborations between private and public entities.
Many institutional entities and private companies joined the BIPforMaaS Manifesto: AITMM, Cityway, Fit Consulting, Fluidtime, Iomob, Italian ITS Association (called TTS Italia), Links, Movalia, MoveYou, Open Move, Politecnico di Torino, Redas Engineering, Shotl, Sustainable Development Foundation, Trafficlab, Trafi, Tranzer, Torino Urban Lab, and Travel for Business.
The diagrams in
Figure 7 and
Figure 8 show the Piedmont mobility framework without and with BIPforMaaS, respectively. In the system without MaaS (
Figure 7), the user directly interacts with different mobility service providers, autonomously gathers all the information to plan their trip, and, if needed, combines different transport modes. In order to pay for the different services separately, the user has to download and register on multiple mobility applications. With BIPforMaaS (
Figure 8), the user interacts with mobility service providers using a single app. Public governance ensures a fair and competitive playing field for all service providers, thus affording a higher quality service to end users. The MaaS integrator, which is a public body, provides regulations and incentives for using the system, and interacts directly with all stakeholders in the ecosystem, ensuring a high level of system integration. Stakeholders interact with each other to develop various functionalities, such as multimodal trip planning, booking, and payment services. In other words, public governance makes it possible to optimally regulate and coordinate the activities of different stakeholders, including the MaaS operators, that represent the entities developing the MaaS services. MaaS operators can be multiple and can be public or private entities; however, they all follow the rules put in place by the MaaS integrator through governance and policies. In the case study analysed in this paper, the MaaS operator and MaaS integrator coincide. As also better specified later, the BIPforMaaS project laid the foundations that will be developed in the subsequent phases of the project (BIPforMaaS+) and that were essential to developing the MaaS4Italy project at the national level, which will fully implement the ecosystem presented in
Figure 8.
It is important to point out that over the years the Piedmont region and the City of Turin have implemented multiple tools that are having a positive impact on mobility and have been useful and preparatory in the development of the BIPforMaaS project:
BIP (“Biglietto Integrato Piemonte”—Piedmont Integrated Ticket) is the electronic ticketing system used in Piedmont that allows access to public transport and bike-sharing service provided by TObike, the station-based bike-sharing service owned the by City of Turin. BIP can be used anywhere in the region using contactless technology.
MATO (“Muoversi a Torino”) is an info-mobility portal containing all available information useful for travelling within the city of Turin. MATO gives access to both public transport and shared mobility information. Using an interactive map, the customer is able to plan their journey and check in real-time the shared and public services available in a selected area. Traffic data are continuously updated, resulting in a more efficient choice of trip. Booking functionalities are also included.
MIP (“Muoversi in Piemonte”) is an info-mobility web portal containing all available information useful for travelling within the Piedmont region.
BIPEx is a protocol for data exchange and homogeneity between transport companies and public administration. It is a tailored version of the NeTEx communication exchange protocol which has been recognized by the EU Commission as a strategic data exchange standard to enable the provision of multimodal travel information services [
41]. The BIPEx protocol, developed using European and international standards, is in use within the e-ticketing system (BIP) and includes information about public transport (real-time timetable information) and e-ticketing (personal accounts and travel data).
Table 5 shows the current mobility services present in the metropolitan area of Turin and in some other cities of the Piedmont region. For the most part, they are still independent services but could be aggregated into a single MaaS platform that meets the needs of different types of customers through the further development of BIPforMaaS.
For each service reported in
Table 5, the related provider and served area are identified; a distinction is also made between station-based and free-floating services. In the station-based case, the trip starts and ends in specific parking areas, whereas in the free-floating one, the user can pick up the vehicle and end the trip anywhere it is possible to park it.
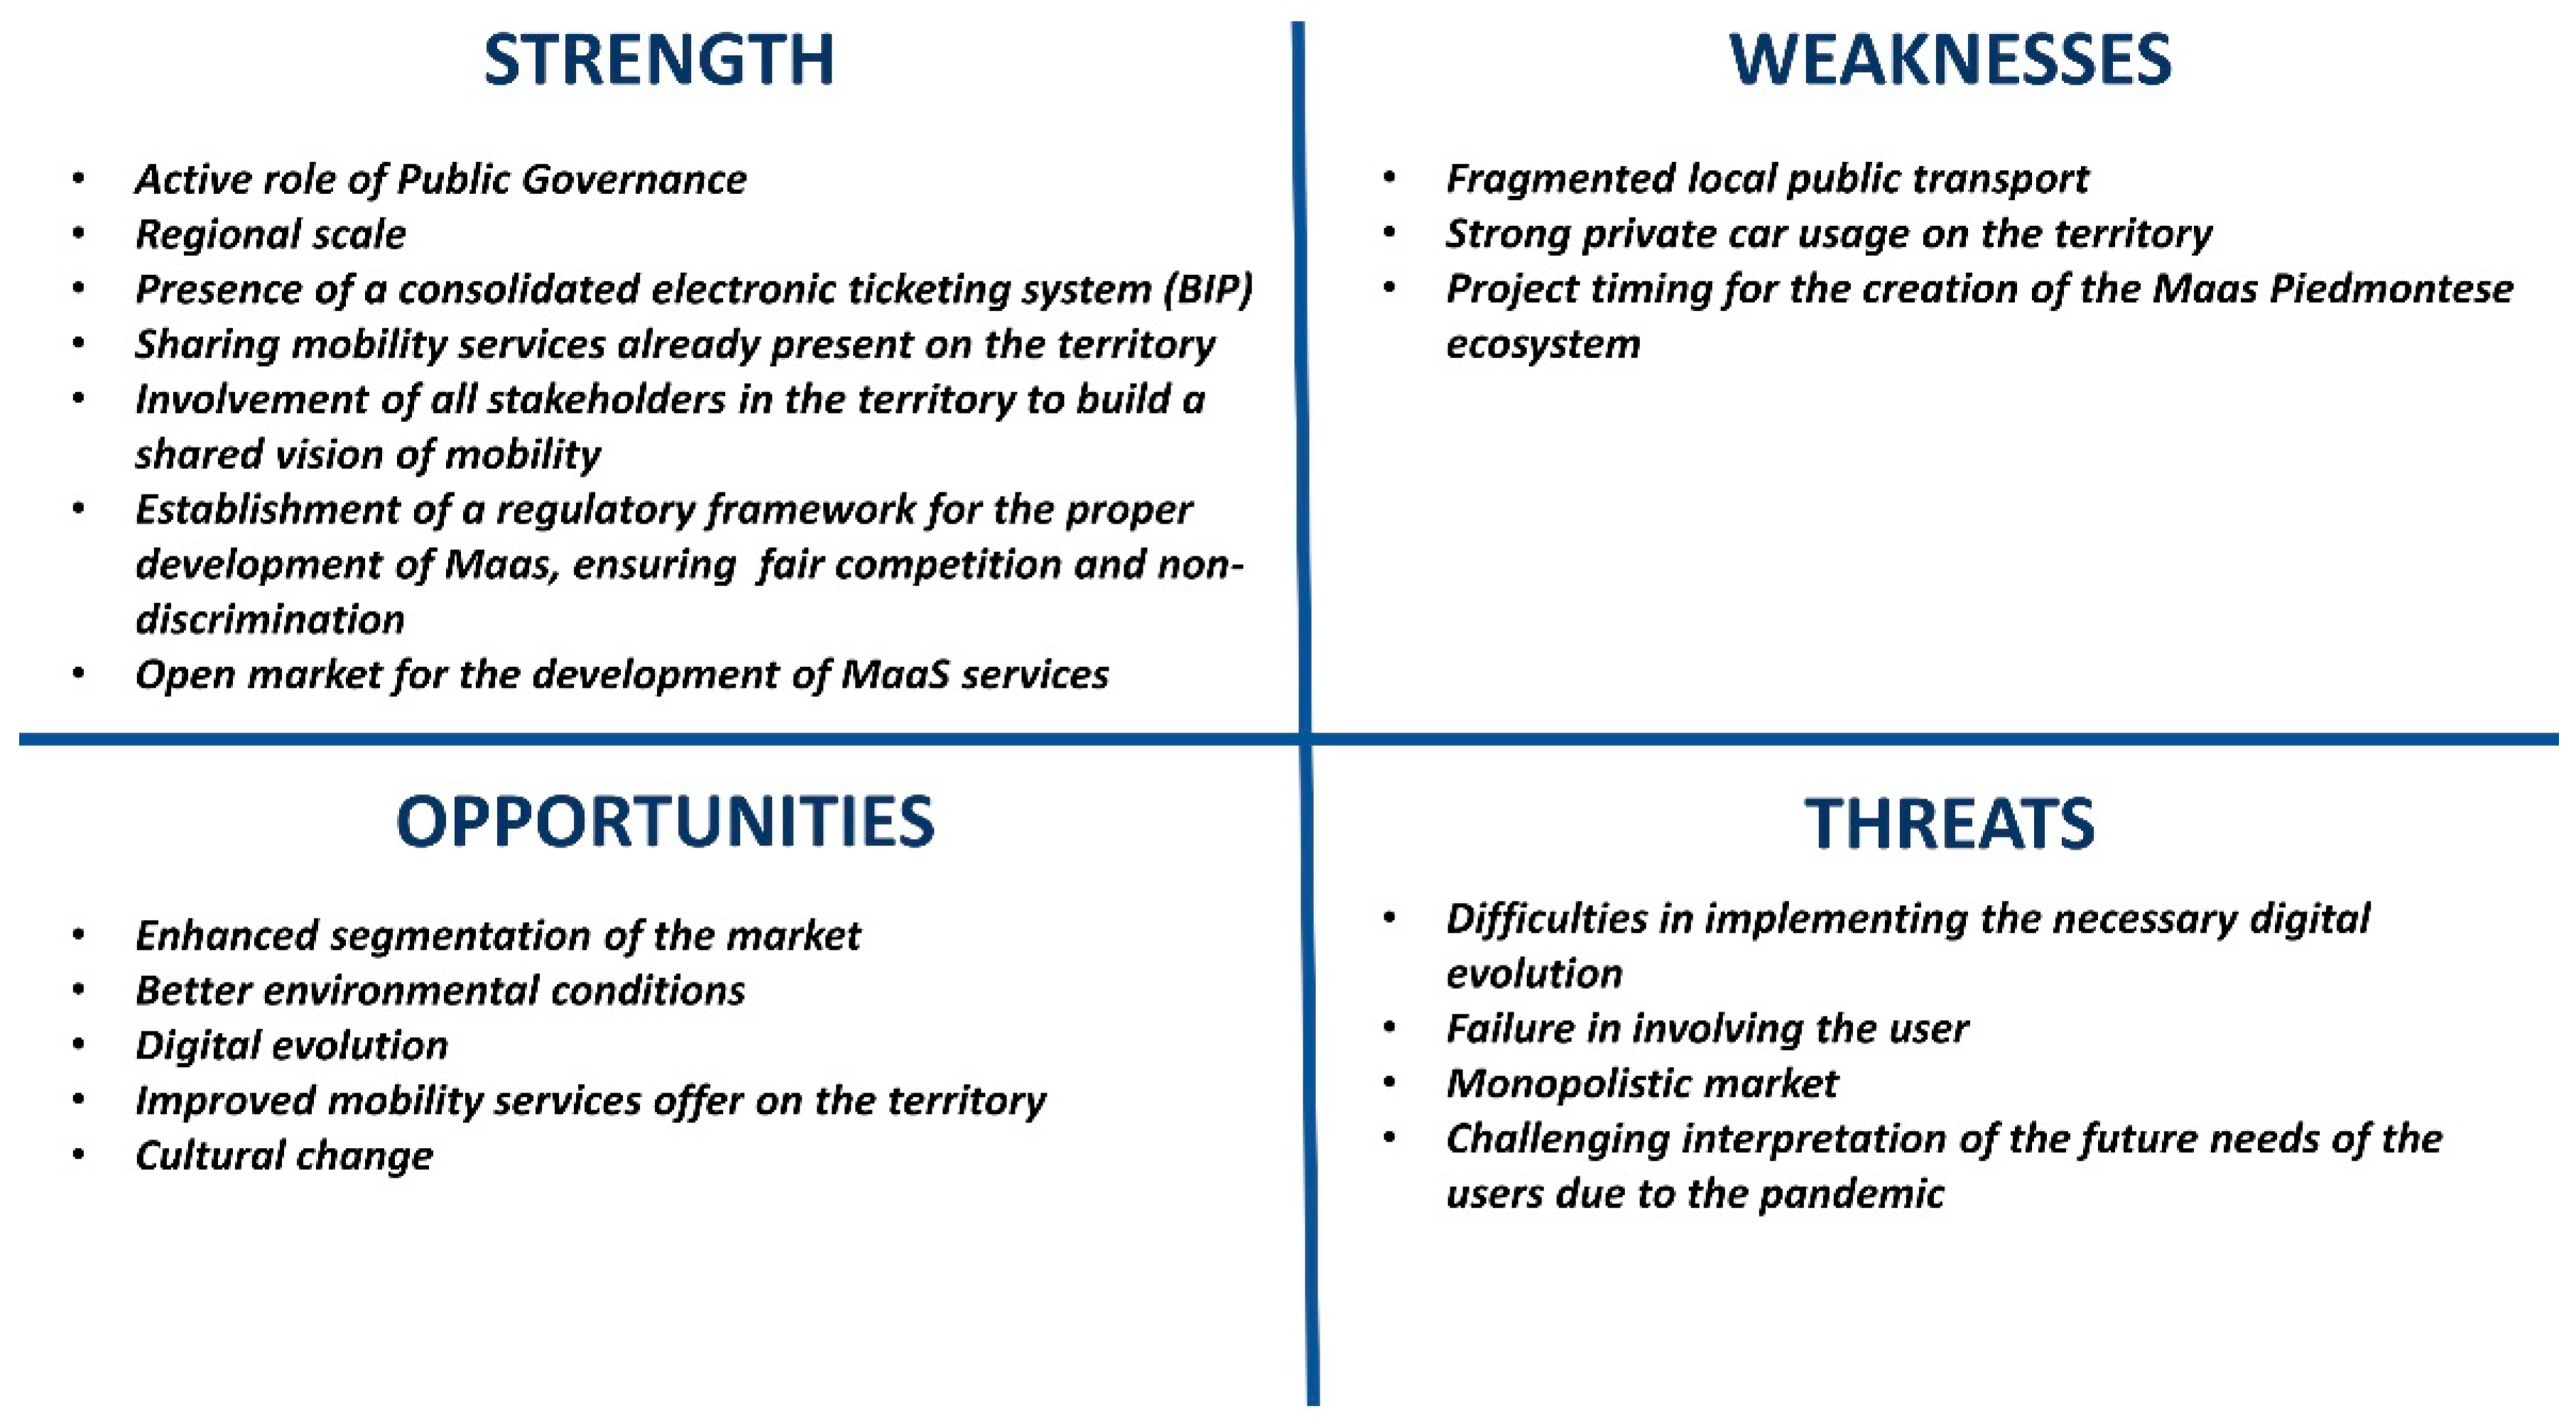
4.1. A SWOT Analysis of the BIPforMaaS Project
In
Figure 9, a SWOT analysis of the BIPforMaaS project is presented. The choice to conduct a SWOT analysis was deemed appropriate since it is an effective methodology for focusing attention on key issues that influence the development and growth of a project. As the project reported in the case study is not yet operational but developed primarily as a strategic plan, this tool is helpful as it takes into account both internal and external variables that may affect the achievement of strategic objectives [
42,
43,
44].
This analysis was conducted by the authors in cooperation with 5T which, as the developer of the BIPforMaaS project, performed extensive research mainly to identify the challenges to be overcome but also to highlight the strengths that characterize the initiative.
The active role of public governance as well as the implementation of the MaaS system on a regional scale are distinctive features of the project. Through the BIPforMaaS project, regional public governance set the objective of creating a framework of rules for the proper development of MaaS, ensuring fair and non-discriminatory competition. The first phase of the project therefore involved the study of the subject matter and its implementation in the Piedmont region. Subsequently, the Region started working on a Guidelines and Soft Law document defining the rules for the MaaS community. Thanks to this initiative, a Memorandum of Understanding was signed between all the public bodies in the area—the Piedmont region, Piedmont Mobility Agency, the City of Turin, and the Metropolitan City of Turin—on the principles and actions considered fundamental for the development of MaaS. The active role of governance was therefore key for the launch of BIPforMaaS, the first MaaS project in Italy that implements mobility as a service starting from governance and reaching a high level of development.
The Piedmont region already has a consolidated electronic ticketing system (i.e., BIP), which facilitates the implementation of payment functionalities. Several shared mobility services are already present in the territory (
Table 5), and they only need to be integrated into a single platform. Through an extensive information campaign, all the stakeholders in the territory have been involved in order to build a shared vision of mobility. This is important to better reconcile the different objectives and to achieve the environmental and social targets. Furthermore, the project promotes the creation of an open market for the development of MaaS services, attracting new players and investments to the territory.
On the other hand, the fragmentation of local public transport services is a point of weakness. There are 60 public transport operators in the Piedmont region; this makes the integration process more difficult, as fragmentation increases the complexity of the system.
Over the years, Piedmont’s industry and economy have been strongly characterized by the presence of the car manufacturer FIAT (now Stellantis N.V.) in the region. Due to the deep-rooted Italian—and especially that of Piedmont—car culture, heavy use of private cars (Eurostat, 2020) persists even though FIAT has become Stellantis and Piedmont’s production is concentrated only on luxury brands (e.g., Maserati). As proof of this, we can cite the launch (spring 2021) of a free-floating car-sharing service called LeasysGo that makes the electric FIAT500 available. Another weakness is the timing of the project to create the Piedmont MaaS ecosystem: the development of a regional system takes longer when using a top-down approach.
In terms of opportunities, MaaS would allow for greater market segmentation, i.e., targeting particular types of users that are currently not fully satisfied (such as commuters or tourists). The implementation of MaaS would foster more sustainable mobility, especially in urban areas, by promoting cultural change among citizens. MaaS would also lead to a complete digital evolution of the mobility ticketing system and in general to a full digitalization of mobility services in the Piedmont region. The regional scale of BIPforMaaS would expand the mobility offerings to include rural areas, which are not commonly considered, as MaaS is typically implemented in urban areas.
As far as threats are concerned, it is difficult to implement the necessary digital evolution considering the numerous actors involved (60 public transport operators). It is also challenging to engage users in the cultural change necessary to attain all the benefits promised by MaaS. To complicate matters further, the pandemic has not facilitated the modal shift, as the new normal has not yet been fully achieved and it is complex to accurately predict future user needs. Although BIPforMaaS promotes competition and an open market, as the development of the ecosystem is a complex process, a monopolistic market may occur due to the difficulty for new MaaS providers to achieve high levels of integration.
The SWOT analysis revealed numerous weaknesses and threats that could jeopardise the successful implementation of MaaS services in the Piedmont region. In order to overcome these challenges, it is recommended to exploit the existing strengths of the BIPforMaaS project, such as the active role of the public administration and the high degree of stakeholder involvement, to create a strengthened and shared system at the level of objectives and strategies. To this end, during the BIPforMaaS project, several round tables were organised with local transport companies, technology providers, and MaaS operators to understand their needs and create a common path. Most local transport companies were ready and in favour of a renewal of digital solutions, provided, however, that there is an increase in journeys and users. Thanks to MaaS, the growth in the number of users and trips should happen because users will be more inclined to make a modal shift.
4.2. Preferences of Piedmont Region Users
For MaaS to be successful, the offering must meet user needs. It is important not only to provide adequate services and assemble appropriate mobility packages, but also to ensure that prices match the users’ perceived value. To better understand users’ opinions on MaaS, their propensity to adopt the service, and their travel habits and preferences, 5T launched a survey in collaboration with the Links Foundation in October–December 2020 [
45]. This survey was disseminated through various information channels: the BIPforMaaS website, mailing lists, universities, and public bodies. It is useful to clarify that the purpose of the survey was not to generalize the results obtained. Since the BIPforMaaS project aims to provide guidelines, the purpose of the survey was primarily to define a procedure to be followed in developing the MaaS platform and not to actually develop the platform itself. To determine the sample analysed, 5T and the Links Foundation deemed it appropriate to use the purposive sampling method because it was quicker and easier to implement. Although the sample was not collected using probability sampling methods, it was considered to be sufficiently representative for the purposes of the project: primarily to develop the pilot, but also to provide guidelines regarding the methodology to be followed in developing a MaaS platform with a high level of development and that can achieve coverage of a wide territory.
The survey was divided into two parts. In the first part, data regarding socio-economic characteristics, and data on current mobility habits were collected (
Table 6). In the second part of the survey, multiple-choice questions were asked to collect preferences regarding the proposed packages, products, or services.
A total of 3428 responses were collected, 33% of which belonged to the urban context.
Table 6 summarizes the results of the first part of the survey. Gender, age, residence, and income represent the main characteristics of the sample. With regard to travel habits, the sample was divided into individuals who commute daily to work/school and individuals who do not. The place of work/school and the means of transport used were also taken into account.
Individuals who commute daily prefer to use public transportation, while individuals who do not commute daily use public transportation but would prefer to use a private car.
BIPforMaaS aims at the evolution of the digital infrastructure of the BIP system by including two different services: pay-per-use, a new integrated regional tariff system for public transport, and mobility as a service, i.e., the integration of regional public transport with other transport services.
In the survey, preferred payment methods and users’ reasons for the eventual lack of interest in both pay-per-use and MaaS services were analysed.
Table 7 shows that, as far as the preferred payment method is concerned, in both cases BIP card recharge based on actual usage is the preferred option. Most respondents are interested in the development of pay-per-use services (71%) and MaaS (82%). In addition to that, 72% of the sample is interested in the possibility of sharing mobility packages with family members; this option is hardly ever mentioned in studies on MaaS, but it could be a good starting point to leverage MaaS membership.
Table 7 also shows that 84% of the sample is interested in having a single app through which they are able to book and pay for all available mobility services. A small percentage (16%) is not interested in a single app service. In particular:
A total of 26% of the respondents satisfy their mobility needs by using a private car;
A total of 24% want to be independent in combining transportation services without the constraint of pre-packaged MaaS solutions;
A total of 17% of the sample is satisfied with the use of public transport;
A total of 14% do not want to depend on their smartphone to organize their trips;
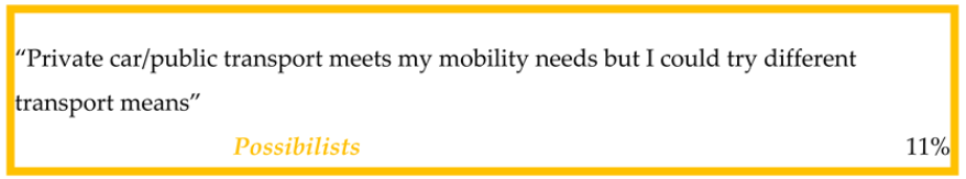
A total of 11% of the respondents think that, even if they are already satisfied with the use of public transport or private cars, they might try different options. For this reason, the last part of the sample is considered “possibilist” (orange box in
Table 7) as these users would try MaaS solutions.
The results of the survey also show that men are a little more interested in mobility packages than women and that interest increases with the level of education. Moreover, interest in MaaS decreases with increasing age or income. Interest in the system is lower for people living in rural/suburban areas and for those who use private cars a lot.
The second part of the survey aimed to compare different possible mobility packages in order to determine which services should be grouped into MaaS packages, also considering the perceived value of these services.
Table 8 summarizes the most preferred proposed packages that emerged from the survey (which are indicated in
Table 8 as “Packages A–G”) differentiating the answers according to the type of user: public transport user and car user.
As expected, public transportation users always demand the presence of urban public transportation along with other public transport and sharing services, giving priority to bike-sharing. Car users show the same interest in urban, suburban, and sharing services, giving priority to bike-sharing and car-sharing services. Motorists’ preference for public transport and car-sharing services in the most popular packages can be interpreted as a willingness to switch to more sustainable travel modes if the offering meets their needs. Neither type of user considers taxi, car rental, rental with driver (RWD), or carpooling as an important service to include in these packages. In Italy, unlike in other countries, taxi/RWD services are considered a luxury service because their rates are high. Only in recent years has the service also become digital, offering shared rides and discounted prices. Another aspect to consider is that, in Italy, the impossibility of introducing services such as Uber drives users away from this type of service.
In the urban context, the perceived usefulness of MaaS packages decreases as the price increases and increases as the number of services offered increases. Urban local public transport is the most attractive service among those proposed in the survey, followed by micro-mobility and car sharing. However, it should be considered that 89% of the sample live in urban areas (
Table 6).
The survey also analysed the willingness to pay for various services since price is a decisive factor in users’ choice of mobility packages. Each respondent proposed an ideal price associated with their specific selected package. On average, the price deemed appropriate for a MaaS service monthly subscription was around 180 EUR/month. Urban public transport is the only service that is priced appropriately or close to actual values. In some cases, respondents are even willing to pay more than the market prices: suburban public transport, if included in the package, should be included at a symbolic cost, as it is valued far below its real price. The gap between willingness to pay and the actual prices of the packages increases when taxis, car rentals, and micro-mobility are added. The reason for this could be low interest in a large number of services or a desire for a unit price that decreases when the offerings increase. Taxi/RWD and car rental are undervalued while car-sharing and micro-mobility values are close to their actual prices.
In the suburban context, the conclusions are similar but, in this case, suburban public transport is considered the most attractive service and price is not the most important element of choice. With regard to willingness to pay, the conclusions are the same as in the urban context, except for the appropriate value attributed to suburban public transport service.
4.3. Pilot of the BIPforMaaS Project
The BIPforMaaS project ended with a pilot involving volunteer users who used a MaaS app for their trips. The scope of the pilot included both rural and urban areas. In order to collect applications for participation in the pilot, a Google Form was created on the Google platform, linked to a professional user base acquired by 5T, allowing aspiring testers to apply to take part in the pilot. Completion was performed via the web without the need for any authentication. To access, citizens were then invited to fill in an online application form, providing their name/surname, place/date of birth, email address, and mobile phone number. The mobility services available and bookable through the MaaS app were scooter sharing, regional railway, parking, taxi, and car sharing (via voucher). The total number of volunteers who participated in the pilot was 253. However, only 67 of them were active users (users who used the services proposed in the pilot at least once).
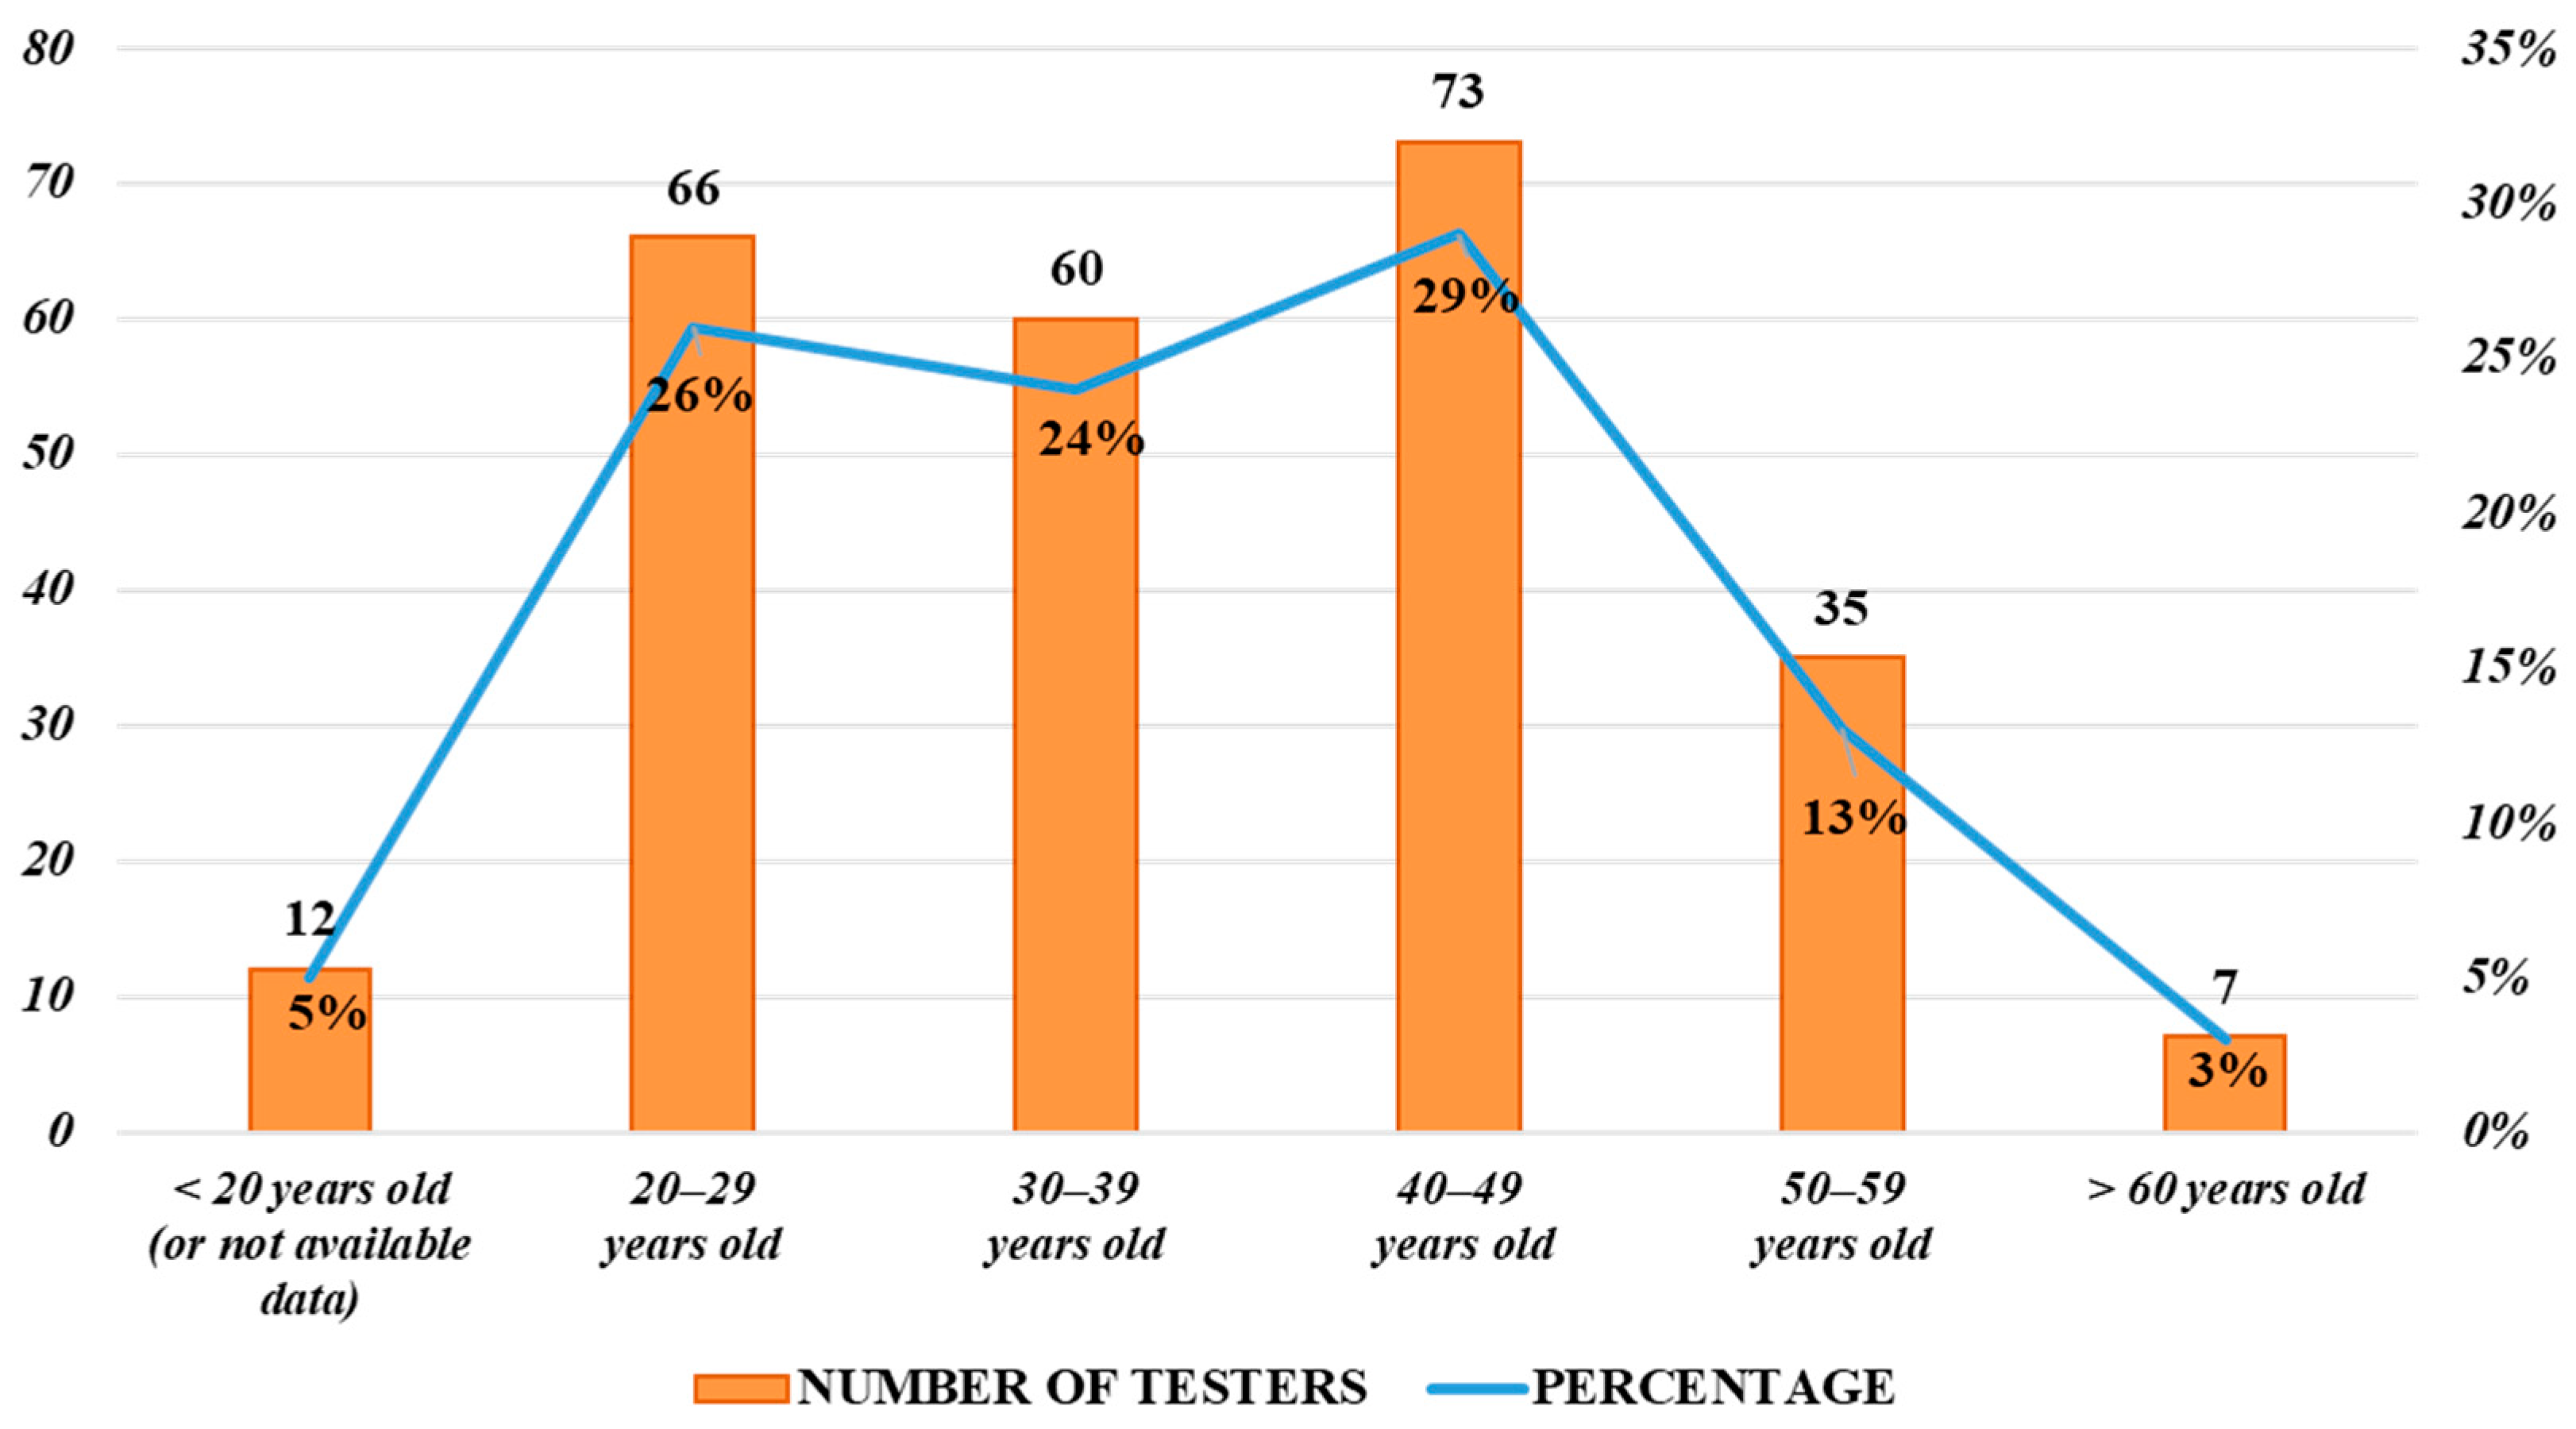
The users were predominantly male. Six age groups were identified (
Figure 10), polarized into three groups from 20 to 49 years: 79% of the testers were concentrated in this age group. As far as women are concerned, there is a concentration in the 20–29 and 40–49 age groups; in fact, each accounted for approximately 17%, whereas as far as men are concerned, there is a greater and more uniform concentration, corresponding to 19% in each of the 20–29, 30–39, and 40–49 age groups.
The total number of purchases was 597 for a total managed value of EUR 3388.89 (
Table 9). In terms of absolute economic values, two out of five services cover 89% of the total: regional railway (75%) and scooter sharing (14%). In terms of individual uses, three out of five services account for 98% of the total: regional railway (57%), scooter sharing (28%), and parking (13%).
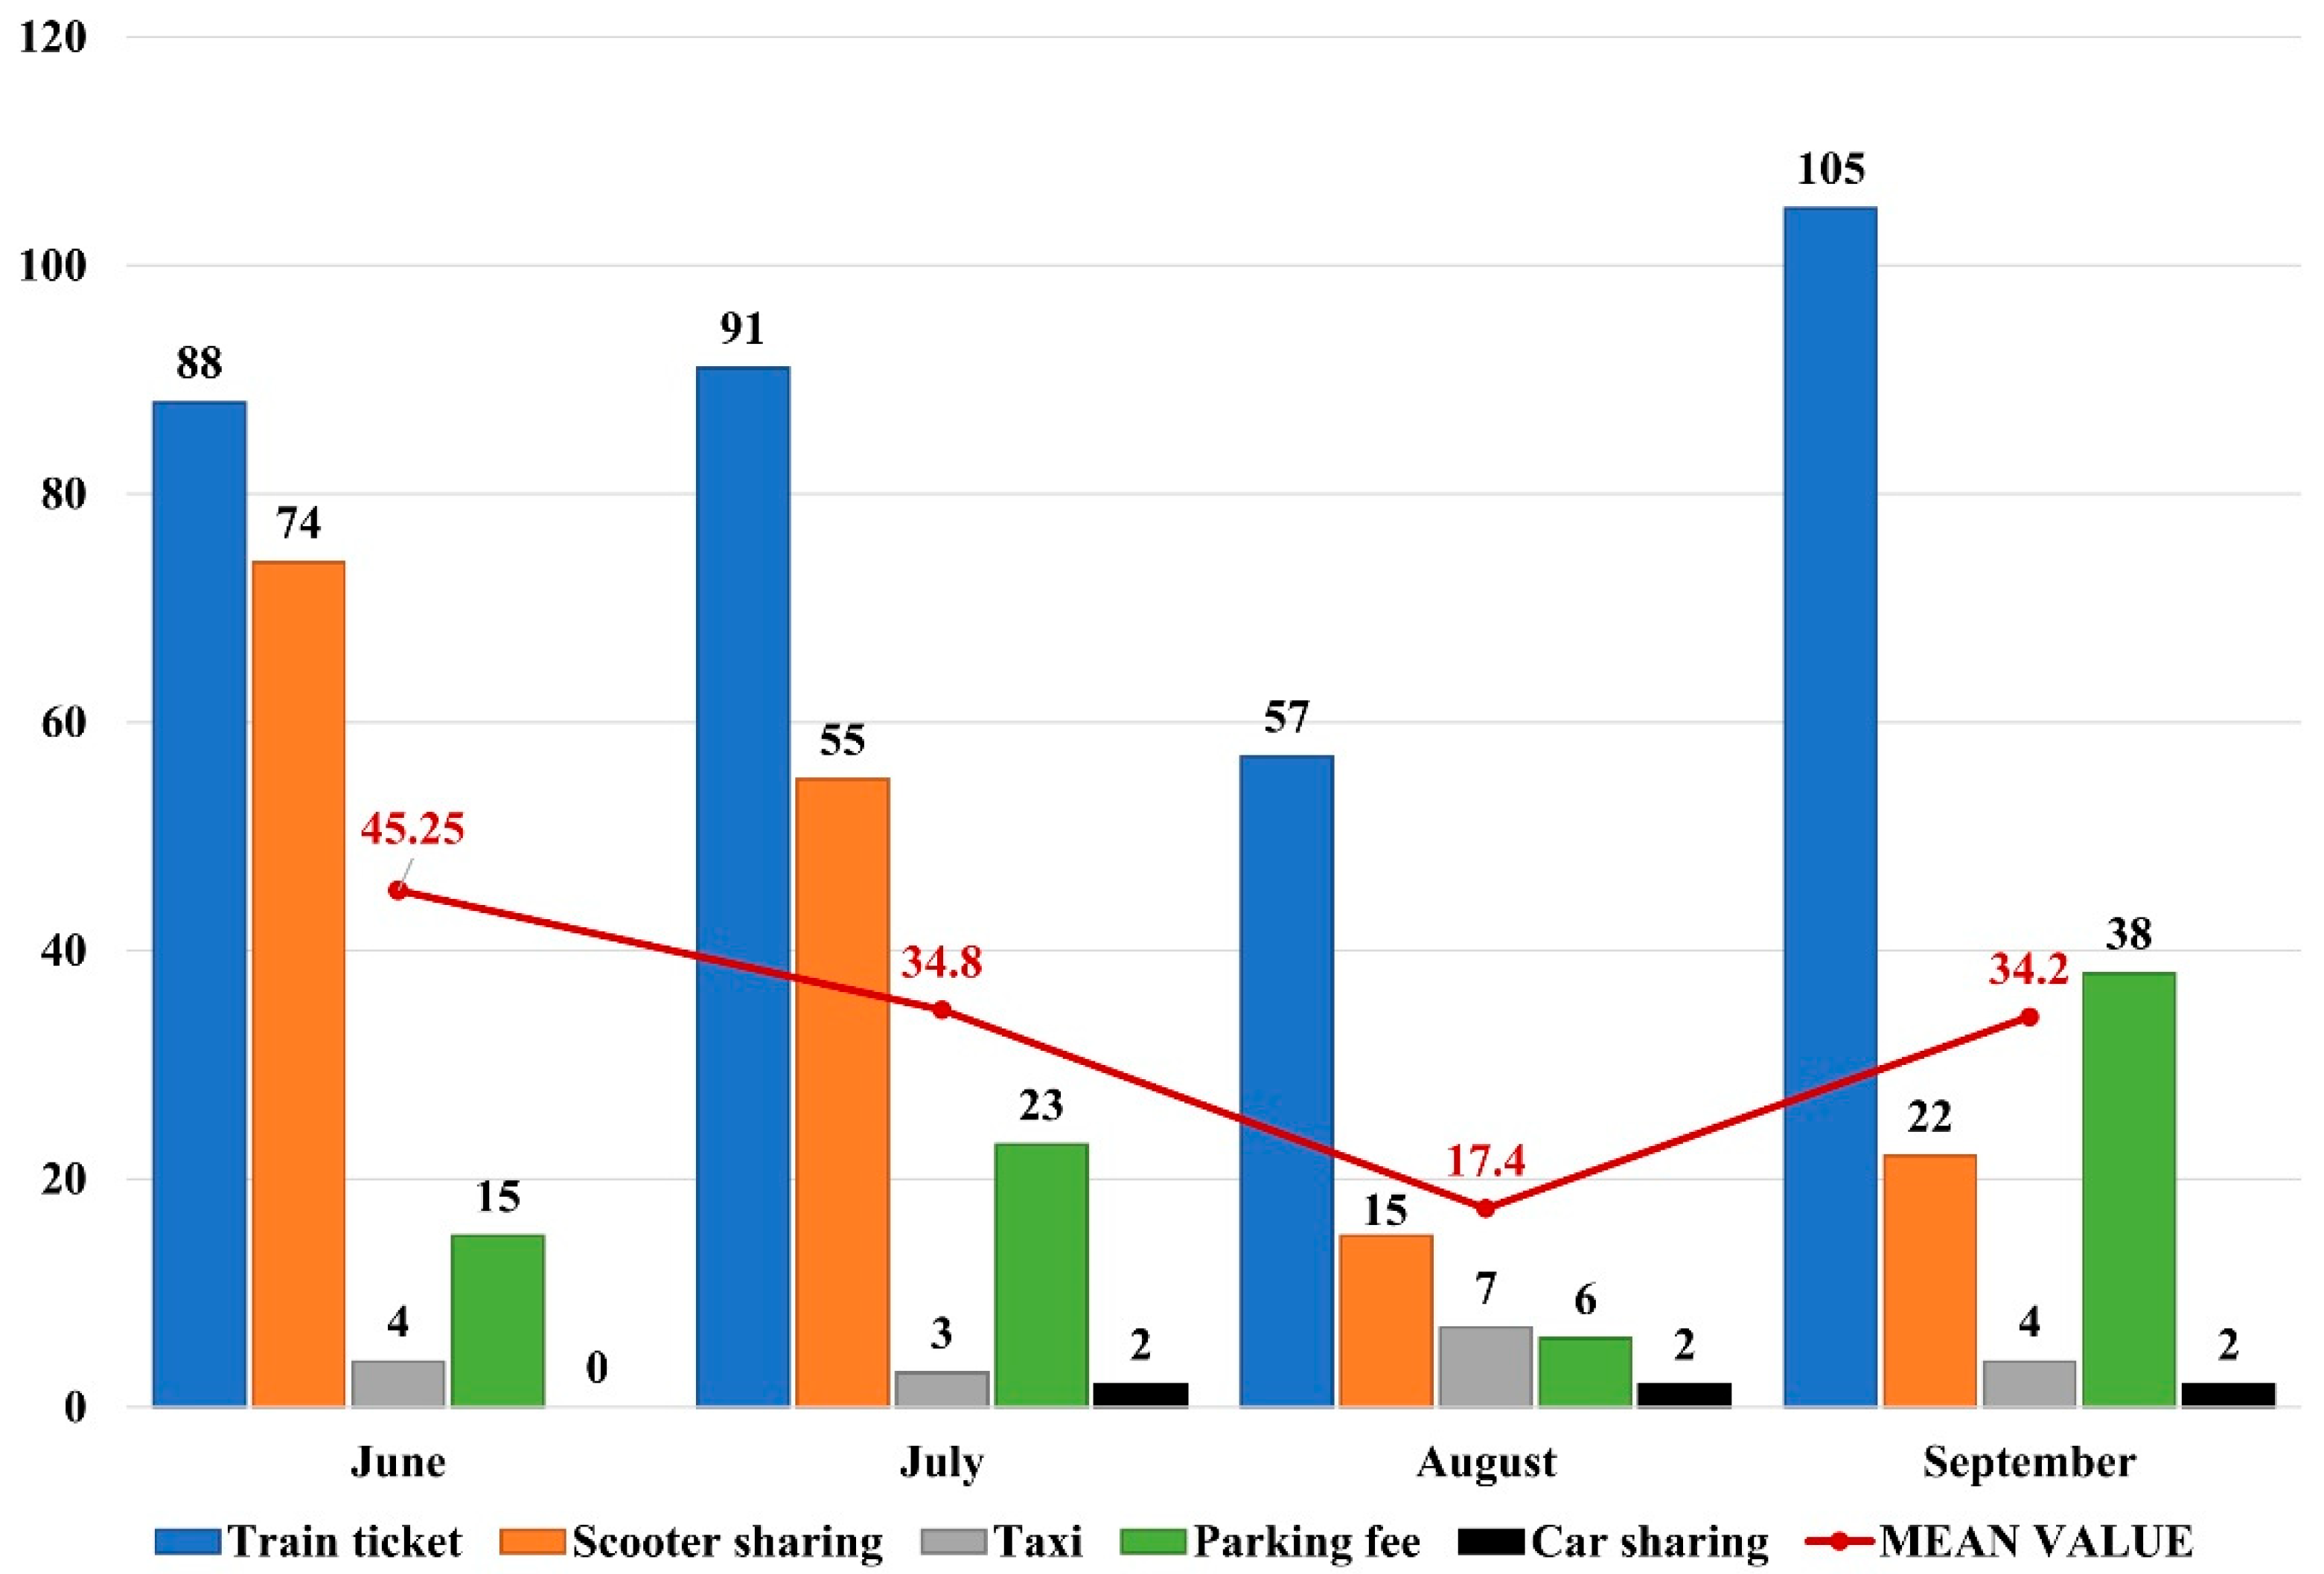
The pilot run was from June to the end of September 2022 and the mobility services available were train, scooter sharing, taxi, and parking, while car sharing was introduced in July 2022. Analysing the trend related to the number of purchases (
Figure 11), a drop was recorded in August due to the summer holidays. However, it should be noted that the high number of regional train ticket purchases, although decreasing in the middle of summer, kept the overall average high. The number of scooter rides also declined after an initial peak, with a slight recovery in September.
From the point of view of the amounts spent, the regional rail ticket dominated all other options, and it also corresponds to the highest number of purchases. In particular, railway transport expenditure equals about three times the value of the other types of travel, with the exception of car-sharing vouchers.
Rail transport was shown to be the backbone both in terms of average amount, absolute amount, and number of purchases. However, it is also important to note the good response of users to the opportunity offered to rent scooters. Especially in the first two months of experimentation, significant values were achieved in the number of purchases but also in terms of the total expenditure on scooter sharing (
Figure 12), considering that the average amount per rental corresponds to a small value due to the nature and extent of the service. With regard to the trend in expenditure during the pilot period,
Figure 12 shows a decreasing trend in total average expenditure during the first three months. The last month, however, shows the highest average total value. In September, there was a spike in expenditure related to the purchase of train tickets, but also an increase related to parking services. As for
Figure 12, the expenditure on taxis in July was zero because, although three taxi services had been booked (
Figure 11), due to multiple strikes it was not possible to use the service.
In terms of combined mobility services, of the 67 active users, 18 used more than one service (27% of the total). On average, users combined two services; only one user used three combined modes (train, taxi, and parking). Combinations accounted for an expenditure of EUR 1156.24 out of EUR 3388.89, corresponding to around 34% of the total. The four most frequent combinations, corresponding to an expense of EUR 947.60 or about 28% of the total, were found to be:
Train and scooter, approx. EUR 509.00;
Train and parking, approx. EUR 180.00;
Car sharing and scooter, approx. EUR 145.00;
Train and car sharing, approx. EUR 114.00.
As proof of the importance of the railway offering and the appreciation of users, the railway ticket appears three times out of four, followed with equal merit by scooter- and car-sharing services.
Focusing on the combined use of different services on the same day, it can be seen that multimodality was used on five occasions, by three different users, always in the scooter–train combination. Analysing the number of train trips, it can be assumed that these were round trips and that the scooter was used as the “last mile” to complete the route.
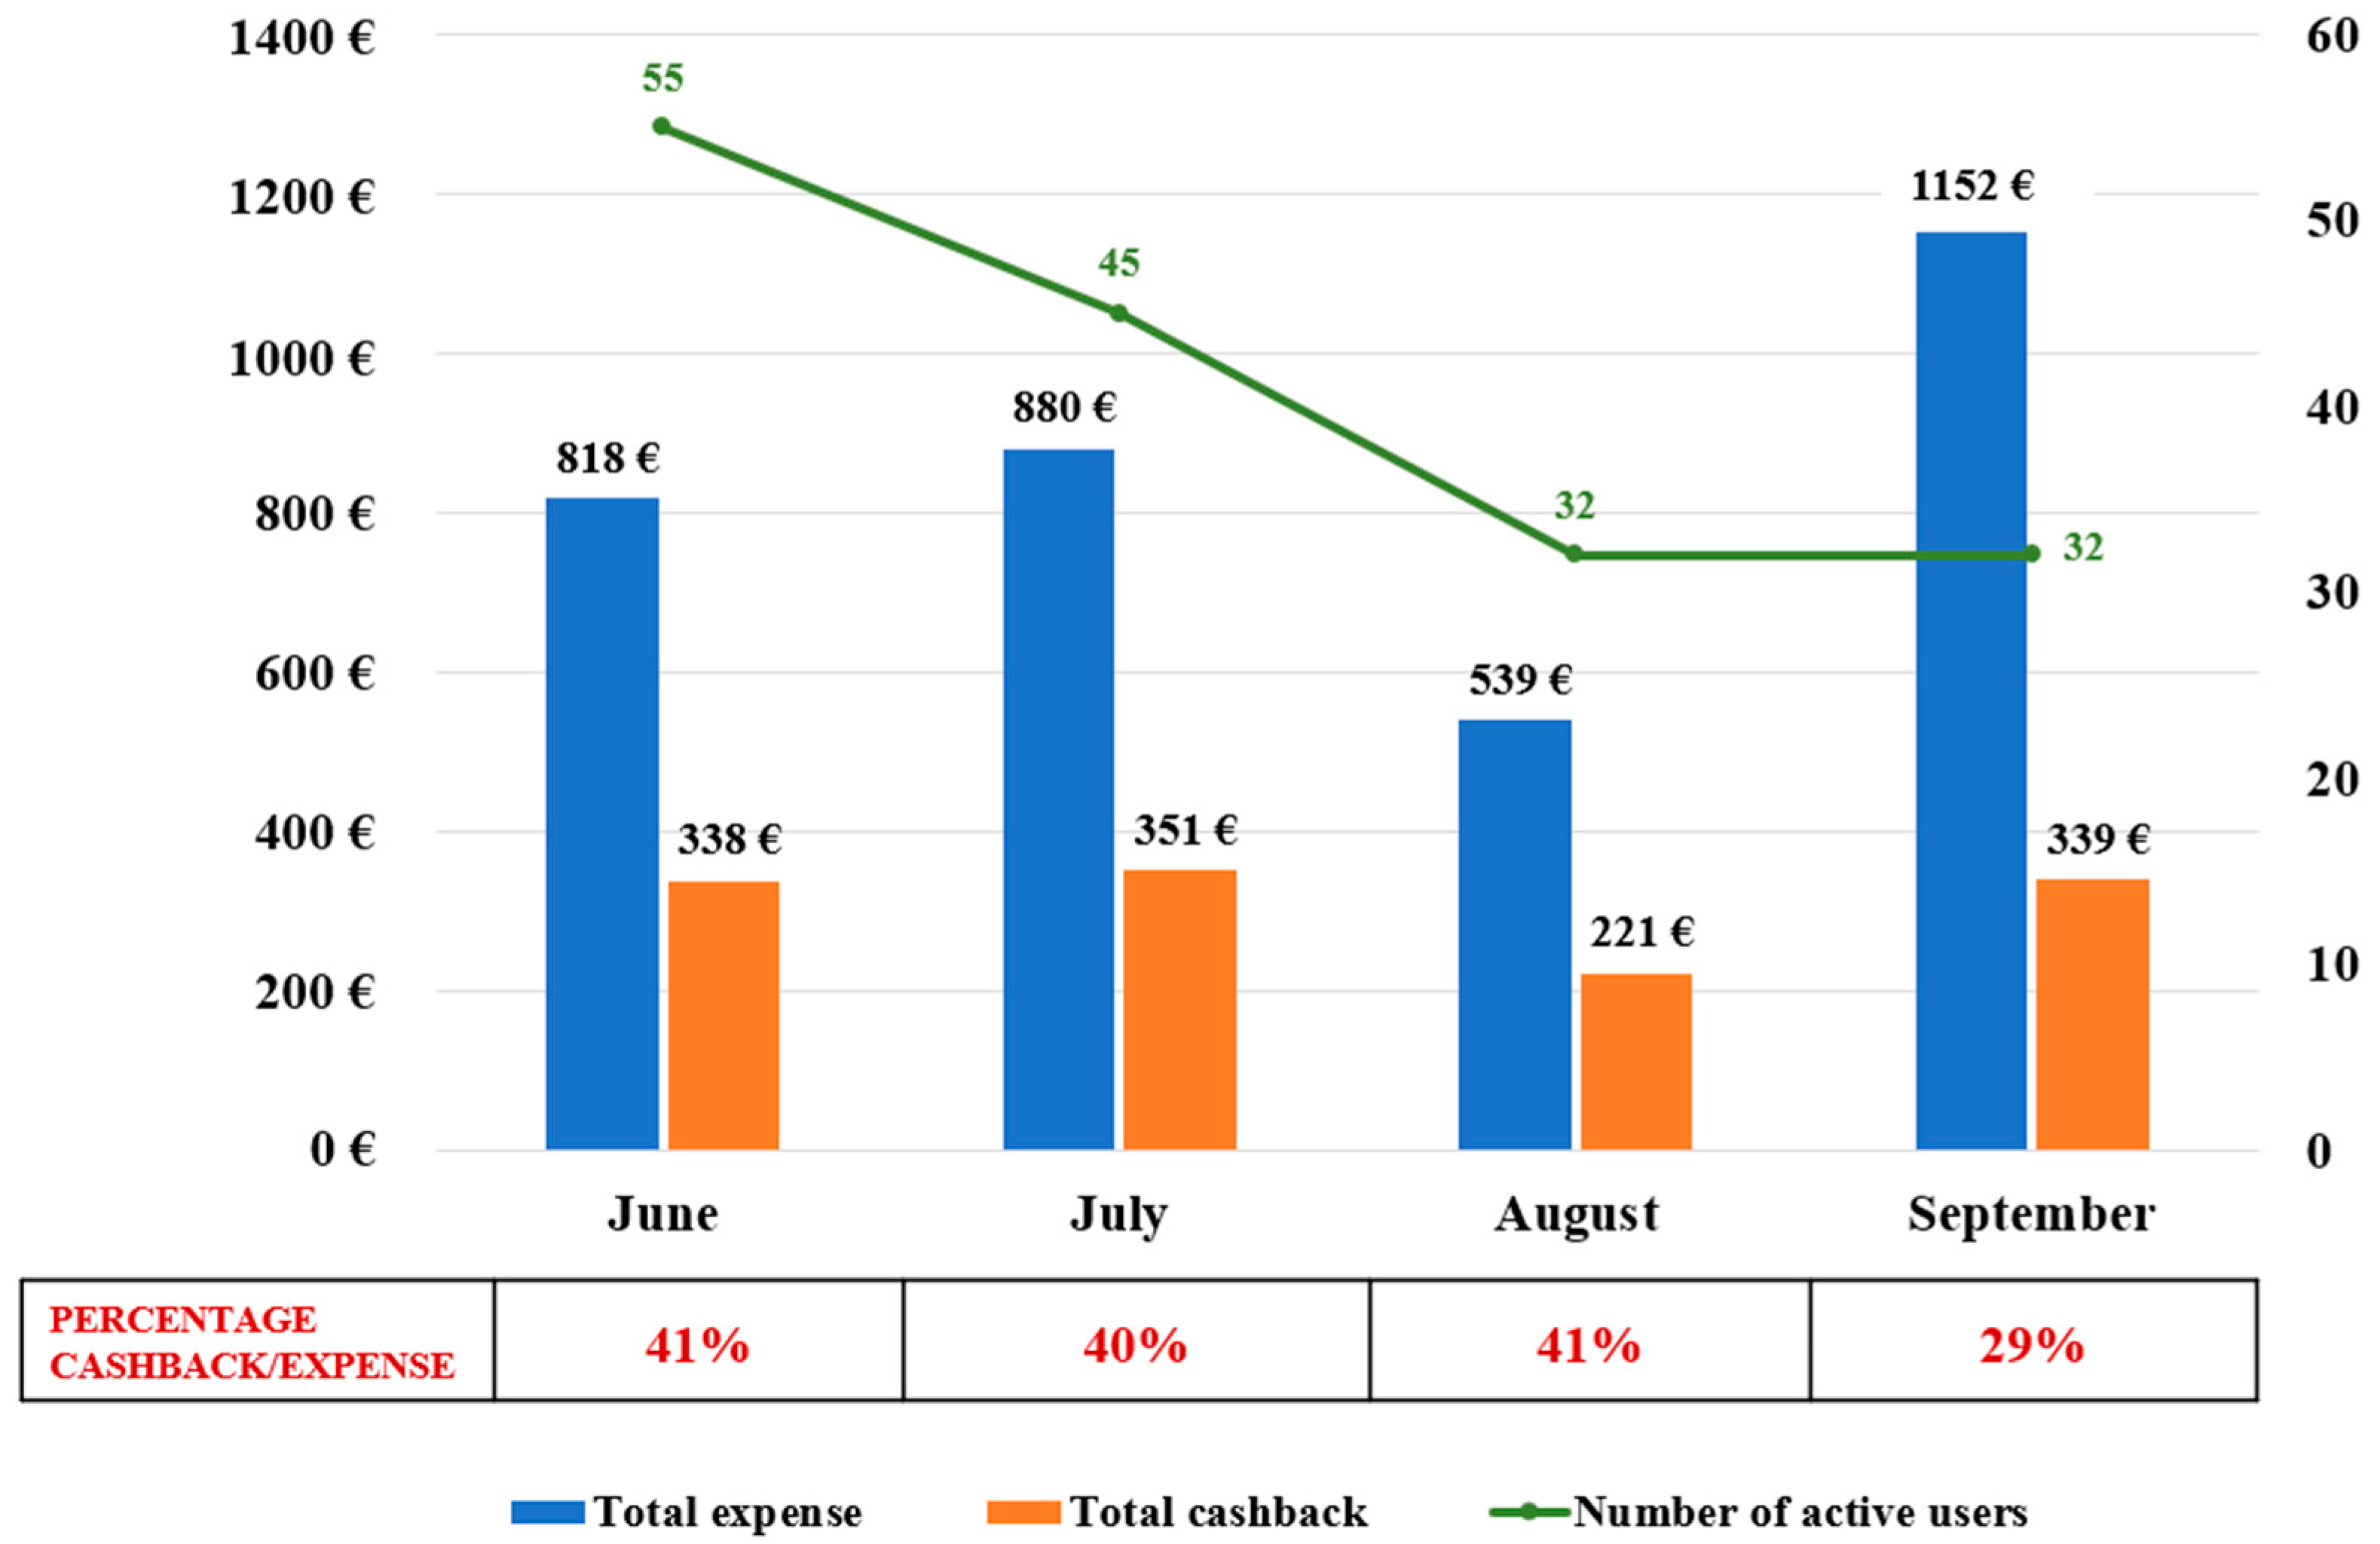
Cashback was identified as the instrument through which to incentivize the user to increase demand. The mechanism involved the recognition of 50% of the amount spent the previous month, up to 15.00 EUR/month. The amount paid out was about 37% of the users’ expenditure, for a total of EUR 1249.60 refunded.
Figure 13 shows that the cashback trend remained more or less stable in the first three months (around 40% of the total expense), while it decreased in September (29% of the total expense).
Figure 13 also shows that the number of active users followed a decreasing trend during the pilot.
The pilot was useful to understand the extent to which the guidelines produced by the BIPforMaaS project were effective but also to understand how potential users interface with a MaaS-type service. The testers certainly showed interest in using combined mobility services.
5. Conclusions
Mobility as a service contributes to the overall improvement of transport systems by offering integrated and multimodal solutions, focusing on collaboration, trust, win–win logic, and open ecosystems.
MaaS is a complex system that needs some basic prerequisites to be properly developed such as ITS (as for example AVL and AVM); technical standards; and coordination among operators offering public transport services, shared mobility, car e-charging, parking, and possibly other services related to transportation and mobility, together with a control room suitable for this purpose and trusted by the operators.
In addition to the above-mentioned prerequisites, there are some important challenges that need to be addressed when developing MaaS: changing travel behaviour, understanding user needs, managing the wide network of stakeholders, and interactions among heterogeneous players.
While the existing literature has often focused on one specific aspect of MaaS at a time, this paper considers multiple aspects (strengths and weaknesses, user perspectives, MaaS characteristics, technical, and governance aspects) providing a more comprehensive view of mobility as a service. The paper provides a novel comparison among several experiences concerning the implementation of mobility as a service in some European cities. The comparison shows that:
A high level of MaaS development is still difficult to achieve, given the complexity of the service;
Private initiatives seem to be faster in the implementation process, although they need to be regulated;
Public governance is the most appropriate entity to develop MaaS services since it can allow the achievement of a higher level of integration, along with a high adoption rate of the service; public governance can help in coordinating all the stakeholders involved in an unbiased manner and better organize the services included in the MaaS platform. Public governance reduces market entry barriers for MaaS operators, increasing competition and consequently fostering a higher level of service. Moreover, since public transport is considered the “backbone” of MaaS and public transportation modes are always present from the earliest stages of all MaaS projects, public governance can easily provide the initial foundation for the implementation of mobility as a service;
Typically, whenever public bodies implement MaaS initiatives there is greater geographic service coverage.
A specific focus of the paper is the BIPforMaaS project, which is currently the only project in Italy that aims to develop the MaaS system at a high level of integration in a regional perimeter with public governance. This project is particularly significant because its objective is to provide a guideline for public governance in a MaaS ecosystem that can be applied to other Italian but also European contexts and foster high-level development of MaaS initiatives. The main strength that differentiates this initiative is precisely public governance, which translates into several advantages, including the establishment of a regulatory framework that ensures fair competition and non-discrimination. Although public initiatives currently seem to be slower to develop and less integrated, the case study analysed lays the foundations for a more effective service. In addition, the implemented pilot project demonstrated that the proposed system is capable of achieving high levels of service development and integration (
Table 3 and
Table 4), also thanks to public governance. A regulated platform involving all the stakeholders will be essential to build a shared vision of mobility and to create an open market for mobility services. The pilot that concluded the project provided a basis on which to develop the actual MaaS platform. It highlighted that public transport (in this case the train) remains the most used service. However, the pilot allowed users to test the use of alternative services (scooter sharing and parking services were the most used). The next step will be a project, called “BIPforMaaS+”, that aims to develop the MaaS platform on a full scale in the Piedmont region.
The major limitation of this study is the scarcity of data available due to the early stages of development of many MaaS initiatives; this made it complicated to perform a more detailed comparison among the different initiatives considered.
As for the next step in research, it would be interesting to follow the evolution of the Piedmont project until the implementation of the platform to specifically analyse the large-scale development of what was tested in a small way with the pilot. It would also be interesting to apply the same framework to other European cities to verify if the guidelines developed by 5T can be easily applied in contexts other than Italy.


