Article

Exploring a Novel Reservoir Impoundment Operation Framework for Facilitating Hydropower Sustainability

State Key Laboratory of Water Resources Engineering and Management, Wuhan University, Wuhan 430072, China
*
Author to whom correspondence should be addressed.
Sustainability 2023, 15(18), 13400; https://doi.org/10.3390/su151813400
Submission received: 24 July 2023 / Revised: 4 September 2023 / Accepted: 5 September 2023 / Published: 7 September 2023
(This article belongs to the Topic Hydrology and Water Resources Management)

Abstract

:
Reservoir impoundment operation has far-reaching effects on the synergies of hydropower output, floodwater utilization, and carbon fluxes, but flood risk is significantly increasing, which is especially true when shifting to earlier impoundment timings and lifting reservoir water levels. This study proposed a novel reservoir impoundment operation framework driven by flood prevention, hydropower production, floodwater utilization, and carbon emission management. The Three Gorges Reservoir in the Yangtze River was selected as a case study. The results demonstrated that flood prevention safety could be guaranteed with the initial impoundment timings on and after the first of September. The best scheme of reservoir impoundment operation could efficiently boost synergistic benefits by enhancing 2.98 billion kW·h (8.8%) hydropower output and 6.4% water impoundment rate and decreasing greenhouse gas (GHG) fluxes and carbon budget by 28.15 GgCO2e/yr (4.6%) and 0.44 (23.1%), respectively, compared with the standard operation policy. This study can not only provide scientific and technical support for reservoir impoundment operations, benefiting water–carbon synergies, but can also suggest policymakers with various favorable advancing impoundment timing and lifting reservoir water level schemes to experience related risks and benefits in the interest of hydropower sustainability.

1. Introduction

As is known, human activities, principally through emissions of greenhouse gases (GHGs), have unequivocally caused global warming. Moreover, global climate change has induced adverse impacts on nature and people [1]. To reduce GHG emissions, many countries are working to develop more feasible clean energy systems [2]. Hydropower is generally considered a mature, predictable, and cost-competitive renewable energy source [2]. However, reservoirs are also recognized as one of the significant carbon sources on a global scale [3]. The construction and operation of reservoirs would submerge large quantities of terrestrial organic matter, slow down the flow of rivers, and hinder the flow of nutrients (e.g., carbon and nitrogen) [4], forcing the submerged area to transform the terrestrial ecosystem into an aquatic ecosystem and change the biochemical activities of microorganisms in reservoirs [5]. The processes of autotrophic biological respiration, heterotrophic biological decomposition [6], nitrification, and denitrification in river reservoirs cause greater GHG emissions in comparison to those of natural water bodies [7]. In addition, river reservoirs have a higher organic carbon (OC) burial capacity than natural lakes [8]. Due to complex biochemical transformation processes [4], a considerable part of OC gradually settles at the bottom of reservoirs to form C deposits or burials along with the reservoir sedimentation process [9]. Therefore, both GHG emissions and OC burial cannot be ignored when it comes to reservoir operation and management [10].
For river reservoirs, significant water level change is a main characteristic compared to natural lakes, and the periodic rise and fall of the water level will lead to large changes in water surface areas. The reservoir drawdown area is temporarily and periodically falling dry portion in a reservoir [10]. Several studies have shown that reservoir drawdown areas emit large quantities of GHGs [10,11], of which CO2 is dominant [12]. Recently, reservoir carbon flux assessment and management have become an academic frontier and hot issue, including studies on carbon emissions from reservoir water surfaces [13], carbon emissions from reservoir drawdown areas [14], and carbon deposition [15] and OC burial [8] in reservoirs. Reservoir water level management could be a promising approach to reducing reservoir GHG emissions [10]. Reservoir operation plays a vital role in water resources [16], as well as in carbon flux management [15]. Reservoir operation will affect reservoir water surface areas as well as reservoir drawdown areas [17], thus further affecting reservoir GHG emissions and OC burials. As one of the reservoir operation schemes, reservoir impoundment operation can efficiently enhance water utilization and hydropower production by shifting to earlier impoundment timings and lifting reservoir water levels during the post-flood season [18]. These studies have considered the impact of impoundment operation strategies on flood risk [18], water resource utilization [19], river ecology [20], and water sediment [21]. In addition, for reservoir carbon flux, several studies have estimated carbon emissions of reservoirs on an annual scale [22] and demonstrated the advantage of pumped storage for the carbon emission of hybrid energy systems [23]. To date, evaluating the influence of reservoir impoundment operation strategies on water–carbon benefits from the perspective of carbon emission reduction has gained scant attention in the research literature. Consequently, it is interesting to conduct reservoir impoundment operation research on water resources and carbon fluxes management.
This study introduces a novel reservoir impoundment operation framework for boosting synergies of hydropower output and carbon emission reduction, presenting three contributions. Firstly, the reservoir impoundment operation module was employed to mimic flood risk and benefits based on schemes of shifting to earlier impoundment timings and lifting reservoir water levels. Secondly, the carbon flux calculation module was constructed to evaluate the carbon fluxes of reservoir impoundment operation. Thirdly, the multi-objective evaluation module was applied to identify the best scheme for reservoir impoundment operation. The proposed reservoir impoundment operation framework of this study not only largely facilitates synergies of renewable hydropower production, water utilization, and CO2 emission reduction, but also provides decision-makers and stakeholders with feasible schemes on shifting to earlier impoundment timings and lifting reservoir water levels in the interest of sustainable hydropower development.

2. Study Area and Materials
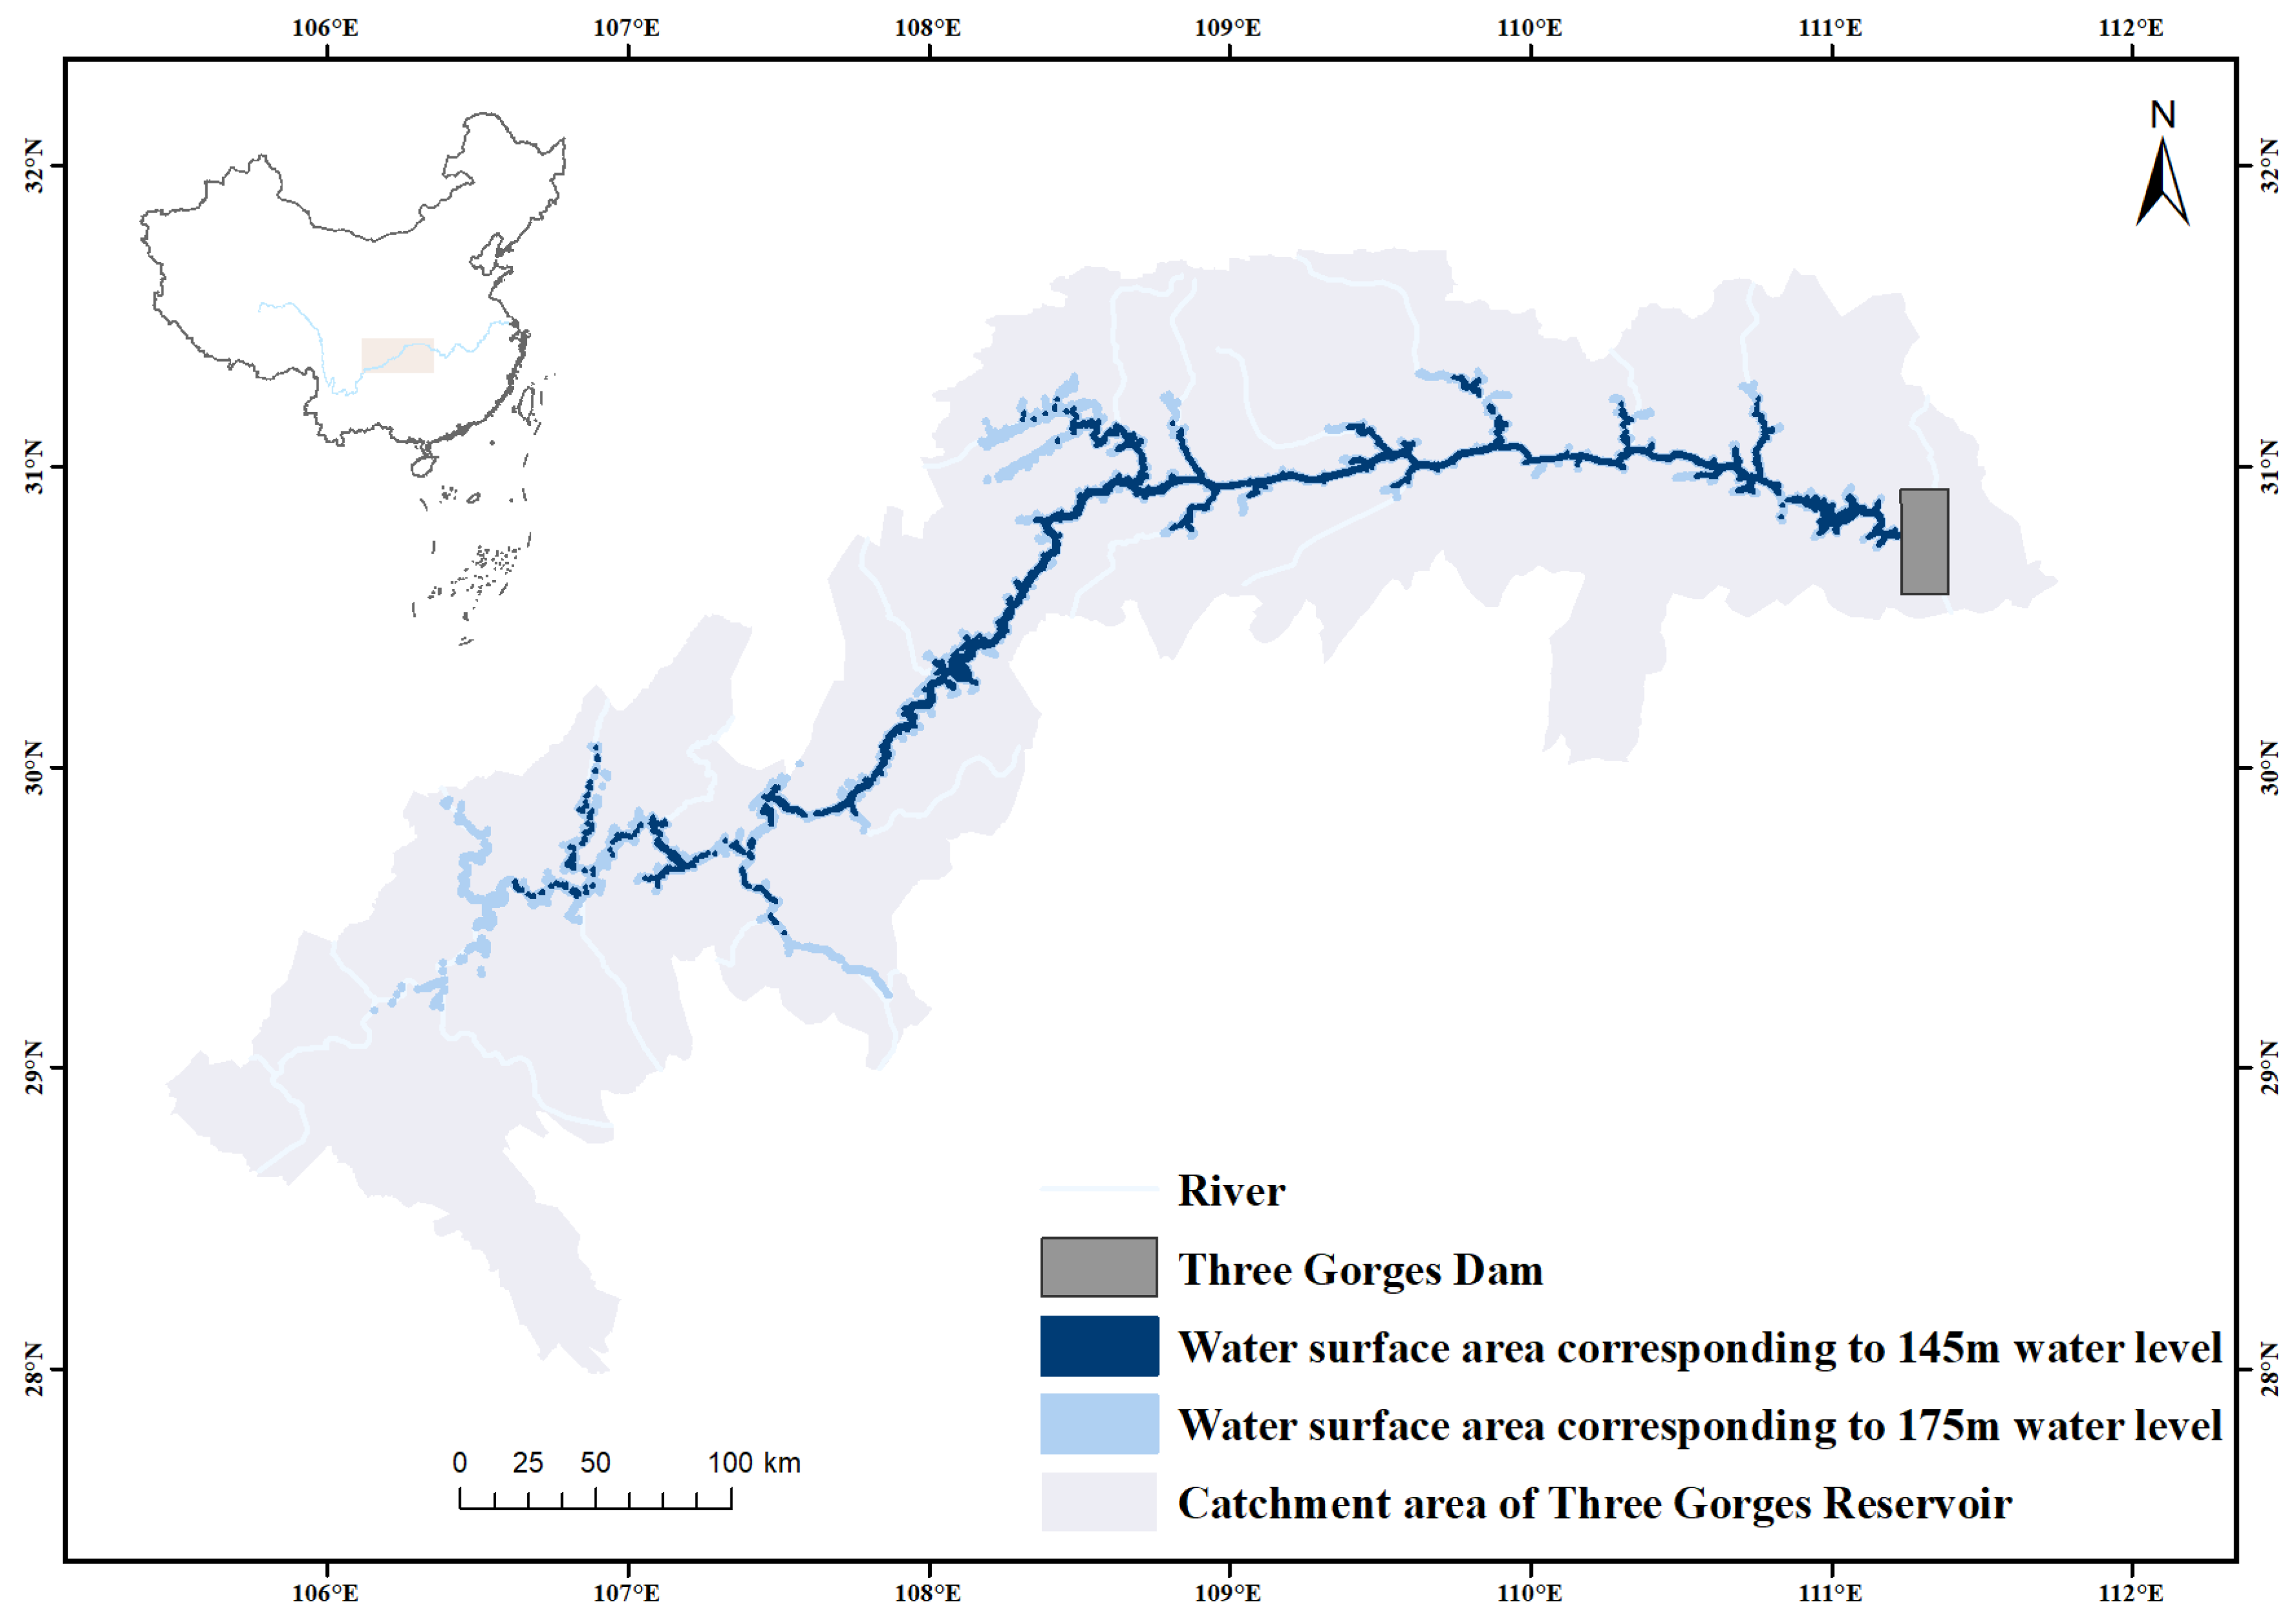
2.1. Study Area

The Three Gorges Reservoir (TGR) is located in the upstream of Yangtze River, with a control basin area of about 1 million km2. The TGR has functions of flood prevention, hydropower production, water resources management, and shipping, bringing huge comprehensive benefits [21]. The TGR possesses 39.3 billion m3 total storage capacity and a normal water level of 175 m, forming an artificial lake with a total area of 1084 km2. Before the completion of the TGR, the cleaning work was carried out, which effectively reduced organic matter degradations and GHG emissions in the submerged area after impoundment, making its CH4 emissions generally low. The application of reservoir impoundment operation strategies of the TGR can promote flood resource utilization and facilitate the green development of the Yangtze River Economic Belt. Figure 1 shows the TGR location and its submerged area in different reservoir water levels. The difference in water surface areas corresponding to 145 m and 175 m water levels is the maximal value of the drawdown area (Figure 1).

2.2. Materials

A representative flood event in 1952 (a basin-scale flood event) was used to calculate the seasonal design flood hydrographs corresponding to 1%, 0.2%, 0.1%, and 0.01% occurrence frequencies by utilizing the flood peak-flood volume magnification method [24,25]. The duration of the flood event is 30 days in the impoundment operation period. The calculation time step is one day for each flood event. The design flood hydrographs were utilized to calculate the constraints of reservoir safety water levels in the impoundment operation period. Furthermore, a total of 18,894 datasets (=1 reservoir × 134 days × 141 years) collected in the impoundment period (20th August–31st December, 134 days) between 1882 and 2022 (141 years) were used to assess the effects of flood risk and benefits from the advanced impoundment operation of the TGR in this study.

2.3. Reservoir Operation Schemes

The standard operation policy (SOP) of the TGR set the initial timing of impoundment operation as 1st October [26]. The optimal operation plan of the TGR reported in 2009 pointed out that the TGR began to implement impoundment operation no earlier than 15th September and the TGR water level should not exceed 158 m on 30th September. According to the joint operation plan of water projects of the Yangtze River in 2022, the initial timing of impoundment operation should not be earlier than 10th September and the reservoir water level on 30th September could float between 175 m and 165 m [27]. The above-mentioned operation plans formulated the impoundment operation schemes only by considering the single reservoir operation. However, with the completion and operation of cascade reservoir systems in the Yangtze River, the upstream flood defense capacity has increased significantly. Therefore, based on the existing impoundment operation plans, 15 impoundment operation schemes (Table 1) were formulated by shifting to earlier impoundment timings and lifting reservoir water levels. These schemes are drawn up by controlling initial impoundment timings and the impoundment water level of the reservoir on 30th September. The water levels in each scheme linearly raise from 145 m to the impoundment water level on 30th September. Scheme numbers are created in accordance with the initial impoundment timings and the impoundment water levels on 30th September. For instance, the scheme of 901167 show that the initial impoundment timing is 1st September and the impoundment water level on 30th September is 167 m.

3. Methods

The reservoir impoundment operation framework proposed by this study is displayed in Figure 2, and consists of three vital modules. Figure 2 presents the relationship of the three modules. The reservoir impoundment operation module and the carbon flux calculation module were utilized to simulate the operation process of each scheme based on the historical data, and to calculate the evaluation indicators. The reservoir impoundment operation module was used to mimic flood risk and benefits based on schemes of shifting to earlier impoundment timings and lifting reservoir water levels. The carbon flux calculation module was constructed to assess the carbon fluxes of reservoir impoundment operation. The multi-objective evaluation module was employed to identify the best scheme for reservoir impoundment operation with the calculated indicators. The methods related to the three modules are described below.

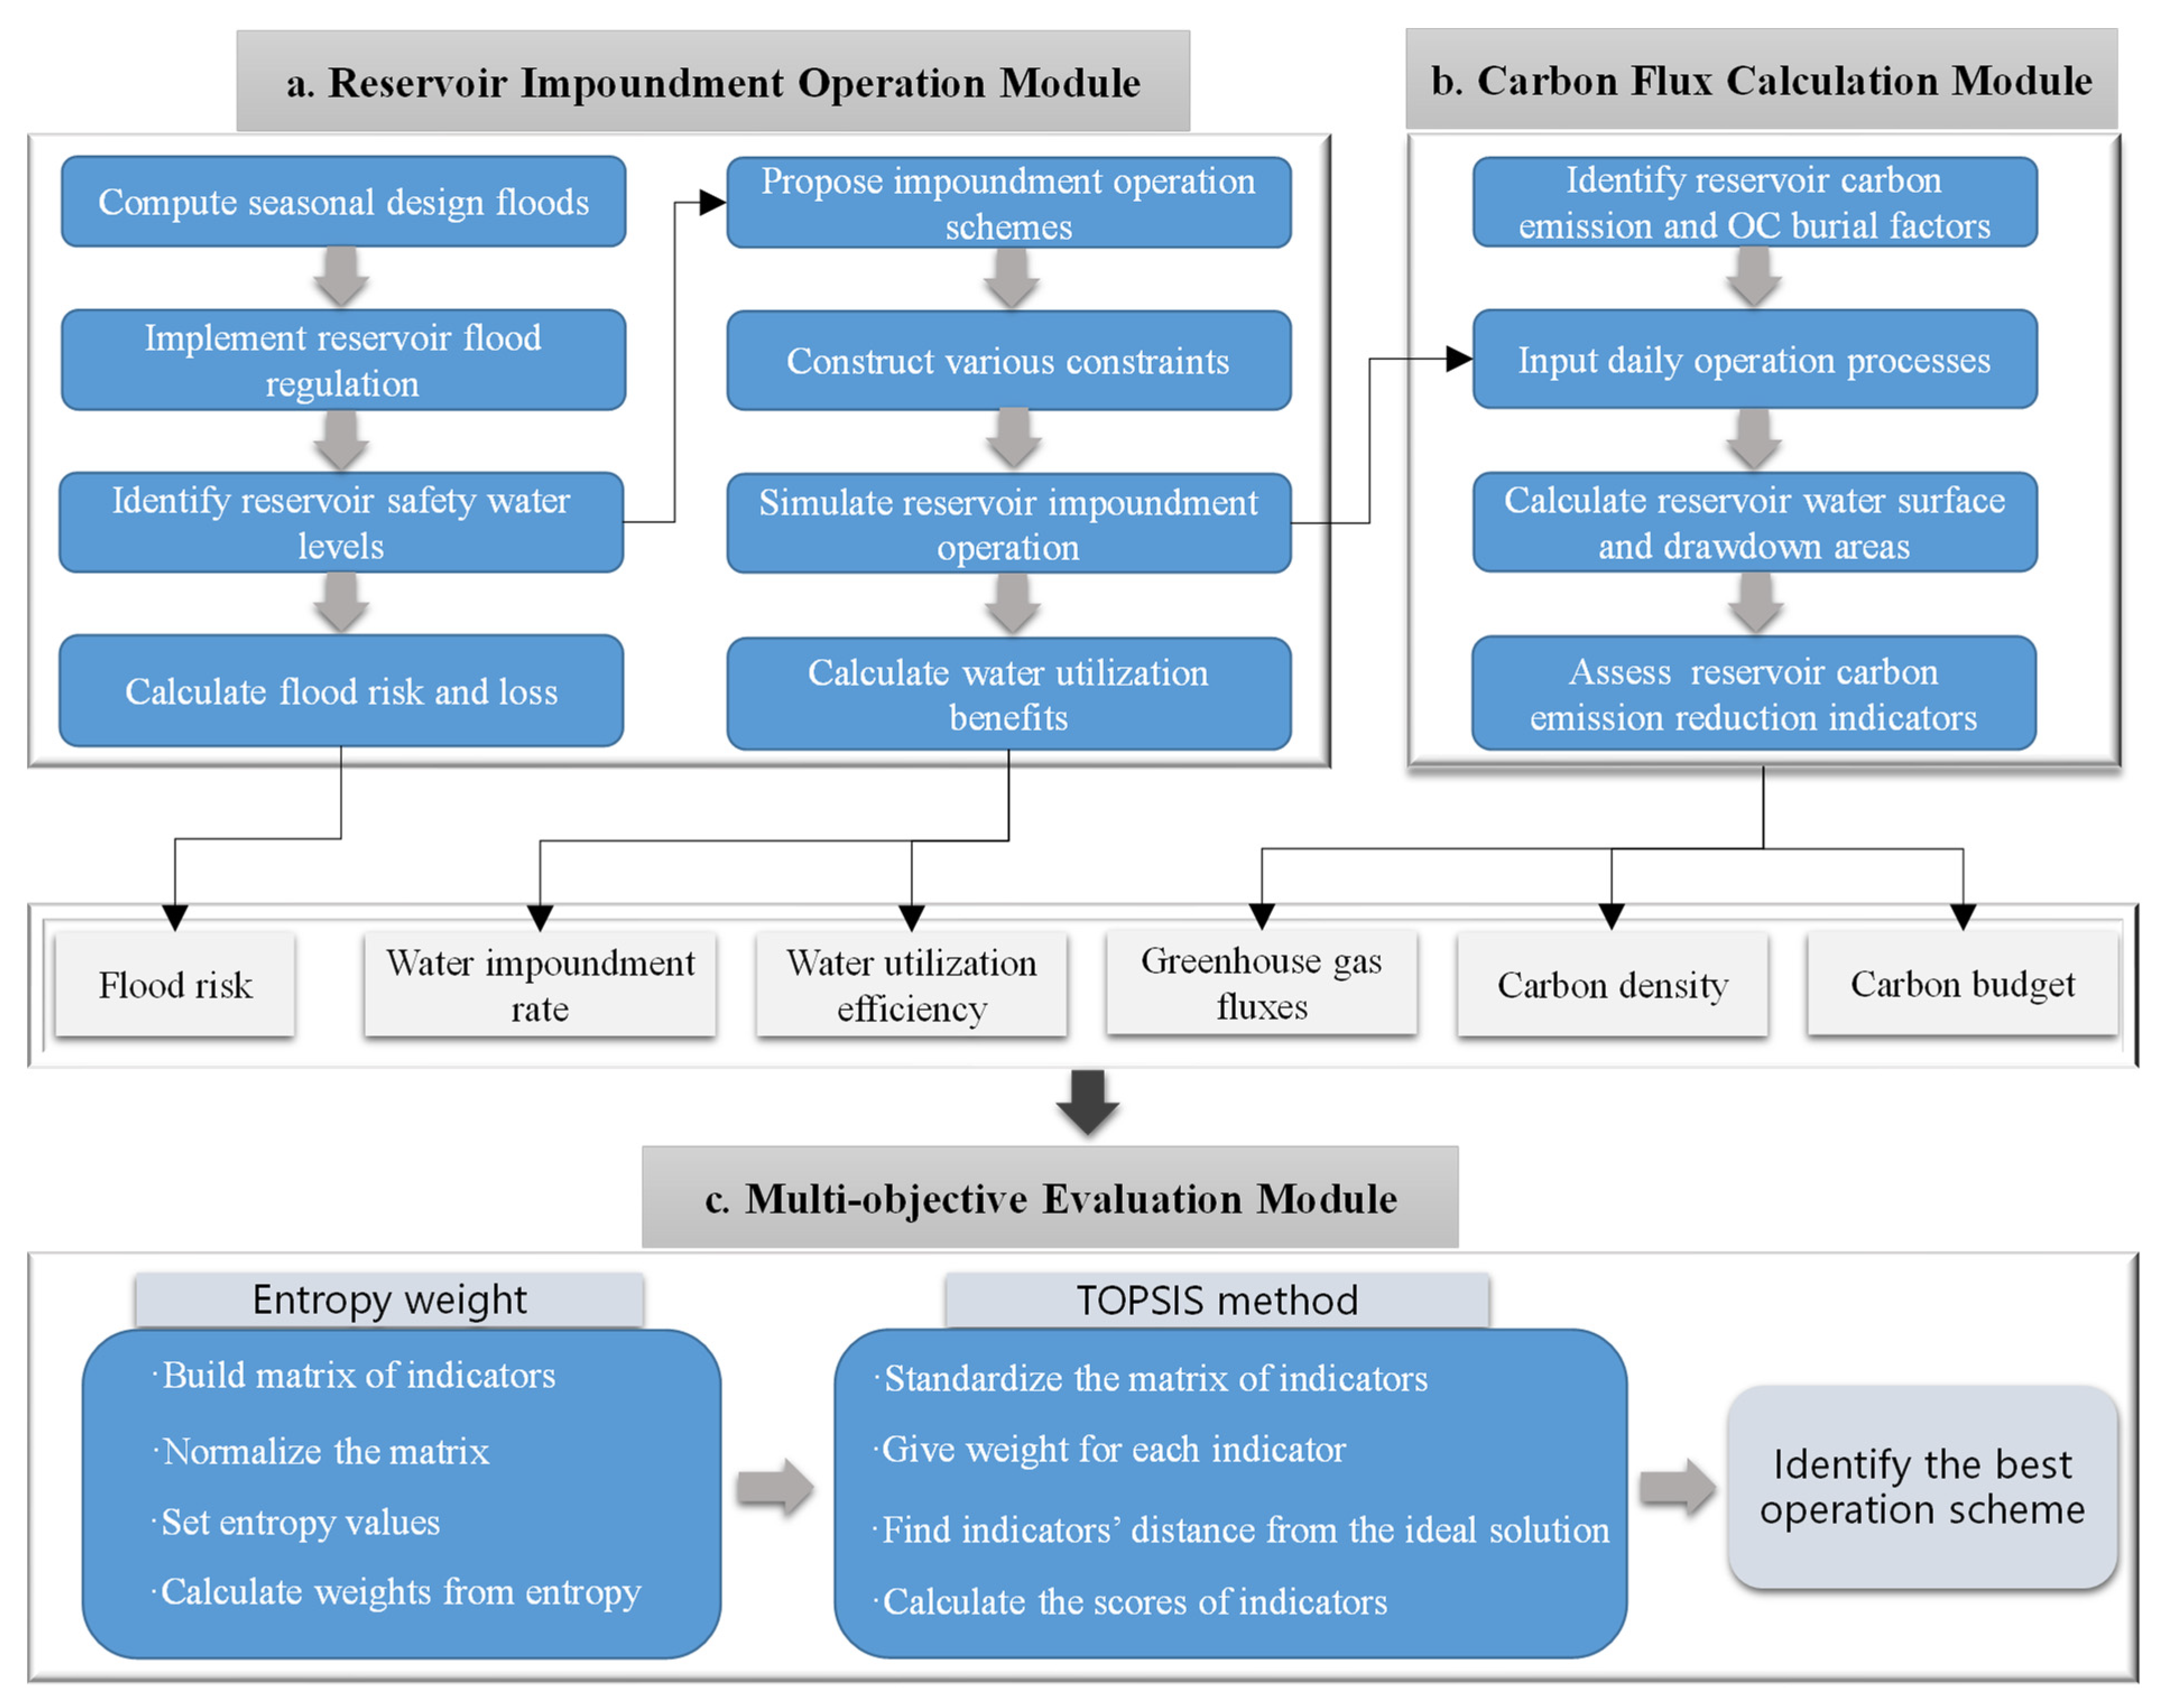
3.1. Reservoir Impoundment Operation Module

This module was constructed to mimic flood risk and benefits of reservoir impoundment operation [28]. Risk analysis was conducted to calculate flood risk and loss [18] through simulating flood regulation processes of various impoundment operation schemes based on reservoir design flood hydrographs. The benefits analysis aimed to calculate hydropower output and water utilization through simulating runoff regulation processes of various impoundment operation schemes based on reservoir daily runoff data.

3.2. Carbon Flux Calculation Module

Reservoir carbon flux assessment is a very complex task involving reservoir pre-impoundment and post-impoundment phases. Considering that the carbon flux data of the reservoir pre-impoundment phase are not acquirable, the model in this study only assesses the impact of the reservoir post-impoundment phase (e.g., impoundment operation) on GHG emissions. The International Energy Agency (IEA) has compiled technical guidelines based on the Intergovernmental Panel on Climate Change (IPCC) framework [2,29], in which the post-impoundment GHG fluxes are equal to the sum of GHG emissions from the reservoir air–water interface, GHG degassing emissions from water releases, and the GHG fluxes in the downstream reach, minus the reservoir carbon burial. The TGR has a large water surface area of 1084 km2, and the diffusion flux at the air–water interface is the main way to emit GHGs [30]. In this study, we adopted the carbon emission factor and OC burial factor approaches [31] to calculate the carbon emissions and OC burial, respectively. The related computation steps are described below.
  • Identify the carbon emission and OC burial factors of the reservoir, including the emission factors of CO2, CH4, and N2O in the reservoir water surface area and reservoir drawdown area [32,33,34,35], as well as the OC burial factors in the two areas [36,37];
  • Calculate the reservoir water surface area and drawdown area by using the relationship curve between the water surface area and reservoir water level based on the results of the reservoir impoundment operation module;
  • Compute the carbon fluxes of reservoir impoundment operation by utilizing the C emission and OC burial factors, in which the global warming potential (GWP) coefficients [38] of GHGs are adopted to calculate the reservoir GHG fluxes.
    • Carbon fluxes: Reservoir carbon fluxes are defined as carbon emissions minus OC burials of the reservoir [29]. Among the three main GHGs emitted from the reservoir, since CO2 and CH4 contain carbon elements, the carbon fluxes are calculated by considering the mass of carbon element contained in CO2 and CH4. The calculation equation is described as follows.
      C f = 1 n i = 1 m j = 1 n C flux ( i , j ) C flux ( i , j ) = C emi ( i , j ) C bur ( i , j )
      where C f is the annual average carbon flux of the reservoir. C flux ( i , j ) is the reservoir carbon flux on the jth day of the ith year. C emi ( i , j ) and C bur ( i , j ) are reservoir carbon emission and OC burial on the jth day of the ith year, respectively. m and n are the number of days and the number of years, respectively. In addition, the calculation equations of water surface area and drawdown area are described below.
      A draw ( i , j ) = A max A surf ( i , j ) A surf ( i , j ) = f w - s ( W i , j )
      where A max is the maximum reservoir water surface area corresponding to the reservoir normal water level. A surf ( i , j ) and A draw ( i , j ) are the reservoir water surface area and the reservoir drawdown area on the jth day of the ith year, respectively. W i , j is the reservoir water level on the jth day of the ith year. f w - s ( ) is the relationship curve between reservoir water level and water surface area.
      C emi ( i , j ) = C CO 2 ( i , j ) + C CH 4 ( i , j ) C CO 2 ( i , j ) = A surf ( i , j ) r sCO 2 + A draw ( i , j ) r dCO 2 C CH 4 ( i , j ) = A surf ( i , j ) r sCH 4
      C bur ( i , j ) = A surf ( i , j ) r sbur + A draw ( i , j ) r dbur
      where C CO 2 ( i , j ) is the mass of carbon element from CO2 emissions on the jth day of the ith year in the reservoir, which is composed of water surface emissions and drawdown area emissions. C CH 4 ( i , j ) is the mass of carbon element from CH4 emissions on the jth day of the ith year in the reservoir. Since CH4 requires methanogenic bacteria to generate in an anaerobic environment, only CH4 emission below the water body is considered, which is equal to the surface area of the water body multiplied by the carbon emission factor of CH4. r sCO 2 and r dCO 2 are the carbon emission factors of CO2 from reservoir water surface and drawdown area [32,33], respectively. r sCH 4 is the carbon emission factor of CH4 from the reservoir water surface [34]. r sbur and r dbur are the OC burial factors of reservoir water surface and drawdown area [36,37], respectively.
    • GHG fluxes: In addition to CO2 and CH4 emissions, N2O emissions should also be considered when calculating the reservoir GHG fluxes. The fluxes of carbon and nitrogen elements are converted into the GHG fluxes, and then the GWP coefficients are used to calculate the GHG fluxes. The computation equation of GHG flux is described as follows.
      G H G sf = 1 n i = 1 m j = 1 n C O 2 eq - flux ( i , j ) C O 2 eq - flux ( i , j ) = M CO 2 ( i , j ) + λ M M CH 4 ( i , j ) + λ N M N 2 O ( i , j ) M burCO 2 ( i , j )
      M CO 2 ( i , j ) = C CO 2 ( i , j ) / m C m CO 2 M CH 4 ( i , j ) = C CH 4 ( i , j ) / m C m CH 4 M N 2 O ( i , j ) = N N 2 O ( i , j ) / m N m N 2 O M burCO 2 ( i , j ) = C bur ( i , j ) / m C m CO 2
      N N 2 O ( i , j ) = A max r N 2 O ( i , j )
      where G H G sf is the reservoir GHG flux. C O 2 eq - flux ( i , j ) is the reservoir GHG flux on the jth day of the ith year. M CO 2 ( i , j ) , M CH 4 ( i , j ) , and M N 2 O ( i , j ) are the mass of reservoir CO2, CH4, and N2O on the jth day of the ith year, respectively. M burCO 2 ( i , j ) is the CO2 equivalent of reservoir OC burial on the jth day of the ith year. λ M and λ N are the GWP coefficients of CH4 and N2O on the 100-year scale [38], respectively. N N 2 O ( i , j ) is the nitrogen content of N2O from the reservoir on the jth day of the ith year. r N 2 O ( i , j ) is the reservoir N2O emission factor of the jth day of the ith year [35]. m C and m N are the atomic masses of carbon and nitrogen, respectively. m CO 2 , m CH 4 , and m N 2 O are the molecular weights of CO2, CH4, and N2O, respectively.

3.3. Multi-Objective Evaluation Module

Considering the independence of indicators, flood risk was selected as the evaluation indicator for flood defense. Water impoundment rate and water utilization efficiency were selected for the water utilization benefits. GHG flux was selected as the indicator for CO2 emission reduction. Carbon density is closely related to hydropower output and carbon fluxes, and this indicator was utilized to evaluate carbon fluxes in different projects and electric sources [39]. The carbon budget was obtained by dividing carbon emissions by OC burial, which can effectively evaluate the carbon budget relationship in the reservoir [10]. The calculation formulas are described as follows.
  • Flood risk
    R f = i = 1 n n i , r n × 100 %
    n i , r = 1 , if ( W i , max W safety ) 0 , if ( W i , max < W safety )
    where R f is the flood risk. n r is the number of years in which the unexpected event occurs. W i , max and W safety are the maximum flood water level in the ith year and the reservoir safety water level, respectively.
  • Flood loss
    R i , s = V i , max V safety V flood V safety × 100 % , if ( W i , max W safety ) 0 ,                                 if ( W i , max < W safety )
    where R i , s is the flood loss in the ith year. V i , max and V safety are the reservoir storage capacity of the maximum flood water level in the ith year and the reservoir storage capacity of the reservoir safety water level. V flood is the reservoir storage capacity of the reservoir flood water level.
  • Water impoundment rate
    W I R = i = 1 n n i , w n × 100 %
    n i , w = 1 , if ( W i , end = W normal ) 0 , if ( W i , end < W normal )
    where W I R is the water impoundment rate. W i , end is the reservoir water level at the end of the impoundment operation period in the ith year. W normal is the reservoir normal water level.
  • Water utilization efficiency
    W U E = 1 n i = 1 n j = 1 m R i , j R s ( i , j ) Δ t j = 1 m R i , j Δ t × 100 %
    where W U E is the water utilization efficiency and represents the average annual value of the water volume used to generate hydropower during the operation period. R s ( i , j ) is the reservoir spilled water on the jth day of the ith year.
  • GHG fluxes. As shown in Equation (5), G H G sf is the average annual CO2 equivalent of the GHGs of the reservoir.
  • Carbon density
    C D = C f H O
    where C D is carbon density and represents the carbon emissions per unit of hydropower output. H O is the hydropower output.
  • Carbon budget
    C B = 1 n i = 1 m j = 1 n C emi ( i , j ) 1 n i = 1 m j = 1 n C bur ( i , j )
    where C B is the carbon budget and represents the ratio of carbon emissions to OC burial in the reservoir.
The technique for order preference by similarity to ideal solution (TOPSIS) is commonly utilized for multi-objective evaluation of reservoir operation schemes [40]. This study used the entropy weight method to calculate the weight, and the TOPSIS method was used to score each impoundment scheme to identify the best scheme. The computation steps of the entropy weight-based TOPSIS method are described as follows.
  • Calculate the weight with the entropy weight method.
    • Construct the indicator evaluation matrix.
      M = ( v k , l ) m × n
      where M is the indicator evaluation matrix, v k , l is the l th indicator value of k th scheme.
    • Normalize the indicator evaluation matrix.
      v n ( k , l ) = v k , l v l min v l max v l min ,   Positive   indicator   , v l max v k , l v l max v l min ,   Negative   indicator   .
      where v n ( k , l ) is the l th indicator value in the k th scheme after normalization; v l max and v l min are the maximum and minimum values of the l th indicator of each scheme, respectively.
    • Calculate the information entropy value of the evaluation indicators.
      e l = 1 ln m k = 1 m f k , l ln ( f k , l )
      f k , l = v n ( k , l ) k = 1 m v n ( k , l )
      where e l is the information entropy of the l th indicator.
    • Calculate the weight of each indicator with the information entropy.
      W l = 1 e l k = 1 n ( 1 e l )
      where W l is the entropy weight of the l th indicator.
  • Score each scheme with the TOPSIS.
    • Standardize indicator evaluation matrix.
      v s ( k , l ) = v k , l k = 1 m ( v k , l ) 2
      where v s ( k , l ) is the l th indicator value in the k th scheme that has been standardized.
    • Weight each evaluation indicator and calculate the weighted distance between each indicator and the maximum (minimum) indicators.
      D k + = l = 1 m W l ( v l + v k , l ) 2
      D k = l = 1 m W l ( v l v k , l ) 2
    • Calculate the score of each scheme.
      C k = D k D k + + D k
      where C k is the degree of closeness between the k th scheme and the optimal scheme. The larger the value of D k is, the farther the scheme is from the worst solution, so the operation scheme is better.

4. Results and Discussion

4.1. Flood Risk Analysis of Reservoir Impoundment Operation

4.1.1. Reservoir Safety Water Levels

The reservoir safety water levels were estimated by flood regulation calculation in the reservoir impoundment operation module based on the seasonal design floods in a representative year (1952). Table 2 summarizes reservoir safety water levels corresponding to seasonal design floods of 0.1%, 0.2%, 1%, and 2% design frequencies. The results show that the horizontal ladder lines constitute the reservoir safety water levels based on seasonal flood-limited water levels of 151.3 m (20th–24th August), 154.7 m (25th–31st August), 166.6 m (1st–4th September), 168.1 m (5th–9th September), 170.1 m (10th–14th September), and 172.2 m (15th–30th September). From 15th September to 30th September, the highest safety water level in front of the dam is a constant horizontal line. This is because the seasonal design floods between 15th–30th September are nearly unchanged. We also found that the reservoir safety water levels will decrease with advancing initial timings of reservoir impoundment operation.

4.1.2. Flood Risk and Loss

Flood risk and loss of 15 impoundment operation schemes were also estimated by flood regulation calculation in the reservoir impoundment operation module considering reservoir safety water levels. Table 3 presents flood risk and flood loss of impoundment operation schemes with respect to three initial impoundment timings.
It can be seen that the impoundment schemes starting from 1st September and later will not increase flood risk and loss compared to the SOP. The impoundment schemes starting from 25th August and earlier have flood risk and loss. Taking the 1000 year (0.1%) seasonal design flood as an example, flood risks (flood losses) corresponding to the schemes of 820162, 825162, 825165, and 825167 are 3.55% (36.85%), while flood risks of the schemes of 820165 and 820167 will both reach 4.26%. Therefore, it is suggested that the initial timing of the TGR impoundment operation should not be earlier than 1st September without considering the complementary operation of upstream reservoirs.

4.2. Water Utilization Benefits and Carbon Emission Reduction of Reservoir Impoundment Operation

To comprehensively assess water utilization benefits and carbon emission reduction of reservoir impoundment schemes, the impoundment operation process is divided into two parts: firstly, from 20th August to 30th September, the reservoir impoundment operation is mimicked by utilizing the impoundment schemes proposed in this study; secondly, from 1st October to 31st December, the operation schemes are aimed to enhance water impoundment rates as far as possible under the premise of satisfying reservoir safety water levels and other physical constraints. The operation schemes with initial timings no earlier than 1st September were employed to simulate reservoir impoundment operation for evaluating water utilization benefits and carbon fluxes (Table 4).
In terms of water utilization benefits, all impoundment schemes can raise the hydropower output of the TGR and reduce the amount of spilled water, as well as increase the water impoundment rate, compared with the SOP. From the perspective of carbon emission reduction, the schemes of shifting to earlier impoundment timings and lifting reservoir water levels can significantly reduce carbon fluxes and GHG fluxes of the TGR in comparison to the SOP. That is to say, the advanced impoundment operation schemes can not only largely improve water utilization benefits but can also efficiently boost carbon emission reduction. This is because the strategies proposed in this study reduce the exposure area and time of the reservoir drawdown zone by shifting to earlier impoundment timings and lifting reservoir water levels, thereby significantly reducing the CO2 emissions from the drawdown area. Taking the scheme of 901165 as an example, the carbon and GHG fluxes of the TGR were reduced by 6.75 GgC/yr (4.2%) and 27.22 GgCO2e/yr (4.45%), respectively, compared with those of the SOP.

4.3. Multi-Objective Evaluation of Reservoir Impoundment Operation Schemes

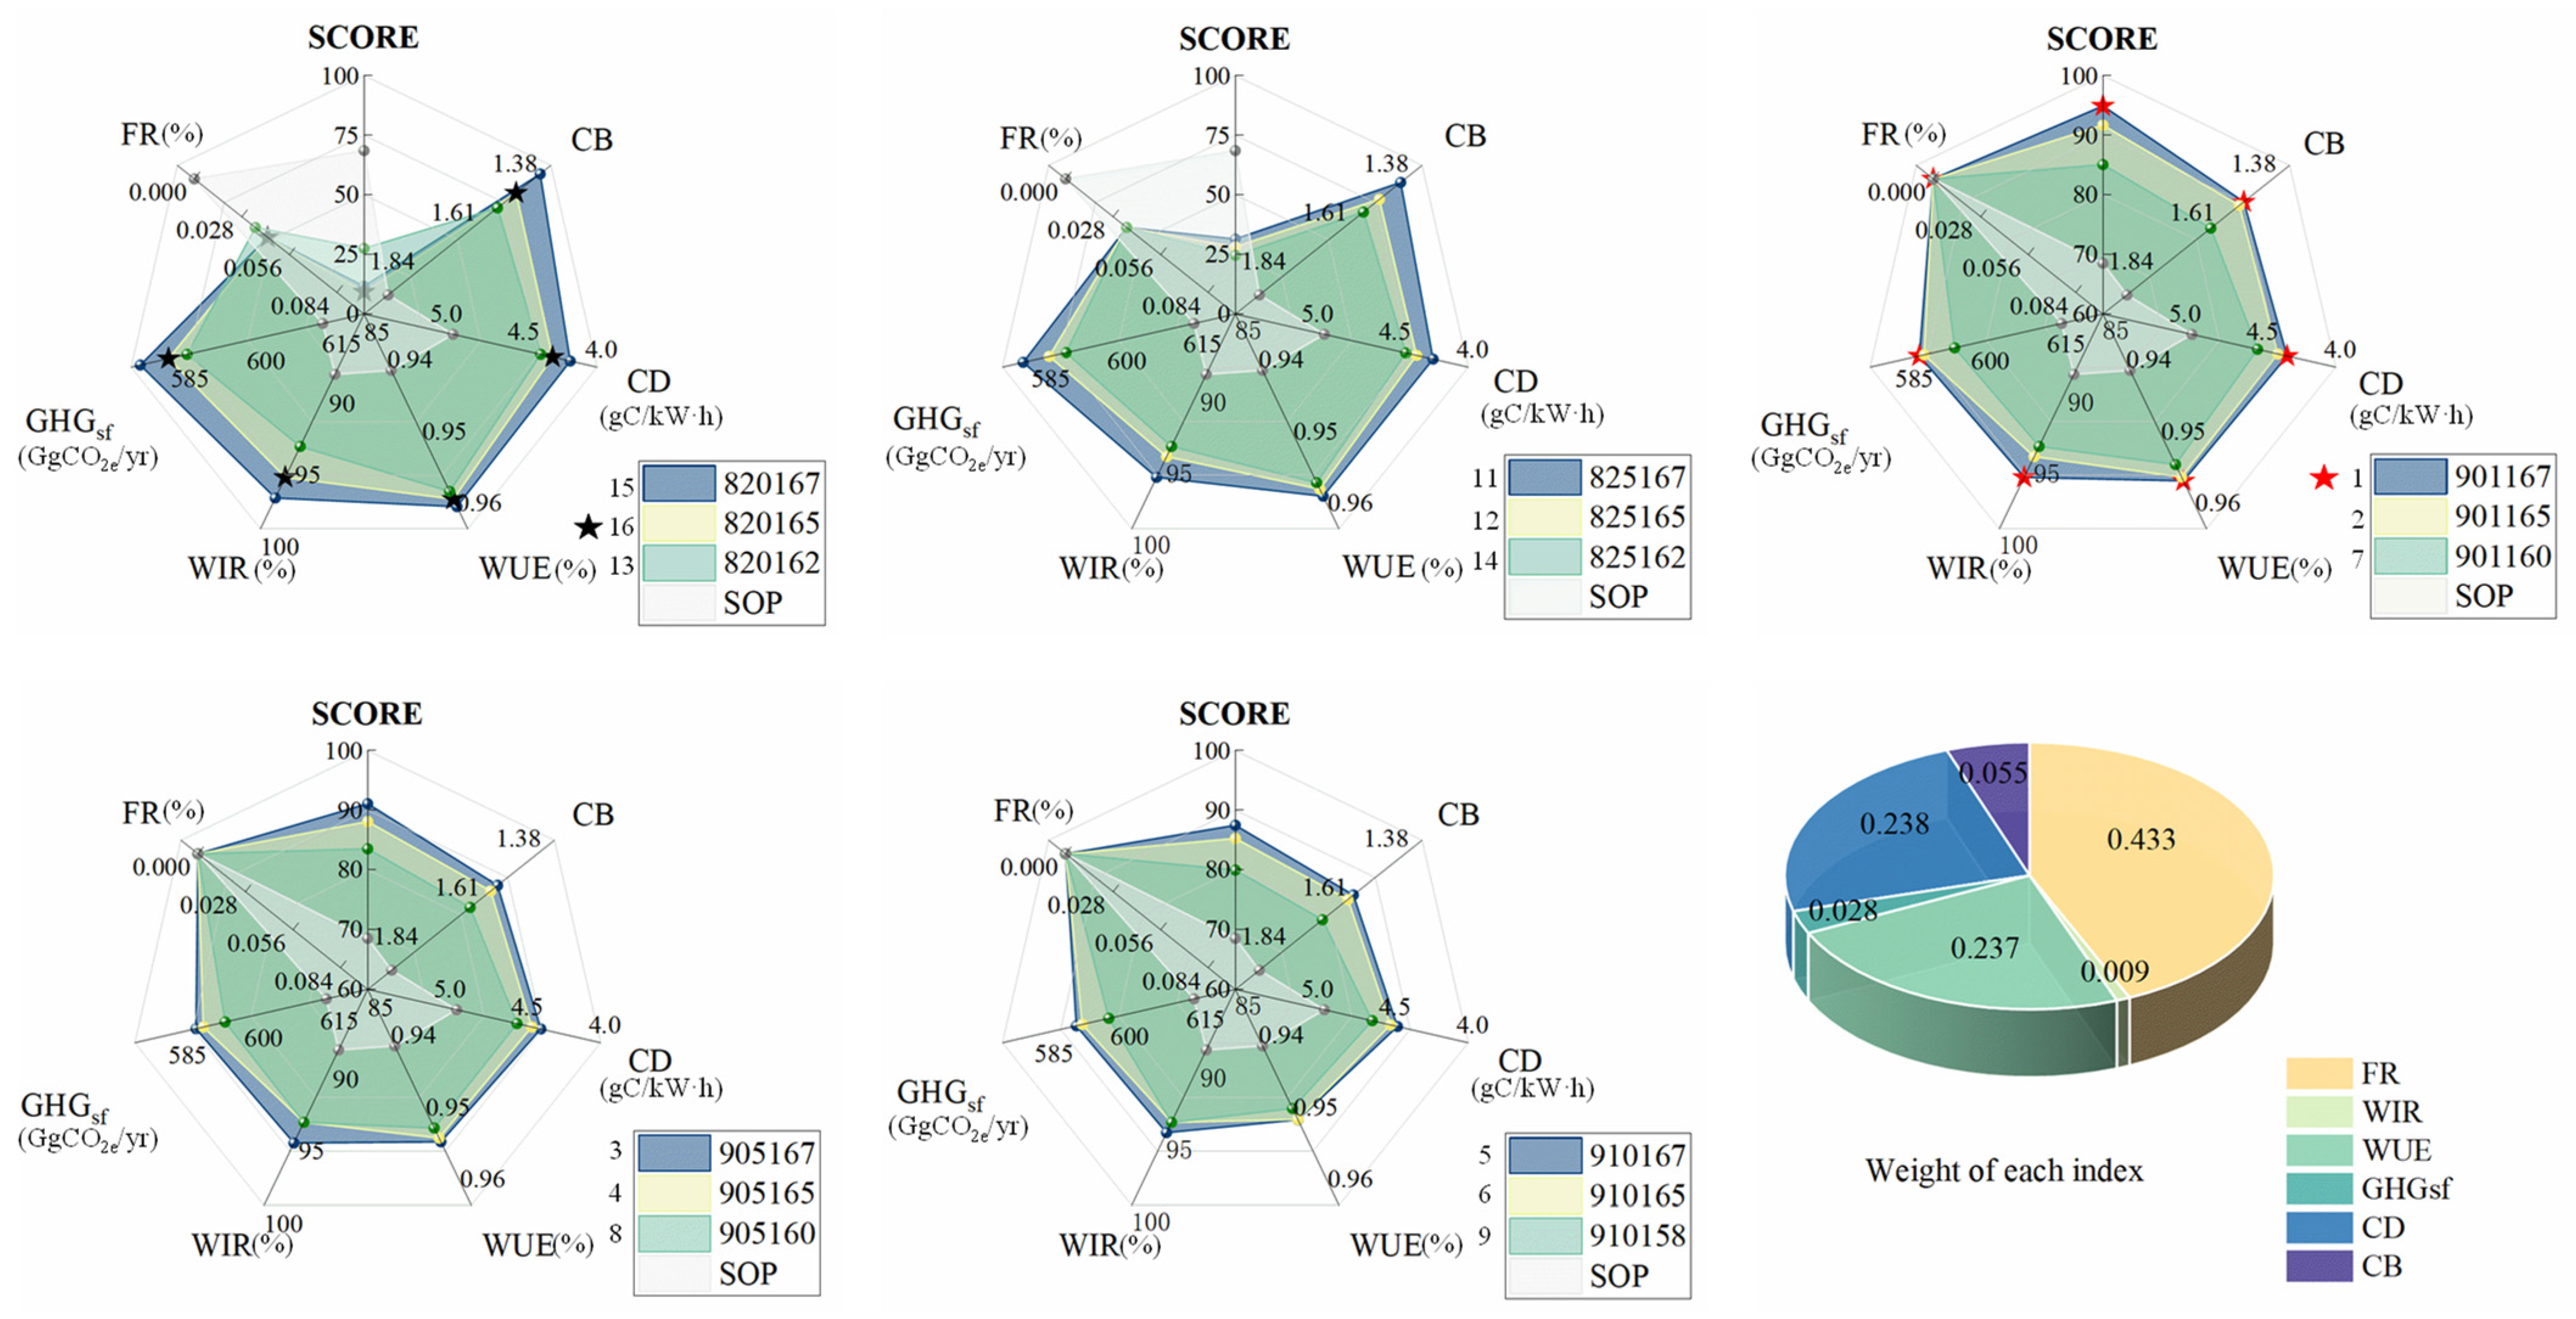
4.3.1. Multi-Objective Evaluation Based on the TOPSIS Method

According to initial impoundment timings, 15 water impoundment operation schemes were divided into five groups. In terms of the flood risk (FR), water impoundment rate (WIR), water utilization efficiency (WUE), GHG fluxes (GHGsf), carbon density (CD), and carbon budget (CB), the weight-based entropy TOPSIS method was used to evaluate the scores of all operation schemes (Figure 3). Among the indicators, the WIR and WUE are benefit indicators, while the FR, GHGsf, CD, and CB are cost indicators. The best and worst schemes are marked with red and black stars, respectively, and the rankings of schemes are marked. Figure 3 also shows the indicator weights obtained from the information entropy method. SOP is the standard operation policy.
In Figure 3, the value of the FR weight is the highest among all indicators, confirming the fact that flood prevention is the primary purpose of the TGR. The earlier the initial impoundment timings, and the higher the reservoir water levels, the reservoir impoundment operation schemes will produce better water utilization benefits and CO2 emission reduction (i.e., lower carbon and GHG fluxes). However, when the initial impoundment timings come to 25th August or earlier, the operation schemes will increase flood risks. Although the scheme of 820165 can produce the highest synergies of water utilization and carbon emission reduction, the scheme is the worst with the lowest score due to the highest flood risk. Furthermore, although the SOP can ensure flood defense safety, the score of the SOP is the lowest with the smallest synergies of floodwater utilization and carbon emission management. This suggests that the schemes of shifting to earlier impoundment timings and lifting reservoir water levels are essential to promote comprehensive benefits of reservoir operation. The scheme of 901167 has the highest score (Score = 95.18), where the initial impoundment timing is 1st September and the reservoir water level on the 30th of September is 167 m. The best scheme (901167) can bring about high synergies of water utilization efficiency (WUI = 95.9%), water impoundment rate (WIR = 95.04%), GHG flux (GHGsf = 584.04 GgCO2e/yr), carbon density (CD = 4.17 gC/kW·h), and carbon budget (CB = 1.47). The results demonstrate the best scheme identified by the TOPSIS can efficiently boost synergies of water utilization benefits and carbon emission reduction without increasing flood risk compared with the SOP.
The flood risk has the most competitive relationship with the synergies of water utilization benefits and carbon emission reduction in this study. Risk analysis results point out that all operation schemes with the initial impoundment timing later than 1st September do not increase flood risk, thus making all indicators of the scheme 901167 perform well.

4.3.2. Reservoir Impoundment Operation Processes in Three Representative Years

To intuitively analyze the effects of the proposed schemes on the operation processes of the TGR, three representative years (wet, normal, and dry years) were adopted to simulate reservoir impoundment operation processes. Based on the long-term runoff time series (1882–2022), the runoffs in 2020, 1991, and 2022 represent wet events (hydrological frequency = 10%), normal events (hydrological frequency = 50%), and dry events (hydrological frequency = 95%), respectively. Figure 4 compares the TGR operation processes of the scheme of 901167 (the best one), the scheme of 910158 (closest to the current scheme) and the SOP concerning the three representative years.
In Figure 4, the two impoundment schemes (901167 and 910158), both shifting to earlier impoundment timings and lifting reservoir water levels, would have the earlier dates of reservoir full storage. For the wet year (2020) in Figure 4a, the two impoundment schemes (901167 and 910158) not only ensure flood prevention safety but also improve the floodwater utilization, and reduce the amount of spilled water compared with the SOP. Moreover, the reservoir full storage dates would move from 21st October (SOP) to 9th October (901167) and 14th October (910158), respectively. Similar findings can be found in the operation process of the dry year (Figure 4b). However, in Figure 4c, due to the extreme drought in the dry year (2022), none of the operation schemes can achieve the water impoundment rate of 100%. The SOP only allows for lifting the reservoir water level to 163.2 m, while the best scheme (901167) can raise the reservoir water level to 172.4 m at the end of the post-flood season. This demonstrates that the best scheme (901167) largely improves the TGR water supply capacity to alleviate drought disaster of the middle- and downstream Yangtze River basin. Compared with the SOP, the best scheme can reduce the carbon flux by 6.85 GgCyr−1 on average, which strongly promotes reservoir carbon emission reduction.

4.4. Limitations

  • From the standpoint of model practicality, the sensitivity analysis of weights should be conducted to reduce the impact of weights on the multi-objective evaluation results. For instance, Table 5 shows the scores and rankings of operation schemes when the weights of each indicator are the same.
It can be seen from the scores and rankings of operation schemes shown in Table 5 that, compared with the evaluation results of the information entropy method, the optimal scheme is still scheme 901167. Meanwhile, the worst scheme has not changed, it is scheme 820165, and the ranking of the SOP scheme has changed from 10th to 15th. In addition, it can be seen that the difference in scores of the average weighting schemes is decreased. The score difference between the best scheme and the worst scheme drops from 85.6 to 37.4. That is to say, the entropy weight method can efficiently distinguish the difference between good and bad schemes. When applying the research framework, in addition to the application of the entropy weight method, expert advice can be integrated in future research to attain more practical indicator weights.
2.
Previous studies have not focused on assessing the influence of reservoir impoundment operation strategies on water–carbon benefits from the perspective of carbon emission reduction. This study not only proposes advanced impoundment operation schemes to counterbalance flood defense and hydropower production but also systematically evaluates the synergies of hydropower output, floodwater utilization, and carbon emission management from the perspectives of friendly environment and social sustainability. Several limitations of our study are summarized here.
  • Data input.
  • The study was implemented by using past daily runoff data based on simulation operation. However, the flood uncertainty is not considered in this study. Future research can combine hydrological forecast data to develop operation schemes for reducing the input uncertainty.
  • Operation model.
  • The research framework constructed in this study formulates some operation schemes by multi-objective decision making according to the existing operation rules and does not adopt optimization algorithms to optimize reservoir operation. Future research can utilize intelligent optimization algorithms to optimize the operation process.
  • Practical operation.
  • The simulation operation in this study takes into account various constraints of the TGR, such as the water balance equation, reservoir capacity, power output, water release of the reservoir, and water level variation. This study only employs the TGR to carry out flood prevention operations in consideration of one downstream flood control site. However, there are plenty of reservoirs constructed in the Yangtze River. The TGR usually needs to cooperate with the reservoirs or flood diversion and storage areas. From the perspective of water–carbon management, more reservoirs and flood diversion and storage areas can be integrated into the research framework to improve operation practicality. In this study, the carbon emission factor and OC burial factor approaches were used to evaluate the carbon emission reduction effect, but the water–carbon cycle process was not considered. Future research can combine water–carbon cycle simulation to build a more accurate assessment model to extract operational strategies and provide effective reference and support for operation decision-makers.

5. Conclusions

The strategies of carbon peak and carbon neutrality bring about big challenges for renewable energy production and carbon emission reduction in China. Optimizing reservoir operation and management would promote the development of renewable energy systems and a low-carbon economy. The advanced reservoir impoundment operation can efficiently utilize floodwater. However, flood risks faced in reservoir impoundment operation increase quickly, shifting to earlier impoundment timings and lifting reservoir water levels. This study proposed a novel reservoir impoundment operation framework driven by flood prevention, hydropower production, floodwater utilization, and carbon emission management. A case study was carried out in the Three Gorges Reservoir (TGR), and the main conclusions were drawn as follows.
(1)
In terms of flood risk, the impoundment schemes starting from August 20 and August 25 would increase the flood control risk, and the earlier the initial impoundment timing and the higher the impoundment water level rises, the greater the flood risk and the remaining schemes did not increase the probability of unexpected events, in comparison to the SOP.
(2)
In terms of water–carbon synergistic benefits, without lowering the flood prevention standard, the proposed schemes by shifting to earlier impoundment timings (1st September and later) and lifting reservoir water levels (≤167 m on 30th September) demonstrated that the hydropower outputs came up with 35.35 billion kW·h/yr–36.83 billion kW·h/yr, the reductions in spilled water reached as much as 1.47 billion m3/yr–2.6 billion m3/yr, the water impoundment rates achieved as high as 93.62–95.04%, the reductions in carbon fluxes attained 3.81 GgC/yr–7.04 GgC/yr, the reductions in GHG fluxes reached 17.01 GgCO2e/yr–28.15 GgCO2e/yr, the reductions in carbon density came up with 0.03 gC/kW·h–0.06 gC/kW·h, and the reductions in carbon budget achieved 0.24–0.44, respectively. The multi-objective evaluation analysis based on the TOPSIS method revealed that the maximal improvements of the proposed schemes could reach 2.98 billion kW·h/yr (8.8%), 2.60 billion m3/yr (27.69%), 6.39%, 7.04 GgC/yr (4.38%), 28.15 GgCO2e/yr (4.60%), 0.06 gC/kW·h (12.96%), and 0.44 (23.11%) in hydropower output, spilled water, water impoundment rate, carbon flux, GHG flux, carbon density, and carbon budget, respectively, compared to the SOP.
With the development of forecasting technology and the accurate measurement of reservoir carbon emissions and carbon burial factors, the technical framework in this study is of great practical significance and can be applied in reservoirs with relatively complete water–carbon monitoring data. Follow-up studies can consider carbon flux (emissions and burials) management from the standpoint of the optimizing reservoir impoundment operation of cascade reservoirs.

Author Contributions

Conceptualization, Z.N. and Y.Z. (Yanlai Zhou); methodology, Z.N. and Y.Z. (Yanlai Zhou); software, Z.N. and F.L.; validation, Y.Z. (Ying Zhou) and Q.L.; formal analysis, Y.Z. (Ying Zhou); investigation, Y.Z. (Ying Zhou); resources, Y.Z. (Yanlai Zhou); data curation, Q.L.; writing—original draft preparation, Z.N.; writing—review and editing, Z.N. and Y.Z. (Yanlai Zhou); visualization, Z.N.; supervision, Y.Z. (Yanlai Zhou); project administration, Y.Z. (Yanlai Zhou); funding acquisition, Y.Z. (Yanlai Zhou) All authors have read and agreed to the published version of the manuscript.

Funding

This research was funded by the National Key Research and Development Program of China (grant number 2021YFC3200303).

Institutional Review Board Statement

Not applicable.

Informed Consent Statement

Not applicable.

Data Availability Statement

The authors do not have the rights to share the data.

Acknowledgments

Thanks go to the Bureau of Hydrology in the Changjiang Water Resources Commission for compiling the data in this paper. The authors would like to thank the editors and anonymous reviewers for their valuable and constructive comments related to this manuscript.

Conflicts of Interest

The authors declare no conflict of interest.

References

  1. Intergovernmental Panel on Climate Change. Climate Change 2023: Synthesis Report. A Report of the Intergovernmental Panel on Climate Change. Contribution of Working Groups I, II, and III to the Sixth Assessment Report of the Intergovernmental Panel on Climate Change. 2023. Available online: https://www.ipcc.ch/assessment-report/ar6/ (accessed on 20 May 2023).
  2. Kumar, A.; Schei, T.; Ahenkorah, A. Hydropower. In IPCC Special Report on Renewable Energy Sources and Climate Change Mitigation, 2nd ed.; Edenhofer, O., Pichs-Madruga, R., Sokona, Y., Eds.; Cambridge University Press: Cambridge, UK; New York, NY, USA, 2011; pp. 441–491. Available online: https://www.ipcc.ch/report/renewable-energy-sources-and-climate-change-mitigation/ (accessed on 25 May 2023).
  3. St. Louis, V.L.; Kelly, C.A.; Duchemin, É.; Rudd, J.W.M.; Rosenberg, D.M. Reservoir surfaces as sources of greenhouse gases to the atmosphere: A global estimate. BioScience 2000, 50, 766–775. [Google Scholar] [CrossRef]
  4. Li, Z.; Lu, L.; Lv, P.; Zhang, Z.; Guo, J. Imbalanced stoichiometric reservoir sedimentation regulates methane accumulation in China’s Three Gorges Reservoir. Water Resour. Res. 2020, 56, e2019WR026447. [Google Scholar] [CrossRef]
  5. Eekhout, J.P.C.; Boix-Fayos, C.; Pérez-Cutillas, P.; Vente, J.D. The impact of reservoir construction and changes in land use and climate on ecosystem services in a large Mediterranean catchment. J. Hydrol. 2020, 590, 125208. [Google Scholar] [CrossRef]
  6. Chen, Z.; Arif, M.; Wang, C.; Chen, X.; Li, C. Effects of Hydrological Regime on Foliar Decomposition and Nutrient Release in the Riparian Zone of the Three Gorges Reservoir, China. Front. Plant Sci. 2021, 12, 661865. [Google Scholar] [CrossRef]
  7. Thérien, N.; Morrison, K. Production of GHG from the Decomposition of in vitro Inundated Phytomass and Soil. In Greenhouse Gas Emissions—Fluxes and Processes; Environmental Science; Tremblay, A., Varfalvy, L., Roehm, C., Garneau, M., Eds.; Springer: Berlin/Heidelberg, Germany, 2005; pp. 315–338. [Google Scholar] [CrossRef]
  8. Mendonça, R.; Müller, R.A.; Clow, D.; Verpoorter, C.; Raymond, P.; Tranvik, L.J.; Sobek, S. Organic carbon burial in global lakes and reservoirs. Nat. Commun. 2017, 8, 1694. [Google Scholar] [CrossRef]
  9. Clow, D.W.; Stackpoole, S.M.; Verdin, K.L.; Butman, D.E.; Zhu, Z.; Krabbenhoft, D.P.; Striegl, R.G. Organic Carbon Burial in Lakes and Reservoirs of the Conterminous United States. Environ. Sci. Technol. 2015, 49, 7614–7622. [Google Scholar] [CrossRef]
  10. Keller, P.S.; Marcé, R.; Obrador, B.; Koschorreck, M. The global carbon budget of reservoirs is overturned by the quantification of drawdown areas. Nat. Geosci. 2021, 14, 402–408. [Google Scholar] [CrossRef]
  11. Keller, P.S.; Catalán, N.; Schiller, D.V.; Grossart, H.-P.; Koschorreck, M.; Obrador, B.; Frassl, M.A.; Karakaya, N.; Barros, N.; Howitt, J.A.; et al. Global CO2 emissions from dry inland waters share common drivers across ecosystems. Nat. Commun. 2020, 11, 2126. [Google Scholar] [CrossRef]
  12. Almeida, R.M.; Paranaíba, J.R.; Barbosa, Í.; Sobek, S.; Kosten, S.; Linkhorst, A.; Mendonça, R.; Quadra, G.; Roland, F.; Barros, N. Carbon dioxide emission from drawdown areas of a Brazilian reservoir is linked to surrounding land cover. Aquat. Sci. 2019, 81, 68. [Google Scholar] [CrossRef]
  13. Deemer, B.R.; Harrison, J.A.; Li, S.; Beaulieu, J.J.; DelSontro, T.; Barros, N.; Bezerra-Neto, J.F.; Powers, S.M. Greenhouse Gas Emissions from Reservoir Water Surfaces: A New Global Synthesis. BioScience 2016, 66, 949–964. [Google Scholar] [CrossRef]
  14. Marcé, R.; Obrador, B.; Gómez-Gener, L.; Catalán, N.; Koschorreck, M.; Arce, M.I.; Singer, G.; Schiller, D.V. Emissions from dry inland waters are a blind spot in the global carbon cycle. Earth-Sci. Rev. 2019, 188, 240–248. [Google Scholar] [CrossRef]
  15. Mendonça, R.; Kosten, S.; Sobek, S.; Barros, N.; Cole, J.J.; Tranvik, L.; Roland, F. Hydroelectric carbon sequestration. Nat. Geosci. 2012, 5, 838–840. [Google Scholar] [CrossRef]
  16. Tu, M.-Y.; Hsu, N.-S.; Tsai, F.T.-C.; Yeh, W.W.-G. Optimization of Hedging Rules for Reservoir Operations. J. Water Res. 2008, 134, 3–13. [Google Scholar] [CrossRef]
  17. Chai, Y.; Li, Y.; Yang, Y.; Zhu, B.; Li, S.; Xu, C.; Liu, C. Influence of Climate Variability and Reservoir Operation on Streamflow in the Yangtze River. Sci. Rep. 2019, 9, 5060. [Google Scholar] [CrossRef] [PubMed]
  18. Zhou, Y.; Guo, S.; Xu, C.; Liu, P.; Qin, H. Deriving joint optimal refill rules for cascade reservoirs with multi-objective evaluation. J. Hydrol. 2015, 524, 166–181. [Google Scholar] [CrossRef]
  19. Zhou, Y.; Guo, S.; Chang, F.-J. Boosting hydropower output of mega cascade reservoirs using an evolutionary algorithm with successive approximation. Appl. Energy 2018, 228, 1726–1739. [Google Scholar] [CrossRef]
  20. Wang, C.; Wang, X.; Zhou, J.; Zhang, C. The ecological optimization dispatch of the Three Gorges reservoir considering aquatic organism protection. In Proceedings of the 2015 International Conference on Control, Automation and Robotics, Singapore, 20–22 May 2015; pp. 204–208. [Google Scholar] [CrossRef]
  21. Peng, Y.; Ji, C.; Gu, R.A. Multi-Objective Optimization Model for Coordinated Regulation of Flow and Sediment in Cascade Reservoirs. Water Resour. Manag. 2014, 28, 4019–4033. [Google Scholar] [CrossRef]
  22. Huang, J.; Li, Z. Carbon emissions affected by real-time reservoir operation: A hydrodynamic modeling approach coupled with air-water mass transfer. Water Res. 2023, 241, 0043–1354. [Google Scholar] [CrossRef]
  23. Li, X.; Yang, W.; Zhao, Z.; Wang, R.; Yin, X. Advantage of priority regulation of pumped storage for carbon-emission-oriented co-scheduling of hybrid energy system. J. Energy Storage 2023, 58, 106400. [Google Scholar] [CrossRef]
  24. Xiao, Y.; Guo, S.; Liu, P.; Yan, B.; Chen, L. Design flood hydrograph based on multicharacteristic synthesis index method. J. Hydrol. Eng. 2009, 14, 1359–1364. [Google Scholar] [CrossRef]
  25. Zhou, Y.; Guo, S.; Xu, J.; Zhao, X.; Zhai, L. Risk analysis for seasonal flood-limited water level under uncertainties. J. Hydro-Environ. Res. 2015, 9, 569–581. [Google Scholar] [CrossRef]
  26. CWRC (Changjiang Water Resources Commission). Rule of Flood Control and Experimental Refill for the Three Gorges Reservoir in 2010; CWRC: Wuhan, China, 2010. (In Chinese)
  27. CWRC (Changjiang Water Resources Commission). Joint Operation Plan of Water Projects of the Yangtze River in 2022; CWRC: Wuhan, China, 2022. (In Chinese)
  28. Li, Y.; Guo, S.; Guo, J.; Wang, Y.; Li, T.; Chen, J. Deriving the optimal refill rule for multi-purpose reservoir considering flood control risk. J. Hydro-Environ. Res. 2014, 8, 248–259. [Google Scholar] [CrossRef]
  29. Alm, J.; Nielsen, N.; Damazio, J.M. Guidelines for Quantitative Analysis of Net GHG Emissions from Reservoirs Volume 2 Modeling; IEA: Paris, France, 2015; pp. 26–39. Available online: https://www.ieahydro.org/publications/iea-hydro-reports. (accessed on 6 July 2022).
  30. Li, Z.; Sun, Z.; Chen, Y.; Li, C.; Pan, Z.; Harby, A.; Lv, P.; Chen, D.; Guo, J. The net GHG emissions of the Three Gorges Reservoir in China: II. Post-impoundment GHG inventories and full-scale synthesis. J. Clean. Prod. 2020, 277, 123961. [Google Scholar] [CrossRef]
  31. Intergovernmental Panel on Climate Change. 2019 Refinement to the 2006 IPCC Guidelines for National Greenhouse Gas Inventories; Vol 4 Chapter 7: Wetland; IPCC: Geneva, Switzerland, 2019. Available online: https://www.ipcc.ch/report/2019-refinement-to-the-2006-ipcc-guidelines-for-national-greenhouse-gas-inventories/ (accessed on 16 June 2023).
  32. Zhou, S.; He, Y.; Yuan, X.; Peng, S.; Yue, J. Greenhouse gas emissions from different land-use areas in the Littoral Zone of the Three Gorges Reservoir, China. Ecol. Eng. 2017, 100, 316–324. [Google Scholar] [CrossRef]
  33. Zhao, Y.; Wu, B.F.; Zeng, Y. Spatial and temporal patterns of greenhouse gas emissions from Three Gorges Reservoir of China. Biogeosciences 2013, 10, 1219–1230. [Google Scholar] [CrossRef]
  34. Chen, H.; Yuan, X.; Chen, Z.; Wu, Y.; Liu, X.; Zhu, D.; Wu, N.; Zhu, Q.; Peng, C.; Li, W. Methane emissions from the surface of the Three Gorges Reservoir. J. Geophys. Res. Atmos. 2011, 116, 21306. [Google Scholar] [CrossRef]
  35. Zhu, D.; Chen, H.; Yuan, X.; Wu, N.; Gao, Y.; Wu, Y.; Zhang, Y.; Peng, C.; Zhu, Q.; Yang, G.; et al. Nitrous oxide emissions from the surface of the Three Gorges Reservoir. Ecol. Eng. 2013, 60, 150–154. [Google Scholar] [CrossRef]
  36. Dong, X.; Anderson, N.J.; Yang, X.; Chen, X.; Shen, J. Carbon burial by shallow lakes on the Yangtze floodplain and its relevance to regional carbon sequestration. Glob. Chang. Biol. 2012, 18, 2205–2217. [Google Scholar] [CrossRef]
  37. Mendonça, R.; Kosten, S.; Sobek, S.; Cardoso, S.J.; Figueiredo-Barros, M.P.; Estrada, C.H.D.; Roland, F. Organic carbon burial efficiency in a subtropical hydroelectric reservoir. Biogeosciences 2016, 13, 3331–3342. [Google Scholar] [CrossRef]
  38. Forster, P.; Storelvmo, T.; Armour, K.; Collins, W.; Dufresne, J.-L.; Frame, D.; Lunt, D.J.; Mauritsen, T.; Palmer, M.D.; Watanabe, M.; et al. The Earth’s Energy Budget Climate Feedbacks, and Climate Sensitivity. In Climate Change 2021: The Physical Science Basis. Contribution of Working Group I to the Sixth Assessment Report of the Intergovernmental Panel on Climate Change, 2nd ed.; Masson-Delmotte, V., Zhai, P., Pirani, A., Eds.; Cambridge University Press: Cambridge, UK, 2021; p. 210. [Google Scholar]
  39. Almeida, R.M.; Shi, Q.; Gomes-Selman, J.M.; Wu, X.; Xue, Y.; Angarita, H.; Barros, N.; Forsberg, B.R.; García-Villacorta, R.; Hamilton, S.K.; et al. Reducing greenhouse gas emissions of Amazon hydropower with strategic dam planning. Nat. Commun. 2019, 10, 4281. [Google Scholar] [CrossRef]
  40. Afshar, A.; Mariño, M.A.; Saadatpour, M.; Afshar, A. Fuzzy TOPSIS Multi-Criteria Decision Analysis Applied to Karun Reservoirs System. Water Resour. Manag. 2011, 25, 545–563. [Google Scholar] [CrossRef]
Figure 1. Sketch of the Three Gorges Reservoir location and its fluctuant backwater area.
Sustainability 15 13400 g001
Figure 2. The reservoir impoundment operation framework. (a) Reservoir impoundment operation module; (b) Carbon flux calculation module; (c) Multi-objective evaluation module.
Sustainability 15 13400 g002
Figure 3. Scores of 15 impoundment operation schemes based on the TOPSIS method.
Sustainability 15 13400 g003
Figure 4. The operation processes of three impoundment operation schemes in the TGR corresponding to three representative years.
Sustainability 15 13400 g004
Table 1. Proposed impoundment operation schemes.
Initial Impoundment TimingSchemesImpoundment Water Level/m
20th
August
25th
August
1st
September
5th
September
10th
September
20th
September
30th
September
20th
August
820162145147150152154158162
820165145147151153155160165
820167145148151154156162167
25th
August
825162 145148150153157162
825165 145149151154159165
825167 145149152155161167
1st
September
901160 145147150155160
901165 145148151158165
901167 145149152160167
5th
September
905160 145148154160
905165 145149157165
905167 145149158167
10th
September
910158 145152158
910165 145155165
910167 145156167
Table 2. Reservoir safety water levels corresponding to seasonal design floods of four design frequencies.
Initial
Timings
Design
Frequencies
Reservoir Safety Water Levels (m)
20th
August
25th
August
1st
September
5th
September
10th
September
15th
September
20th
August
P = 0.1 % 151.3154.7166.6168.1170.1172.2
P = 0.2 % 160.8162.4168.9169.9171.6173.5
P = 1 % 169.5170.1172.9173.6174.5174.9
P = 2 % 171.9172.4174.3174.7174.9175.0
25th
August
P = 0.1 % 154.7166.6168.1170.1172.2
P = 0.2 % 162.4168.9169.9171.6173.5
P = 1 % 170.1172.9173.6174.5174.9
P = 2 % 172.4174.3174.7174.9175.0
1st
September
P = 0.1 % 166.6168.1170.1172.2
P = 0.2 % 168.9169.9171.6173.5
P = 1 % 172.9173.6174.5174.9
P = 2 % 174.3174.7174.9175.0
5th
September
P = 0.1 % 168.1170.1172.2
P = 0.2 % 169.9171.6173.5
P = 1 % 173.6174.5174.9
P = 2 % 174.7174.9175.0
10th
September
P = 0.1 % 170.1172.2
P = 0.2 % 171.6173.5
P = 1 % 174.5174.9
P = 2 % 174.9175.0
Table 3. Flood risk and flood loss of impoundment operation schemes.
Initial
Timings
SchemesFlood Risk (%)Flood Loss (%)
P   =   0.1 % P   =   0.2 % P   =   0.1 % P   =   0.2 %
20th
August
8201623.550.7136.856.96
8201654.260.7136.856.96
8201674.260.7136.856.96
25th
August
8251623.550.7136.856.96
8251653.550.7136.856.96
8251673.551.4236.856.96
1st
September
9011600000
9011650000
9011670000
Table 4. Water utilization benefits and carbon fluxes of reservoir impoundment operation schemes.
Initial
Timings
SchemesItemsHydropower Output (Billion kW·h/yr)Spilled Water (Billion m3/yr)Water Impoundment Rate (%)Carbon Flux
(GgC/yr)
GHG Flux
(GgCO2e/yr)
SOPValue33.859.3988.65160.66612.19
1st
September
901160Value35.997.1893.62155.70591.02
Difference a2.14 (6.32% b)−2.21 (−23.54%)4.97−4.96 (−3.09%)−21.17 (−3.46%)
901165Value36.706.8894.33153.91584.97
Difference2.85 (8.42%)−2.51 (−26.73%)5.68−6.75 (−4.20%)−27.22 (−4.45%)
901167Value36.836.7995.04153.62584.04
Difference2.98 (8.8%)−2.60 (−27.69%)6.39−7.04 (−4.38%)−28.15 (−4.60%)
5th
September
905160Value35.747.4793.62156.01592.12
Difference1.89 (5.58%)−1.92 (−20.45%)4.97−4.65 (−2.89%)−20.07 (−3.28%)
905165Value36.287.2393.62154.72587.81
Difference2.43 (7.18%)−2.16 (−23.00%)4.97−5.94 (−3.70%)−24.38 (−3.98%)
905167Value36.497.1994.33154.29586.35
Difference2.64 (7.80%)−2.20 (−23.43%)5.68−6.37 (−3.96%)−25.84 (−4.22%)
10th
September
910158Value35.357.9293.62156.85595.18
Difference1.50 (4.43%)−1.47 (−15.65%)4.97−3.81 (−2.37%)−17.01 (−2.78%)
910165Value35.967.6793.62155.29589.92
Difference2.11 (6.23%)−1.72 (−18.32%)4.97−5.37 (−3.34%)−22.27 (−3.64%)
910167Value36.097.6693.62154.94588.75
Difference2.24 (6.62%)−1.73 (−18.42%)4.97−5.72 (−3.56%)−23.44 (−3.83%)
a Difference = indicator{Scheme}-indicator{SOP}. b The number in the bracket represents the improvement rate.
Table 5. The scores and rankings of operation schemes when the weights of each indicator are the same.
Scheme820162820165820167825162
Score (rank)63.4 (12)47.3 (16)51.9 (14)61.7 (13)
Scheme825165825167901160901165
Score (rank)66.3 (10)71.1 (7)70.5 (8)81.6 (2)
Scheme901167905160905165905167
Score (rank)84.7 (1)68.6 (9)76.1 (4)79.9 (3)
Scheme910158910165910167SOP
Score (rank)64.4 (11)72.1 (6)74.5 (5)48.1 (15)
Disclaimer/Publisher’s Note: The statements, opinions and data contained in all publications are solely those of the individual author(s) and contributor(s) and not of MDPI and/or the editor(s). MDPI and/or the editor(s) disclaim responsibility for any injury to people or property resulting from any ideas, methods, instructions or products referred to in the content.

