Article

The Technology Acceptance on AR Memorable Tourism Experience—The Empirical Evidence from China

College of Resource Environment and Tourism, Capital Normal University, Beijing 100048, China
*
Author to whom correspondence should be addressed.
Sustainability 2023, 15(18), 13349; https://doi.org/10.3390/su151813349
Submission received: 19 July 2023 / Revised: 27 August 2023 / Accepted: 28 August 2023 / Published: 6 September 2023

Abstract

:
The application of augmented reality (AR) technology has revolutionized the memorable tourism experience (MTE) of travelers, while challenging traditional destination marketing practices. As AR technology emerges as a promising approach to enhancing tourists’ experiences in tourism destinations, it becomes increasingly crucial to delve into the specific mechanisms through which AR generates MTE. Therefore, this study integrated MTE into the various conceptual structures of the Technology Acceptance Model (TAM), aiming to explore the antecedents and consequences of MTE formation within the TAM framework. Additionally, the specific relationship between TAM and different degrees of MTE was also discussed. The results indicated that perceived usefulness (PU) and perceived ease of use (PEOU) of AR technology are antecedents for MTE formation. In the High-MTE group, both PU and PEOU had a significant effect on MTE, but in the Low-MTE group, only PEOU had a significant effect on MTE. At the same time, the attitude towards usage (ATU) and the behavioral intention (BI) of AR are two significant consequences of MTE, in which ATU also plays the role of mediator between MTE and BI. Specifically, in the high-MTE group, MTE has a significant positive effect on both the ATU and BI of AR, while the Low-MTE group influences BI only through the complete mediating effect of ATU. This study enriched the existing literature by exploring a new model of using AR to enhance MTE, providing significant implications for future tourism research and the sustainable development of tourist destinations.

1. Introduction

Augmented reality (AR) technology is a new technology that can enhance and transform the objects around the user through computers and other devices [1], and it has been widely used in many fields, such as tourism [2]. In the field of tourism practice, AR technology can eliminate barriers in time and space, providing tourists with immersive tourism experiences that can be accessed anytime and anywhere [3]. At the same time, AR technology can also play the role of a traditional tour guide to help tourists gain physical, emotional, cognitive, and social experiences related to tourist destinations [4,5]. Due to its ability to enhance the tourist experience without compromising the integrity of tourism resources, AR is often employed to enhance the sustainable development potential of tourist destinations [3]. Recently, many tourism destination managers have introduced AR technology into destination marketing, publicity, and promotion [6,7], thus revealing the economic benefits of AR technology for tourism destinations. In terms of tourism academic research, most of the relevant research works from the literature focus on user acceptance of AR [8,9] and user experience of AR [10,11].
The Technology Acceptance Model (TAM) is currently one of the most widely used models to explain tourists’ willingness to accept and use AR technology in tourist destinations [8,12]. Researchers mostly expand TAM by adding external variables to predict tourists’ acceptance of AR technology [8]. Previous research conclusions have shown that the objective attributes of AR technology (such as convenience) and tourists’ subjective perception of AR technology (such as perceived usefulness) are the most important factors for the acceptance of AR technology [9,13]. In addition, a small number of studies point out that user experience also plays an important role in the acceptance of AR technology [14]. For example, Li et al. (2022) [15] integrated TAM and General Learning Outcomes to conclude that the learning experience of lantern tourism had a positive impact on the acceptance of AR technology. These studies have certain academic value for understanding tourists’ AR acceptance, but in-depth discussions on the relationship between tourism experience and TAM are still limited.
A memorable tourism experience (MTE) is a tourism experience that is remembered and recalled by tourists [16]. Shaping tourism experiences for tourists, and how to transform these tourism experiences into unique and memorable experiences, are regarded as the key issues that destinations must tackle to achieve a competitive advantage and sustainable development [17,18]. In current AR tourism research, scholars generally accept that the use of AR technology in the destination will bring tourists a different travel experience and even produce a memorable experience [2,10,11]. Previous research studies have generally emphasized the important role of AR technology in tourist memories and tourism experience, and have discussed the benefits and value of these experiences, mediated by AR technology, for tourism and tourist destinations [3,19]. Therefore, AR serves as a technical medium to connect individuals to experiences. An individual attains benefits from the MTE generated by AR, and during this experience process, tourists’ acceptance of AR technology (such as technology maturity and the degree of humanized design) plays a critical role in affecting their perception and formation quality of an MTE [20,21]. However, how the mechanism of action of AR technology aids a destination in producing memorable experiences is still not clear and is still in the exploratory stage, and there is no specific research on the relationship between TAM and MTE. Therefore, the role of TAM in AR technology with regard to the formation of MTE is worthy of in-depth and further exploration.
Furthermore, a review of the existing studies revealed that previous research on AR tourism has predominantly focused on indoor exhibitions, museum visits, and galleries, with limited exploration of the AR experience in natural tourism contexts. The nature of the tourism experience varies significantly between indoor and outdoor environments. Specifically, indoor environments such as museums and galleries tend to be relatively stable and simple, leading to a concentrated perception of the AR technology itself [22,23,24]. Consequently, the experiences generated in such environments are relatively repeatable. Meanwhile, in the outdoor or natural environment, there are more complicated factors, which bring complexity and uncertainty to the tourism experience. In this case, compared with indoor environment, AR activities have to ensure a stable experience quality, but may also encounter more interaction and occurrences of small accidental events [25]. Therefore, more empirical research is needed that focuses on this relatively complex AR experience to understand the relationship between AR experience and technology acceptance; unfortunately, this field is yet to be fully explored [11,26].
In order to fill the above research gaps, the main purpose of this study was to explore the specific relationship between TAM and MTE in regard to AR in the context of outdoor heritage tourism, and to verify the contextual applicability of TAM in this context. Specifically, this study mainly addressed the following two questions: (1) How do the conceptual variables of TAM affect MTE? And (2) What are the differences in the specific strengths of the relationship between TAM and MTE for different groups of tourists? Therefore, this study examined two elements of TAM, namely perceived usefulness (PU) and perceived ease of use (PEOU), as antecedents to the formation of MTEs. Additionally, we explored attitude towards usage (ATU) and behavioral intention (BI) as consequences of MTE, while examining the mediating role of ATU between MTE and BI. This research paper contributes to a better understanding of the impact of AR activities on the formation of MTE through its analysis of the mechanisms of operation prior to or after MTE, and it also helps establish the relationship between specific dimensions of TAM and MTE. This study validated the situational applicability of TAM in outdoor heritage tourism with AR, thereby extending the scope of TAM’s application in research, in terms of the acceptance of emerging technologies in tourism. Additionally, this research enhances understanding of tourists’ attitudes and behaviors towards the use of AR technology in heritage sites, and further explores the diverse experiences that AR technology provides to tourists. These insights are believed to offer valuable suggestions on sustainable development in heritage tourism destinations.

2. Theoretical Background

2.1. Augmented Reality in Tourism

Augmented reality (AR) is an ingenious technology that seamlessly integrates virtual information into the real environment, enhancing the user’s sensory perception (such as vision and hearing) by superimposing digital information such as images, audio, and video [27,28]. Therefore, AR technology has a variety of aesthetic, entertainment, educational, and other diverse experiential values [19,29]. With the evolving times and technological advancements, people are changing their travel preferences, and the interaction mode facilitated by AR technology demonstrates significant potential for development [1,30]. AR technology has the capability to offer physical, emotional, and cognitive experiences related to tourist destinations [31]. The incorporation of AR technology into the tourism domain not only signifies the integration of information technology into human life and space [31,32], but also serves as a significant medium for generating distinctive human behaviors and emotional experiences [33,34], effectively fulfilling certain bodily functions, such as perception and gaze.
From the perspective of the entire spectrum of tourism stakeholders, AR is acknowledged to hold economic, experiential, social, cultural, and historical educational values in the domain of tourism applications [3]. Particularly prominent is its extensive application within heritage management and preservation endeavors [35,36]. The integration of AR technology into the domain of tourism has garnered heightened scholarly attention towards tourists’ receptiveness to AR technology, as well as the transformative experiential shifts instigated by AR [8,9,37,38]. Additionally, several studies [6,7,39] have delved into exploring the benefits AR brings to tourist destinations, including economic and social advantages. However, at its core, all these research topics are more or less connected to the travel experiences facilitated by AR technology [31,40].
The technological embodiment of AR technology in tourist attractions affects the enjoyment and enhances the experience of tourist attractions [31,41]. The environmental embedding and simulated physical control of AR create a restorative experience for tourists, while also promoting the immersive experience of tourists [37]. For example, in an art gallery setting, a wearable AR app helps visitors to understand connections between paintings, and to personalize their learning experience [22]. AR technology can even provide various sensory stimuli at different stages of tourism, thereby creating a multisensory experience for travelers [42,43]. These previous studies to some extent highlight the experiential value of AR in tourism applications, and are of great research value in explaining the acceptance of AR, as well as the destination benefits generated by AR.
However, in reality, tourism experiences generated by AR may not universally superior to those of original environment, because tourism experiences tend to be variable due to both subjective and objective factors [44,45]. One study [8] found out that respondents using innovative technology recalled less from their trip than a control group, indicating they paid more attention to the device itself rather than to their immediate experience of the environment. Another study [22] reported that use of AR may reduce interactions among customers and hence the social acceptability of AR technology. Also, the challenges identified revolved around factors such as ease-of-use, time commitment, etc. Indeed, usability (ease-of-use) emerges as a significant challenge in some researches [46], but emerges as a substantial advantage in others [47]. These inconsistent findings underline the complex relationship between AR technology and tourists’ subjective experiences, thereby revealing knowledge gaps in the mechanisms through which AR generates tourist experience.

2.2. Memorable Tourism Experience (MTE)

The concept of MTE has been well-articulated in the research fields of psychology, sociology, marketing, etc., and has been widely used in various disciplines. As the sublimation of the connotation of tourism experience, MTE is defined as “tourism experiences that are remembered and recalled after the occurrence of the event” [16], and these tourism experiences are often positive [48,49]. However, some negative travel experiences, such as negative emotions or bad situational encounters, could also form strong memories of travel [50,51]. An MTE is based on tourists’ selective construction of tourism experience, and has strong subjectivity and heterogeneity [16,52]. Providing tourists with MTE has been proven to be the key to maintain a sustainable competitiveness for tourism destinations [53,54]. Due to the characteristics and importance of MTE, translating tourism experience into MTE has become the most challenging task for tourism destinations. In academic research, scholars have produced rich elaborations and discussions on the formation dimensions of MTE, among which the seven-dimensional structure of Kim et al. (2012) [16] is the most established. Later, the antecedents and consequences of the MTE also received widespread attention. Destination attributes, social attributes, situational attributes, and tourists’ emotional psychology have been proved to have an effect on the formation of MTE [55,56,57]. At the same time, revisit intention, word-of-mouth evaluation, and satisfaction have emerged as important behavioral and psychological consequences of MTE [58,59,60].
In existing related research, scholars have explored tourists’ MTEs from different tourism situations. In early classical studies, narrative memory was the research method used to determine the specific dimensions of MTE and the behavioral outcomes of MTE formation [49,61]. However, due to the specificity of tourism situations, the conclusions of the above related research cannot be well extended to actual tourism scenarios. Therefore, studies have begun to explore the formation and outcomes of MTE in realistic tourism situations, such as gastronomic tourism experiences [57], cultural tourism experiences [62], and dark tourism experiences, etc. [63]. For example, in the study of gourmet tourism [64], scholars have pointed out that local food experiences should be included in the local cultural dimension of the MTE. In the context of sightseeing bus tours, one study [65] pointed out that the six-dimensional attributes of the destination should be included in the antecedents of MTE. These studies helped validate the cross-contextual properties of the MTE concept and its measurement, and demonstrated the necessity of studying MTE in different contexts.
Recently, there has been growing interest among scholars in exploring the antecedents and consequences of MTE within the context of new technologies. The integration of heritage culture with cutting-edge technology in an immersive context can not only preserve and manage heritage, but may also contribute to the formation of MTE [2]. Previous research has shown that the implementation of smart tourism technology in museums could generate MTE more effectively than traditional museum environments and services, which positively influences tourists’ intentions to return [66]. It has been noted that a high level of smart tourism technology infrastructure in tourist destinations can significantly impact tourists’ MTE, which improves satisfaction and destination loyalty [52,67]. Meanwhile, previous study indicated that the perceived behavioral control of mobile application quality had a positive impact on MTE by reducing mobility stress for tourists [68]. Recently, the relationship between AR technology and MTE has received great attention in the field of tourism research. It has been argued that the four experiential values of AR—education, aesthetics, escapism, and entertainment— could influence tourists’ satisfaction and memory of science festivals, as well as their intentions to participate in scientific research [20]. Furthermore, in a study on the AR technology experience of a Chinese heritage site, AR technology enhanced tourists’ knowledge exploration and novelty perception, which led to comprehensive changes in their MTE [11]. However, despite providing evidence that AR affects MTE, the specific relationship between the two has not been fully explored, and the specific mechanism through which AR forms MTE has not yet been determined.

2.3. Technology Acceptance Model (TAM) and AR tourism

The successful implementation of technology largely depends on user acceptance of the technology [69]. The TAM is currently the most widely used model for measuring users’ acceptance of technology, and has been extensively validated in various fields [70,71]. Initially used to explain the attitudes and behaviors of computer users [72], TAM has since been applied to analyze the adoption of technology in diverse contexts, such as mobile application technology [73], online service technology [74], AR technology [75], and so on. Within the TAM framework, PU, PEOU, and ATU are regarded as essential determinants of user acceptance behavior [72]. Nevertheless, numerous studies have highlighted the significant role of external variables in influencing users’ attitudes and behavioral intentions towards technology adoption [76,77]. For instance, in a study on the adoption of mobile Internet services, positive technology readiness drivers such as innovation and optimism were identified as external influencing factors shaping user usage behavior [78], and these external variables further extended the contextual applicability of TAM by elucidating various technological features.
Due to the simplicity and contextual adaptability of the TAM framework, it has been widely employed in acceptance studies of tourism technology. Model extensions, incorporating elements such as self-determination theory [79], experience structure [80,81], and perception of technological features [82], have been introduced to predict and elucidate the use of tourism technologies. Notably, AR technology, as a prominently utilized innovation within the realm of tourism applications, has captivated scholars’ attention regarding tourists’ attitudes and behaviors toward its acceptance [8]. Relevant research has expanded the external variables of AR technology acceptance, based on both tourist perceptions and technological characteristics [8,13]. For instance, Tom Dieck et al. (2018) [8] proposed that AR acceptance studies in urban heritage tourism encompass even dimensions, including information quality, system quality, and so on. These elements are seen to complement PU and PEOU in explaining AR technology acceptance [9,13]. However, Assaker (2020) [70] emphasized gender-based disparities in the impact of PU and PEOU on technological acceptance behaviors. Scholars have also argued that some inconsistencies may partly stem from variations in tourists’ usage experiences in technology [14].
In the era of experience economy, the role of user experience has gradually emerged. Nowadays, tourism experience seems to play a more important role than other perceptual factors in the formation of users’ acceptance towards new technologies [77,83]. For example, Huang et al. (2013) [84] emphasized the important role of hedonic elements in user acceptance of 3D virtual tourism, such as enjoyment, emotional participation, positive emotions and flow experience. Kim et al. (2016) [85] highlighted the role of attachment experience in older travel groups’ willingness to use mobile devices. In a study of tourists’ behavior, travel experience was regarded as an important moderator of the relationship between tourists’ purchase intention and actual purchase behavior [86]. Therefore, when studying AR acceptance in tourism, it is necessary to emphasize the role of tourism experience and explicate the specific relationship between the two.

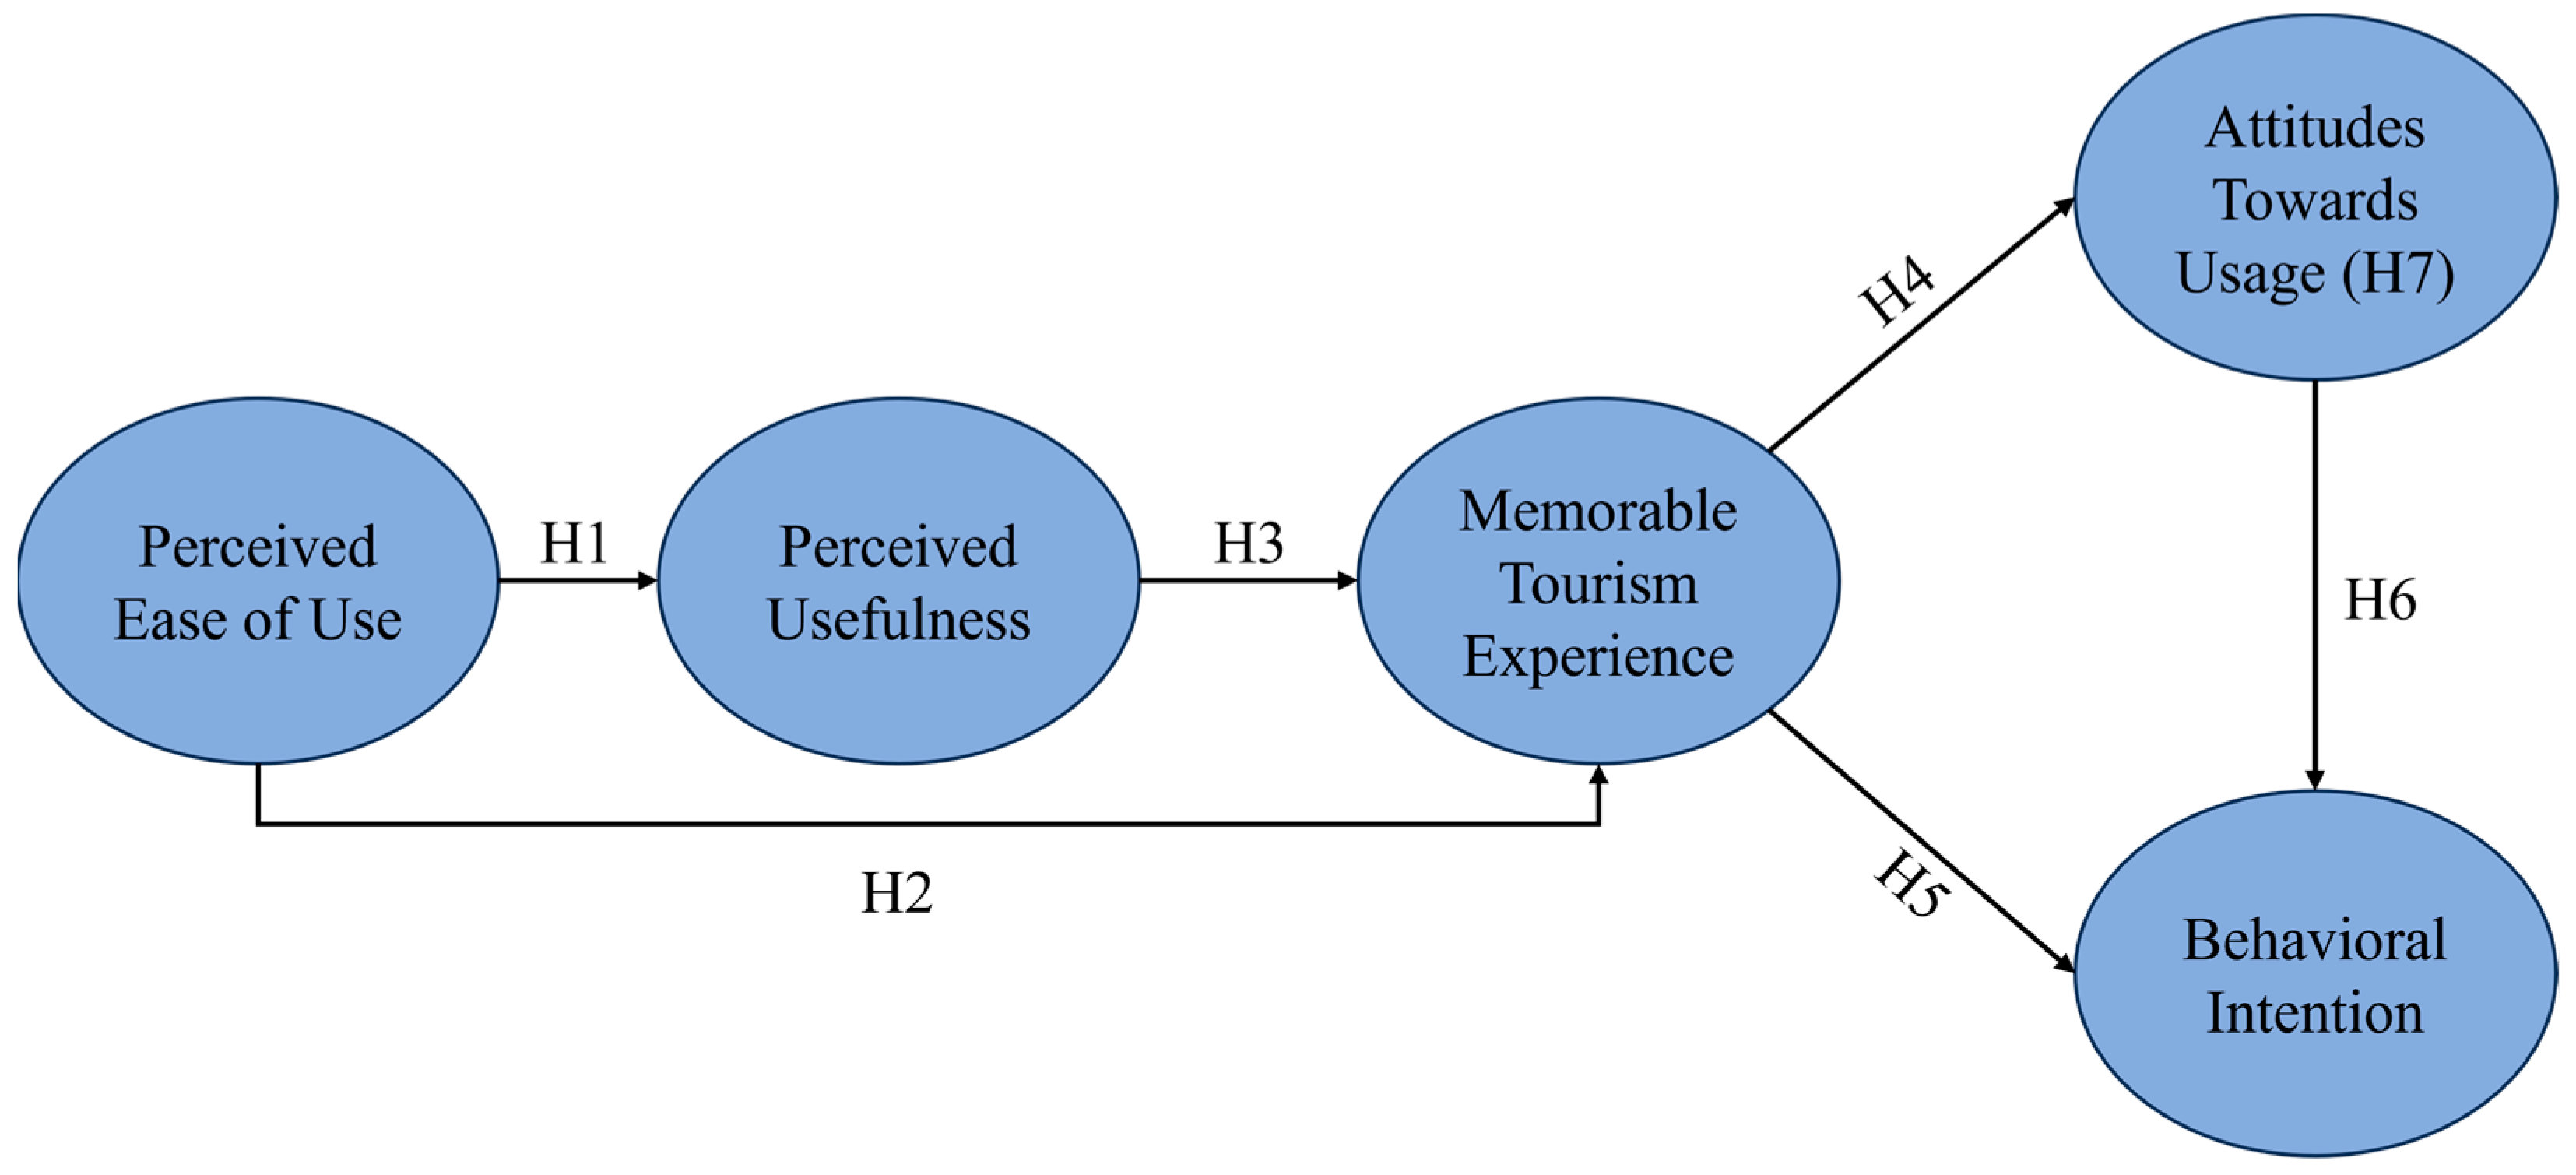
3. Model Development and Hypotheses

3.1. The Antecedents of AR Memorable Tourism Experience in TAM

In classical studies of TAM, PU refers to the subjective feeling of using a particular technology or application system to improve individual work performance in an organizational environment. PEOU is defined as the ease with which a user can use a particular technology [72]. In the TAM’s theoretical structure, PEOU was identified and theorized as a general determinant of PU [87]. For example, Venkatesh et al. (2000) [88] proposed TAM2 with four longitudinal field studies and demonstrated PEOU’s cognitive process on explaining PU. Later, Venkatesh et al. (2008) [89] extended TAM to TAM3, and further verified the positive effect of PEOU on PU. Therefore, it is proposed herein that in the context of AR tourism, the easier it is for tourists to master and use AR technology, the stronger the usefulness of AR technology that is perceived by tourists. The proposed hypothesis is as follows:
H1. 
Tourists’ PEOU of AR technology positively affects tourists’ PU of AR technology.
In tourism research, previous studies on technology acceptance have consistently demonstrated that the PU and PEOU of new technologies have a positive influence on tourists’ travel experience. For instance, Huang et al. (2013) [84] found that PU and PEOU positively affected tourists’ hedonic travel experience in technology acceptance of 3D tourism experiences. Subsequently, in their research combining TAM with experience structure, Huang et al. (2019) [80] revealed that perceived usability and PU had a positive impact on the mobile application experience of hotel consumers. Kim et al. (2021) [68] explored the relationship between mobile apps and the MTE of Korean tourists, with the results indicating that the usefulness, trust, and interactivity of mobile apps positively influenced tourists’ MTE, and that mobile application could raise reuse intentions by reducing flow stress. Similarly, in an exploration of determinants of smart tourism service experience, Li et al. (2021) [90] indicated that the perceived pleasure and PU of smart tourism had a positive impact on the evaluation of service experience. In another study, Li et al. (2022) [91] also highlighted the impact of the PU and PEOU of virtual technology on tourists’ hedonic experience during the COVID-19 pandemic. Therefore, based on these findings, we propose the following two hypotheses for this study:
H2. 
Tourists’ PEOU of AR technology has a positive impact on MTE generated by AR.
H3. 
Tourists’ PU of AR technology has a positive impact on MTE generated by AR.

3.2. The Consequences of AR Memorable Tourism Experience in TAM
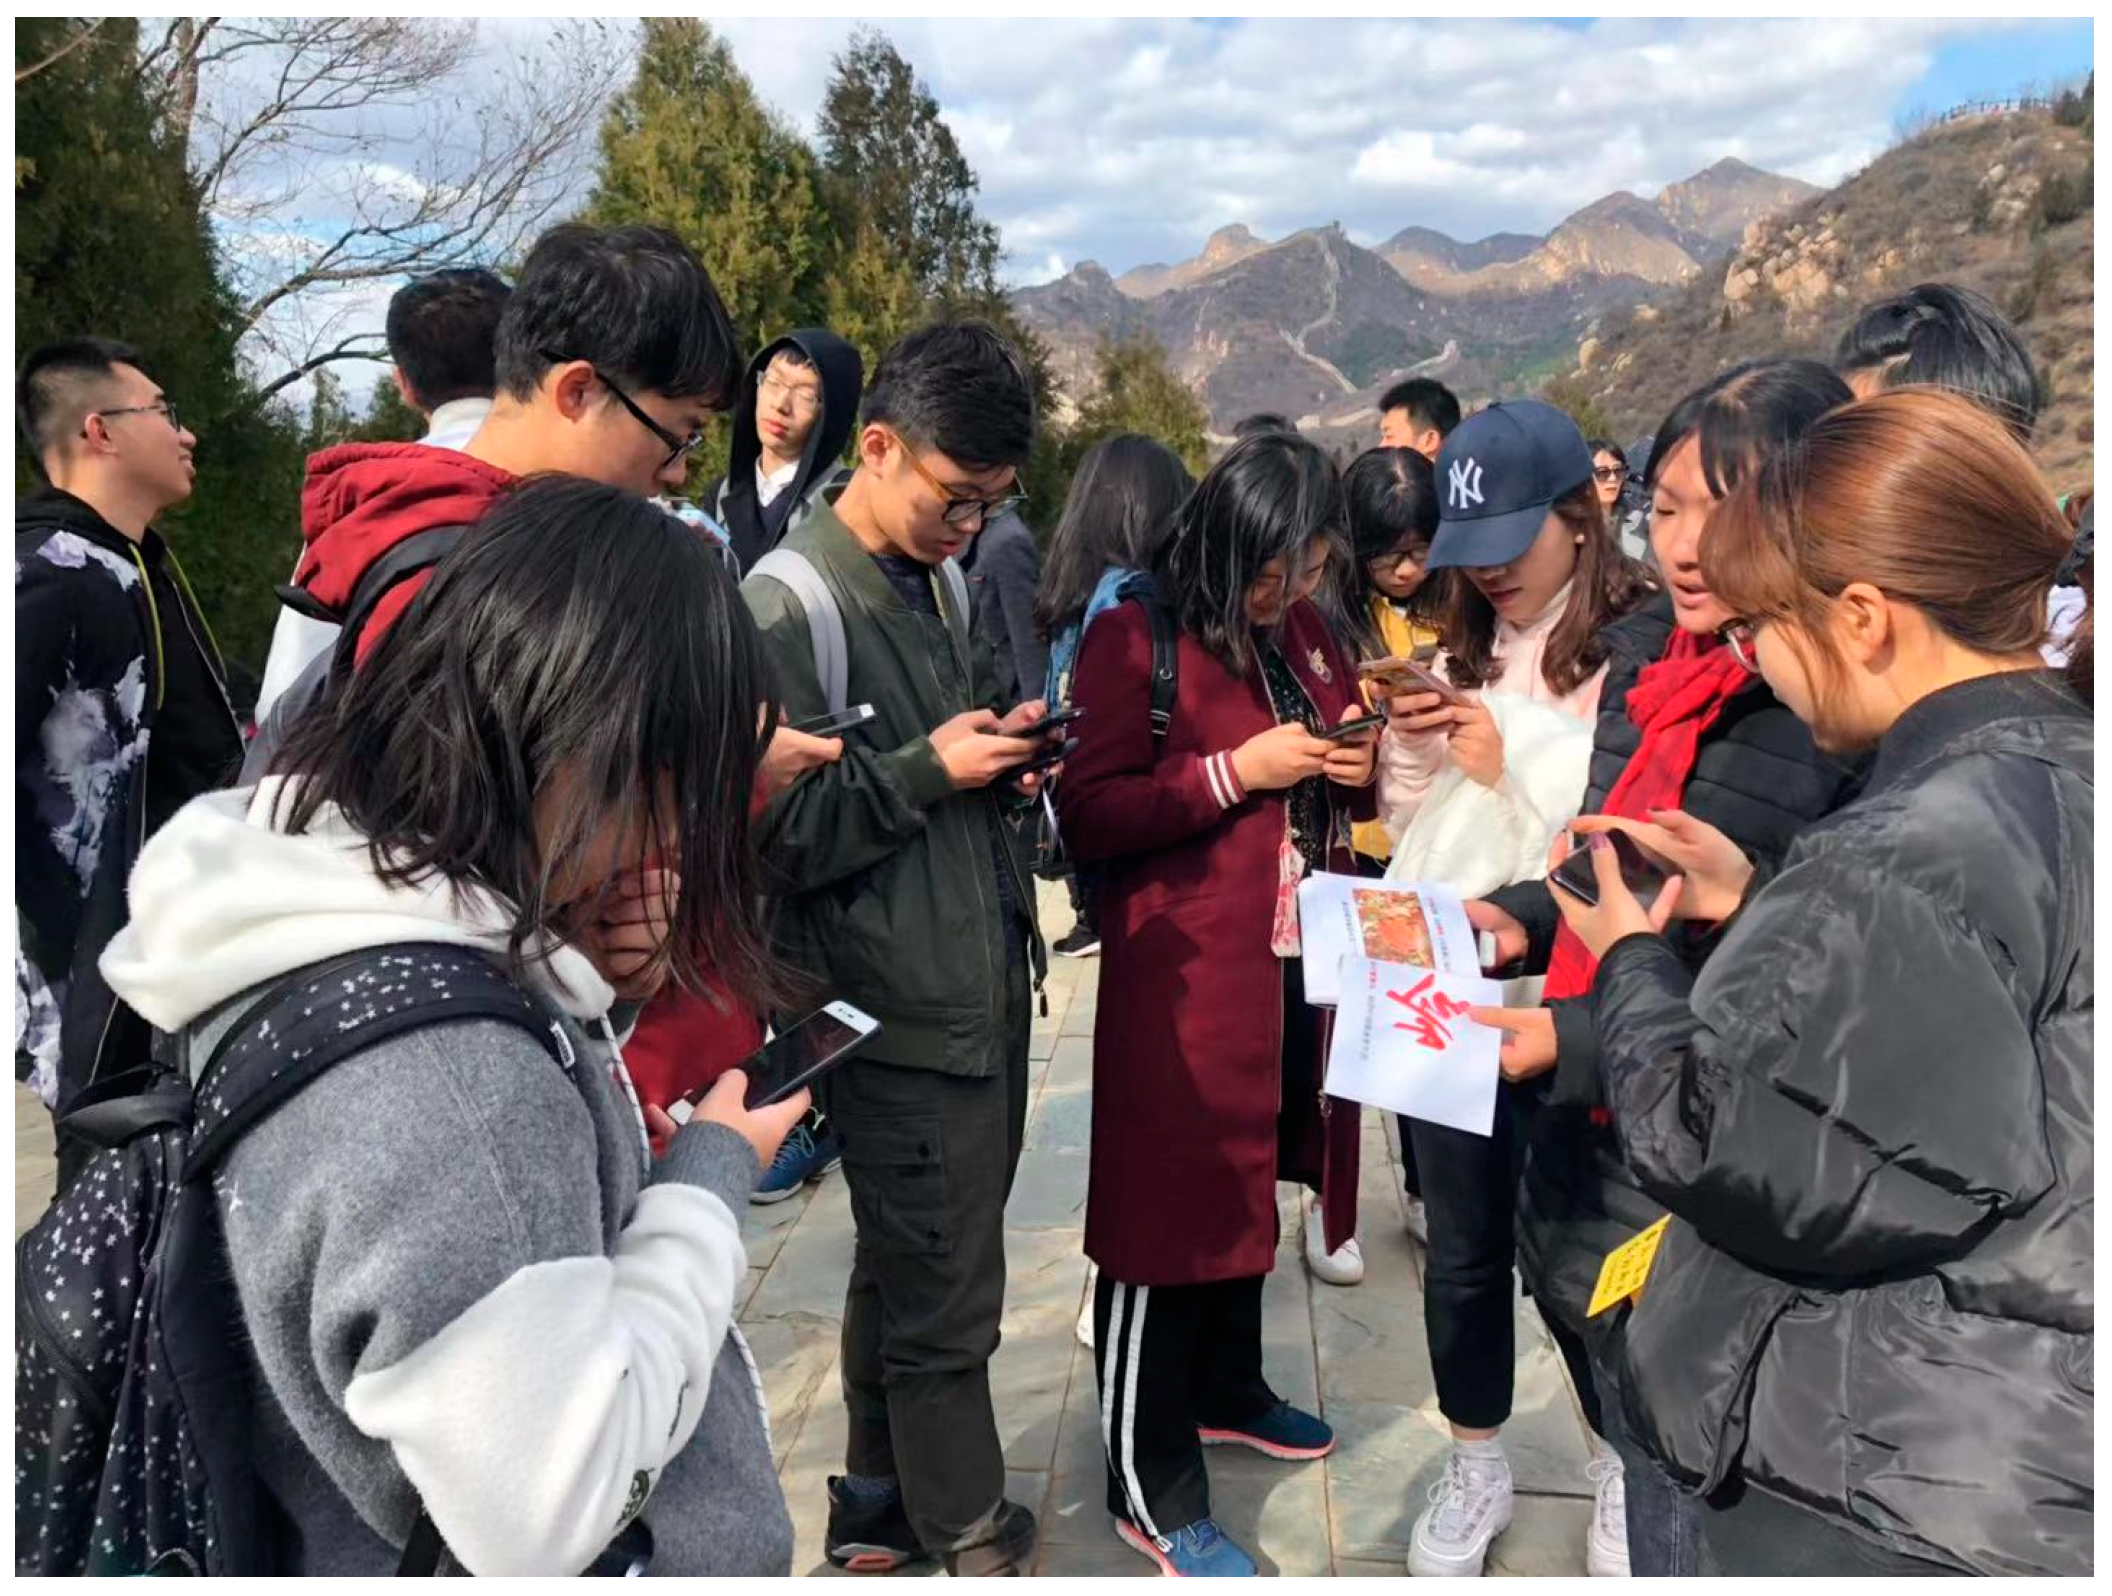
Throughout tourists’ entire travel process, the MTE significantly influences the attitude towards the tourism destination or tourism activities [92,93]. For instance, Sharma et al. (2019) [94] highlighted that the MTE generated in yoga tourism led to an attitude shift towards the destination’s image, which ultimately influenced the satisfaction evaluation. Similarly, in culinary tourism activities, memorable food experiences can shape positive attitudes not only towards the specific food encountered, but also towards the overall tourist destination [64]. Moreover, in various studies investigating attitudes towards new tourism technologies, it has been confirmed that tourists’ ATU of these technologies was also directly influenced by their overall experiences. For instance, a study exploring factors affecting the acceptance of mobile applications identified both technical experience and tourist experience as important factors impacting ATU [77]. Building on these insights, we put forth the following assumption for our research:
H4. 
Tourists’ MTE generated by AR has a positive impact on their ATU of AR.
Indeed, previous research on tourist MTE has extensively demonstrated the relationship between MTE and tourists’ BI. Numerous studies [58,95] have associated tourists’ word-of-mouth evaluation, return intention, and duration of stay at destinations with the consequences of MTE. It is noteworthy that creating unique memories and providing memorable experiences can lead to positive and repetitive tourist behaviors [58]. Similarly, this interesting finding has also been validated in studies on tourist technology acceptance [14]. For instance, in a study exploring the factors influencing tourists’ acceptance of mobile devices, researchers highlighted that technology experience, travel experience, PU, and PEOU collectively impacted tourists’ attitudes towards using mobile technology [77]. In another study on mobile application acceptance, researchers further confirmed that four types of customer experiences, entertainment, education, esthetics, and escapism, directly and positively influenced the intention to use mobile application [80]. Subsequently, Jung et al. (2020) [24] further investigated the indirect effect of four experience types on AR usage intention mediated by perceived value. By applying the stress-coping theory, Kim et al. (2021) [68] concluded that when tourists used mobile apps, they experienced less stress, thereby leading to the formation of MTE, which subsequently shaped their positive attitudes towards mobile apps and willingness to reuse them. Based on the compelling evidence from these studies, we speculate that the MTE formed through the usage of AR technology at tourism destinations will further influence tourists’ intention to use AR technology. Based on this, we propose the following hypothesis:
H5. 
Tourists’ MTE generated by AR has a positive impact on their BI to use AR technology.
In previous studies of TAM, the importance of ATU has been fully elaborated upon [72]. In classic TAM studies, researchers have pointed out that the intention to use a certain technology was determined by the user’s attitude towards using it [88]. In other words, if a person has a positive emotional attitude when using technology, this can change the individual’s behavioral intention and form her/his acceptance of the technology. This result then was further verified in subsequent research within various disciplines, such as smart tourism [40], hotel mobile application marketing [77], etc. Based on the above discussions on the influence of MTE on ATU and BI, we speculate that attitude towards using AR technology plays a mediating role in the relationship between MTE and BI. Therefore, the following hypotheses were proposed:
H6. 
Tourists’ ATU of AR has a significant positive impact on their BI to use AR technology.
H7. 
MTE generated by AR technology can indirectly affect tourists’ BI to use AR technology through their ATU of AR.
Based on the above reviews and analysis, the present study integrates the basic structure of TAM and MTE, and the proposed conceptual model and hypotheses are shown in Figure 1.

4. Methodology

4.1. Research Site and AR App Design

The research was conducted as part of the Smart Tourism Application of Augmented Reality Research Project in Badaling Forest Park, Beijing, China, which is a famous forest leisure tourism attraction in China. Badaling National Forest Park is located between Badaling and Juyong Pass on the Great Wall. The park is known for its signature activity of red leaf viewing, which attracts numerous tourists seeking leisure and sightseeing experiences.
To achieve the research objectives and address the research questions, the research team conducted interviews with twelve park tourists and two park management personnel in November 2017. Through these interviews, we identified the unique tourism resources of the park and the types of tourist experiences that could be offered. Based on this information, the team engaged a professional software company to develop an AR mobile application. The app consists of four experience programs that offer activities related to the Great Wall, red leaf landscape, four-season scenery, and forest animals. With AR Experience Project 1, tourists could have the experience of taking photos with different cartoon animals by scanning the Chinese character at the main gate: “Hongye Ling”. With AR Activity 2, tourists could choose “Cotinus” to experience the growth process of red-leaf plants by presenting the growth stages and characteristics of red-leaf plants with soft music against the background of real natural scenes. With AR Experience Project 3, tourists could “destroy” enemies by clicking on “invaders” on the Great Wall to score points and have a virtual experience of guarding the Great Wall through the game. The last experience activity uses the real scene as the background, with different background music, to appreciate the four seasons of the attraction’s characteristic flora and fauna, to help tourists further understand the attraction’s characteristic resources and ecological value.
In addition, we conducted a pre-test on 30 college students in May 2018, and the app performed well enough to be used in this study.

4.2. Measurement Scales and Questionnaire Design

All measurement items in this study were designed based on a literature review and the specific conditions of the park. Four classical measurement variables from previous TAM researches [88,96] were used after modification. Specifically, PEOU was used to estimate travelers’ perceived ease of using the AR APP. PU was used to evaluate the extent to which tourists use AR applications to improve tourism efficiency. ATU was used to assess tourists’ attitude towards AR technology after experiencing AR activities. BI was used to assess tourists’ actual acceptance of AR applications after using them. As for MTE, we applied Kim et al. (2012)’s research [16], which divided MTE into 7 dimensions and 24 items. Baes on the AR tourism context of this current study, we separated excitement from the hedonic dimension, and freedom from the refreshing dimension, thus resulting in nine dimensions. The structure of all measurement items was evaluated using a 5-point Likert scale, ranging from “1” (strongly disagree) to “5” (strongly agree).
At the end of the questionnaire, respondents’ travel behavior patterns and demographic information were collected.

4.3. Data Collection and Sample Characteristics

The survey was conducted in October 2018 and October 2019. Prior to each formal data collection, the AR application was installed on research assistants’ smart phones and was pre-tested to ensure normal functioning. In the formal data collection, we randomly selected respondents at the exit and some main rest areas of the park, and informed them of the research purpose and main process. After obtaining the consent of the respondents, a formal investigation was carried out (Figure 2). The research assistant gave a brief introduction to the mobile app and asked participants to use it independently to complete four AR experience activities.
After the AR experience, respondents were asked to complete the MTE survey questions, as well as their PEOU, PU, ATU and BI of TAM on AR experience, as well as their demographic information. In this study, a total of 303 questionnaires were collected on-site, and after eliminating 28 invalid questionnaires, 275 valid questionnaires were obtained, with an effective rate of 90.8%.
Most of the respondents were between 20 and 40 years (70%), more than half of the respondents were female (59.3%), and most were Beijing residents (90.2%). The majority of the respondents were single (42.5%), followed by married people with children (37.5%). In terms of their previous travel experiences of Badaling National Forest Park, about 81.1% of respondents had never visited this park before (Table 1).

5. Data Analysis and Results

5.1. Measurement Model Test

Before the hypothesis verification, the measurement model was examined in terms of content, discriminant, and convergent validity. Since all measurements in this study were designed based on previous studies, it could be considered that the content validity of this study was good. Discriminant validity was assessed by comparing the average variance extracted (AVE) with the correlations among constructs [97]. Table 2 and Table 3 show that the measurements in this study had good discriminative validity. As for the convergence validity, Cronbach’s α coefficient and composite reliability (CR) were evaluated [98], and the values of these measured variables were both greater than the recommended threshold of 0.7 (Table 2), thus verifying the convergence validity. Consequently, combined with discriminant validity and convergence validity, the measurement model in this study was acceptable.

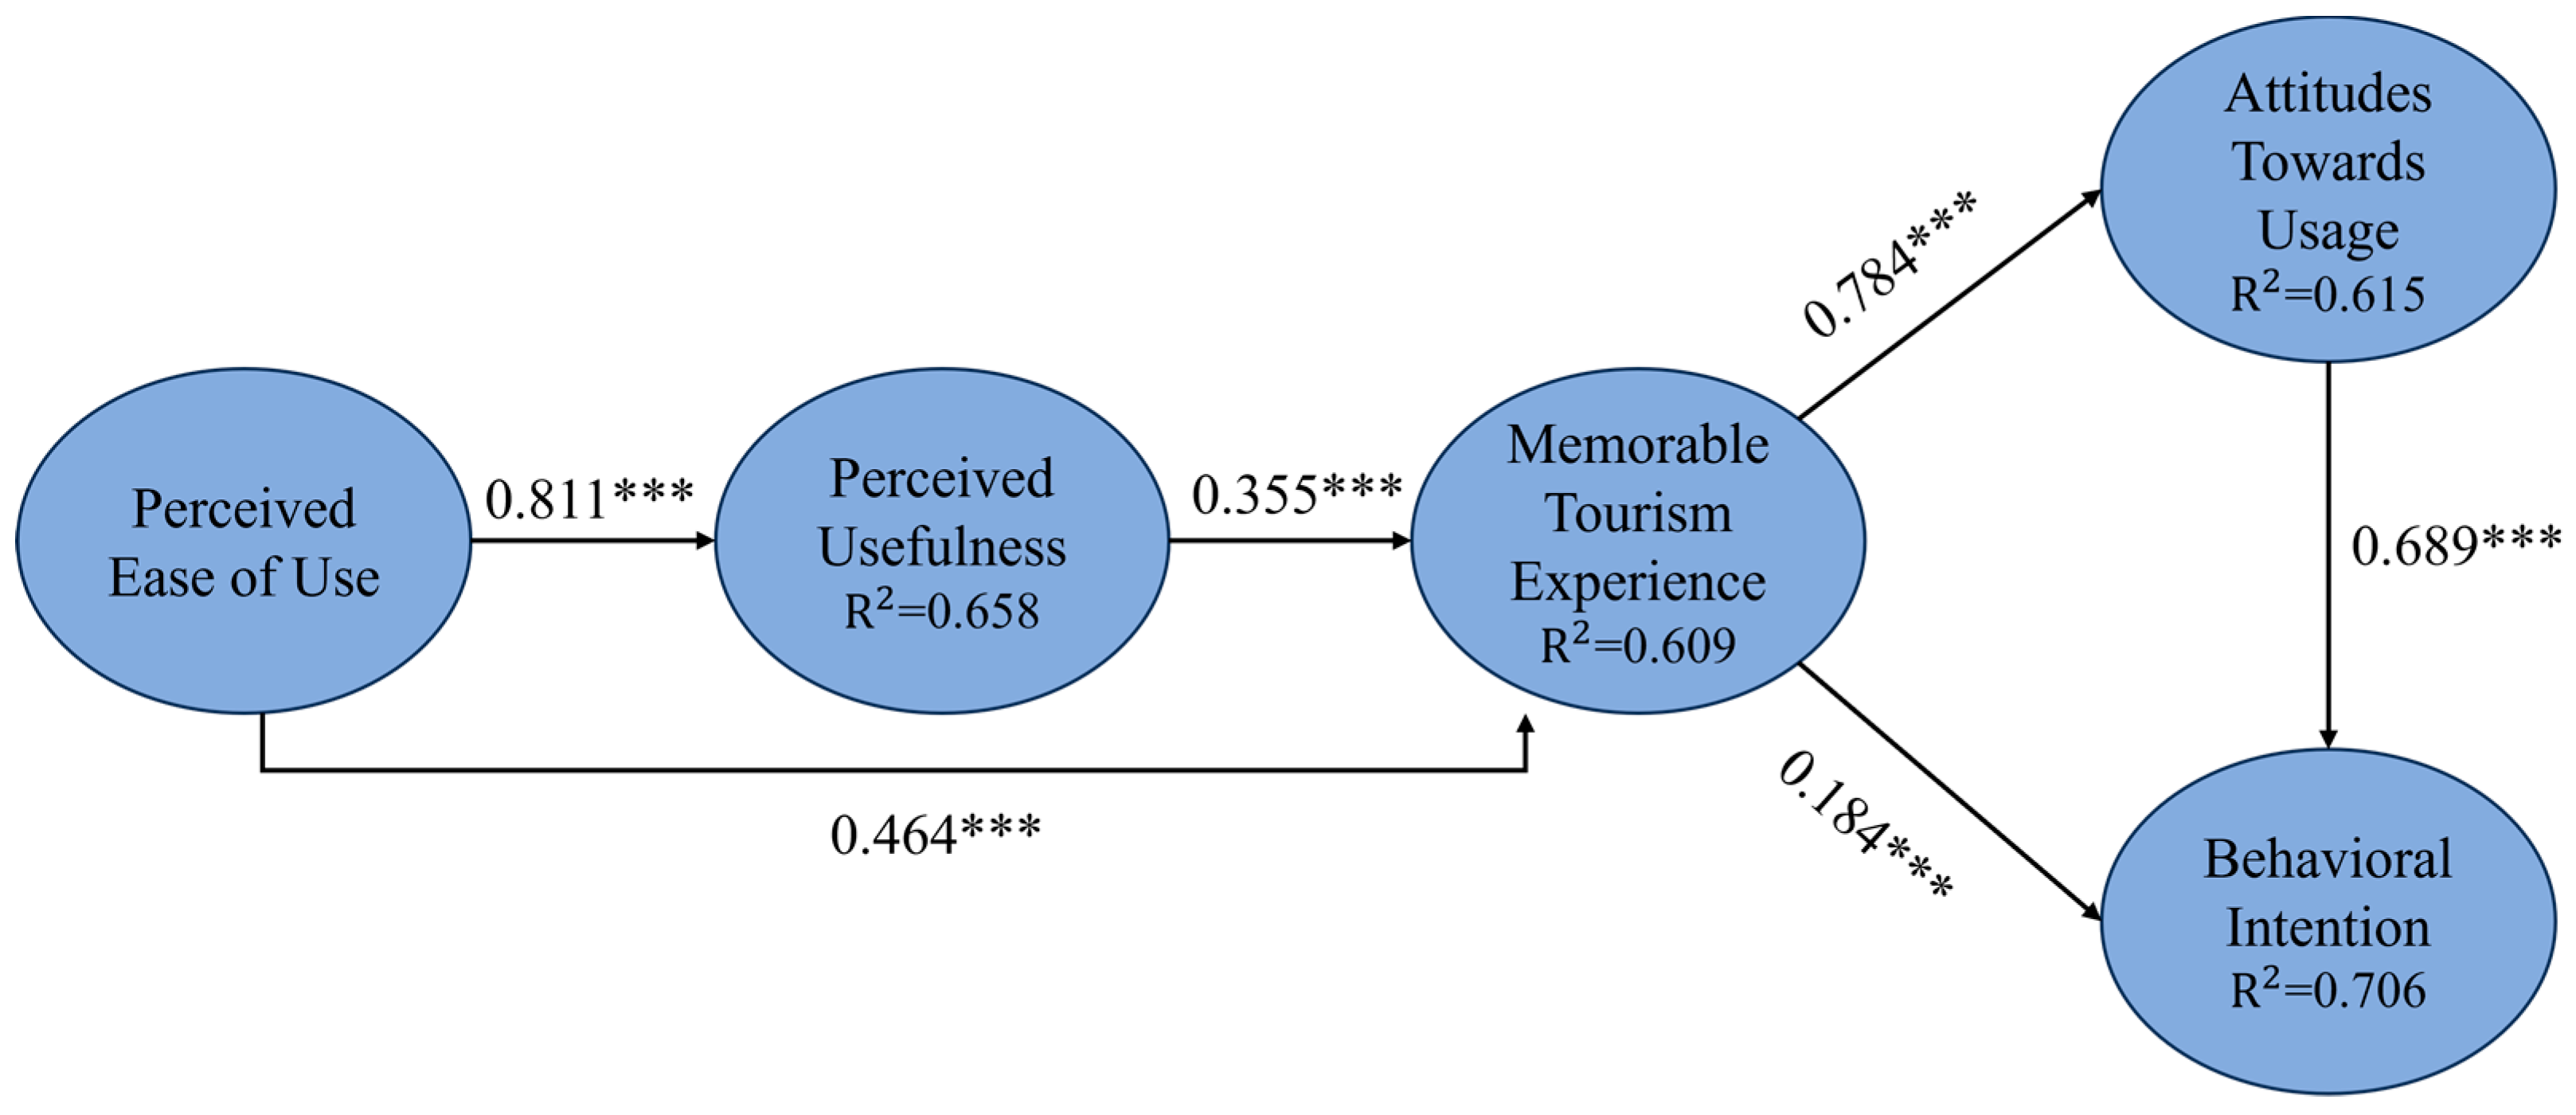
5.2. Structural Model and Hypothesis Testing

Smart-PLS 3.3.9 software was applied to structural equation modeling and empirical analysis. Specifically, we used PLS-SEM to verify the relationship between PU, PEOU, MTE, ATU, and BI. Following the latest criteria proposed by Hair et al. (2019) [99], the hypothesis relationship can be evaluated based on the path coefficient ( β ) and the explanatory variance ( R 2 ) of the dependent variable (Table 4). Just as described in previous studies, the standardized path coefficient between PEOU and PU was 0.811 (p = 0.000), and the standardized path coefficient between ATU and BI was 0.689 (p = 0.000). Hypotheses 1 and 6 were verified. In the context of AR tourism, the PEOU (β = 0.464, p = 0.000) and PU (β = 0.355, p = 0.000) of AR technology had a significant positive impact on MTE, and hypotheses 2 and 3 were valid. In turn, MTE positively affected ATU (β = 0.784, p = 0.000) and BI (β = 0.184, p = 0.004), which led to hypothesis 4 and 5 being supported by this study.
To verify the mediating effect of ATU, the Process plug-in provided by SPSS was used to examine its direct/indirect effect on the relationship between MTE and BI. According to the result, the regression model was significant ( R 2 = 0.7067 ,   p < 0.001 ). Bootstrap sampling results are shown in Table 5. The direct effect of MTE on BI was 0.219 ( p < 0.001 ), the indirect effect was 0.651 (p < 0.001 ), and the total effect of MTE on BI was as high as 0.870 (p < 0.001 ), indicating that MTE was a very important factor in explaining tourists’ intention to use AR technology. The hypothesis 7 was confirmed.
R 2 reflects the proportion of variance of the dependent variable, as explained by the predicted value (Figure 3). The R 2 value of PU was 0.658, so PEOU explained 65.8 percent of the variance of PU; the R 2 value of MTE was 0.609, indicating that the direct and indirect effects of two antecedents (PEOU and PU) fully explained 60.9% of the variance of MTE, further proving that PEOU and PU are extremely important antecedents of MTE. The R 2 value of ATU was 0.615, indicating that the direct influence of MTE fully revealed 61.5% of the variance of ATU. The R 2 value of BI was 0.706, indicating that the direct and indirect effects of MTE and ATU fully explained 70.6% of the variance of BI. This further showed that ATU and BI are important consequences of MTE.

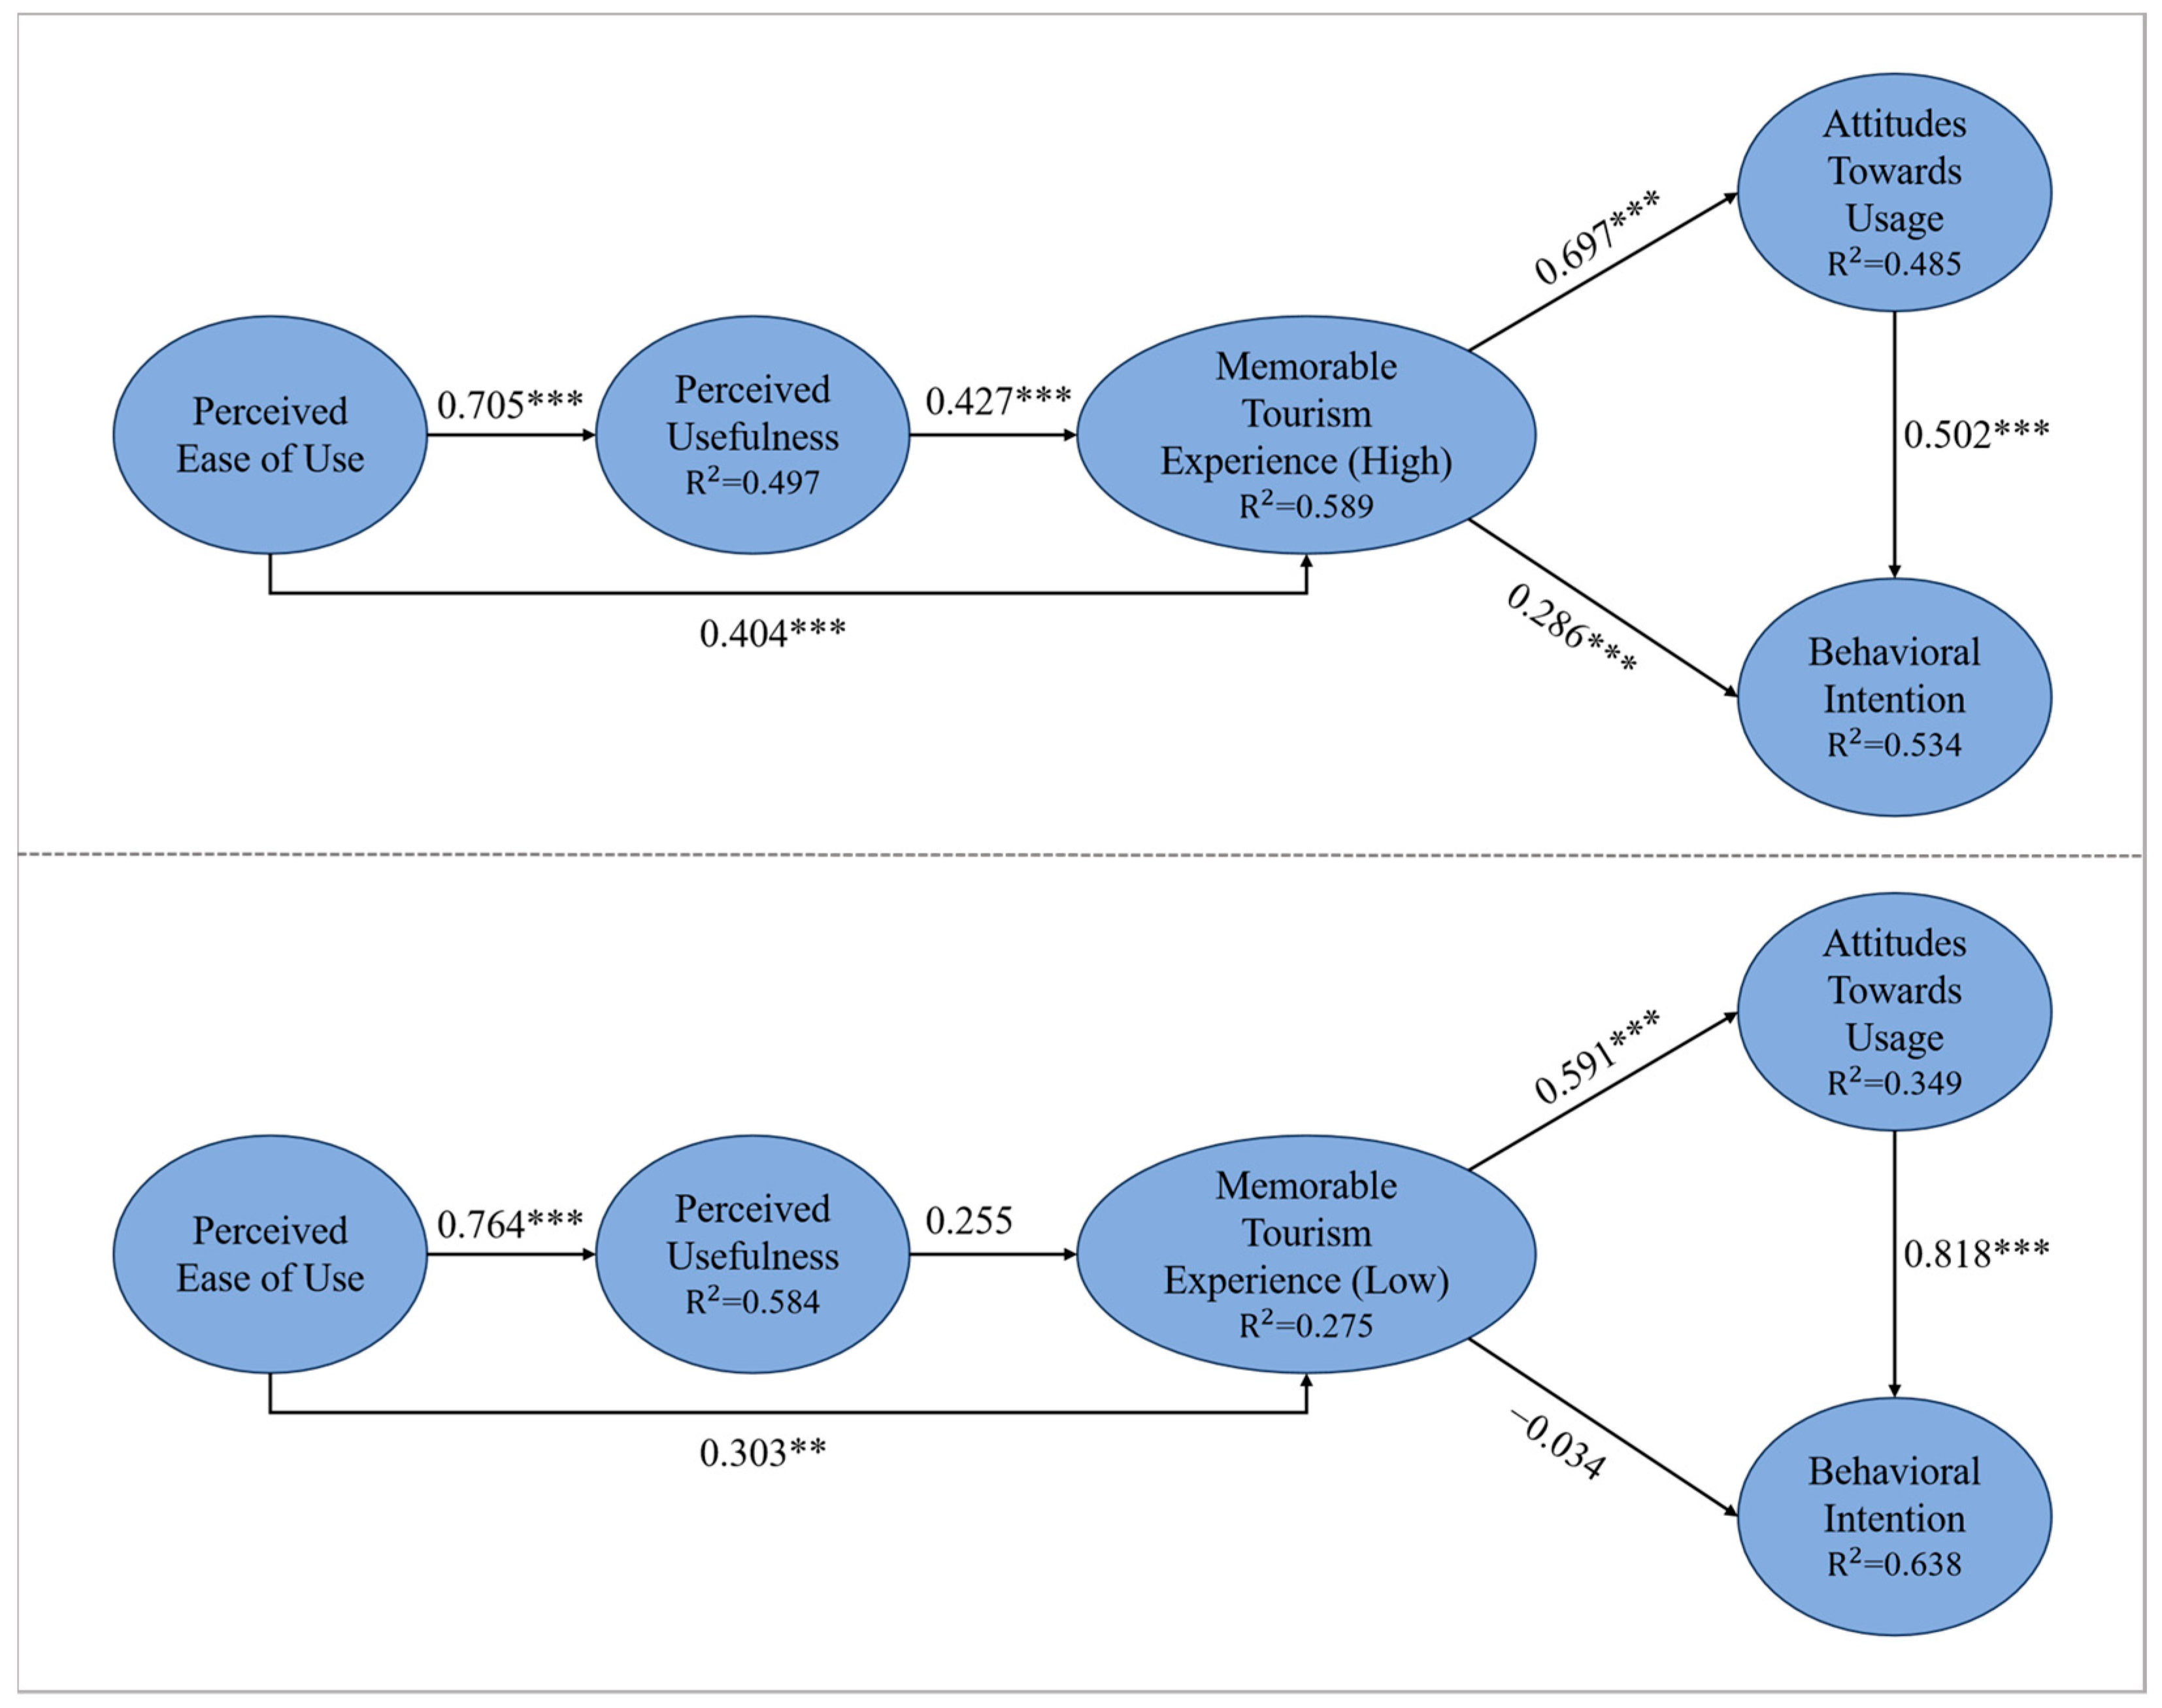
5.3. TAM’s Influence on High- and Low-MTE Groups

To further discover the influence of TAM concepts on MTE in terms of different degrees, a K-means clustering analysis was adopted to divide the respondents into two groups: a Low-MTE group and a High–MTE group. Subsequently, these two groups were incorporated into the empirical analysis with a structural equation model (Figure 4). The results of the analysis indicated that PU and PEOU had a stronger explanatory power for the High-MTE group ( R H i g h 2 = 0.589 ). In the High-MTE group, both PU and PEOU had significant positive influences on MTE. However, it was noteworthy that for the Low-MTE group, only PEOU had a significant positive impact on MTE, indicating a relatively weaker explanatory power for these factors ( R L o w 2 = 0.275 ). Furthermore, in exploring the consequences of MTE, the analysis revealed that the High-MTE group had a significant positive effect on ATU ( β = 0.697 , p = 0.000 ) and BI ( β = 0.286 ,   p = 0.008 ). In contrast, the Low-MTE group only had a significant positive effect on ATU ( β = 0.591 ,   p = 0.000 ), with ATU fully mediating the effect on BI.

6. Discussion

6.1. Theoretical Implications

First, due to the potential of AR technology to reduce tourists’ utilization of physical tourism resources and to preserve the integrity of cultural heritage, it has been utilized to enhance the sustainability of cultural heritage tourism destinations [19,36]. A significant body of relevant tourism types has confirmed the association between AR and tourist experiences [34,42]. Nevertheless, current research has been confined to indoor tourism settings, such as museums and exhibitions [3,41], with a paucity of exploration into the application of AR in outdoor real-world tourism contexts. Therefore, this study focuses on outdoor natural heritage sites in the context of AR tourism, and reexamines the relationship between AR and MTE. The findings of this research underscore the significance of AR technology perception in shaping tourists’ memories in this unique tourism setting, and how tourists’ MTE reciprocally influences the acceptance of AR. As a result, this study expands the contextual scope of AR tourism-related research, and enriches the body of knowledge in the field.
Second, this study excavates the antecedent factors of MTE induced by AR from the TAM structure of AR, and enriches the internal psychological mechanism of MTE formation in AR from the perspective of AR technology perception. When tourists perceive less effort in using AR, they are likely to develop a sense of mastery over the technology, thereby generating MTE. This finding aligns with a proportion of the conclusions drawn by Huang et al. (2019) [80], i.e., that the PEOU of mobile applications can create exceptional experiential value for consumers. Similarly, when tourists perceive that their specific needs can be well fulfilled with the usage of AR, they consider this technology useful, thus resulting in the formation of positive travel memories and subsequent MTE. This conclusion further complements previous evidence on the relationship between PU and complex psychological experiences [100,101]. The above findings partially explain the mechanism of AR as a driving force for sustainable development and forming tourists’ MTE, provide important empirical evidence for AR tourism research on how AR technology inherently affects tourist experience, and fill in the gaps in previous research directions. Compared with other related studies [11,20], this study emphasizes the important role of technological perception in psychological experience, thus expanding its original research content and conclusions.
Third, this study also identifies the outcome variables of MTE within the TAM structure, thereby expanding the subjective experience perspective of AR technology acceptance in outdoor natural heritage tourism. The positive memories and experiences that tourists acquire during AR tourism contribute to the development of favorable attitudes towards AR usage. Additionally, these experiences also generate behavioral intentions to use AR again in tourist destinations and to recommend the application to others. This conclusion provides new evidence for understanding the theoretical framework of AR application attitudes and usage behaviors, and further emphasizes the role of user experience in technology acceptance [83]. Moreover, our findings demonstrate that the MTE generated by tourists in AR tourism positively influences the BI of AR, mediated by the ATU of AR. This conclusion not only reaffirms previous research findings regarding the relationship between MTE and BI in the context of AR tourism [102,103], but also provides further insights into the mechanisms through which MTE influences BI. The ATU and BI of AR reflect the potential application value and sustainable development capabilities of AR technology in terms of applying the technology itself. This exploration provides a long-term theoretical basis for research into the sustainable application of AR technology in tourism destinations.
Finally, this study explores the specific relationships between various structures of TAM and different levels of MTE, thereby enhancing existing knowledge in the relevant field. Tourists with lower levels of MTE show higher sensitivity to the PEOU of AR technology, with the primary antecedent being the PEOU of AR. For tourists with higher levels of MTE, the main antecedents include both the PEOU and PU of AR. This underscores the indispensability of PU in shaping high levels of MTE, while the role of PEOU in high levels of MTE appears non-essential. This observation may shed light on the previous insignificant effects of PEOU on technology adoption intentions [79]. When tourists experience low MTE in AR tourism, the improvement in their BI can only be achieved through enhancing ATU. However, a high level of MTE can directly affect BI besides the mediation of ATU. This intriguing finding may find its roots in tourists’ travel motives. Tourists pursuing AR experience are likely driven by their attitude towards AR, while those seeking distinctive destination activities through AR are likely motivated by the novelty, enjoyment, and unique experiences facilitated by AR, rather than being solely driven by their attitude toward AR use. These findings further confirm all the relevant research conclusions mentioned above, and at the same time reveal the differences in antecedents and consequences in the- High and Low-MTE groups. By providing an in-depth analysis of the virtuous cycle between AR forming MTE and MTE influencing AR behavioral intention, this study contributes to the body of evidence supporting AR tourism as a sustainable tourism behavior.

6.2. Management Implications

The adoption of AR technology by destinations serves to achieve sustainable development both economically, by attracting tourist flows [34], and socially and environmentally, by reducing the strain on physical tourism resources [19]. Thus, the successful implementation and societal acceptance of AR technology has become pivotal in promoting the sustainable development of tourist destinations. Additionally, MTE, as a crucial indicator used by destinations to attain competitive advantages and sustainable development capabilities, plays a vital role in enhancing destination sustainability [53,55]. Therefore, the series of research conclusions derived from this study undeniably speaks to the need for sustainable development in the tourism industry, and bears practical significance in augmenting destination competitiveness and management proficiency. Specifically, the managerial implications of this study can be summarized as follows.
The antecedent conclusions of MTE are of great significance to the management and marketing of tourist destinations. During the process of tourism destination marketing, on the one hand, AR application developers can simplify the use of steps, optimize the user interface, and provide guidance and other means so that tourists can quickly understand and operate the function of the application system and perceive the simplicity of the application. On the other hand, developers can develop special AR activities in a targeted manner in combination with the characteristics of the destination and tourists, so that tourists can perceive the usefulness of the application. Through these two improvement ideas, it is possible to enhance tourists’ MTE, thereby effectively increasing their loyalty, fostering cultural preservation and community engagement, and promoting diversification and innovation within the tourism industry [104,105,106]. These factors collectively contribute to the sustainable development and long-term success of the tourism destination.
The findings concerning the consequences of MTE have significant implications for assessing the effectiveness of AR usage and planning the future development of destinations. On the one hand, destination managers can draw upon these conclusions to evaluate the effectiveness of AR usage and assess its sustainability performance, and solve problems in a targeted manner. On the other hand, destination managers can improve the various dimensions of MTE from different aspects. For instance, adding knowledge elements to AR applications can enhance knowledge experience for tourists, while designing fun elements of human–computer interaction can enhance participatory experience. Through such means, it is possible to effectively enhance tourists’ attitude and intention to use AR applications. Based on such marketing strategies, not only can destination managers increase the number of tourists in the destination, but they can also reduce the utilization of physical tourism resources. This dual benefit contributes to the enduring vitality of the destination, particularly for natural heritage destinations, thereby providing soft power for the sustainable development of the destination.

7. Conclusions

AR technology’s application in tourism has been widely recognized as a key technology for the sustainable development of the tourism industry. MTE has also been widely acknowledged as a key indicator for enhancing destination competitiveness. Therefore, to introducing MTE generated by AR is of great significance to sustainable tourism research. Based on this, this study takes outdoor natural heritage site AR tourism as the context and integrates TAM structures and MTE to construct a research model, which aims to explore the relationship between the structural elements of TAM and MTE. The study identifies the antecedents of MTE from the TAM structure as the PU and PEOU of AR technology, and the consequences of MTE as ATU and BI. Additionally, the study reveals differences in the relationship between the TAM structure and High- and Low-MTE groups. This study expands the contextual scope of AR tourism research, explains the psychological mechanism of AR forming MTE from the perspective of TAM, and expands technological acceptance of AR from the perspective of experience, which promotes the theoretical progress of current related research. Finally, this study also provides corresponding practical significance for the sustainable development of tourist destinations.
There are also some limitations in the research process of this study, which will then provide research directions for future research. Firstly, this study investigates the application of AR to outdoor natural tourism experiences with cultural heritage elements. Although they have a certain degree of representativeness, the demographic characteristics of the tourist group in this case are limited to students and employees. Future research should encompass the utilization of AR in a broader array of distinctive tourism formats, aiming to diversify the sample group’s characteristics. Secondly, we employed a traditional questionnaire survey method to derive certain specific research findings regarding the relationship between TAM and MTE. However, there exist certain constraints in gaining a comprehensive understanding of the benefits of AR for MTE. In the future, it is advisable to complement this with qualitative research methods, such as interviews and focus groups, to further delve into the topic, thereby enriching the research conclusions in this area. Thirdly, due to the strong personalization of travel experience, there may be variations in the authentic experiences formed by tourists using AR. Future research can further explore how the individualization of the travel experience affects the real experience generated by AR. Finally, with the innovative development of information technology, AR functions are likely to be integrated into the metaverse. In this context, whether the application of AR in tourism is an opportunity or a challenge is worth further exploration and excavation.

Author Contributions

Conceptualization, S.J.; methodology, S.L. and S.J.; software, S.L. and S.J.; validation, S.L.; formal analysis, S.L. and S.J.; investigation, S.L. and S.J.; resources, S.L. and S.J.; data curation, S.J. and S.L.; writing—original draft preparation, S.L.; writing—review and editing, S.J. and S.L.; visualization, S.L.; supervision, S.J.; project administration, S.J. All authors have read and agreed to the published version of the manuscript.

Funding

This research received no external funding.

Institutional Review Board Statement

Not applicable.

Informed Consent Statement

Informed consent was obtained from all subjects involved in the study.

Data Availability Statement

Not applicable.

Acknowledgments

We would like to express our gratitude to the members of the Smart Tourism Application of Augmented Reality Research Project team from Capital Normal University for their assistance in data collection.

Conflicts of Interest

The authors declare no conflict of interest.

References

  1. Kounavis, C.D.; Kasimati, A.E.; Zamani, E.D. Enhancing the tourism experience through mobile augmented reality: Challenges and prospects. Int. J. Eng. Bus. Manag. 2012, 4, 10. [Google Scholar] [CrossRef]
  2. Bec, A.; Moyle, B.; Timms, K.; Schaffer, V.; Skavronskaya, L.; Little, C. Management of immersive heritage tourism experiences: A conceptual model. Tour. Manag. 2019, 72, 117–140. [Google Scholar] [CrossRef]
  3. Tom Dieck, M.C.; Jung, T.H. Value of augmented reality at cultural heritage sites: A stakeholder approach. J. Destin. Mark. Manag. 2017, 6, 110–117. [Google Scholar] [CrossRef]
  4. Jansson, A. Spatial phantasmagoria: The mediatization of tourism experience. Eur. J. Commun. 2002, 17, 429–443. [Google Scholar] [CrossRef]
  5. Wang, D.; Park, S.; Fesenmaier, D.R. The Role of Smartphones in Mediating the Touristic Experience. J. Travel Res. 2012, 51, 17. [Google Scholar] [CrossRef]
  6. Cranmer, E.E.; Tom Dieck, M.C.; Fountoulaki, P. Exploring the value of augmented reality for tourism. Tour. Manag. Perspect. 2020, 35, 100672. [Google Scholar] [CrossRef]
  7. Tsai, S. Augmented reality enhancing place satisfaction for heritage tourism marketing. Curr. Issues Tour. 2020, 23, 1078–1083. [Google Scholar] [CrossRef]
  8. Dieck, M.C.T.; Jung, T. A theoretical model of mobile augmented reality acceptance in urban heritage tourism. Curr. Issues Tour. 2018, 21, 154–174. [Google Scholar] [CrossRef]
  9. Wu, S.; Chiu, C.; Chen, Y. The influences of innovative technological introduction on interpretive experiences of exhibition: A discussion on the intention to use augmented reality. Asia Pac. J. Tour. Res. 2020, 25, 662–677. [Google Scholar] [CrossRef]
  10. Chung, N.; Tyan, I.; Han, H. Enhancing the smart tourism experience through geotag. Inf. Syst. Front. 2017, 19, 731–742. [Google Scholar] [CrossRef]
  11. Jiang, S.; Moyle, B.; Yung, R.; Tao, L.; Scott, N. Augmented reality and the enhancement of memorable tourism experiences at heritage sites. Curr. Issues Tour. 2023, 26, 242–257. [Google Scholar] [CrossRef]
  12. Obeidy, W.K.; Arshad, H.; Huang, J.Y. An acceptance model for smart glasses based tourism augmented reality. AIP Conf. Proc. 2017, 1891, 020080. [Google Scholar]
  13. Shin, H.H.; Jeong, M. Travelers’ motivations to adopt augmented reality (AR) applications in a tourism destination. J. Hosp. Tour. Technol. 2021, 12, 389–405. [Google Scholar] [CrossRef]
  14. Palos-Sanchez, P.; Saura, J.R.; Correia, M.B. Do tourism applications’ quality and user experience influence its acceptance by tourists? Rev. Manag. Sci. 2021, 15, 1205–1241. [Google Scholar] [CrossRef]
  15. Li, X.; Chen, C.; Kang, X.; Kang, J. Research on relevant dimensions of tourism experience of intangible cultural heritage lantern festival: Integrating generic learning outcomes with the technology acceptance model. Front. Psychol. 2022, 13, 943277. [Google Scholar] [CrossRef]
  16. Kim, J.; Ritchie, J.B.; McCormick, B. Development of a scale to measure memorable tourism experiences. J. Travel Res. 2012, 51, 12–25. [Google Scholar] [CrossRef]
  17. Sthapit, E.; Coudounaris, D.N. Memorable tourism experiences: Antecedents and outcomes. Scand. J. Hosp. Tour. 2018, 18, 72–94. [Google Scholar] [CrossRef]
  18. Ye, S.; Wei, W.; Wen, J.; Ying, T.; Tan, X. Creating memorable experience in rural tourism: A comparison between domestic and outbound tourists. J. Travel Res. 2021, 60, 1527–1542. [Google Scholar] [CrossRef]
  19. Han, S.; Yoon, J.; Kwon, J. Impact of experiential value of augmented reality: The context of heritage tourism. Sustainability 2021, 13, 4147. [Google Scholar] [CrossRef]
  20. Tom Dieck, M.C.; Jung, T.; Rauschnabel, P. Determining visitor engagement through augmented reality at science festivals: An experience economy perspective. Comput. Hum. Behav. 2018, 82, 44–53. [Google Scholar] [CrossRef]
  21. Mohanty, P.; Hassan, A.; Ekis, E. Augmented reality for relaunching tourism post-COVID-19: Socially distant, virtually connected. Worldw. Hosp. Tour. Themes 2020, 12, 753–760. [Google Scholar] [CrossRef]
  22. Tom Dieck, M.C.; Jung, T.H.; Tom Dieck, D. Enhancing art gallery visitors’ learning experience using wearable augmented reality: Generic learning outcomes perspective. Curr. Issues Tour. 2018, 21, 2014–2034. [Google Scholar] [CrossRef]
  23. He, Z.; Wu, L.; Li, X.R. When art meets tech: The role of augmented reality in enhancing museum experiences and purchase intentions. Tour. Manag. 2018, 68, 127–139. [Google Scholar] [CrossRef]
  24. Jung, T.; Tom Dieck, M.C.; Lee, H.; Chung, N. Moderating role of long-term orientation on augmented reality adoption. Int. J. Hum.–Comput. Interact. 2020, 36, 239–250. [Google Scholar] [CrossRef]
  25. Xu, L.; Zhao, S.; Chen, Q.; Cui, N.; He, J. When historically cultural and creative products meet AR: The effect of augmented reality–based product display on consumers’ product evaluation. Nankai Bus. Rev. Int. 2023, 14, 161–176. [Google Scholar] [CrossRef]
  26. Litvak, E.; Kuflik, T. Enhancing cultural heritage outdoor experience with augmented-reality smart glasses. Pers. Ubiquitous Comput. 2020, 24, 873–886. [Google Scholar] [CrossRef]
  27. Carmigniani, J.; Furht, B.; Anisetti, M.; Ceravolo, P.; Damiani, E.; Ivkovic, M. Augmented reality technologies, systems and applications. Multimed. Tools Appl. 2011, 51, 341–377. [Google Scholar] [CrossRef]
  28. Sung, E.C. The effects of augmented reality mobile app advertising: Viral marketing via shared social experience. J. Bus. Res. 2021, 122, 75–87. [Google Scholar] [CrossRef]
  29. Aluri, A. Mobile augmented reality (MAR) game as a travel guide: Insights from Pokemon GO. J. Hosp. Tour. Technol. 2017, 8, 55–72. [Google Scholar] [CrossRef]
  30. Loureiro, S.M.C.; Guerreiro, J.; Ali, F. 20 years of research on virtual reality and augmented reality in tourism context: A text-mining approach. Tour. Manag. 2020, 77, 104028. [Google Scholar] [CrossRef]
  31. Tussyadiah, I.P.; Jung, T.H.; Tom Dieck, M.C. Embodiment of wearable augmented reality technology in tourism experiences. J. Travel Res. 2018, 57, 597–611. [Google Scholar] [CrossRef]
  32. Park, S.; Stangl, B. Augmented reality experiences and sensation seeking. Tour. Manag. 2020, 77, 104023. [Google Scholar] [CrossRef]
  33. Orus, C.; Ibanez-Sanchez, S.; Flavian, C. Enhancing the customer experience with virtual and augmented reality: The impact of content and device type. Int. J. Hosp. Manag. 2021, 98, 103019. [Google Scholar] [CrossRef]
  34. Tsang, S.; Kuo, C.; Hu, T.; Wang, W. Exploring impacts of AR on group package tours: Destination image, perceived certainty, and experiential value. J. Vacat. Mark. 2023, 29, 84–102. [Google Scholar] [CrossRef]
  35. Han, D.; tom Dieck, M.C.; Jung, T. User experience model for augmented reality applications in urban heritage tourism. J. Herit. Tour. 2018, 13, 46–61. [Google Scholar] [CrossRef]
  36. Boboc, R.G.; Bautu, E.; Girbacia, F.; Popovici, N.; Popovici, D. Augmented Reality in Cultural Heritage: An Overview of the Last Decade of Applications. Appl. Sci. 2022, 12, 9859. [Google Scholar] [CrossRef]
  37. Huang, T. Restorative experiences and online tourists’ willingness to pay a price premium in an augmented reality environment. J. Retail. Consum. Serv. 2021, 58, 102256. [Google Scholar] [CrossRef]
  38. Bird, J.M.; Smart, P.A.; Harris, D.J.; Phillips, L.A.; Giannachi, G.; Vine, S.J. A Magic Leap in Tourism: Intended and Realized Experience of Head-Mounted Augmented Reality in a Museum Context. J. Travel Res. 2022, 62, 678155569. [Google Scholar] [CrossRef]
  39. Zhu, C.; Io, M.; Ngan, H.F.B.; Peralta, R.L. Understanding augmented reality marketing in world cultural heritage site, the lens of authenticity perspective. J. Vacat. Mark. 2023, 29, 242–255. [Google Scholar] [CrossRef]
  40. Chung, N.; Lee, H.; Kim, J.; Koo, C. The Role of Augmented Reality for Experience-Influenced Environments: The Case of Cultural Heritage Tourism in Korea. J. Travel Res. 2018, 57, 627–643. [Google Scholar] [CrossRef]
  41. Jung, T.H.; Lee, H.; Chung, N.; Tom Dieck, M.C. Cross—cultural differences in adopting mobile augmented reality at cultural heritage tourism sites. Int. J. Contemp. Hosp. Manag. 2018, 30, 1621–1645. [Google Scholar] [CrossRef]
  42. Santoso, H.B.; Wang, J.; Windasari, N.A. Impact of multisensory extended reality on tourism experience journey. J. Hosp. Tour. Technol. 2022, 13, 356–385. [Google Scholar] [CrossRef]
  43. Rodrigues, J.M.; Ramos, C.M.; Pereira, J.A.; Sardo, J.D.; Cardoso, P.J. Mobile five senses augmented reality system: Technology acceptance study. IEEE Access 2019, 7, 163022–163033. [Google Scholar] [CrossRef]
  44. Yu, J.; Kim, S.; Hailu, T.B.; Park, J.; Han, H. The effects of virtual reality (VR) and augmented reality (AR) on senior tourists’ experiential quality, perceived advantages, perceived enjoyment, and reuse intention. Curr. Issues Tour. 2023, 1–15. [Google Scholar] [CrossRef]
  45. McCall, R.; Wetzel, R.; Löschner, J.; Braun, A. Using presence to evaluate an augmented reality location aware game. Pers. Ubiquitous Comput. 2011, 15, 25–35. [Google Scholar] [CrossRef]
  46. Akcayir, M.; Akcayir, G. Advantages and challenges associated with augmented reality crossMark for education: A systematic review of the literature. Educ. Res. Rev. 2017, 20, 1–11. [Google Scholar] [CrossRef]
  47. Yung, R.; Khoo-Lattimore, C. New realities: A systematic literature review on virtual reality and augmented reality in tourism research. Curr. Issues Tour. 2019, 22, 2056–2081. [Google Scholar] [CrossRef]
  48. Chandralal, L.; Rindfleish, J.; Valenzuela, F. An Application of Travel Blog Narratives to Explore Memorable Tourism Experiences. Asia Pac. J. Tour. Res. 2015, 20, 680–693. [Google Scholar] [CrossRef]
  49. Servidio, R.; Ruffolo, I. Exploring the relationship between emotions and memorable tourism experiences through narratives. Tour. Manag. Perspect. 2016, 20, 151–160. [Google Scholar] [CrossRef]
  50. Barbieri, C.; Henderson, K.A.; Santos, C.A. Exploring memorable surfing trips. Ann. Tour. Res. 2014, 48, 277–280. [Google Scholar] [CrossRef]
  51. Kim, J. Destination attributes affecting negative memory: Scale development and validation. J. Travel Res. 2022, 61, 331–345. [Google Scholar] [CrossRef]
  52. Azis, N.; Amin, M.; Chan, S.; Aprilia, C. How smart tourism technologies affect tourist destination loyalty. J. Hosp. Tour. Technol. 2020, 11, 603–625. [Google Scholar] [CrossRef]
  53. Kim, J.; Jang, S.S. Memory Retrieval of Cultural Event Experiences: Examining Internal and External Influences. J. Travel Res. 2016, 55, 322–339. [Google Scholar] [CrossRef]
  54. Kim, Y.; Ribeiro, M.A.; Li, G. Tourism memory characteristics scale: Development and validation. J. Travel Res. 2022, 61, 1308–1326. [Google Scholar] [CrossRef]
  55. Kim, J. The antecedents of memorable tourism experiences: The development of a scale to measure the destination attributes associated with memorable experiences. Tour. Manag. 2014, 44, 34–45. [Google Scholar] [CrossRef]
  56. Wei, C.; Zhao, W.; Zhang, C.; Huang, K. Psychological factors affecting memorable tourism experiences. Asia Pac. J. Tour. Res. 2019, 24, 619–632. [Google Scholar] [CrossRef]
  57. Stone, M.J.; Migacz, S.; Sthapit, E. Connections between culinary tourism experiences and memory. J. Hosp. Tour. Res. 2022, 46, 797–807. [Google Scholar] [CrossRef]
  58. Kim, J. The Impact of Memorable Tourism Experiences on Loyalty Behaviors: The Mediating Effects of Destination Image and Satisfaction. J. Travel Res. 2018, 57, 856–870. [Google Scholar] [CrossRef]
  59. Rasoolimanesh, S.M.; Seyfi, S.; Hall, C.M.; Hatamifar, P. Understanding memorable tourism experiences and behavioural intentions of heritage tourists. J. Destin. Mark. Manag. 2021, 21, 100621. [Google Scholar] [CrossRef]
  60. Rasoolimanesh, S.M.; Seyfi, S.; Rather, R.A.; Hall, C.M. Investigating the mediating role of visitor satisfaction in the relationship between memorable tourism experiences and behavioral intentions in heritage tourism context. Tour. Rev. 2022, 77, 23. [Google Scholar] [CrossRef]
  61. Tung, V.W.S.; Ritchie, J.R.B. Exploring The Essence of Memorable Tourism Experiences. Ann. Tour. Res. 2011, 38, 1367–1386. [Google Scholar] [CrossRef]
  62. Peng, J.; Yang, X.; Fu, S.; Huan, T.T. Exploring the influence of tourists’ happiness on revisit intention in the context of Traditional Chinese Medicine cultural tourism. Tour. Manag. 2023, 94, 104647. [Google Scholar] [CrossRef]
  63. Hosseini, S.; Cortes-Macías, R.; Almeida-García, F. Extending the memorable tourism experience construct: An investigation of tourists’ memorable dark experiences. J. Vacat. Mark. 2022, 1322964746. [Google Scholar] [CrossRef]
  64. Stone, M.J.; Soulard, J.; Migacz, S.; Wolf, E. Elements of Memorable Food, Drink, and Culinary Tourism Experiences. J. Travel Res. 2018, 57, 1121–1132. [Google Scholar] [CrossRef]
  65. Ghanem, M.; Shaaban, K. Determinants of memorable sightseeing bus-tour experiences: Identifying and evaluating destination related attributes. Tour. Hosp. Res. 2022, 22, 209–225. [Google Scholar] [CrossRef]
  66. Yang, X.; Zhang, L. Smart tourism technologies towards memorable experiences for museum visitors. Tour. Rev. 2022, 77, 1009–1023. [Google Scholar] [CrossRef]
  67. Chang, S. Can smart tourism technology enhance destination image? The case of the 2018 Taichung World Flora Exposition. J. Hosp. Tour. Technol. 2022, 13, 590–607. [Google Scholar] [CrossRef]
  68. Kim, H.; Koo, C.; Chung, N. The role of mobility apps in memorable tourism experiences of Korean tourists: Stress-coping theory perspective. J. Hosp. Tour. Manag. 2021, 49, 548–557. [Google Scholar] [CrossRef]
  69. Aldhaban, F. Exploring the adoption of Smartphone technology: Literature review. In 2012 Proceedings of PICMET’12: Technology Management for Emerging Technologies; Curran Associates: New York, NY, USA, 2012; pp. 2758–2770. [Google Scholar]
  70. Assaker, G. Age and gender differences in online travel reviews and user-generated-content (UGC) adoption: Extending the technology acceptance model (TAM) with credibility theory. J. Hosp. Mark. Manag. 2020, 29, 428–449. [Google Scholar] [CrossRef]
  71. Lee, L.Y. Hospitality Industry Web-Based Self-Service Technology Adoption Model: A Cross-Cultural Perspective. J. Hosp. Tour. Res. 2016, 40, 162–197. [Google Scholar] [CrossRef]
  72. Davis, F.D.; Bagozzi, R.P.; Warshaw, P.R. User acceptance of computer technology: A comparison of two theoretical models. Manag. Sci. 1989, 35, 982–1003. [Google Scholar] [CrossRef]
  73. Medeiros, M.; Ozturk, A.; Hancer, M.; Weinland, J.; Okumus, B. Understanding travel tracking mobile application usage: An integration of self determination theory and UTAUT2. Tour. Manag. Perspect. 2022, 42, 100949. [Google Scholar] [CrossRef]
  74. Kucukusta, D.; Law, R.; Besbes, A.; Legohérel, P. Re-examining perceived usefulness and ease of use in online booking: The case of Hong Kong online users. Int. J. Contemp. Hosp. Manag. 2015, 27, 185–198. [Google Scholar] [CrossRef]
  75. Ahmad, H.; Butt, A.; Muzaffar, A. Travel before you actually travel with augmented reality—Role of augmented reality in future destination. Curr. Issues Tour. 2022, 26, 2845–2862. [Google Scholar] [CrossRef]
  76. Özekici, Y.K.; Küçükergin, K.G. The role of COVID-19 anxiety and social contact within technology readiness and acceptance model for virtual reality. J. Vacat. Mark. 2022, 1322968556. [Google Scholar] [CrossRef]
  77. Kim, D.Y.; Park, J.; Morrison, A.M. A model of traveller acceptance of mobile technology. Int. J. Tour. Res. 2008, 10, 393–407. [Google Scholar] [CrossRef]
  78. Oh, J.C.; Yoon, S.J.; Chung, N. The role of technology readiness in consumers’ adoption of mobile internet services between South Korea and China. Int. J. Mob. Commun. 2014, 12, 229–248. [Google Scholar] [CrossRef]
  79. Huang, Y.C.; Backman, K.F.; Backman, S.J.; Chang, L.L. Exploring the implications of virtual reality technology in tourism marketing: An integrated research framework. Int. J. Tour. Res. 2016, 18, 116–128. [Google Scholar] [CrossRef]
  80. Huang, Y.; Chang, L.L.; Yu, C.; Chen, J. Examining an extended technology acceptance model with experience construct on hotel consumers’ adoption of mobile applications. J. Hosp. Mark. Manag. 2019, 28, 957–980. [Google Scholar] [CrossRef]
  81. El-Said, O.; Aziz, H. Virtual tours a means to an end: An analysis of virtual tours’ role in tourism recovery post COVID-19. J. Travel Res. 2022, 61, 528–548. [Google Scholar] [CrossRef]
  82. Filieri, R.; Acikgoz, F.; Ndou, V.; Dwivedi, Y. Is TripAdvisor still relevant? The influence of review credibility, review usefulness, and ease of use on consumers’ continuance intention. Int. J. Contemp. Hosp. Manag. 2021, 33, 199–223. [Google Scholar] [CrossRef]
  83. Huang, Y.; Backman, S.J.; Backman, K.F.; Moore, D. Exploring user acceptance of 3D virtual worlds in travel and tourism marketing. Tour. Manag. 2013, 36, 490–501. [Google Scholar] [CrossRef]
  84. Kim, M.J.; Kim, W.G.; Kim, J.M.; Kim, C. Does knowledge matter to seniors’ usage of mobile devices? Focusing on motivation and attachment. Int. J. Contemp. Hosp. Manag. 2016, 28, 1702–1727. [Google Scholar] [CrossRef]
  85. Dogra, N.; Adil, M. Should we or should we not? Examining travelers’ perceived privacy, perceived security and actual behavior in online travel purchases. J. Vacat. Mark. 2022, 1322955721. [Google Scholar] [CrossRef]
  86. Han, D.; Hou, H.C.; Wu, H.; Lai, J.H.K. Modelling Tourists‘ Acceptance of Hotel Experience-Enhancement Smart Technologies. Sustainability 2021, 13, 4462. [Google Scholar] [CrossRef]
  87. Karahanna, E.; Agarwal, R.; Angst, C.M. Reconceptualizing compatibility beliefs in technology acceptance research. MIS Q. 2006, 30, 781–804. [Google Scholar] [CrossRef]
  88. Venkatesh, V.; Davis, F.D. A theoretical extension of the technology acceptance model: Four longitudinal field studies. Manag. Sci. 2000, 46, 186–204. [Google Scholar] [CrossRef]
  89. Venkatesh, V.; Bala, H. Technology Acceptance Model 3 and a Research Agenda on Interventions. Decis. Sci. 2008, 39, 273–315. [Google Scholar] [CrossRef]
  90. Li, C.; Fang, Y.; Sukoco, B.M. Value proposition as a catalyst for innovative service experience: The case of smart-tourism destinations. Serv. Bus. 2021, 15, 281–308. [Google Scholar] [CrossRef]
  91. Li, Y.; Liang, J.; Huang, J.; Yang, M.; Li, R.; Bai, H. Would You Accept Virtual Tourism? The Impact of COVID-19 Risk Perception on Technology Acceptance from a Comparative Perspective. Sustainability 2022, 14, 12693. [Google Scholar] [CrossRef]
  92. Gohary, A.; Pourazizi, L.; Madani, F.; Chan, E.Y. Examining Iranian tourists’ memorable experiences on destination satisfaction and behavioral intentions. Curr. Issues Tour. 2020, 23, 131–136. [Google Scholar] [CrossRef]
  93. Pappas, N.; Michopoulou, E.; Farmaki, A.; Leivadiotaki, E. Chaordic destination image formulation through gastronomy perspectives: Evidence from Greece. Int. J. Contemp. Hosp. Manag. 2022, 34, 3459–3481. [Google Scholar] [CrossRef]
  94. Sharma, P.; Nayak, J.K. Understanding memorable tourism experiences as the determinants of tourists’ behaviour. Int. J. Tour. Res. 2019, 21, 504–518. [Google Scholar] [CrossRef]
  95. Wong, J.W.C.; Lai, I.K.W. Gaming and non-gaming memorable tourism experiences: How do they influence young and mature tourists’ behavioural intentions? J. Destin. Mark. Manag. 2021, 21, 100642. [Google Scholar] [CrossRef]
  96. Davis, F.D. Perceived usefulness, perceived ease of use, and user acceptance of information technology. MIS Q. 1989, 13, 319–340. [Google Scholar] [CrossRef]
  97. Hair, J.F., Jr.; Sarstedt, M.; Ringle, C.M.; Gudergan, S.P. Advanced Issues in Partial Least Squares Structural Equation Modeling; Sage publications: Thousand Oaks, CA, USA, 2017. [Google Scholar]
  98. Fornell, C.; Larcker, D.F. Evaluating structural equation models with unobservable variables and measurement error. J. Mark. Res. 1981, 18, 39–50. [Google Scholar] [CrossRef]
  99. Hair, J.F.; Risher, J.J.; Sarstedt, M.; Ringle, C.M. When to use and how to report the results of PLS-SEM. Eur. Bus. Rev. 2019, 31, 2–24. [Google Scholar] [CrossRef]
  100. Liu, Y.; Pu, B.; Guan, Z.; Yang, Q. Online customer experience and its relationship to repurchase intention: An empirical case of online travel agencies in China. Asia Pac. J. Tour. Res. 2016, 21, 1085–1099. [Google Scholar] [CrossRef]
  101. Mendes-Filho, L.; Mills, A.M.; Tan, F.B.; Milne, S. Empowering the traveler: An examination of the impact of user-generated content on travel planning. J. Travel Tour. Mark. 2018, 35, 425–436. [Google Scholar] [CrossRef]
  102. Wei, W.; Qi, R.; Zhang, L. Effects of virtual reality on theme park visitors’ experience and behaviors: A presence perspective. Tour. Manag. 2019, 71, 282–293. [Google Scholar] [CrossRef]
  103. Torabi, Z.; Shalbafian, A.A.; Allam, Z.; Ghaderi, Z.; Murgante, B.; Khavarian-Garmsir, A.R. Enhancing memorable experiences, tourist satisfaction, and revisit intention through smart tourism technologies. Sustainability 2022, 14, 2721. [Google Scholar] [CrossRef]
  104. Raimkulov, M.; Juraturgunov, H.; Ahn, Y. Destination Attractiveness and Memorable Travel Experiences in Silk Road Tourism in Uzbekistan. Sustainability 2021, 13, 2252. [Google Scholar] [CrossRef]
  105. Ng, S.I.; Lim, X.; Hall, C.M.; Tee, K.K.; Basha, N.K.; Ibrahim, W.S.N.B.; Naderi Koupaei, S. Time for Tea: Factors of Service Quality, Memorable Tourism Experience and Loyalty in Sustainable Tea Tourism Destination. Sustainability 2022, 14, 14327. [Google Scholar] [CrossRef]
  106. Obradović, S.; Stojanović, V.; Tešin, A.; Šećerov, I.; Pantelić, M.; Dolinaj, D. Memorable tourist experiences in national parks: Impacts on future intentions and environmentally responsible behavior. Sustainability 2022, 15, 547. [Google Scholar] [CrossRef]
Figure 1. Proposed research conceptual model.
Sustainability 15 13349 g001
Figure 2. Example of data collection process.
Sustainability 15 13349 g002
Figure 3. Hypothesis testing results. *** p < 0.01.
Sustainability 15 13349 g003
Figure 4. Comparison of the effect of TAM on the High- and Low-MTE groups. ** p < 0.05; *** p < 0.01.
Sustainability 15 13349 g004
Table 1. Sample characteristics (N = 275).
CharacteristicsPercentage (N (%))CharacteristicsPercentage (N (%))
Age Marital status
  <207 (2.6)  Married with children103 (37.5)
  20–40193 (70.0)  Married without children30 (10.9)
  40–6061 (22.1)  Single117 (42.5)
  >6014 (5.2)  Other25 (9.1)
Gender Education
  Male112 (40.7)  High school15 (5.5)
  Female163 (59.3)  College34 (12.5)
  Residence   Bachelor’s158 (57.4)
  Beijing248 (90.2)  Master’s/PhD60 (21.7)
  Other27 (9.8)  Others8 (2.9)
Occupation Previous visits to this park
  Management level24 (8.7)  None 223 (81.1)
  Business staff115 (41.8)  2–5 visits44 (16.0)
  Government and institute42 (15.3)  >5 visits8 (2.9)
  Freelancer18 (6.5)
  Students59 (21.5)
  Homemaker6 (2.2)
  Other11 (4)
Table 2. Descriptive statistics and reliability and convergent validity of the scale.
Construct/ItemMeanLoadingCRAVEα
PU (Perceived Usefulness)4.24 0.9210.8530.829
 PU1-AR activities help me acquire information better about this park4.280.929
 PU2-AR activities enhanced my tourism experience in this park4.20.918
PEOU (Perceived Ease of Use)4.225 0.9380.8830.867
 PEOU1-very easy to use4.270.939
 PEOU2-I experienced the AR activities efficiently4.180.94
ATU (Attitudes Towards Usage)4.175 0.9610.9250.919
 ATU1-activities are very beneficial4.210.961
 ATU2-activities are very interesting4.140.963
BI (Behavioral Intention)4.05————————
 BI-I’m happy to use this app when visiting this park4.05
MTE (Memorable Tourism Experience)4.09 0.9710.7890.966
 MTE1-Exciting: I’m thrilled about having a new experience4.110.888
 MTE2-Hedonism: I really enjoyed this tourism experience4.090.92
 MTE3-Novelty: It was a unique experience4.110.867
 MTE4-local culture: I experienced the local features closely4.10.905
 MTE5-Refreshment: I feel liberated and refreshed4.10.925
 MTE6-Freedom: I enjoyed a sense of freedom4.070.902
 MTE7-Meaningfulness: I feel the experience is meaningful and I learned about myself3.990.863
 MTE8-Involvement: I visited a place that I really wanted to go to and enjoyed activities that I was really interested in4.070.862
 MTE9-Knowledge: The experience provided me with the chance of to explore and gain knowledge4.180.858
Table 3. Correlation matrix and discriminant validity.
ConstructsATUBIMTEPEOUPU
ATU0.962
BI0.8331
MTE0.7840.7240.888
PEOU0.8140.7230.7520.94
PU0.7820.710.7310.8110.924
Table 4. Hypothesis testing results.
HypothesesPath Coefficient βS.E.T Valuep ValueHypothesis Results
H1: PEOU→PU0.8110.02928.1240.000supported
H2: PEOU→MTE0.4640.0686.8240.000supported
H3: PU→MTE0.3550.0695.1480.000supported
H4: MTE→ATU0.7840.03423.0570.000supported
H5: MTE→BI0.1840.0642.8650.004supported
H6: ATU→BI0.6890.0709.9010.000supported
Table 5. Mediating effect of ATU.
EffectBootSEBootLLCIBootULCIRatio of Effect
Indirect effect0.6510.0710.5070.78674.83%
Direct effect0.2190.0770.0810.38425.17%
Total effect0.8700.0520.7650.973
Disclaimer/Publisher’s Note: The statements, opinions and data contained in all publications are solely those of the individual author(s) and contributor(s) and not of MDPI and/or the editor(s). MDPI and/or the editor(s) disclaim responsibility for any injury to people or property resulting from any ideas, methods, instructions or products referred to in the content.

