Article

Analysis of Ecological Efficiency, Ecological Innovation, Residents’ Well-Being and Their Improvement Paths in Chinese Resource-Based Cities—Based on the Approaches of Two-Stage Super-SBM and fsQCA

1
College of Management, Sichuan Agricultural University, Chengdu 611130, China
2
School of Environment and Energy Engineering, Anhui Jianzhu University, Hefei 230601, China
3
School of Mechanical Engineering and Automation, Harbin Institute of Technology, Shenzhen 518055, China
*
Author to whom correspondence should be addressed.
Sustainability 2023, 15(18), 13332; https://doi.org/10.3390/su151813332
Submission received: 28 June 2023 / Revised: 27 August 2023 / Accepted: 31 August 2023 / Published: 6 September 2023

Abstract

:
Over the past decades, resource-based cities have played a significant role in the development of countries worldwide. China, as a representative developing country, has seen the vital role played by resource-based cities in its development progress. However, heavy reliance on resources in these cities leads to environmental issues. The challenge lies in achieving ecological innovation and enhancing residents’ well-being within resource and environmental constraints for sustainable regional development. This study introduces a two-stage super slacks-based measure (super-SBM) approach to assess the ecological efficiency (EE), ecological innovation (EI), and residents’ well-being (RW) efficiency of 92 sample resource-based cities in China, and presents spatial and grouping comparisons. Then, the fuzzy-set qualitative comparative analysis method (fsQCA) is applied to identify paths and development orientations for sustainable development. The results show that resource-based cities in southwest and northwest China exhibit strong performance in EE, EI, and RW, while those in the northeast perform poorly. Growth and maturity resource-based cities demonstrate favorable development in EE and EI, whereas recession and regeneration resource-based cities show unsatisfactory development. The RW efficiency tends to stabilize after the rapid growth of the 92 sample resource-based cities. The fsQCA reveals five paths to achieving high EE, three paths for high EI efficiency, and two paths for high RW efficiency. These paths can be categorized into four development orientations: scale-oriented, economic-oriented, integrated-oriented, and transformation-oriented. These results provide essential references for the development planning and strategic formulation not only in China but also in other similar resource-based cities globally.

1. Introduction

The world is facing increasingly serious resource and environmental problems. A statistics report shows that the total primary energy supply has increased from 8.8 to 13.9 billion tons over the past three decades [1]. According to the International Energy Agency, the annual worldwide CO2 emissions increased from 22.2 Gt in 1990 to 36.7 Gt in 2022, and it hit an all-time high earlier this year [2]. Meanwhile, many countries such as China, India, and the USA have suffered severe air pollution, especially PM2.5 air pollution, which poses a great threat to the health of residents [3,4,5]. We know that approximately 3.6 billion people reside in urban areas in the world currently, and it is predicted that by the mid-21st century, over two-thirds of the world’s urban population will be concentrated in cities [6]. Furthermore, around two-thirds of global primary energy demand is attributed to urban areas, resulting in 70% of global direct energy-related greenhouse gas emissions, which has resulted in a change in the urban heat balance [7]. Therefore, research on ecology, energy efficiency, and social welfare would do better to focus on cities [8]. Resource-based cities are those whose leading industries involve the exploitation and processing of natural resources, such as minerals, forests, and fossil fuels [9]. The heavy reliance on natural resources in resource-based cities creates a significant demand for fossil fuels, resulting in high levels of CO2 emissions and a range of social and economic issues. These issues include a monolithic industrial structure, limited technological innovation, and high unemployment rates [10,11]. These problems are closely interrelated with the unsustainable development mode of resource-based cities [12]. Based on international experiences, it is recommended that cities reliant on natural resources shift their focus from resource-intensive growth models towards a low-carbon and high-value-added economy [13]. In addition, Koppl [14] pointed out that determining how to achieve a sustained increase in the level of socio-economic development and human well-being within the ecological context is fundamental for achieving sustainable development. Unfortunately, little literature focuses on the ecological problems of resource-based cities in developing countries. As the most populous country and the second largest economy in the world, China, the development level of the resource industry is even at the forefront of the world. Thus, the sustainable development of resource-based cities in China is a weathervane in developing countries and even other countries in the world, which should receive wider attention and discussion. However, the most imperative task now is to ensure that natural resources and ecological inputs are translated into increased levels of urban ecological innovation and residents’ well-being in China. Since the launch of sustainable development planning in 262 resource-based cities in China in 2013, these cities have been committed to the coordinated development of socio-economic and ecological environmental protection. But how do we assess the effectiveness of these efforts? Evaluation of the level of sustainable development based on the “ecological efficiency–ecological innovation–residents’ well-being” perspective will be a new way to solve this problem.
Countries around the world regard increasing gross domestic production (GDP) as the primary task of social development. The growth of GDP signifies a dynamic environment for innovation and a high standard of living, and then populations generate GDP by consuming resources, labor force, and other items. However, production activities will generate solid waste, wastewater, and greenhouse gas emissions, which inevitably lead to environmental pollution [15]. Therefore, in the context of sustainable development, it is both important and relevant to research the balance between regional economic development and environmental protection. Ecological efficiency (EE) was proposed by Schaltegger et al. in 1990 [16]. The metric of EE takes into account both natural resources and economic levels, along with their impact on the ecological environment. It is commonly employed to assess the sustainability performance of specific industries, regions, and other levels [17]. EE is an imperative indicator for assessing the sustainable development of society, directly related to economic resource consumption and environmental pollution [18]. Furthermore, the EE offers significant potential for investigation into the realm of regional sustainability. It embodies the capacity to yield more favorable outcomes, such as increased GDP, while concurrently minimizing resource consumption and mitigating ecological harm at a regional level. At the same time, the inputs of resources, labor force, etc. must be effectively translated into enhanced levels of ecological innovation (EI) and residents’ well-being (RW). EI plays a crucial role in bridging environmental concerns and economic development. Specifically, EI fosters societal progress by generating new manufacturing techniques and creating novel services [19]. This process is environmentally clean, resulting in fewer emissions of pollutants. Lastly, RW is intricately tied to both the ecological environment and social development, encompassing various aspects such as health, education, and the economy [14,15]. Enhancing EE holds significant importance in fostering both EI within society and the improvement of RW. The goal of improving regional EE is to promote EI and RW [20], and the main concern is to assess the levels of EI and RW in a region that are affected by both desired and undesired outputs [21]. Therefore, determining how to achieve sustained improvements in EE, EI, and RW levels with fewer ecological impacts on the available resources is essential for achieving sustainable development. Currently, studies on the efficiency and pathways of sustainable development of resource-based cities in China can be broadly divided into two categories. One category is to calculate the EE and EI efficiency of resource-based cities in China, followed by efficiency evaluation and/or comparison among regions, etc. [13,22,23,24]. The other category explores methods of achieving sustainable development in resource-based cities using the results of EE calculations [25,26,27]. The above research results are inspiring for the study of sustainable development of resource-based cities in China, but there are still some shortcomings. Firstly, the chosen research indicators appear overly broad and conservative in the present research. This results in numerous studies displaying substantial research depth while simultaneously lacking breadth. Therefore, it is feasible and reasonable to evaluate the level of sustainable development in three dimensions: EE, EI, and RW. In addition, few studies have explored the time-dynamic process of efficiency and have not revealed the history of efficiency changes over the years since the sustainable development of resource-based planning in China. Finally, the use of qualitative and quantitative methods based on the study of efficiency to explore the path of sustainable development in resource-based cities in China has also received little attention from scholars.
In conclusion, the purpose of this paper is to elucidate the following issues: (1) During the period of resource-based urban planning and construction (2013–2019), what were the levels of EE, EI, and RW in different regions and types of resource-based cities in China? (2) What are the key factors influencing the values of EE, EI, and RW in resource-based cities? How have these cities evolved? (3) What policy recommendations can offer valuable insights into the formulation of new plans to promote the sustainable development of resource-based cities? What are the crucial issues that cannot be overlooked? In addition, the innovation of this study is that the sustainable development evaluation index of RW is added to the previous evaluation system of sustainable development of resource-based cities, and the three evaluation indexes of sustainable development (EE, EI, and RW) are calculated. Then, based on the calculated EE, EI efficiency, and RW efficiency, the scientific method is used to analyze the influencing factors, paths, and models for achieving sustainable development in resource-based cities. Above all, the academic contributions of this paper are as follows: (1) In this paper, we use a modified data envelopment analysis (DEA) approach, super slacks-based measure (super-SBM), to measure the EE, EI, and RW of 92 sample resource-based cities in 2013, 2016, and 2019 in China (we selected 1–5 sample resource-based cities from each of the 24 provinces in China). (2) The fuzzy set qualitative comparative analysis (fsQCA) method is used to analyze the key factors that influence 92 sample resource-based cities to achieve high EE, high EI efficiency, and high RW efficiency, and then to explore the model and path of sustainable development. (3) Finally, further discussions are carried out based on the research results, and suggestions are made to promote the sustainable development of resource-based cities in China. Furthermore, the research results will also provide a reference for the governance of the “ecological efficiency–ecological innovation–residents’ well-being” system and sustainable development policies of global resource-based cities to promote the EE, EI, and RW.
The remainder of this paper is organized as follows. Section 2 introduces the research methods and data used in this paper. Section 3 presents the calculation results and comparison of the EE, EI efficiency, and RW efficiency in terms of their spatial–temporal distribution and classification, followed by an exploration of the path to sustainable development. Section 4 further discusses the results of the study and proposes policy recommendations. Section 5 presents the conclusions of this study.

2. Methods and Data

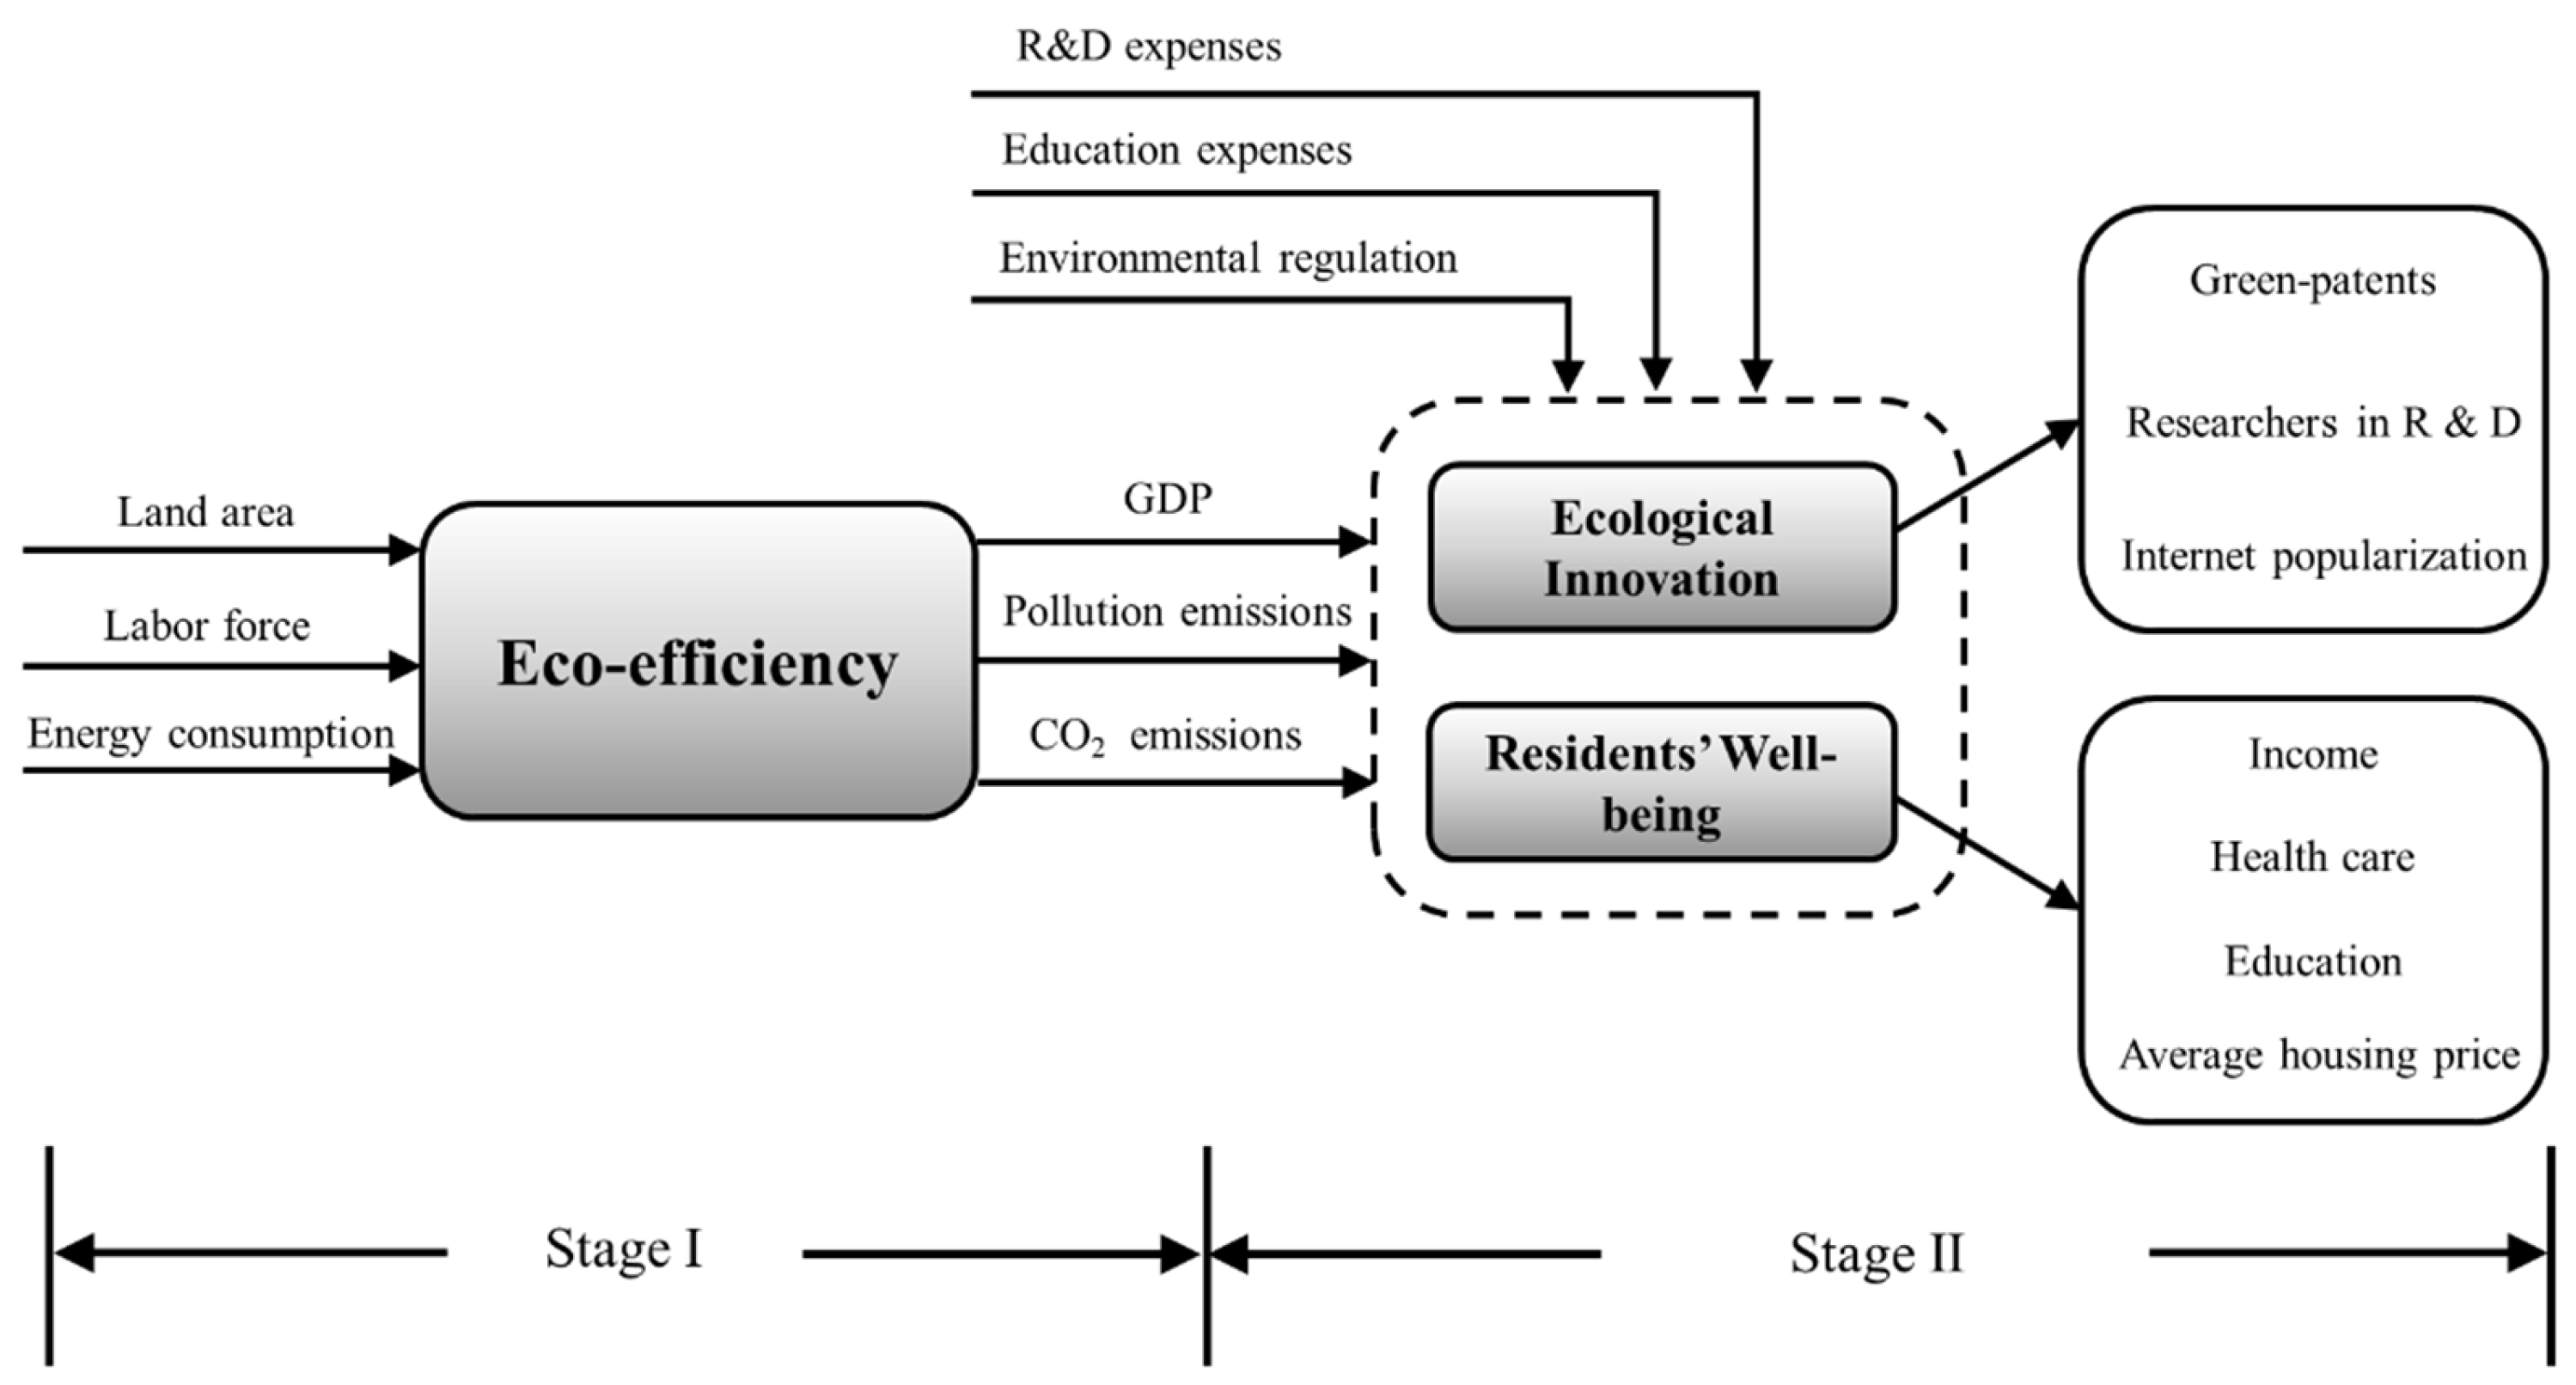
2.1. Two-Stage Network Super-SBM Model

DEA is used to evaluate the efficiency of decision-making units (DMUs). The traditional DEA model is considered a “black box” system in which the inputs are all converted into outputs, a simple process that may not produce reliable results. The research subjects EE, EI, and RW constitute a complex system with significant multi-stage characteristics and complex input–output relationships. In this case, the traditional DEA model needs to be extended. Therefore, the two-stage network DEA model makes the “black box” transparent. The output of the first stage is considered an intermediate input along with other external inputs, and they are all input into the second stage, resulting in the final output. Finally, we can obtain the efficiency rates of each stage. This model is more consistent with the actual situation of our research. In terms of computational methods, certain scholars have enhanced the traditional DEA model by introducing the super-efficiency DEA model. This model addresses the challenge of dealing with an excessive number of DMUs with efficiency values of 1, yielding favorable outcomes. It offers improved capabilities for ranking the efficiency of DMUs [28]. Furthermore, other scholars have introduced the slacks-based measure (SBM) DEA model. In essence, the SBM model addresses the issue of “slack deviation”, thereby aiding in the determination of whether inefficient DMUs possess an excess or deficiency of inputs [29]. Finally, the super-SBM model integrates the strengths of the aforementioned two approaches. It not only addresses the impact of “slack deviation” but also enables a more refined distinction and ranking of DMU efficiency values [30]. Hence, we present the two-stage super-SBM model considering undesirable outputs and extra inputs based on the SBM-DEA framework [31]. The first stage aims to estimate EE which involves the following aspects:
Assuming that there were n DMUs, each DMU was composed of the following factors: m represents the inputs (x) in the first stage, e represents the second stage inputs (t), d1 represents the desirable outputs (y), and d2 represents the undesirable outputs (z), therefore, the matrices X, T, Y, and Z are as follows:
X = x 1 , x 2 , x n R m × n > 0 T = t 1 , t 2 , t n R e × n > 0 Y = y 1 , y 2 , y n R d 1 × n > 0 Z = z 1 , z 2 , z n R d 2 × n > 0
The equations of the EE of DMUk can be defined as follows:
E 1 = m i n 1 + 1 m i = 1 m s i + x i k 1 1 d 1 + d 2 p = 1 d 1 s p d y p k + q = 1 d 2 s q u d z q k ,   k = 1 ,   ,   n
s . t   j = 1 , j k n x i j λ j s i + x i k j = 1 , j k n y p j λ j s p d y i k j = 1 , j k n z q j λ j s q u d z i k 1 1 d 1 + d 2 p = 1 d 1 s p d y p k + q = 1 d 2 s q u d z q k > 0 λ j , s i + , s p d , s q u d 0     i = 1,2 ,   m ; j = 1,2 ,   n ; p = 1,2 ,   d 1 ; q = 1,2 ,   d 2
where E 1 means the ecological efficiency of each DMU, vector sd refers to the shortage of desirable outputs, and vectors s+ and sud correspond to the excesses of inputs in the first stage and the undesirable outputs, respectively. If E 1 ≥ 1 and sd = s+ = sud = 0, the resource-based city under evaluation is efficient. If E 1 < 1, the city is inefficient, and the inputs and outputs efficiency need to be improved.
The goal of the second stage is to estimate the EI efficiency and RW efficiency. As mentioned earlier, part of the inputs of the second stage is the output of the first stage [32]. The equations are as follows (let d 1 + d 2 = d s ):
E 2 i = m i n 1 + 1 d s + e ( i = 1 d s + e s i + y i k + r = 1 e s r y r k ) 1 1 θ + ϵ ( p = 1 θ s p d y p k + q = 1 ϵ s q u d z q k ) , i = 1,2
s . t   j = 1 , j k n t r j λ j s r t i k j = 1 , j k n y i j λ j s i + y i k j = 1 , j k n z p j λ j s p d z i k λ j , s r , s p + , s q d 0     r = 1,2 ,   e ; i = 1,2 ,   m ; j = 1,2 ,   n ; p = 1,2 , θ + ϵ  
where E 2 i means the EI efficiency or RW efficiency of each DMU, vector s refers to the excesses of inputs in the second stage, and θ and ϵ denote the number of desirable outputs and undesirable outputs in the second stage, respectively. If E 1 ≥ 1 and sd = s+ = sud = 0. The lower the E 1 and E 2 i , the poorer the EE, EI, and RW performers of the resource-based city.
According to previous research [15,21], the efficiency evaluation of EE, EI, and RW in this paper was divided into two stages. The first stage was for EE, and the second stage was for EI and RW. Labor force, land, and energy were inputted in the first stage, and desirable outputs of GDP and undesirable outputs of pollution and CO2 emissions were obtained. In the two-stage network super-SBM model, the output of the first stage is part of the input of the second stage, which also includes external inputs such as research and development (R&D), education expenses and environmental regulation. Finally, we obtained three types of outputs representing EI, namely, high technology, green patents, and Internet popularization [33]. Four types of outputs represent RW, namely, disposable income, health care, education, and average housing price (undesirable output) [34]. The specific meaning of each indicator is explained below. The two-stage process is shown in Figure 1.
In addition, resource-based cities have four types of development in China: growth, maturity, recession, and regeneration. Table 1 shows the number and characteristics of each type of resource-based city in China. This classification is based on documents from the State Council of China, with the criteria for classification being the city’s resource development and reserves [9]. Cities with different development types have different development situations. It is important to highlight that our study focuses exclusively on 126 resource-based cities at the prefecture-level in China, excluding county-level and regional resource-based cities. This exclusion is due to these county-level and regional cities lagging significantly behind prefecture-level resource-based cities in terms of resource reserves, economic development, population size, and various other aspects. As a result, they do not offer substantial research value [24]. More specifically, we further refined our selection within the pool of 116 cities by excluding those with insufficient crucial data. This meticulous process has led us to a comprehensive dataset of 92 resource-based cities for our in-depth investigation. These sample 92 cities are spread across 24 provinces in China, effectively encompassing all provinces hosting resource-based urban centers, and thus enhancing the significance of our research endeavor. In summary, comparing 92 sample resource-based cities in a general way cannot reflect their real situation and present valuable conclusions. Therefore, we grouped the 92 sample resource-based cities according to the four development types (the results of the grouping are shown in Appendix A, Table A1) and compared the EE, EI efficiency, and RW efficiency among the four groups in the results section.

2.2. Improvement Path of Sustainable Development in Resource-Based Cities—fsQCA

The evolution of EE, EI, and RW within Chinese resource-based cities is shaped by a confluence of factors. However, conventional analytical approaches, like econometrics, tend to concentrate solely on the isolated impacts of individual variables within the study subjects. These methods fall short when confronted with research scenarios characterized by numerous influencing factors and intricate interrelationships, leading to unsatisfactory outcomes. The resource-based cities in this paper further reveal a diverse geographic distribution across various regions of China. Significantly divergent economic conditions, cultural attributes, and resource endowments are evident among these regions. This underscores the need to identify contextually suitable paths for enhancing efficiency at the local level. However, traditional analysis methods do not condense multiple improvement paths. Finally, for small- to medium-scale samples, it is difficult to obtain robust conclusions using traditional analysis methods. For these reasons, this paper adopted the fuzzy-set qualitative comparative analysis (fsQCA) method proposed by Charles [35] to analyze the factors influencing the EE, EI efficiency, and RW efficiency of resource-based cities in China, including the effects of synergy and interaction among the per capita GDP, industrial structure, city size, tech innovation, city type, and export dependence. To find the paths to improve the EE, EI, and RW and achieve sustainable development of resource-based cities.
The reasons for choosing the fsQCA method are as follows. Firstly, compared to traditional methods, the QCA method considers the case as a whole composed of cause conditions, and thus focuses on the complex causal relationships between the condition configurations and the outcomes [36]. Secondly, the influencing factors of EE, EI, and RW are largely related to each other, which is a typical complex adaptive system [21]. QCA provides new ideas and methods to research complex causal relationships, such as asymmetry, concurrent causality, and equivalence based on the configuration analysis and qualitative comparative analysis [37]. Then, in terms of research samples, the QCA method is more flexible. The QCA method operates on Boolean operations, with the robustness of analysis outcomes primarily hinging on the inclusiveness of representative individuals within the sample. Rather than relying solely on sample size, the efficacy of the QCA method is determined by the presence of pertinent individuals. As such, the QCA method demonstrates promising utility even with small-sample data scenarios [38,39]. Finally, QCA focuses on continuous changes in conditions in terms of degree or level. The antecedent condition variables employed in this study are exclusively continuous. Consequently, the dual advantage of QCA in both qualitative and quantitative analysis becomes evident. Moreover, the data in this study prove to be particularly suitable for research employing the fsQCA method, which adeptly addresses the affiliation issues presented by fuzzy sets.
The research framework of this study is shown in Figure 2.

2.3. Research Data

The variables in this study (administrative district land area, number of people in the labor force in primary, secondary, and tertiary industries, GDP, per capita GDP, research and development (R&D) expenses, education expenses, number of R&D researchers, average employee income, industrial structure (percentage of tertiary industry in GDP), and export dependence (percentage of export value in GDP) [40]) were obtained from the statistical yearbooks published by the national statistical bureaus. In particular, considering that not every city has higher education institutions, the indicator of education is calculated according to the number of students attending primary and middle schools in the statistical yearbook [41]. The indicator of health care is calculated according to the number of hospitals and health centers in each city [42]. City size is expressed by the year-end population of the city [40]. Energy consumption data were obtained from the energy statistical yearbook. CO2 emissions were obtained from the China environmental statistical yearbook, and the pollution index and environmental regulation index were calculated based on the data contained in this yearbook. Among them, the pollution index refers to the study of Yu et al. [43], using industrial wastewater emissions, industrial sulfur dioxide emissions, and industrial soot emissions to construct the pollution emission index (PO), which is calculated as shown in Equations (5) and (6).
P R i 1 = P i j i = 1 n P i j n
P O i = P R i 1 + P R i 2 + P R i 3 3
where Pij is the emission of pollutant j in the city i, PRij is a dimensionless value indicating the relative emission level of pollutant j in the city i, and n is the number of cities in our study.
The environmental regulation index (ERI) was borrowed from the treatment of Shen et al. [44], and thus, was constructed using the two single indicators of the sulfur dioxide removal rate and the industrial soot removal rate. The specific calculation process is shown in Equations (7)–(9).
P e _ i j = P e i j m i n P e j m a x P e j m i n P e j
A I i j = P e i j i = 1 n P e i j / G D P i i = 1 n G D P i
E R I i = j = 1 2 A I i j P e i j 2
Since there are certain magnitude differences in the removal of sulfur dioxide and industrial soot, we first standardized the raw data using Equation (7), where, Pe_ij denotes the standardized value of the class j indicator in the city i, Pe_ij denotes the original value of the class j indicator in city i, max(Pej) and min(Pej) denote the maximum and minimum values of the class j indicator in all cities, respectively. Next, the adjustment index AIij of the two individual indicators, which reflects the difference in environmental regulation intensity in each city, was calculated as shown in Equation (8), where AIij is the ratio of the share of the removal rate of pollutant category j in the city i to the removal rate of pollutant category j in all cities to the share of GDP of the city i to the GDP of all cities. Finally, combining Equations (7) and (8), we calculated the ERI of each resource-based city, as shown in Equation (9).
In addition, the average house price for each resource-based city was obtained from the real estate statistical yearbook. The original data on the number of green patent applications and the number of Internet users per 100 people were obtained from the science and technology statistical yearbooks, and the science and technology innovation scores used the results of the Peking University Open Research Data [45]. The classification of resource-based city types was obtained from documents issued by the State Council of China. Descriptive interpretations of the research data are shown in Table 2.

3. Results

3.1. Efficiency of 92 Sample Resource-Based Cities Calculated by Two-Stage Super-SBM Method

The sustainable development planning of resource-based cities in China took place from 2013 to 2019. In order to achieve a balanced distribution of the years and to meticulously observe the evolving trajectories of the EE, EI, and RW in these cities, we opted for the years 2013, 2016, and 2019 as the focal points for our study. The EE, EI, and RW of 92 sample resource-based cities in 2013, 2016, and 2019 were calculated based on the two-stage super-SBM method. The calculation results are shown in Appendix A, Table A2, Table A3 and Table A4. Next, the changes in the EE, EI, and RW for the years 2013, 2016, and 2019 are shown on the map (where 2013 is the start year of the planning policy, 2019 is the completion year, and 2016 is the intermediate year selected for this study), and the results are shown in Figure 3, Figure 4, Figure 5, Figure 6, Figure 7 and Figure 8.

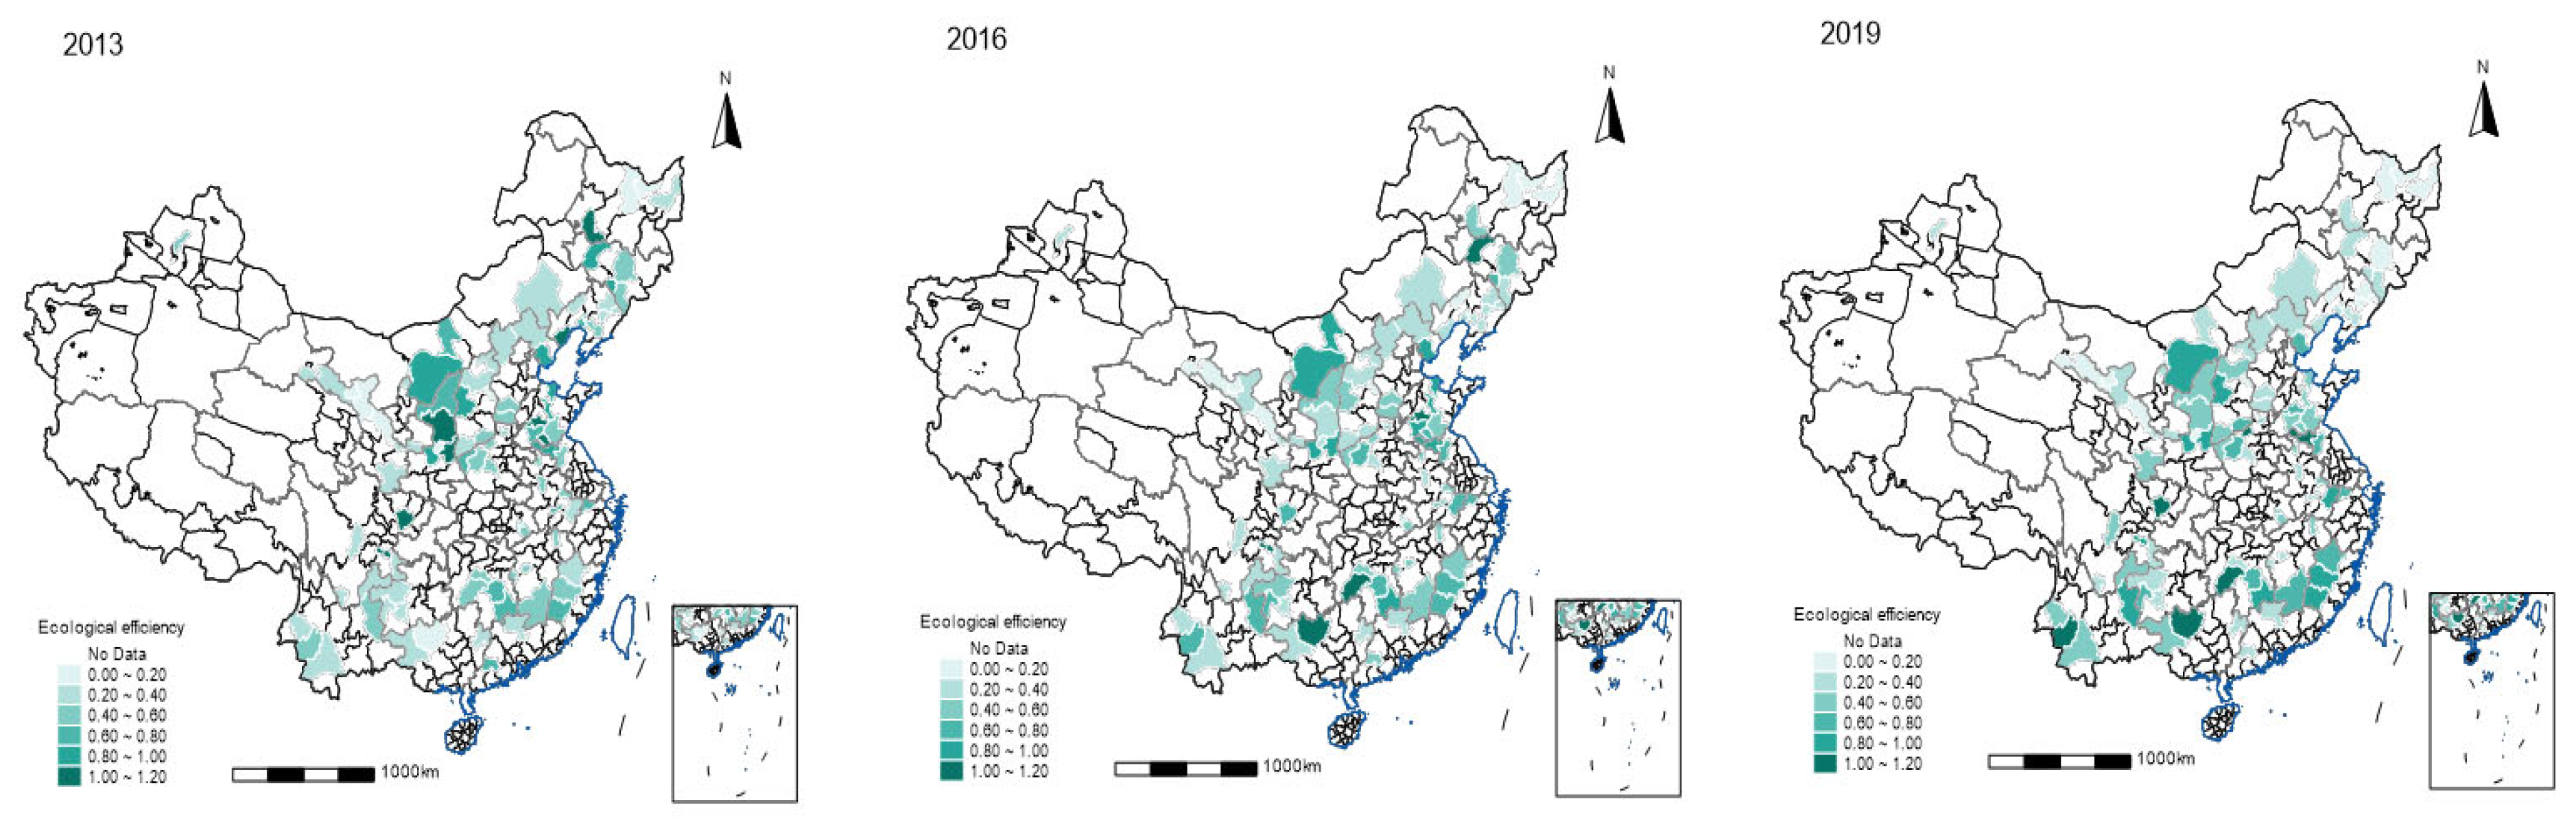
3.1.1. Spatiotemporal Evolution of EE and Group Comparison Results

A comparison of the EE of 92 sample resource-based cities for the three years 2013, 2016, and 2019, Figure 3, shows a general upward trend during the planning and construction policy time of 92 sample resource-based cities. This trend is especially obvious in resource-based cities in southern China, which is due to the fact that resource-based cities in southern China, especially those in southeast China, have sufficient capital and better business environment to carry out industrial transformation and increase the proportion of high-tech tertiary industries in order to escape the “resource curse” of development [46]. The EE of resource-based cities in the northwest region did not significantly improve during 2013–2019, and was at a low level. It is noteworthy that the EE of some resource-based cities in the eastern and northeastern regions shows an “upward decreasing” trend. It is not difficult to explain that the industries in resource-based cities in eastern and northeastern China have been dominated by heavy industries for many years in the past, and heavy industries are also highly polluting industries. Despite the relocation of certain heavily polluting factories from these cities in recent times, the overall impact of this measure remains marginal. The uncontrolled exploitation and extraction of resources, together with the loss of talents and capital, lead to difficulties in carrying out their industrial transformation and upgrading, and the urban ecology is more fragile.
Figure 4 shows the performance of the EE of 92 sample resource-based cities of four development types in the years 2013, 2016, and 2019. Among them, the EE of growth resource-based cities shows an upward trend from 2013 to 2019, but the low values still occupy a large proportion. These cities are in the early stage of resource development and have better ecological conditions, and with the support of national policies, they have brilliant development prospects. The largest number of cities are maturity resource-based cities, and the EE of these cities also had an upward trend during 2013–2019. Low values of EE are common in these cities; cities with high values of EE are in the early and middle stages of the maturity period, and the sustainable development strength of cities is located near the peak. Cities with low values of EE have mostly experienced the peak of the maturity period and have started to develop towards the recession type. The EE of resource-based cities experiencing economic recession exhibits a clear and consistent decline. Despite these cities’ prolonged efforts toward industrial transformation and advancement, the findings of this study suggest that they have yet to make substantial headway in enhancing their EE development. In addition, the development potential of regeneration resource-based cities is insufficient, which can be attributed to the deep-rooted traditional development model and the failure of industrial transformation and upgrading. Therefore, the re-planning of recession and regeneration resource-based cities is a key issue for the Chinese government to consider today.

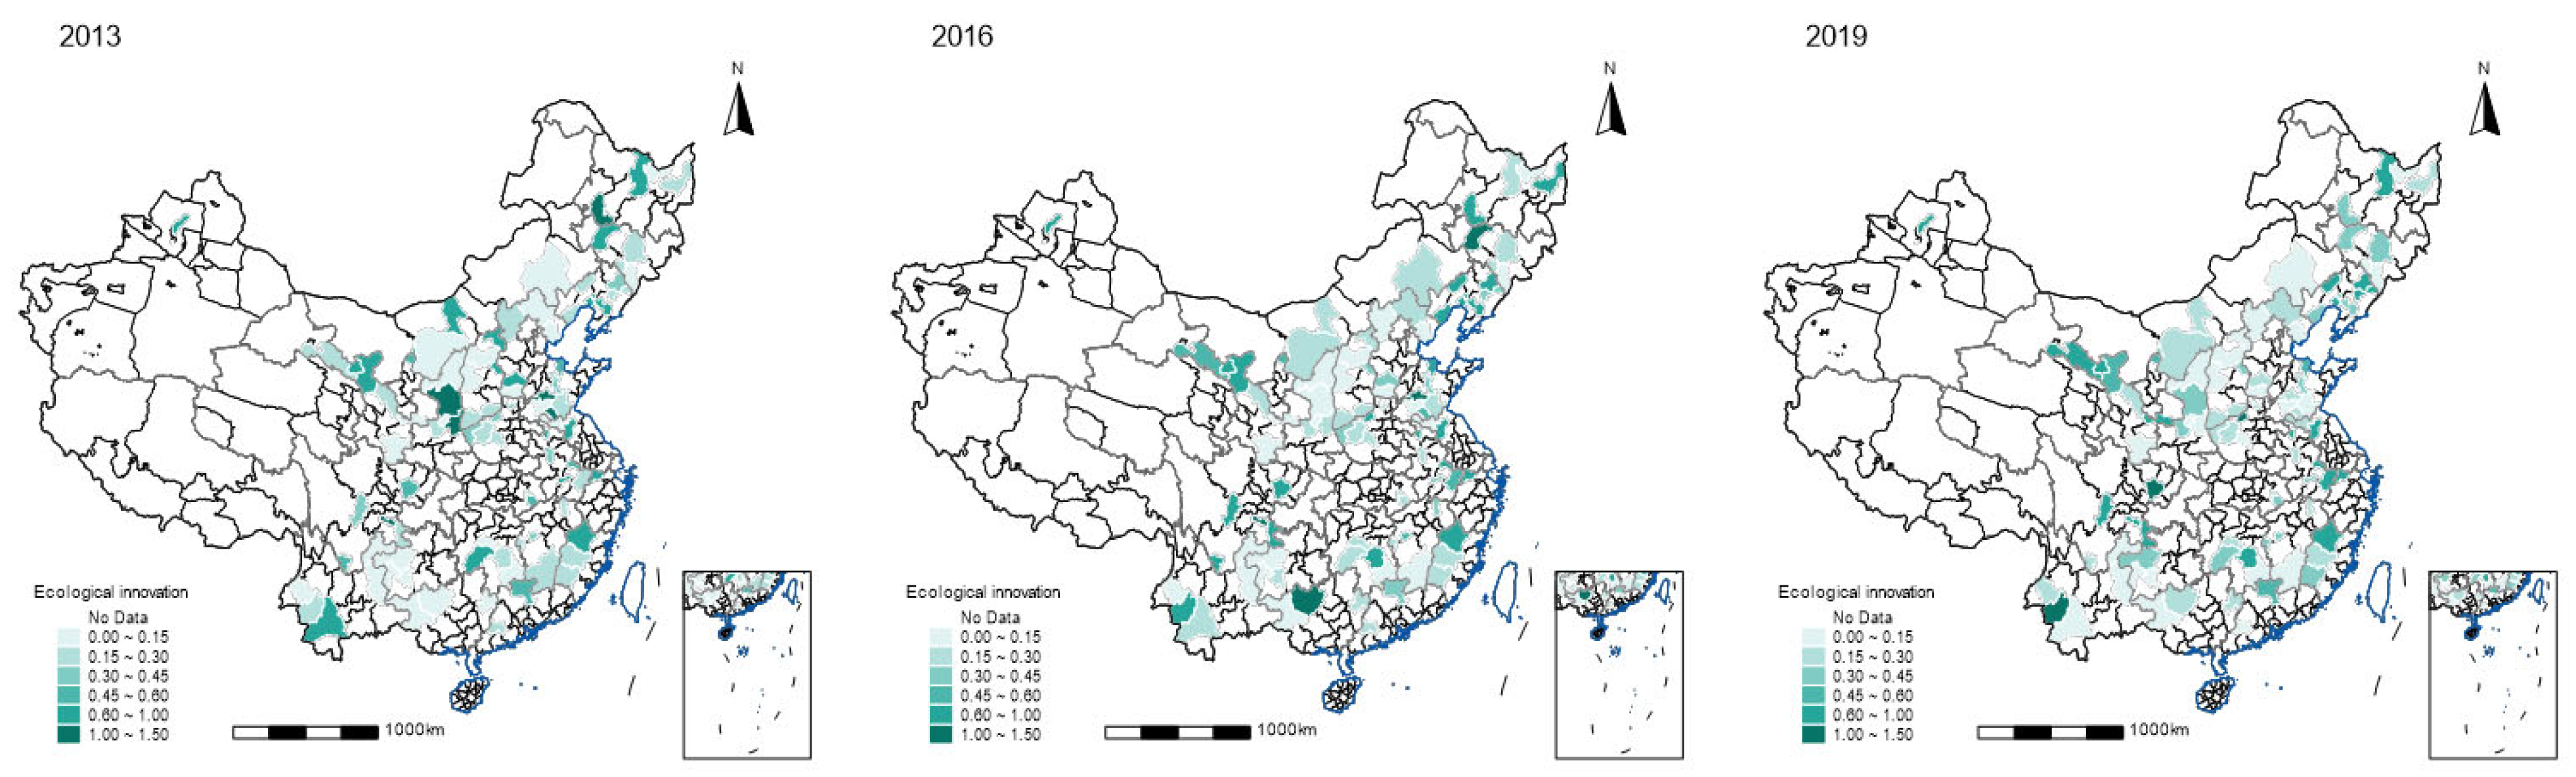
3.1.2. Spatiotemporal Evolution of EI and Group Comparison Results

The level of EI efficiency is generally low in the 92 sample resource-based cities studied in this study. In Figure 5, the EI efficiency shows an overall declining trend in the comparison of 2013, 2016, and 2019, even for resource-based cities located in southern China with better economic development levels and innovation conditions, yet there is still a steady increase in EI efficiency in northwest China, which is rare in the context of an overall decline in EI efficiency. Innovation is a key factor for a city’s sustainable development. A worse innovation capacity will make the endogenous impetus for the transformation and development of resource-based cities in China insufficient, generating a chain reaction that inhibits the improvement of the EE and RW levels. Therefore, cities with low EE efficiency need to accelerate transformation, and there is still much room for their development.
As can be seen in Figure 6, the EI development progress of the growth resource-based cities is not obvious and varies widely from city to city, which is related to the geographical location conditions of cities and their development bases. This implies that resource-based cities situated within China’s scientific and technological hubs and economic centers, boasting mature industrial development and abundant resources, are poised to enjoy more favorable conditions for the development of EI. The EI efficiency of maturity resource-based cities showed an upward trend from 2013 to 2016, but declined from 2016 to 2019, which indicates that maturity resource-based cities entered a soft patch of EI development over time. Unlike EE, the EI efficiency of recession resource-based cities shows an upward trend, with an improvement in 2016 compared to 2013, but little change and more stability from 2016 to 2019. This trend is not so satisfactory in general. Finally, the EI of regeneration resource-based cities did not change much and was stable at low values, which is a bad sign. Regeneration is the last stage of resource-based cities, but the lower EI efficiency is a growing concern.

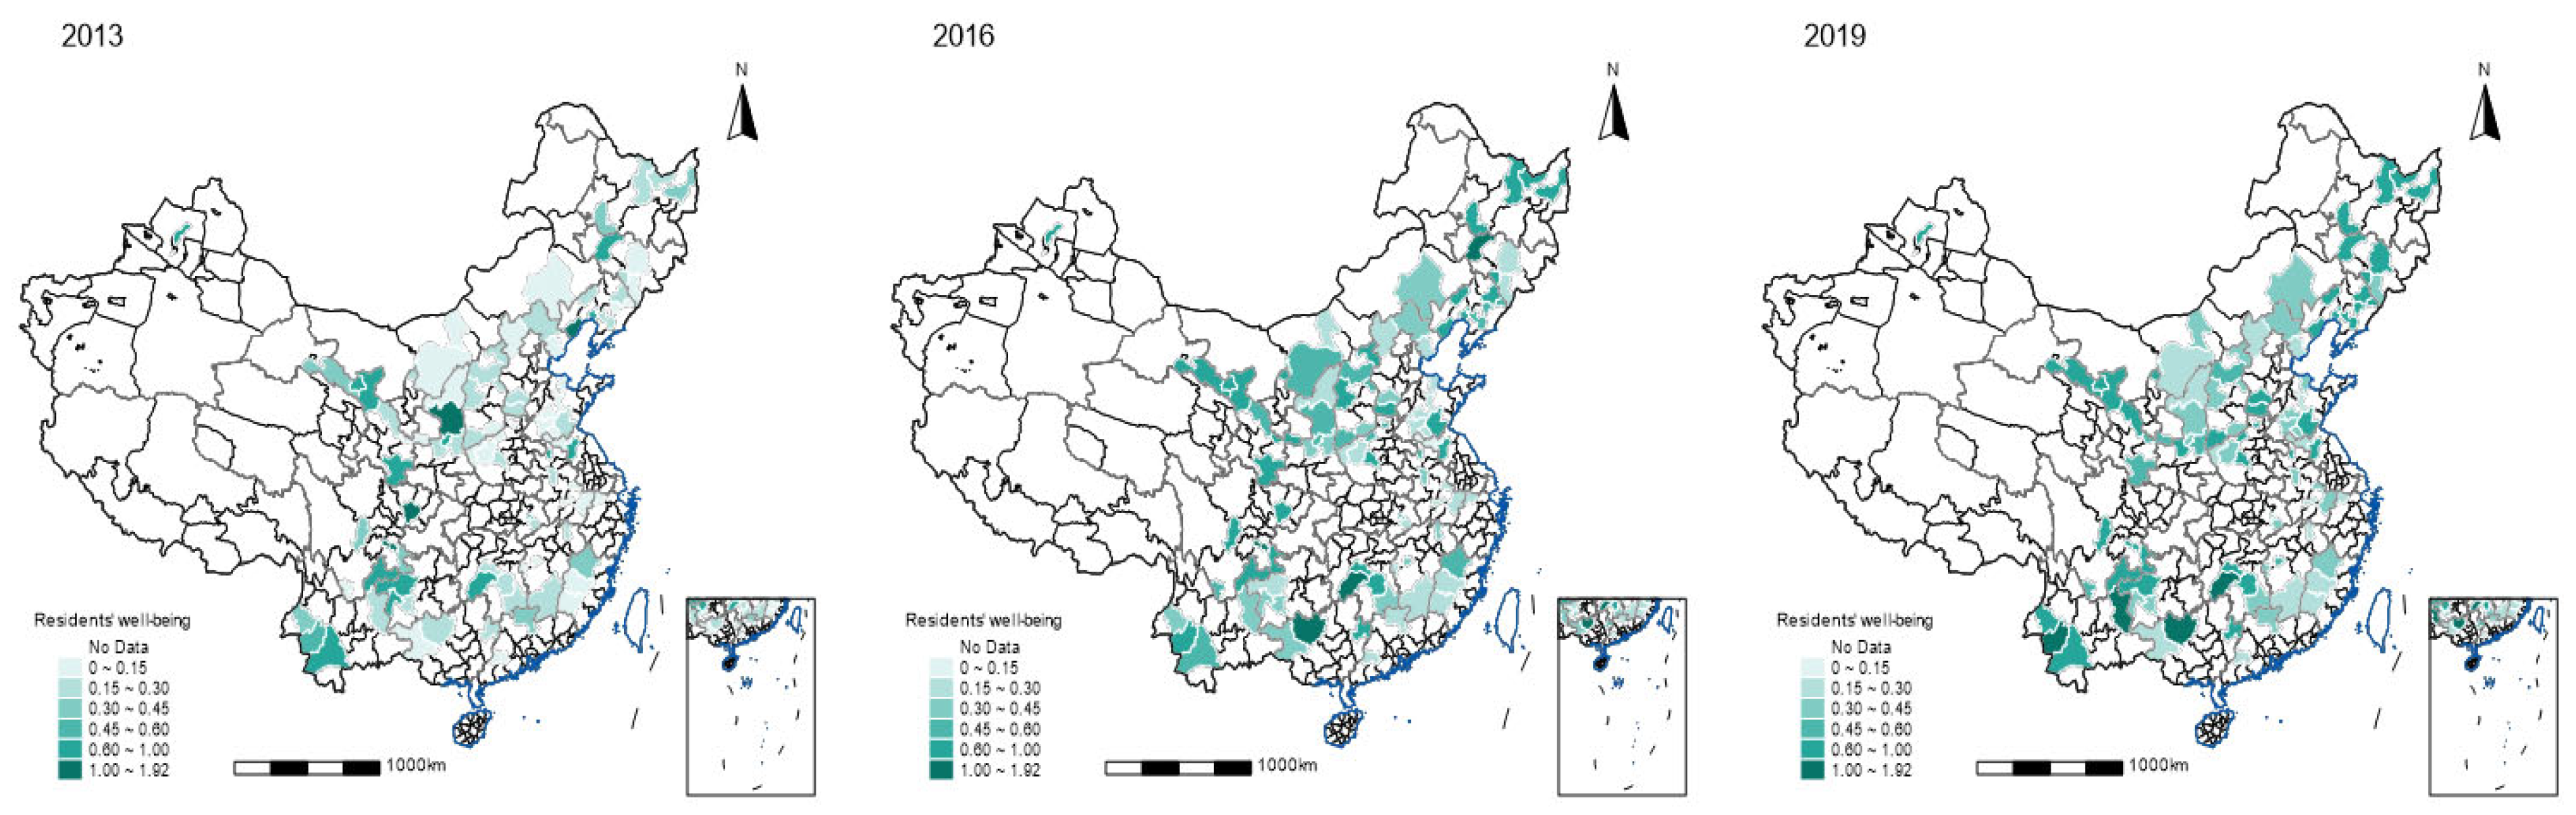
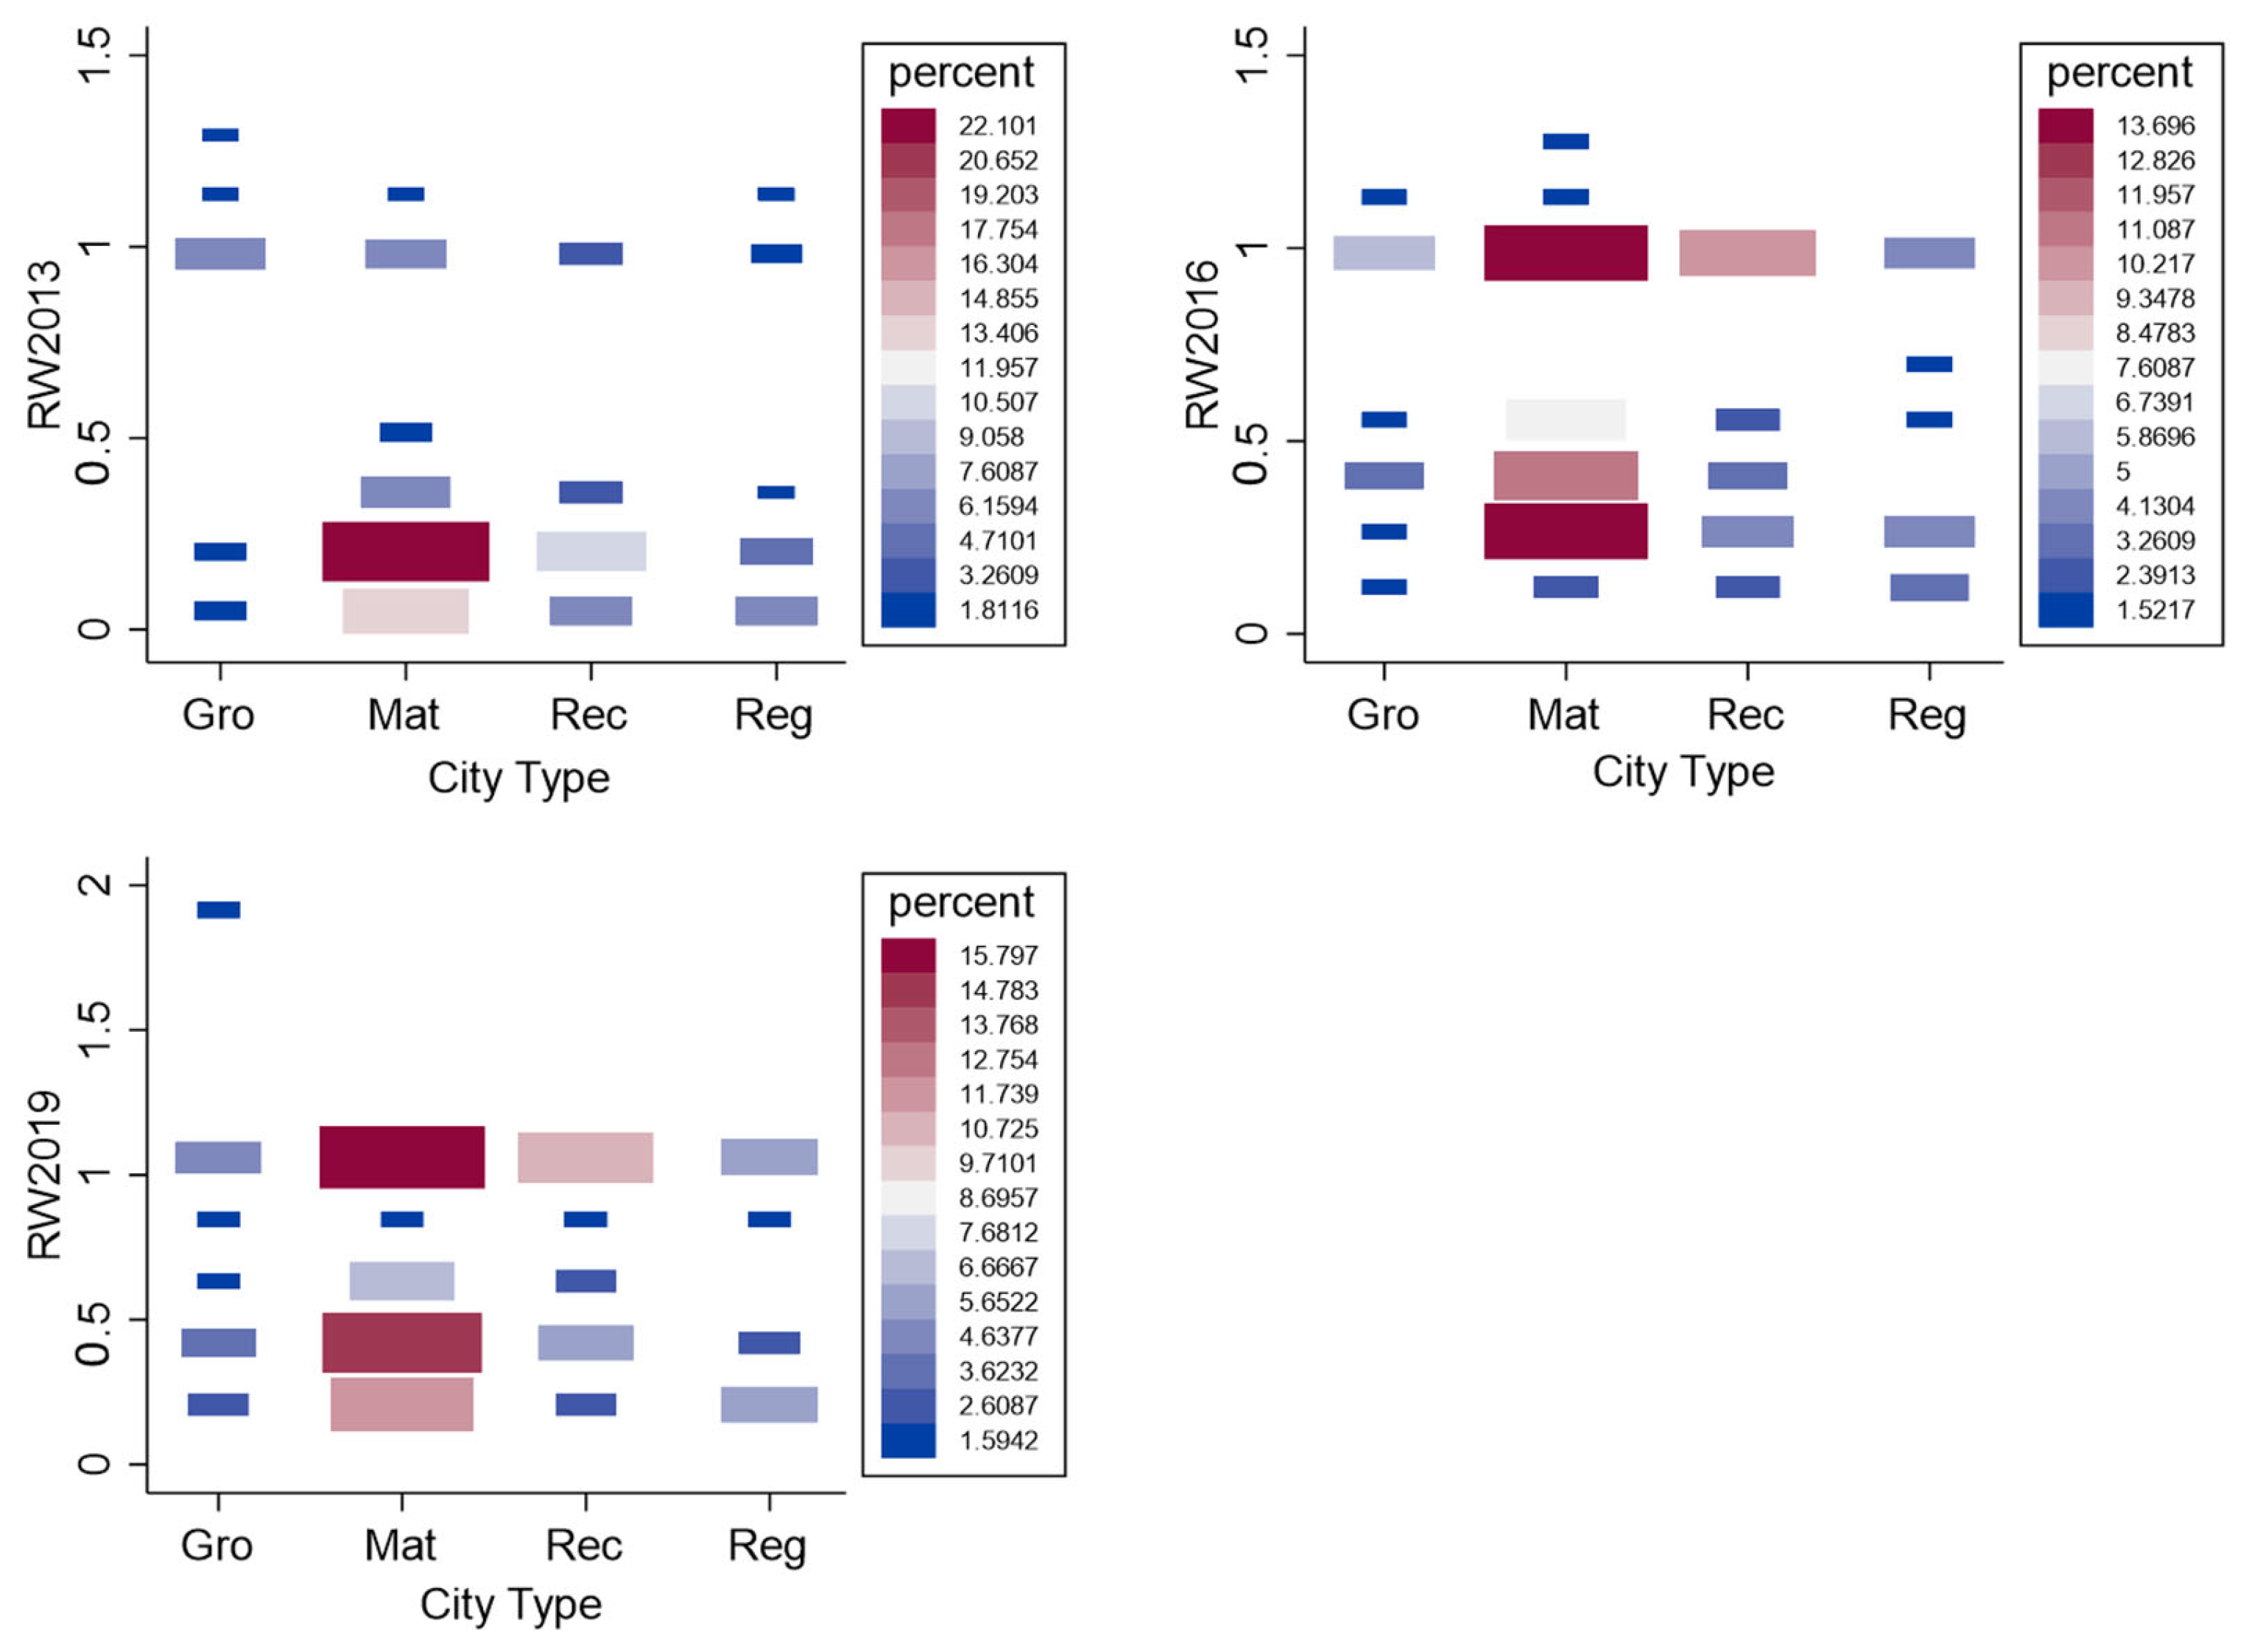
3.1.3. Spatiotemporal Evolution of RW and Group Comparison Results

In Figure 7, the RW efficiency of 92 sample resource-based cities shows a great increase between 2013 and 2016, and this increasing trend is more obvious especially in the resource-based cities in central, western, northeastern, and eastern China. In addition, resource-based cities in the northeast and west also show a growth trend in RW efficiency in 2019 compared to 2016, indicating that the growth trend of RW in cities in these regions has not stopped and is continuing to develop in a good direction. Overall, the RW has improved substantially over the policy time of resource-based cities’ sustainable development plans. Compared to the development of EE and EI, RW is performing better. However, some of the 92 sample resource-based cities located in the central and eastern of China experienced a decline in RW efficiency in 2019 compared to 2016, a worrying trend that is inconsistent with the goals of sustainable development. Thus, the local governments of these cities still need to strengthen their efforts to maintain the progress they have made and further improve RW.
The issue of RW in resource-based cities should not be neglected as well. Figure 8 shows that in 2013 and 2016, a large gap in the efficiency of each type of RW in 92 sample resource-based cities. There was great improvement in 2016 compared to 2013, and the improvement in maturity and recession resource-based cities is particularly obvious. For the cities, the improvement in RW also brings confidence to them. In other words, the downturn in the development of EE and EI is transient, and in the long run, there is hope for development as long as it can attract talent and retain the population rationally [47]. In 2019, however, the efficiency of RW in resource-based cities at all stages of development did not improve significantly compared to 2016. RW efficiency became more stable in general, and city-to-city differences also narrowed considerably, showing a better trend.

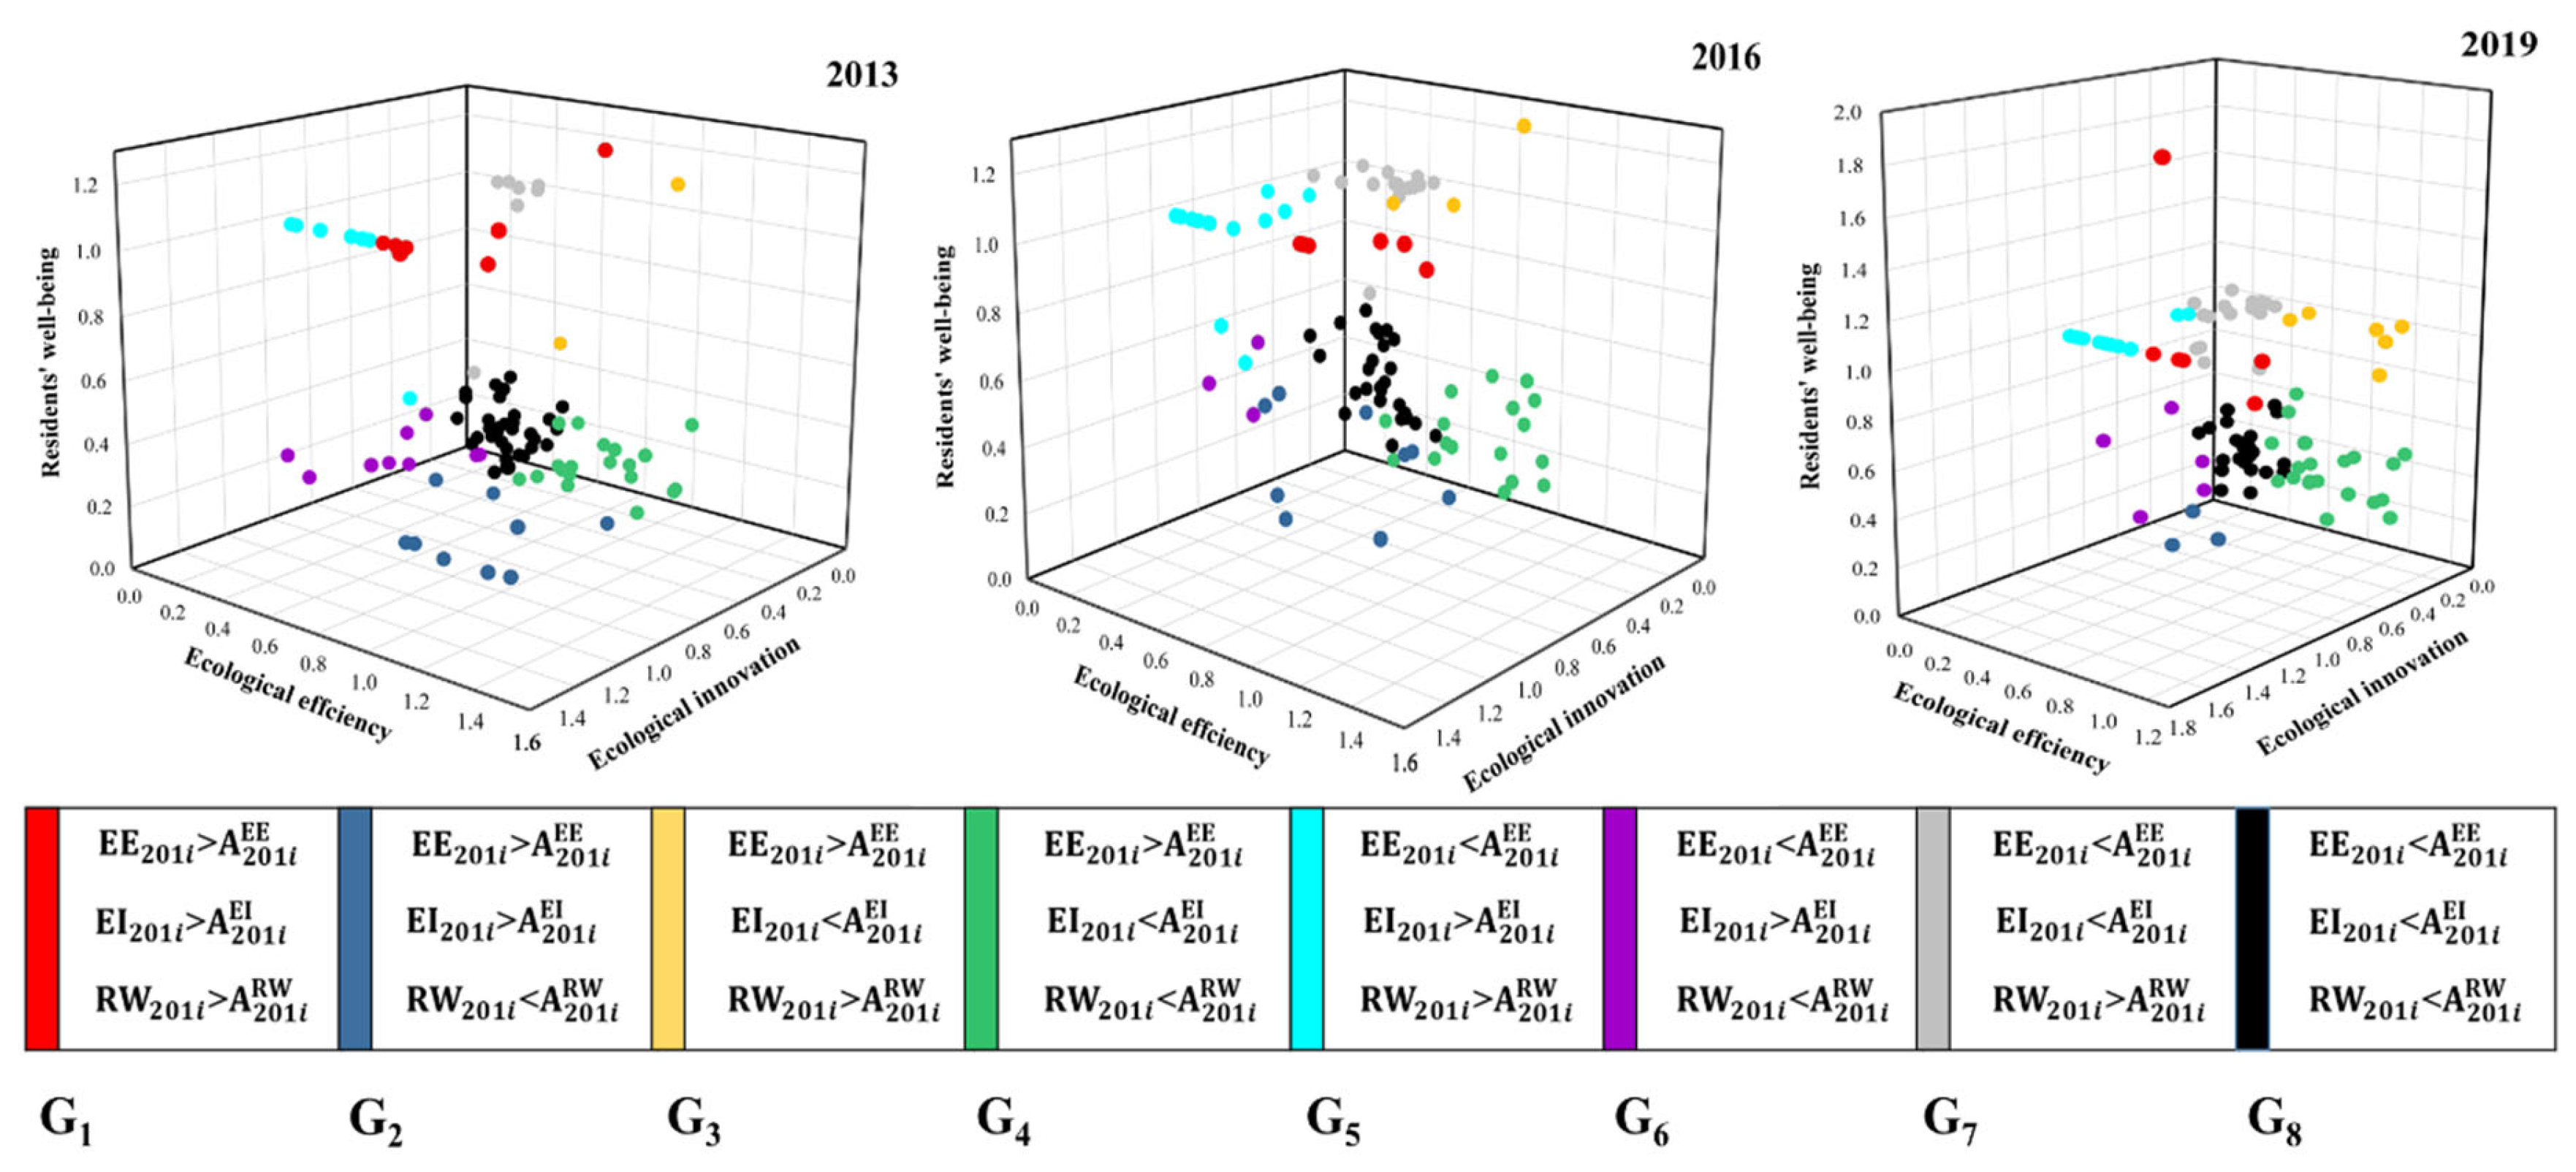
3.2. Overall Analysis of the EE, EI and RW

After analyzing the results for EE, EI, and RW in 92 sample resource-based cities, this part compares the performers and differences in the EE, EI efficiency, and RW efficiency of these 92 cities. Figure 9 demonstrates the relationship of EE, EI, and RW with the average efficiency value among different cities in different years.
As shown in Figure 9, the 92 sample resource-based cities were categorized into eight groups based on the average values of EE, EI efficiency, and RW efficiency in 2013, 2016 and 2019 (A indicates the average value): those with values higher than the average value for all indicators (G1), those with values higher than the average value for two indicators (G2, G3, and G5), those with values lower than the average value for one indicator (G4, G6, and G7), and those with values lower than the average value for all indicators (G8). The results in Figure 9 indicate that the number of cities with greater than or equal to two indicators shows a trend of increasing and then decreasing over the three stages (28.3%, 34.8%, and 31.5% of all cities, respectively), and the proportion of cities with less than or equal to two indicators has been large over the three years, indicating that most resource-based cities in China are underperforming in EE, EI, and RW; thus, it is urgent to achieve high-quality and sustainable development. Furthermore, there are only three cities in G1 (Nanchong, Zigong, and Suqian) that have values higher than the global average value for all three indicators and three phases. These three cities are considered pioneering countries in promoting their EE, EI, and RW performance. On the contrary, there are five cities, Chifeng, Tonghua, Yizhou, Pingxiang, Zhangjiakou, and Chengde, in G8, which have values higher than the average value for all three indicators and three phases. These cities should focus on finding the right development path to change the status quo. In addition to the cities that did well and the worst, we also found Xuancheng and Hechi, the two cities that made the most progress in the three indicators among the 92 sample cities, and their successful experiences and development paths are worthy of reference for those resource-based cities in trouble. The three cities of Baotou, Yan’an, and Daqing, on the other hand, have experienced a significant decline in the values of the three indicators over the past few years, and this phenomenon deserves sufficient attention from the local governments to change their development mindset and get out of the development dilemma.

3.3. fsQCA Method: Exploration of Sustainable Development Path

We only conducted fsQCA on the data in 2019. The reason is that the years 2013 and 2016 were respectively in the early and middle stages of sustainable development planning for resource-based cities. However, they might not fully represent the entire developmental phase. Therefore, conducting research on these two years lacks practical significance. In contrast, 2019 was the closing year of sustainable development planning. The data of 2019 integrate the development contents of many years and better reflect the actual situation of 92 sample resource-based cities in the recent period. The results are timelier.

3.3.1. Calibration

Due to the large variation in magnitudes, we first standardized the data using the max–min method, followed by calibration [48]. Calibration is the process of assigning a set affiliation score to a case. The affiliation of the calibrated set ranges from 0 to 1. The closer to 1, the higher the degree of affiliation is indicated. For example, the uncalibrated condition “Tech innovation” can only compare the technology innovation scores among 92 sample resource-based cities numerically but cannot determine whether they are high-tech or non-tech innovation cities. However, the calibrated “Tech innovation” can compare the technology innovation among 92 sample resource-based cities, meaning that the calibrated data can compare the extent to which different cities are “high-tech innovation”. To calibrate the variables, three anchors are essential: fully affiliated, intersections, and fully unaffiliated [49]. According to Ragin [39], we used a direct calibration method with three outcome variables, including EE, EI efficiency, and RW efficiency, and six antecedent conditions were calibrated, including the per capita GDP, industrial structure, city size, tech innovation, city type, and export dependence. Referring to existing studies [50], the three calibration anchors, completely affiliated, intersections, and completely unaffiliated, were determined by the upper quartile, median, and lower quartile of the probability density function of each variable in the sample range. The calibration anchors for each outcome variable and antecedent condition are listed in Table 3.

3.3.2. Analysis of Necessary Conditions

Table 4 shows the results of the necessity condition test performed with the help of fsQCA 4.0 software. The consistency values of all conditions for all items were less than 0.9, and thus, did not constitute a necessity condition [51]. The results indicate the complexity of the paths to achieve sustainable development in the three aspects of EE, EI, and RW in resource-based cities, so further configuration analysis of each condition is needed. In addition, we also analyzed the necessary conditions for the non-efficient results. The results show that the consistency of all conditions was less than 0.9, indicating that there were no necessary conditions for the non-efficient results, which are not listed here due to the limitation of space.

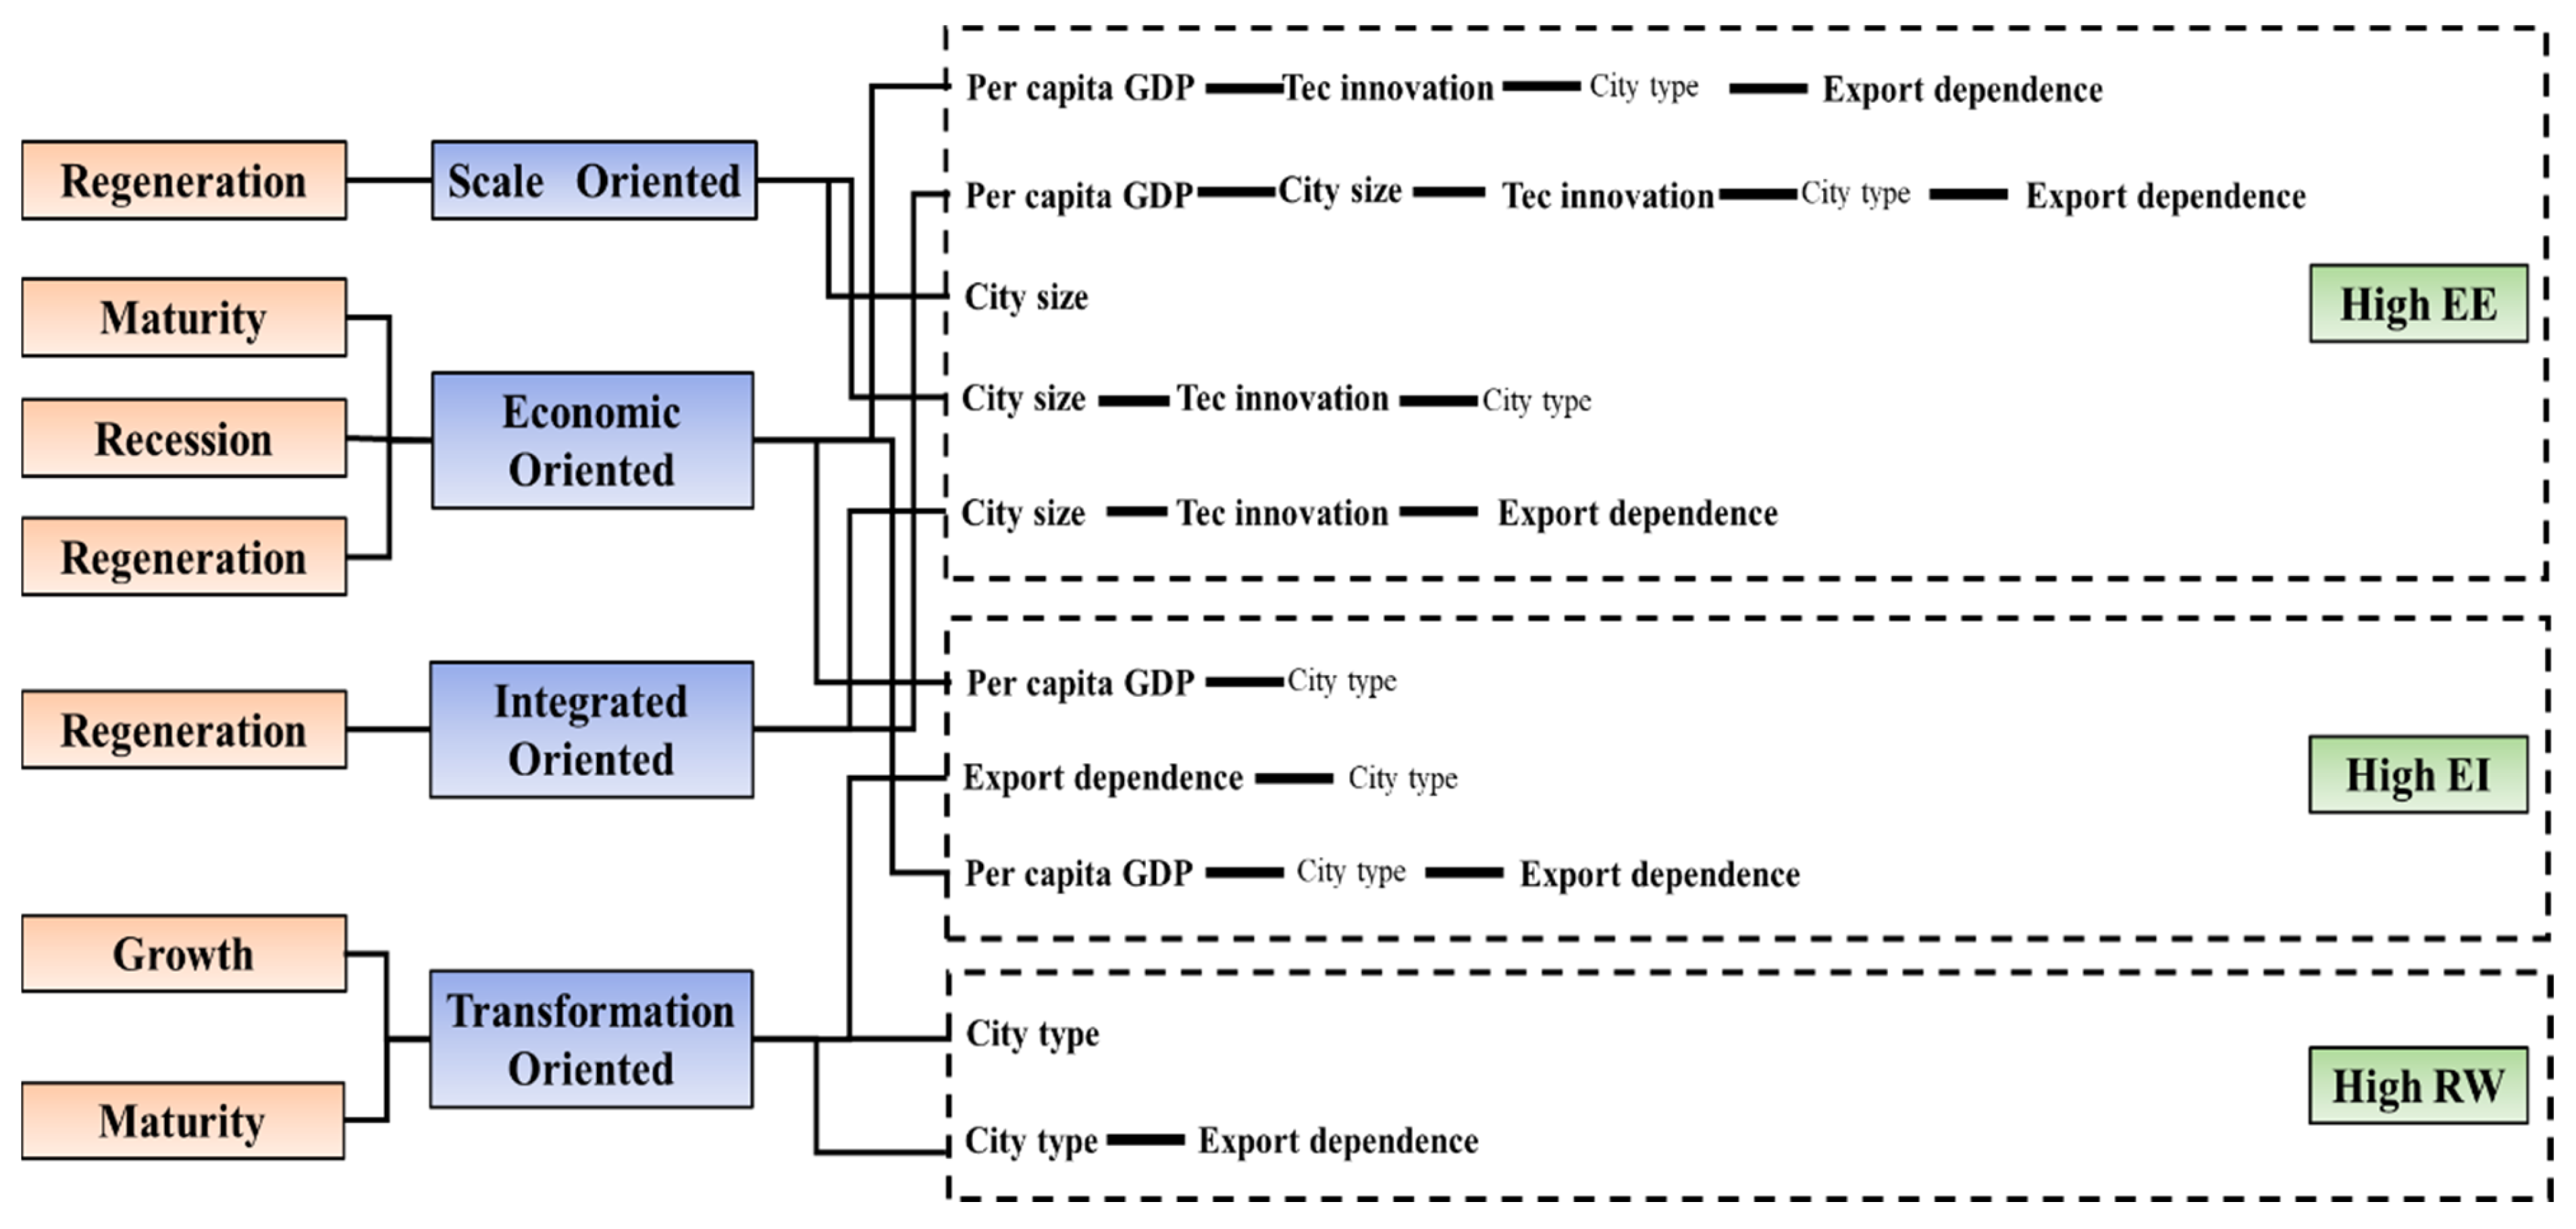
3.3.3. Configuration Analysis

Referring to the studies of Duan et al. [51] and Roig-Tierno et al. [52], in this study, the original consistency threshold was set to 0.8, the PRI consistency threshold was set to 0.75, and the case frequency was set to 1. The interpretation of the results is that the condition that appears in both the parsimonious solution and the intermediate solution is the core condition, and the condition that appears only in the intermediate solution is the edge condition. The presence of a certain indicator in the grouping as a core condition indicates that with the improvement of that indicator, it carries out the improvement of the corresponding EE, EI, or RW level of the resource-based city, i.e., it promotes the sustainable development of the city.
As shown in Table 5, the configurations that achieved high EE were “Per capita GDP–Tech innovation–City type–Export dependence” (the representative cities are Shizuishan, Hebi, and Handan), “Per capita GDP–City size–Tech innovation–City type–Export dependence” (the representative cities are Lvliang, Handan, Dongying, Shizuishan, Hebi, and Yulin), “City size” (the representative cities are Yunfu and Songyuan), “City size–Tech innovation–City type” (the representative cities are Zigong, Luoyang, and Longyan), “City size–Tech innovation–Export dependence” (the representative city is Tonghua), i.e., there are five paths to achieving high EE in resource-based cities, and in particular, city size, tech innovation, and export dependence are the three main factors contributing to high EE. The policy implication for the government is that to improve the EE of resource-based cities, local governments would do better to attract an inflow of population, vigorously develop the level of technology innovation, develop the city’s special industries, and enhance the export competitiveness. The configurations that achieved high EI efficiency were “Per capita GDP–City type” (the representative cities are Huangshi, Wuhai, and Loudi), “City type–Export dependence” (the representative cities are Jincheng, Loudi, and Chenzhou), and “Per capita GDP–City type–Export dependence” (the representative city is Loudi), i.e., there are three paths to achieving high EI efficiency in resource-based cities. In particular, city type, per capita GDP, and export dependence are the three main factors that lead to high EI efficiency. The policy implication for local governments is that to improve the EI efficiency of resource-based cities, it is necessary to vigorously transform and upgrade urban industries, develop special industries to enhance the export competitiveness of cities, increase the total urban GDP, and increase the per capita GDP. Finally, there are two paths to achieving high RW efficiency in resource-based cities, namely “City type” (the representative cities are Shuangyashan, Chifeng, Jincheng, Huzhou, and Chenzhou) and “City type–Export dependence” (the representative cities are Jincheng, Loudi, and Chenzhou). The antecedent conditions of city type and export dependence are the two main factors for the high RW efficiency. The policy implications for local governments lie in recognizing that the efficiency of RW endeavors within resource-based cities is intricately tied to their developmental trajectory. Local governments should meticulously chart the course of development, facilitate the evolution of urban industries, and embark on capacity renewal. These actions will propel cities toward their subsequent stages of growth, subsequently leading to an elevation in RW levels.
From the 10 high-efficiency configurations, it can be seen that the antecedent condition of the share of the tertiary sector output in GDP, industrial structure, is not a key factor for high EE, high EI efficiency, or high RW efficiency, and can even be ignored. It also indicates that the prosperity of the tertiary sector is not a precondition for the sustainable development of resource-based cities due to the fact that the tertiary sector in the traditional view includes high technology and low pollution, but the tertiary sector contains more industries in China. Although residential services, catering, medical, and other industries are also tertiary industries, the pollution they cause to the city cannot be ignored, which can largely damage the urban ecology, and thus, the RW. In addition, most of these industries have low technological content, so high-quality EI is difficult to achieve. The 92 sample resource-based cities researched in this paper are not the strongest cities in China (in fact, most of the 262 resource-based cities are), and their tertiary industries are low-level tertiary industries, making it difficult to essentially transform and upgrade industries and improve urban EE and RW, let alone achieve high EI that requires high-tech conditions. Moreover, “City type” and “Export dependence” are the key antecedents to achieving high EE, EI efficiency, and RW efficiency. The type of resource-based cities as a key antecedent indicates that the policy to promote the development and transformation of resource-based cities is correct in China. The leap in development type can promote the sustainable development of resource-based cities. Export dependence is a comprehensive index that shows the level of resource endowment, technology, and trade of a resource-based city, which means that resource-based cities can achieve a high level of sustainable development with the promotion of an export-oriented economy. The 10 development paths can be categorized into four orientations: scale-oriented, economic-oriented, integrated-oriented, and transformation-oriented, i.e., development types focusing on city population size, economic development, integrated development, and industrial transformation, respectively. As shown in Figure 10. The economic-oriented and transformation-oriented are the most common. Resource-based cities can use economic-oriented or scale-oriented paths to lay a good foundation for development when they are weak, and then move to transformation-oriented and integrated-oriented paths afterward, while stronger resource-based cities can directly choose development paths of these two orientations.
The case function of fsQCA4.0 was used to identify specific cities with high EE, high EI efficiency, and high RW efficiency, and then these cities were clustered according to city type, and the most suitable development orientation and development path for each type of city was summarized, as shown in Figure 10. Among them, growth resource-based cities are suitable for transformation-oriented development paths, which require these resource-based cities to lay a good foundation for development, focus on the rapid development of urban economy and industries, etc., to transition to the next stage. Maturity resource-based cities are suitable for economic-oriented and transformation-oriented paths. Specifically, resource-based cities in the initial stages of maturity can effectively fortify their position by aligning with an economic orientation. On the other hand, mature resource-based cities at a later stage of development must strategically navigate swift and high-quality transformation. In addition, they should be cautious about the potential pitfalls of succumbing to the “resource curse” phenomenon. Recession resource-based cities are suitable for economic-oriented development paths, and they need sufficient funds to fill the gap in urban development. In the absence of the new industry configuration, economic development is always the priority, and it is a better way to find the possibility of transformation in economic development. Finally, for regeneration resource-based cities, scale-oriented, economic-oriented, and integrated-oriented are all appropriate paths. The number of regenerative resource-based cities in China is still relatively small now, but will gradually increase in the future. Therefore, it is an important responsibility for regeneration resource-based cities to continuously explore suitable development paths according to their actual conditions. As pioneers, the development orientations and paths of these regeneration resource-based cities represent the future of resource-based cities in China to a large extent.

3.3.4. Robust Test

The results of fsQCA studies based on set theory should be preferred to set theory-specific methods for robustness testing, and the commonly used methods include changing the dynamic consistency value, adjusting the calibration value [53], and integrating QCA with econometric methods [54]. Referring to Greckhamer’s [45] and Schneider’s studies [55], in this study, we chose to raise the original consistency value of the cases by increasing the value from 0.80 to 0.85 in the configuration analysis of EE, EI efficiency, and RW efficiency respectively. The new configurations are consistent with the results in Table 5 (all configurations are consistent with the results in Table 5 except for the configuration H1d, which disappears but does not affect the results), which are omitted here. Therefore, the analysis results in this study have good robustness.

4. Discussion

EE, EI, and RW are important factors in promoting regional sustainable development [18,56], and the sustainable development of resource-based cities is a key concern worldwide [57]. In the realm of sustainable development in resource-based cities, previous studies have primarily been confined to narrower scopes. Scholars have predominantly measured singular or a limited set of efficiencies that gauge the sustainability of resource-based cities [13,23,58]. Alternatively, discussions surrounding the attainment of sustainable development in such cities have often remained theoretical [59,60]. In other words, few studies have measured the sustainable development level of resource-based cities in developing countries from multiple perspectives, and analyzed the spatial–temporal differences and development paths to propose scientific policy recommendations for promoting he sustainable development of resource-based cities. Based on this issue, in this paper, 92 sample resource-based cities were selected from 24 provinces in China, and their EE, EI efficiency, and RW efficiency were calculated using the two-stage super-SBM method. Then, spatial–temporal and typological comparisons were carried out. Additionally, the fsQCA method was used to analyze the six antecedent variables that promote the sustainable development of resource-based cities, derive the configuration paths of efficient development, and identify the core factors. Finally, this paper summarizes the model for achieving sustainable development based on the analysis mentioned above. Furthermore, The results of this paper are also of good practical significance: the measured EE, EI, and RW values assess the level of sustainable development of resource cities. Furthermore, the relevant data and calculation methods can be used as a reference for governmental departments and researchers. Additionally, the results from the fsQCA summarize the developmental paths of various types of resource-based cities in China, unearthing invaluable experience from well-performing resource-based cities. The experience can also serve as a reference for enhancing and optimizing the developmental strategies of other similar resource-based cities.
Based on the results of this paper, 92 sample resource-based cities have large regional and type differences, among which the development of EE and EI, especially EI, has not reached expectations. The level of EI in cities is the key to achieving sustainable development, which largely influences the development of other indicators, and is the bond between environmental protection and social progress [61], and thus, it needs our sufficient attention. Presently, China is advocating for the concept of “high-quality development”, and the progress of EI aligns well with this principle [62]. Consequently, the fact that resource-based cities have maintained a low level of EI for years raises a warning flag for the Chinese government. The level of RW has improved but needs to be maintained. Therefore, different development strategies should be formulated for different resource-based cities in different phases, and the policies for areas with high and low development levels should not be one-size-fits-all [63]. Regarding resource-based cities in eastern China, these cities developed earlier [46], but they face significant challenges, such as resource depletion, outdated industries, and environmental degradation. Their future focus lies in transitioning development and leveraging the surrounding urban areas for industrial upgrading [64]. In western China, resource-based cities started their development relatively later. By learning from the experiences of well-established resource-based cities in eastern China, they have managed to avoid many pitfalls and exhibit a more promising developmental trajectory. Going forward, the key challenge for these cities will be striking a balance between industrial transformation and ecological environmental preservation [25]. Their actions will serve as exemplars showcasing the enhancement of modern urban governance capabilities. It requires local governments to interpret and study the relevant documents and policies comprehensively to develop suitable development paths according to the actual conditions of cities’ endowments. The results of the global analysis indicate that resource-based cities in China went through a process of “rapid development—stable development and maintenance”, and it is obvious that the 92 resource-based cities studied in this paper have achieved satisfactory results in rapid development, but now we should focus more on stabilizing the development effectiveness and transforming from the original rough development to the goal of high-quality development. In addition, based on the results of the fsQCA, local governments have multiple paths to enhancing the sustainable development level of cities, and these paths can constitute different development orientations [63]. Specifically, among the four types of scale-oriented, economic-oriented, integrated-oriented, and transformation-oriented, the economic-oriented and transformation-oriented development paths have the highest number, indicating that the enhancement of the economic level is still the most important part for resource-based cities to achieve sustainable development. “City type” and “Export dependence” are the key antecedent variables in all the paths of EE, EI, and RW high-quality development, which indicate that resource-based cities in China should vigorously improve their export competitiveness and promote the transformation of urban industry and urban development type, deepening sustainable development in good connection with other development conditions in the future. The local governments can refer to the paths and orientations in Table 5 and Figure 10 when formulating their development policies. The share of tertiary industry output in GDP, industrial structure, is not a necessary condition for resource-based cities to achieve sustainable development, which also reminds local governments that blindly increasing the share of tertiary industry is not a rational choice, and the focus should be on vigorously carrying out innovation projects to develop high-quality tertiary industries [65]. Finally, the importance of “City type” indicates that the Chinese government’s strategy to promote the development of resource-based cities is correct, but based on the results of the efficiency grouping, we found that the EE, EI, and RW of resource-based cities in the last two stages, recession and regeneration, did not perform well. It is still necessary for the central government to pay sufficient attention to refine the planning documents or conduct new plans for the development of these two types of cities, i.e., re-plan the development of recession and regeneration resource-based cities, so as to ensure that resource-based cities can make steady efforts in the later stage of development and achieve high-quality development throughout the whole process [64].
In summary, we have arrived at some positive results through our research. However, this paper also has some shortcomings, and there certain improvements can be in following studies. The main deficiencies and limitations are as follows: (1) This paper exclusively focused on the analysis of prefecture-level resource-based cities in China, omitting the discussion of county-level and regional resource-based cities. As a result, the conclusions drawn and policy recommendations provided might not be directly applicable to the sustainable development of county-level and regional resource-based cities. In light of the aforementioned, it could be meaningful to embark on a separate research endeavor in the future to analyze county-level, regional-level, and other such categories of resource-based cities. This would contribute to the refinement and comprehensive development of this research system. (2) This paper only used the cross-sectional data of 2019 for fsQCA. The lack of analysis of previous years prevented us from directly observing the evolutionary process of development paths and patterns in resource-based cities. If there is a need for research, a joint analysis will be conducted in following studies by combining data from before 2019 [66] to explore the dynamic change process of influencing factors and configurations.

5. Conclusions

By analyzing the EE, EI efficiency, and RW efficiency of 92 sample resource-based cities in China from 2013 to 2019, ways to achieve the sustainable development of resource-based cities and conclusions have been drawn: (1) The EE of the 92 sample resource-based cities studied in this paper shows an upward trend in southern China and a downward trend in northern China. Additionally, the EI level of the 92 sample resource-based cities was generally low, and no significant progress was made in the period of 2013–2019. Regarding the level of residents’ well-being, the 92 sample resource-based cities improved greatly from 2013 to 2019. Combining the performance of EE, EI, and RW, resource-based cities in southwest and northwest China performed well, while resource-based cities in northeast China performed poorly. Overall, the three phases of 2013, 2016, and 2019 did not show a coherently increasing development trend and there were still a large number of low-level (referring to the EE, EI, and RW levels) cities among the 92 resource-based cities. (2) According to the group comparison of city types, the EE and EI in growth and maturity resource-based cities were well developed, and the gap between maturity resource-based cities was larger. The EE and EI of recession and regeneration resource-based cities were not well developed, and the governments need to re-plan them and find suitable development paths to complete industrial transformation and upgrading with high quality. In terms of RW, the efficiency of the four types of resource-based cities has stabilized from rapid growth. In general, the RW of these cities improved significantly during the period of 2013–2019. (3) There are five paths to achieving high EE, among which “City size”, “Tech innovation”, and “Export dependence” are the three main factors. There are three paths to achieving high EI, for which “City type”, “Per capita GDP”, and “Export dependence” are the three main factors. Finally, there are two paths to achieving high RW. “City type” and “Export dependence” are closely related to high RW efficiency. The above 10 paths can be categorized into four types: scale-oriented, economic-oriented, integrated-oriented, and transformation-oriented. “City type” and “Export dependence” are the key conditions for high EE, EI efficiency, and RW efficiency, while “industrial structure” is not an important condition.

Author Contributions

Conceptualization, Q.W. and Q.Y.; formal analysis, Q.W., Q.Y. and M.H.; methodology, Q.W. and W.S.; funding acquisition, M.H.; writing—original draft, Q.W.; review and editing, Q.W., Q.Y., M.H. and W.S.; software, Q.W. and W.S.; project administration, M.H. and Q.Y.; supervision, Q.Y. All authors have read and agreed to the published version of the manuscript.

Funding

This research was funded by the Humanities and Social Science Planning Fund of the Ministry of Education, China, grant number 20YJAZH038.

Data Availability Statement

Not applicable.

Acknowledgments

We thank the anonymous reviewers of this manuscript whose comments and suggestions considerably improved the paper.

Conflicts of Interest

The authors declare no conflict of interest.

Appendix A

Table A1. Classification of the 92 sample resource-based cities.
CityCity TypeCityCity Type
LincangMaturityPingxiangRecession
BaoshanMaturityGanzhouMaturity
ZhaotongGrowthTangshanRegeneration
PuerMaturityZhangjiakouMaturity
QujingMaturityChengdeMaturity
WuhaiRecessionXingtaiMaturity
BaotouRegenerationHandanMaturity
ChifengMaturitySanmenxiaMaturity
ErdosGrowthPingdingshanMaturity
JilinMaturityLuoyangRegeneration
SongyuanGrowthJiaozuoRecession
LiaoyuanRecessionHebiMaturity
TonghuaRegenerationHuzhouMaturity
NanchongGrowthEzhouMaturity
PanzhihuaMaturityHuangshiRecession
LuzhouRecessionLoudiMaturity
ZigongMaturityHengyangMaturity
Ya’anMaturityShaoyangMaturity
ShizuishanRecessionChenzhouMaturity
XuanchengMaturityPingliangMaturity
HuaibeiRecessionZhangyeRegeneration
HuainanMaturityWuweiGrowth
TonglingRecessionBaiyinRecession
MaanshanRegenerationJinchangMaturity
DongyingMaturityLongnanGrowth
LinyiRegenerationSanmingMaturity
ZaozhuangRecessionNanpingMaturity
Tai’anMaturityLongyanMaturity
JiningMaturityLiupanshuiGrowth
ZiboRegenerationAnshunMaturity
LvliangMaturityBijieGrowth
DatongMaturityFushunRecession
YizhouMaturityBenxiMaturity
JinchengMaturityPanjinRegeneration
YunchengMaturityHuludaoRegeneration
YangquanMaturityFuxinRecession
YunfuMaturityAnshanRegeneration
ShaoguanRecessionXianyangGrowth
HechiMaturityYan’anGrowth
BaiseMaturityYulinGrowth
HezhouGrowthWeinanMaturity
KaramayMaturityTongchuanRecession
SuqianRegenerationYichunRecession
XuzhouRegenerationShuangyashanRecession
XinyuRecessionDaqingMaturity
JingdezhenRecessionHegangRecession
Table A2. The results of EE, EI efficiency, and RW efficiency for 92 sample resource-based cities in 2013.
CityEE (Rank)EI (Rank)RW (Rank)CityEE (Rank)EI (Rank)RW (Rank)
Lincang0.5575 (34)0.1664 (63)0.5184 (21)Pingxiang0.4452 (52)0.2191 (55)0.1139 (71)
Baoshan0.2717 (72)0.0827 (79)0.3289 (25)Ganzhou0.5130 (39)0.1644 (65)0.2449 (38)
Zhaotong0.3407 (63)0.0220 (90)1.0000 (6)Tangshan1.0000 (9)0.1012 (74)0.0892 (80)
Puer0.2570 (75)1.0000 (7)1.0000 (18)Zhangjiakou0.2739 (71)0.1853 (59)0.1401 (65)
Qujing0.4889 (43)0.0623 (87)0.2605 (35)Chengde0.3274 (65)0.1386 (67)0.1666 (54)
Wuhai0.3900 (56)1.0000 (7)1.0000 (10)Xingtai0.4635 (48)1.0000 (7)0.2835 (31)
Baotou0.6082 (27)1.0000 (7)0.0629 (91)Handan0.5654 (33)0.0724 (83)0.2207 (43)
Chifeng0.2605 (73)0.1372 (68)0.1470 (63)Sanmenxia0.7034 (20)0.3023 (41)0.0885 (81)
Erdos1.0000 (9)0.1112 (72)0.0838 (82)Pingdingshan0.4478 (51)0.1647 (64)0.1617 (58)
Jilin0.5973 (30)0.2206 (53)0.1123 (72)Luoyang0.4713 (45)0.2762 (45)0.1375 (67)
Songyuan0.9427 (15)1.0000 (7)1.0000 (19)Jiaozuo0.5474 (35)0.3665 (36)0.0928 (79)
Liaoyuan0.8874(16)0.2904 (43)0.2484 (37)Hebi0.4895 (42)0.4268 (34)0.1193 (70)
Tonghua0.4683 (46)0.1214 (70)0.1344 (68)Huzhou0.6456 (23)1.0000 (7)0.0679 (88)
Nanchong1.0617 (5)0.5977 (26)1.2923 (1)Ezhou0.4903 (41)0.3160 (39)1.0000 (13)
Panzhihua0.2005 (84)0.5334 (29)0.1116 (73)Huangshi0.4568 (49)0.4823 (31)0.1850 (47)
Luzhou0.3539 (61)0.2382 (52)0.3101 (27)Loudi0.4482 (50)0.0412 (88)0.1679 (53)
Zigong1.0067 (7)1.4518 (1)1.1227 (3)Hengyang0.6377 (24)0.2708 (48)0.2814 (32)
Ya’an0.3626 (60)0.3850 (35)0.4286 (23)Shaoyang0.5243 (38)1.0000 (7)1.0000 (8)
Shizuishan0.2264 (80)0.5706 (28)0.2361 (39)Chenzhou0.6886 (22)0.0873 (77)0.1731 (49)
Xuancheng0.3471 (62)0.2193 (54)0.1437 (64)Pingliang0.2336 (79)0.0649 (86)0.1487 (61)
Huaibei0.4670 (47)1.0000 (7)1.0000 (17)Zhangye0.2503 (76)0.2963 (42)0.3003 (29)
Huainan0.4329 (54)0.4360 (33)0.1706 (51)Wuwei0.1521 (89)1.0000 (7)1.0000 (16)
Tongling0.7660 (19)1.0000 (7)0.0474 (92)Baiyin0.1663 (88)0.2444 (51)0.1974 (45)
Maanshan0.5323 (36)0.4837 (30)0.0706 (87)Jinchang0.1294 (91)1.0000 (7)1.0000 (14)
Dongying1.0000 (9)0.4736 (32)0.0733 (86)Longnan0.2223 (82)0.0369 (89)1.0000 (11)
Linyi0.4995 (40)0.2482 (50)0.2109 (44)Sanming0.5982 (29)0.2006 (57)0.0937 (78)
Zaozhuang1.0018 (8)1.0664 (5)0.0825 (84)Nanping0.3795 (58)0.7241 (24)0.4207 (24)
Tai’an1.1003 (3)1.0785 (4)0.0957 (76)Longyan0.6243 (25)0.1915 (58)0.0804 (85)
Jining0.7914 (18)0.0780 (81)0.1217 (69)Liupanshui0.3861 (57)0.0818 (80)1.0000 (5)
Zibo1.0000 (9)0.3137 (40)0.0654 (90)Anshun0.2574 (74)0.1260 (69)0.1545 (59)
Lvliang1.0000 (9)0.0167 (91)0.2897 (30)Bijie0.3162 (67)0.0980 (75)1.0000 (7)
Datong0.2442 (77)0.6804 (25)0.1628 (57)Fushun0.3353 (64)0.3625 (37)0.1696 (52)
Yizhou0.2372 (78)0.0766 (82)0.2779 (33)Benxi0.3272 (66)0.1722 (62)0.0674 (89)
Jincheng0.4133 (55)0.2724 (47)0.1473 (62)Panjin0.6182 (26)1.0000 (7)1.0000 (12)
Yuncheng0.3685 (59)0.1778 (60)0.2321 (41)Huludao1.0297 (6)0.1729 (61)1.1198 (4)
Yangquan0.1889 (87)1.0000 (7)0.1830 (48)Fuxin0.2933 (70)0.2861 (44)0.1642 (55)
Yunfu0.6029 (28)0.1548 (66)0.0942 (77)Anshan0.5268 (37)0.7647 (23)0.1884 (46)
Shaoguan0.3146 (68)0.5731 (27)0.3181 (26)Xianyang1.0000 (9)0.2756 (46)0.2493 (36)
Hechi0.1907 (86)0.1048 (73)0.1632 (56)Yan’an1.1122 (1)1.1549 (2)1.1514 (2)
Baise0.2050 (83)0.1169 (71)0.1382 (66)Yulin0.7023 (21)0.0683 (84)0.1097 (74)
Hezhou0.2945 (69)0.0927 (76)0.1718 (50)Weinan1.0796 (4)1.0219 (6)0.2309 (42)
Karamay0.4366 (53)1.0000 (7)1.0000 (15)Tongchuan0.1965 (85)0.0660 (85)1.0000 (9)
Suqian0.5755 (32)1.0000 (7)1.0000 (20)Yichun0.0914 (92)1.0000 (7)0.2358 (40)
Xuzhou0.8029 (17)0.0828 (78)0.0837 (83)Shuangyashan0.2242 (81)0.2670 (49)0.3069 (28)
Xinyu0.5926 (31)0.3269 (38)0.1016 (75)Daqing1.1011 (2)1.0951 (3)0.4400 (22)
Jingdezhen0.4781 (44)0.2167 (56)0.1514 (60)Hegang0.1432 (90)0.0093 (92)0.2606 (34)
Table A3. The results of EE, EI efficiency, and RW efficiency for 92 sample resource-based cities in 2016.
CityEE (Rank)EI (Rank)RW (Rank)CityEE (Rank)EI (Rank)RW (Rank)
Lincang0.6720 (25)1.0000 (5)1.0000 (31)Pingxiang0.4877 (39)0.2283 (56)0.2687 (72)
Baoshan0.2899 (69)0.1199 (78)0.4481 (52)Ganzhou0.4428 (46)0.1208 (76)0.2148 (81)
Zhaotong0.3676 (57)0.0266 (91)1.0000 (7)Tangshan1.0000 (6)0.1066 (81)0.2013 (83)
Puer0.2680 (72)0.1946 (60)0.5764 (39)Zhangjiakou0.2859 (70)0.1275 (74)0.2986 (68)
Qujing0.6194 (27)0.1387 (72)0.3611 (61)Chengde0.2928 (68)0.2816 (47)0.3240 (65)
Wuhai0.3862 (53)0.1639 (65)1.0000 (5)Xingtai0.4297 (49)0.3049 (41)0.3748 (59)
Baotou1.0000 (6)0.2838 (46)0.1805 (86)Handan0.4538 (44)0.1203 (77)1.0000 (20)
Chifeng0.2529 (77)0.1604 (69)0.3703 (60)Sanmenxia0.5157 (35)0.3797 (36)0.2992 (67)
Erdos1.0000 (6)0.2088 (58)0.4838 (46)Pingdingshan0.3718 (56)0.1634 (66)1.0000 (11)
Jilin0.4884 (38)0.2378 (55)0.2848 (70)Luoyang0.6460 (26)0.1995 (59)0.2093 (82)
Songyuan1.1930 (2)1.1144 (1)1.0991 (2)Jiaozuo0.5776 (30)1.0000 (5)0.5408 (40)
Liaoyuan0.7264 (18)0.2762 (49)1.0000 (12)Hebi0.5049 (37)0.2989 (42)1.0000 (10)
Tonghua0.3542 (60)0.1050 (82)0.2560 (74)Huzhou0.6036 (28)1.0000 (5)0.1629 (88)
Nanchong0.6904 (22)1.0000 (5)1.0000 (29)Ezhou0.5545 (32)0.3906 (35)1.0000 (9)
Panzhihua0.2365 (80)0.7335 (25)0.5771 (38)Huangshi0.4409 (47)0.2509 (54)0.1710 (87)
Luzhou0.3811 (54)1.0000 (5)1.0000 (28)Loudi0.4529 (45)0.1818 (63)1.0000 (32)
Zigong1.0864 (3)1.0975 (2)1.0872 (3)Hengyang0.7105 (21)1.0000 (5)1.0000 (27)
Ya’an0.3519 (61)0.7181 (26)1.0000 (17)Shaoyang1.0153 (5)0.2764 (48)1.2764 (1)
Shizuishan0.2611 (74)0.4922 (32)1.0000 (6)Chenzhou0.9216 (14)0.1113 (79)0.3062 (66)
Xuancheng0.7213 (19)0.5247 (31)0.2684 (73)Pingliang0.2446 (78)0.1452 (71)0.6194 (36)
Huaibei0.4539 (43)0.9913 (23)0.4501 (51)Zhangye0.1127 (90)0.5441 (30)1.0000 (22)
Huainan0.3277 (62)0.2616 (51)0.3404 (62)Wuwei0.2752 (71)1.0000 (5)1.0000 (21)
Tongling0.5186 (34)0.3375 (38)0.1611 (90)Baiyin0.1427 (87)0.1913 (61)0.5125 (43)
Maanshan0.5669 (31)1.0000 (5)0.2285 (77)Jinchang0.1165 (89)1.0000 (5)1.0000 (14)
Dongying1.0000 (6)0.6351 (27)0.2229 (79)Longnan0.2428 (79)0.0426 (90)1.0000 (16)
Linyi0.4579 (42)0.1621 (67)1.0000 (15)Sanming0.7176 (20)0.2580 (53)0.2265 (78)
Zaozhuang0.7806 (16)0.5569 (29)0.2980 (69)Nanping0.5144 (36)1.0000 (5)0.4919 (45)
Tai’an1.0677 (4)1.0689 (3)0.2305 (76)Longyan0.6723 (24)0.2973 (43)0.1888 (85)
Jining0.8323 (15)0.1248 (75)0.1961 (84)Liupanshui0.7545 (17)0.0776 (84)0.4236 (54)
Zibo1.0000 (6)0.3267 (39)0.1584 (91)Anshun0.3563 (59)0.1591 (70)0.3914 (57)
Lvliang0.4697 (41)0.0624 (87)1.0000 (8)Bijie0.4760 (40)0.0435 (89)0.1612 (89)
Datong0.2171 (83)0.2705 (50)1.0000 (30)Fushun0.2222 (82)1.0000 (5)1.0000 (24)
Yizhou0.2566 (76)0.1068 (80)0.4806 (47)Benxi0.2254 (81)0.3994 (34)0.4610 (49)
Jincheng0.3756 (55)0.2853 (45)0.4480 (53)Panjin0.3196 (64)1.0000 (5)0.6987 (35)
Yuncheng0.3610 (58)0.1878 (62)0.5249 (41)Huludao0.3877 (52)0.8543 (24)1.0000 (23)
Yangquan0.1903 (86)0.4115 (33)0.5233 (42)Fuxin0.1908 (85)1.0000 (5)1.0000 (25)
Yunfu0.4120 (51)0.1648 (64)0.2340 (75)Anshan0.2599 (75)1.0000 (5)0.5108 (44)
Shaoguan0.3187 (65)0.3703 (37)0.2812 (71)Xianyang1.0000 (6)0.2865 (44)0.4160 (55)
Hechi1.1958 (1)1.0106 (4)1.0100 (4)Yan’an0.3005 (67)0.0721 (86)0.4599 (50)
Baise0.3096 (66)0.1366 (73)0.3311 (64)Yulin0.5388 (33)0.0766 (85)0.2224 (80)
Hezhou0.3225 (63)0.2205 (57)1.0000 (18)Weinan1.0000 (6)0.1606 (68)0.4112 (56)
Karamay0.2664 (73)1.0000 (5)1.0000 (33)Tongchuan0.2027 (84)0.0603 (88)0.4751 (48)
Suqian0.6747 (23)1.0000 (5)1.0000 (34)Yichun0.0734 (92)0.2585 (52)1.0000 (26)
Xuzhou1.0000 (6)0.0946 (83)0.1206 (92)Shuangyashan0.1409 (88)1.0000 (5)1.0000 (13)
Xinyu0.5807 (29)0.5631 (28)0.3824 (58)Daqing0.4279 (50)1.0000 (5)0.6057 (37)
Jingdezhen0.4312 (48)0.3080 (40)0.3330 (63)Hegang0.1043 (91)0.0205 (92)1.0000 (19)
Table A4. The results of EE, EI efficiency, and RW efficiency for 92 sample resource-based cities in 2019.
CityEE (Rank)EI (Rank)RW (Rank)CityEE (Rank)EI (Rank)RW (Rank)
Lincang1.1545 (1)1.1412 (2)1.1162 (2)Pingxiang0.3693 (51)0.3961 (32)0.3259 (70)
Baoshan0.5987 (27)0.2700 (51)0.6017 (45)Ganzhou0.5814 (31)0.1018 (84)0.2473 (87)
Zhaotong0.5822 (30)0.1290 (71)1.0000 (31)Tangshan0.6016 (26)0.1310 (70)0.2506 (86)
Puer0.4911 (35)0.0806 (88)0.6166 (43)Zhangjiakou0.2666 (70)0.1278 (72)0.2704 (83)
Qujing1.0303 (6)0.1363 (69)1.0220 (4)Chengde0.3529 (57)0.2658 (52)0.3412 (67)
Wuhai0.2727 (69)1.0000 (4)1.0000 (7)Xingtai0.3622 (53)0.2070 (63)1.0000 (13)
Baotou0.2555 (73)0.2507 (57)0.3089 (74)Handan0.3534 (56)0.1084 (80)1.0000 (9)
Chifeng0.2881 (68)0.0996 (85)0.3156 (72)Sanmenxia0.4345 (41)0.1969 (64)0.2794 (82)
Erdos1.0000 (10)0.1914 (65)0.2825 (81)Pingdingshan0.3255 (60)0.1025 (83)1.0000 (32)
Jilin0.1852 (82)0.3117 (43)0.8178 (39)Luoyang0.7550 (18)0.2824 (49)0.3333 (68)
Songyuan0.3232 (61)0.4250 (29)1.0000 (24)Jiaozuo1.0231 (8)1.0137 (3)0.8966 (36)
Liaoyuan0.2970 (65)0.1230 (75)1.0000 (23)Hebi0.5949 (28)0.2652 (53)1.0000 (16)
Tonghua0.2618 (71)0.1233 (74)0.3593 (64)Huzhou0.6296 (23)1.0000 (4)0.2239 (90)
Nanchong1.0056 (9)1.4923 (1)1.9137 (1)Ezhou1.0000 (13)0.4127 (31)0.3665 (63)
Panzhihua0.2235 (75)0.2989 (45)0.4614 (51)Huangshi0.4472 (39)0.3099 (44)0.3234 (71)
Luzhou0.3664 (52)1.0000 (4)1.0000 (11)Loudi0.3848 (49)0.1847 (66)0.7307 (40)
Zigong1.0000 (12)0.6885 (23)0.6536 (42)Hengyang0.6805 (21)1.0000 (4)1.0000 (21)
Ya’an0.4264 (44)1.0000 (4)1.0000 (8)Shaoyang1.1082 (3)0.3505 (38)1.0165 (5)
Shizuishan0.2162 (77)0.4856 (26)1.0000 (33)Chenzhou0.8092 (17)0.1200 (77)0.4091 (57)
Xuancheng0.8487 (16)1.0000 (4)0.3018 (76)Pingliang0.2885 (67)1.0000 (4)0.5891 (47)
Huaibei0.5372 (33)1.0000 (4)1.0000 (19)Zhangye0.1536 (87)1.0000 (4)1.0000 (10)
Huainan0.3551 (55)0.2105 (62)0.3820 (60)Wuwei0.2195 (76)0.5267 (25)0.6039 (44)
Tongling0.3191 (62)0.3383 (39)0.2084 (91)Baiyin0.1453 (88)0.2382 (60)0.7262 (41)
Maanshan0.4722 (36)1.0000 (4)0.3050 (75)Jinchang0.1249 (90)1.0000 (4)1.0000 (34)
Dongying0.4336 (42)0.5826 (24)0.3006 (77)Longnan0.4046 (48)0.0920 (87)0.5201 (49)
Linyi0.4129 (45)0.1261 (73)1.0000 (14)Sanming1.0000 (11)0.2437 (59)0.2851 (79)
Zaozhuang0.5064 (34)0.2548 (55)0.4406 (52)Nanping0.7276 (20)1.0000 (4)0.3898 (59)
Tai’an0.6184 (24)0.2566 (54)0.3105 (73)Longyan0.8561 (15)0.3511 (37)0.2063 (92)
Jining0.5872 (29)0.1063 (81)0.3268 (69)Liupanshui0.7463 (19)0.0951 (86)0.3728 (61)
Zibo0.4629 (37)0.3309 (41)0.2282 (89)Anshun0.3081 (63)0.1400 (67)0.4016 (58)
Lvliang1.0000 (14)0.1225 (76)0.4225 (56)Bijie0.3558 (54)0.3354 (40)1.0000 (26)
Datong0.2143 (78)0.1155 (78)0.3575 (65)Fushun0.1665 (85)1.0000 (4)1.0000 (27)
Yizhou0.4047 (47)0.1092 (79)0.5543 (48)Benxi0.1670 (84)1.0000 (4)1.0000 (35)
Jincheng0.6132 (25)0.2176 (61)0.3454 (66)Panjin0.3283 (58)1.0000 (4)1.0000 (30)
Yuncheng0.4374 (40)0.2505 (58)1.0000 (17)Huludao0.2391 (74)0.4474 (28)1.0000 (20)
Yangquan0.1829 (83)0.3151 (42)0.4338 (54)Fuxin0.1883 (81)1.0000 (4)1.0000 (22)
Yunfu0.2020 (80)0.0106 (92)0.2563 (85)Anshan0.2142 (79)0.3694 (34)0.8281 (38)
Shaoguan0.3265 (59)0.4648 (27)0.3725 (62)Xianyang1.0878 (4)0.3552 (36)0.8750 (37)
Hechi1.0249 (7)0.2931 (47)1.0396 (3)Yan’an0.4480 (38)0.3600 (35)0.4388 (53)
Baise0.4289 (43)0.0737 (89)0.2845 (80)Yulin0.4104 (46)0.0512 (90)0.2376 (88)
Hezhou0.2599 (72)0.2540 (56)1.0000 (25)Weinan1.0623 (5)0.1380 (68)0.4811 (50)
Karamay0.2973 (64)1.0000 (4)1.0000 (15)Tongchuan0.1556 (86)0.1043 (82)0.4276 (55)
Suqian0.6592 (22)1.0000 (4)1.0000 (6)Yichun0.1243 (91)1.0000 (4)1.0000 (28)
Xuzhou1.1122 (2)0.2939 (46)0.2579 (84)Shuangyashan0.1369 (89)0.2927 (48)1.0000 (18)
Xinyu0.3772 (50)0.3738 (33)0.5904 (46)Daqing0.2934 (66)0.4221 (30)1.0000 (12)
Jingdezhen0.5568 (32)0.2756 (50)0.2872 (78)Hegang0.1046 (92)0.0175 (91)1.0000 (29)

References

  1. The International Energy Agency. Data and Statistics of International Energy Agency. Available online: https://www.iea.org/data-and-statistics?country=WORLD&fuel=Energy%20supply&indicator=Total% (accessed on 15 August 2023).
  2. The International Energy Agency. CO2 Emissions in 2022. Available online: https://www.iea.org/reports/co2-emissions-in-2022 (accessed on 15 August 2023).
  3. Balakrishnan, K.; Dey, S.; Gupta, T.; Dhaliwal, R.S.; Brauer, M.; Cohen, A.J.; Stanaway, J.D.; Beig, G.; Joshi, T.K.; Aggarwal, A.N.; et al. The impact of air pollution on deaths, disease burden, and life expectancy across the states of India: The Global Burden of Disease Study 2017. Lancet Planet. Health 2019, 3, e26–e39. [Google Scholar] [CrossRef] [PubMed]
  4. Pope, C.A.; Ezzati, M.; Cannon, J.B.; Allen, R.T.; Jerrett, M.; Burnett, R.T. Mortality risk and PM2.5 air pollution in the USA: An analysis of a national prospective cohort. Air Qual. Atmos. Health 2018, 11, 245–252. [Google Scholar] [CrossRef]
  5. Zhang, Y.; Shuai, C.; Bian, J.; Chen, X.; Wu, Y.; Shen, L. Socioeconomic factors of PM2.5 concentrations in 152 Chinese cities: Decomposition analysis using LMDI. J. Clean. Prod. 2019, 218, 96–107. [Google Scholar] [CrossRef]
  6. United Nations. Revision of World Urbanization Prospects 2018. 2018. Available online: https://population.un.org/wup/ (accessed on 15 August 2023).
  7. Liu, S.; Zhang, J.J.; Li, J.; Li, Y.; Zhang, J.; Wu, X. Simulating and mitigating extreme urban heat island effects in a factory area based on machine learning. Build. Environ. 2021, 202, 108051. [Google Scholar] [CrossRef]
  8. Mauree, D.; Naboni, E.; Coccolo, S.; Perera, A.T.D.; Nik, V.M.; Scartezzini, J.L. A review of assessment methods for the urban environment and its energy sustainability to guarantee climate adaptation of future cities. Renew. Sustain. Energy Rev. 2019, 112, 733–746. [Google Scholar] [CrossRef]
  9. The Chinese Government. The Sustainable Development Plan for Resources-Based Cities in China (2013–2020). Available online: https://www.gov.cn/gongbao/content/2013/content_2547140.htm (accessed on 23 August 2023).
  10. Li, H.; Long, R.; Chen, H. Economic transition policies in Chinese resource-based cities: An overview of government efforts. Energy Policy. 2013, 55, 251–260. [Google Scholar] [CrossRef]
  11. Shao, S.; Zhang, Y.; Tian, Z.; Li, D.; Yang, L. The regional Dutch disease effect within China: A spatial econometric investigation. Energy Econ. 2020, 88, 104766. [Google Scholar] [CrossRef]
  12. Qin, B.; Liu, L.; Tao, Y. Evaluation of sustainable development of resource-based cities in China. J. Environ. Econ. 2019, 4, 142–158. [Google Scholar] [CrossRef]
  13. Xiao, H.; Wang, D.; Qi, Y.; Shao, S.; Zhou, Y.; Shan, Y. The governance-production nexus of eco-efficiency in Chinese resource-based cities: A two-stage network DEA approach. Energy Econ. 2021, 101, 105408. [Google Scholar] [CrossRef]
  14. Koppl, R.; Kauffman, S.; Felin, T.; Longo, G. Economics for a creative world. J. Institutional Econ. 2015, 11, 1–31. [Google Scholar] [CrossRef]
  15. Kiani, M.R.; Saen, R.F.; Goh, M. Joint analysis of eco-efficiency and eco-innovation with common weights in two-stage network DEA: A big data approach. Technol. Forecast. Soc. Chang. 2019, 144, 553–562. [Google Scholar] [CrossRef]
  16. Schaltegger, S.; Andreas, S. Ökologische Rationalität: Ansatzpunkte Zur Ausgestaltung von Ökologieorientierten Managementinstrumenten. Die Unternehm. 1990, 44, 273–290. [Google Scholar]
  17. Camarero, M.; Castillo, J.; Picazotadeo, A.J.; Tamarit, C. Eco-efficiency and convergence in OECD countries. Environ. Resour. Econ. 2013, 55, 87–106. [Google Scholar] [CrossRef]
  18. De Araujo, R.V.; Espejo, R.A.; Constantino, M.; de Moraes, P.M.; Taveira, J.C.; Lira, F.S.; Herrera, G.P.; Costa, R. Eco-efficiency measurement as an approach to improve the sustainable development of municipalities: A case study in the Midwest of Brazil. Environ. Dev. 2021, 39, 100652. [Google Scholar] [CrossRef]
  19. Shen, L.; Huang, Z.; Wong, S.W.; Liao, S.; Lou, Y. A holistic evaluation of smart city performance in the context of China. J. Clean. Prod. 2018, 200, 667–679. [Google Scholar] [CrossRef]
  20. Zhang, S.; Zhu, D.; Shi, Q.; Cheng, M. Which countries are more ecologically efficient in improving human well-being? An application of the index of ecological well-being performance. Resour. Conserv. Recycl. 2018, 129, 112–119. [Google Scholar] [CrossRef]
  21. Zhang, Y.; Mao, Y.; Jiao, L.; Shuai, C.; Zhang, H. Eco-efficiency, eco-technology innovation and eco-well-being performance to improve global sustainable development. Environ. Impact Assess. Rev. 2021, 89, 106580. [Google Scholar] [CrossRef]
  22. Long, L.; Wang, X.; Guo, B. Evaluation of urban ecological well-being performance based on revised DEA model—A case study of 35 major cities in China. J. Nat. Resour. 2017, 32, 595–605. [Google Scholar] [CrossRef]
  23. Zhang, Y.; Cui, M. Determining the innovation efficiency of resource-based cities using a relational network dea model: Evidence from China. Extr. Ind. Soc. 2020, 7, 1557–1566. [Google Scholar] [CrossRef]
  24. Li, B.; Dewan, H. Efficiency differences among China’s resource-based cities and their determinants. Resour. Policy 2017, 51, 31–38. [Google Scholar] [CrossRef]
  25. Ruan, F.; Liang, Y.; Wang, D. The complexity for the resource-based cities in China on creating sustainable development. Cities 2020, 97, 102571. [Google Scholar] [CrossRef]
  26. Zhang, M.; Tan, F.; Lu, Z. Resource-based cities (RBC): A road to sustainability. Int. J. Sustain. Dev. World Ecol. 2014, 21, 465–470. [Google Scholar] [CrossRef]
  27. Li, L.; Lei, Y.; Pan, D.; Si, C. Research on Sustainable Development of Resource-Based Cities Based on the DEA Approach: A Case Study of Jiaozuo, China. Math. Probl. Eng. 2016, 2016, 5024837. [Google Scholar] [CrossRef]
  28. Pan, Z.; Wang, Y.; Zhou, Y.; Wang, Y. Analysis of the water use efficiency using super-efficiency data envelopment analysis. Appl. Water Sci. 2020, 10, 139. [Google Scholar] [CrossRef]
  29. Guo, S.-D.; Li, H.; Zhao, R.; Zhou, X. Industrial environmental efficiency assessment for China’s western regions by using a SBM-based DEA. Environ. Sci. Pollut. Res. 2019, 26, 27542–27550. [Google Scholar] [CrossRef]
  30. Meng, M.; Qu, D. Understanding the green energy efficiencies of provinces in China: A super-SBM and GML analysis. Energy 2022, 239, 121912. [Google Scholar] [CrossRef]
  31. Sun, B.; Wang, H.; Ortiz, J.; Huang, J.; Zhao, C.; Wang, Z. A Decomposed Data Analysis Approach to Assessing City Sustainable Development Performance: A Network DEA Model with a Slack-Based Measure. Sustainability 2022, 14, 11037. [Google Scholar] [CrossRef]
  32. Tone, K.; Tsutsui, M. Network DEA: A slacks-based measure approach. Eur. J. Oper. Res. 2009, 197, 243–252. [Google Scholar] [CrossRef]
  33. Zhao, T.; Zhang, Z.; Liang, S. Digital Economy, Entrepreneurship, and High-Quality Economic Development: Empirical Evidence from Urban China. J. Manag. World 2020, 36, 65–76. [Google Scholar] [CrossRef]
  34. Cheng, Z.; King, S.P.; Smyth, R.; Wang, H. Housing property rights and subjective wellbeing in urban China. Eur. J. Political Econ. 2016, 45, 160–174. [Google Scholar] [CrossRef]
  35. Handrich, L.; Charles, C. Ragin: Fuzzy-Set Social Science; The University of Chicago Press: Chicago, IL, USA, 2000; Volume 41, pp. 788–789. [Google Scholar] [CrossRef]
  36. Arch, G.W. Moving beyond multiple regression analysis to algorithms: Calling for adoption of a paradigm shift from symmetric to asymmetric thinking in data analysis and crafting theory. J. Bus. Res. 2013, 66, 463–472. [Google Scholar] [CrossRef]
  37. Zhou, Y.; Jia, L. Configuration Perspective and Qualitative Comparative Analysis (QCA): A New Path in Management Research. J. Manag. World 2017, 6, 155–167. [Google Scholar] [CrossRef]
  38. Hernndez-Perlines, F.; Moreno-Garca, J.; Yañez-Araque, B. The Mediating Role of Competitive Strategy in International Entrepreneurial Orientation. J. Bus. Res. 2019, 69, 5383–5389. [Google Scholar] [CrossRef]
  39. Morgan, S.L. Review of Redesigning Social Inquiry: Fuzzy Sets and Beyond. Soc. Forces 2010, 88, 1936–1938. [Google Scholar] [CrossRef]
  40. Guo, C.; Luo, L.; Ye, M. Empirical Analysis of Factors Influencing the Sustainable Development of Resource-based Cities. China Popul. Resour. Environ. 2014, 24, 81–89. [Google Scholar] [CrossRef]
  41. Bian, J.; Zhang, Y.; Shuai, C.; Shen, L.; Ren, H.; Wang, Y. Have cities effectively improved ecological well-being performance? Empirical analysis of 278 Chinese cities. J. Clean. Prod. 2020, 245, 118913. [Google Scholar] [CrossRef]
  42. Zhang, T.; Xu, Y.; Ren, J.; Sun, L.; Liu, C. Inequality in the distribution of health resources and health services in China: Hospitals versus primary care institutions. Int. J. Equity Health 2017, 16, 42. [Google Scholar] [CrossRef]
  43. Yu, B.; Jin, G.; Cheng, Z. Economic Effects of Environmental Regulations: “Emission Reduction” or “Efficiency Enhancement”. Stat. Res. 2019, 36, 88–100. [Google Scholar] [CrossRef]
  44. Shen, K.; Jin, G.; Fang, X. Does Environmental Regulation Cause Pollution to Transfer Nearby? Econ. Res. J. 2017, 52, 44–59. [Google Scholar]
  45. Zhang, X. China Regional Innovation and Entrepreneurship Index, V4; Peking University Open Research Data: Beijing, China, 2019. [Google Scholar] [CrossRef]
  46. Xu, X.; Xu, X.F.; Chen, Q.; Che, Y. The research on generalized regional “resource curse” in China’s new normal stage. Resour. Policy 2016, 49, 12–19. [Google Scholar] [CrossRef]
  47. Lv, X.; Mu, X. Investigating the Synergistic Evolution Mechanism of Multi-Scale Cities: A Case Study of Three Urban Agglomerations in Eastern China. Buildings 2023, 13, 1197. [Google Scholar] [CrossRef]
  48. Sukhov, A.; Friman, M.; Olsson, L.E. Unlocking potential: An integrated approach using PLS-SEM, NCA, and fsQCA for informed decision making. J. Retail. Consum. Serv. 2023, 74, 103424. [Google Scholar] [CrossRef]
  49. Greckhamer, T.; Furnari, S.; Fiss, P.C.; Aguilera, R.V. Studying configurations with qualitative comparative analysis: Best practices in strategy and organization research. Strateg. Organ. 2018, 16, 482–495. [Google Scholar] [CrossRef]
  50. Li, J.; Wu, H. Innovation and Entrepreneurship Efficiency and Its Improvement Path in China’s Crowd Innovation Spaces. RD Manag. 2022, 34, 66–80. [Google Scholar] [CrossRef]
  51. Duan, Z.; Li, M.; Wu, P. High-Quality Regional Economic Development Paths in China—QCA-Based Linkage Effect. Sustainability 2023, 15, 6325. [Google Scholar] [CrossRef]
  52. Roig-Tierno, N.; Gonzalez-Cruz, T.F.; Llopis-Martinez, J. An overview of qualitative comparative analysis: A bibliometric analysis. J. Innov. Knowl. 2017, 2, 15–23. [Google Scholar] [CrossRef]
  53. Wang, L.; Hu, H.; Wang, X.; Zhang, X.; Sun, H. Spatiotemporal Evolution and Cause Analysis of Urban Housing Investment Resilience: An Empirical Study of 35 Large and Medium-Sized Cities in China. Land 2022, 11, 1725. [Google Scholar] [CrossRef]
  54. Fiss, P.C.; Sharapov, D.; Cronqvist, L. Opposites attract? Opportunities and challenges for integrating large-N QCA and econometric analysis. Political Res. Q. 2013, 66, 191–198. [Google Scholar]
  55. Schneider, C.Q.; Wagemann, C. Set-Theoretic Methods for the Social Sciences: A Guide to Qualitative Comparative Analysis; Cambridge University Press: Cambridge, UK, 2012; pp. 291–293. [Google Scholar]
  56. Custodio, H.M.; Hadjikakou, M.; Bryan, B.A. A Review of socioeconomic indicators of sustainability and wellbeing building on the social foundations framework. Ecol. Econ. 2023, 203, 107608. [Google Scholar] [CrossRef]
  57. Jin, Z.; Wang, J. Sustainable development evaluation of the society–economy–environment in a resource-based city of China: A complex network approach. J. Clean. Prod. 2020, 263, 121510. [Google Scholar] [CrossRef]
  58. Zhu, L.; Wang, C.; Huang, N.; Fu, Y.; Yan, Z. Developing an Indicator System to Monitor City’s Sustainability Integrated Local Governance: A Case Study in Zhangjiakou. Sustainability 2022, 14, 5047. [Google Scholar] [CrossRef]
  59. Luo, L.; Liu, P.; Zhu, F.; Sun, Y.; Liu, L. Policy objective bias and institutional quality improvement: Sustainable development of resource-based cities. Resour. Policy 2022, 78, 102932. [Google Scholar] [CrossRef]
  60. Li, X.; Zhuang, X. Eco-City Problems: Industry–City–Ecology, Urbanization Development Assessment in Resource-Exhausted Cities. Sustainability 2023, 15, 166. [Google Scholar] [CrossRef]
  61. Li, Y.; Zhang, J.; Yang, X.; Wang, W.; Wu, H.; Ran, Q.; Luo, R. The impact of innovative city construction on ecological efficiency: A quasi-natural experiment from China. Sustain. Prod. Consum. 2021, 28, 1724–1735. [Google Scholar] [CrossRef]
  62. Luo, G.; Guo, J.; Yang, F.; Wang, C. Environmental regulation, green innovation and high-quality development of enterprise: Evidence from China. J. Clean. Prod. 2023, 418, 138112. [Google Scholar] [CrossRef]
  63. Luo, L.; Wang, Y.; Liu, Y.; Zhang, X.; Fang, X. Where is the pathway to sustainable urban development? Coupling coordination evaluation and configuration analysis between low-carbon development and eco-environment: A case study of the Yellow River Basin, China. Ecol. Indic. 2022, 144, 109473. [Google Scholar] [CrossRef]
  64. Yang, Y.; Cheng, D.; Zhang, B.; Guan, C.H.; Cheng, X.; Cheng, T. Coal resource-based cities at the crossroads: Towards a sustainable urban future. Cities 2023, 140, 104424. [Google Scholar] [CrossRef]
  65. Wang, L. Research on the Coordinated Development of Chinese Tertiary Industry. In Proceedings of the International Conference on Information Engineering and Applications (IEA) 2012. Lecture Notes in Electrical Engineering; Zhong, Z., Ed.; Springer: London, UK, 2013; p. 217. [Google Scholar] [CrossRef]
  66. Aversa, P.; Furnari, S.; Haefliger, S. Business model configurations and performance: A qualitative comparative analysis in Formula One racing, 2005–2013. Ind. Corp. Chang. 2015, 24, 655–676. [Google Scholar] [CrossRef]
Figure 1. Two-stage network of EE, EI, and RW.
Sustainability 15 13332 g001
Figure 2. The research framework of this study.
Sustainability 15 13332 g002
Figure 3. EE of the 92 sample resource-based cities.
Sustainability 15 13332 g003
Figure 4. Heat map of EE in 2013, 2016, and 2019 (Gro = growth; Mat = maturity; Rec = recession; Reg = regeneration).
Sustainability 15 13332 g004
Figure 5. EI of the 92 sample resource-based cities.
Sustainability 15 13332 g005
Figure 6. Heat map of EI in 2013, 2016, and 2019 (Gro = growth; Mat = maturity; Rec = recession; Reg = regeneration).
Sustainability 15 13332 g006
Figure 7. RW of the 92 sample resource-based cities.
Sustainability 15 13332 g007
Figure 8. Heat map of RW in 2013, 2016, and 2019 (Gro = growth; Mat = maturity; Rec = recession; Reg = regeneration).
Sustainability 15 13332 g008
Figure 9. Scatter map of EE, EI efficiency, and RW efficiency of the 92 sample resource-based cities in 2013, 2016, and 2019 (i = 3, 6, 9).
Sustainability 15 13332 g009
Figure 10. Classification of each path and orientation suit for each type of resource-based city.
Sustainability 15 13332 g010
Table 1. Number and characteristics of each type of resource-based city in China.
City TypeNumberCharacteristics
Growth31The resource development of growth resource-based cities is in an ascending phase, with significant potential for resource security. These cities possess strong economic and social development momentum, positioning them as crucial suppliers and reserve bases for energy resources in China.
Maturity141The resource development of maturity resource-based has reached a stable phase, characterized by robust resource security capabilities. These cities boast a higher level of economic and social development, making them the pivotal hub for ensuring energy resource security in China.
Recession67In recession resource-based cities, resources are depleting, economic development lags behind, social issues become pronounced, and ecological environmental pressures intensify. These cities represent pivotal and challenging areas where expediting the transformation of economic development is of paramount importance.
Regeneration23The regeneration cities have largely overcome their reliance on resources, propelling their economic and social realms onto a virtuous developmental trajectory. These cities serve as pioneering regions for the transformation of economic development.
Table 2. Research data.
ClassIndicatorUnitDescription/
Basis for Indicator Selection
Inputs (for Stage I)Land areakm2Administrative area/
Literature study: [15,21]
Labor force104 personsNumber of the labor force in the primary, secondary, and tertiary industries/
Literature study: [15,21]
Energy consumption104 tConverting to standard coal/
Literature study: [15,21]
Intermediate outputs (for Stage I)GDP104 USD—/
Literature study: [15,21]
Pollution indicatorEquations (5) and (6)/
Literature study: [43]
CO2 emissions104 t—/
Literature study: [21]
Intermediate outputs (for Stage II)R&D expenses104 USDExpenses in research and development/
Literature study: [15]
Education expenses104 USD—/
Literature study: [21]
Environmental regulationEquations (7)–(9)/
Literature study: [44]
Outputs (for Stage II)Green patentsA unitNumber of green patent applications/
Literature study: [15]
Researchers in R&DPersonResearchers in research and development/
Literature study: [15]
Internet popularizationPer 100 personsNumber of people who use Internet among 100 persons/
Literature study: [33]
IncomeUSDThe average salary of employees/
Literature study: [21]
Health careA unitNumber of hospitals and health centers/
Literature study: [21]
Education104 personsNumber of middle school and primary school students in school/
Literature study: [21]
Average housing priceUSD—/
Literature study: [34]
Condition variable (for fsQCA)Per capita GDPUSDPer capita GDP/
Literature study: [40]
Industrial structure%The proportion of the value of the tertiary industry to GDP/
Literature study: [40]
City size104 personsThe population at the end of the year/
Literature study: [40]
Tech innovationScoreThe score of technological innovation ability/
Literature study: [40]
City typeGrowth, maturity, recession, and regeneration/
Literature study: [9,25]
Export dependence%The proportion of exports to GDP/
Literature study: [40]
Table 3. Calibration anchors.
ConditionsCompletely AffiliatedIntersectionsCompletely Unaffiliated
EE0.62120.40760.2711
EI0.60910.29350.1350
RW1.00000.58980.3266
Per capita GDP0.38780.25030.1920
Industrial structure0.72320.60560.4838
City size0.43200.29920.2217
Tech innovation0.64730.48050.2955
City type0.70000.40000.1000
Export dependence0.31480.18750.1389
Table 4. Analysis of necessary conditions.
ConditionsHigh EEHigh EIHigh RW
ConsistencyCoverageConsistencyCoverageConsistencyCoverage
High per capita GDP0.6120.6430.6250.6580.4070.424
Non-high per capita GDP0.4800.4470.4800.4480.6840.631
High industrial structure0.4680.4520.5140.4980.5450.522
Non-high industrial structure0.6230.6300.6030.6100.5420.542
High city size0.6820.6720.4390.4340.5280.516
Non-high city size0.4100.4050.6650.6600.5750.563
High tech innovation0.6830.6790.5420.5400.3930.388
Non-high tech innovation0.4100.4030.5710.5620.6960.676
High city type0.6060.4960.7310.5990.6810.552
Non-high city type0.5180.6460.4250.5310.4520.559
High export dependence0.6070.6400.5730.6060.4570.478
Non-high export dependence0.4700.4360.5260.4890.6280.578
Table 5. Configuration analysis of high efficiency in various stages.
ConditionsHigh EEHigh EIHigh RW
H1aH1bH1cH1dH1eH2aH2bH2cH3aH3b
Per capita GDP
Industrial structure
City size
Tech innovation
City type
Export dependenceSustainability 15 13332 i001Sustainability 15 13332 i001
Consistency0.9550.8860.8550.8600.9250.8930.9210.9390.9020.902
Raw coverage0.2120.2690.1200.0850.0760.1900.1320.1690.1780.131
Unique coverage0.0390.0960.0560.0130.0120.1060.0470.0850.0780.030
Solution consistency0.8590.9090.912
Solution coverage0.4320.3230.208
Note: Black circles (●) refer to the presence of conditions, and circles with “×” (⊗) represent the absence of conditions. Large circles represent the core condition; small circles indicate the peripheral condition. The blank means that the presence or not of this condition has no impact on the results.
Disclaimer/Publisher’s Note: The statements, opinions and data contained in all publications are solely those of the individual author(s) and contributor(s) and not of MDPI and/or the editor(s). MDPI and/or the editor(s) disclaim responsibility for any injury to people or property resulting from any ideas, methods, instructions or products referred to in the content.

