
Comprehensive Evaluation of Agricultural Water Resources’ Carrying Capacity in Anhui Province Based on an Improved TOPSIS Model

Abstract
:1. Introduction
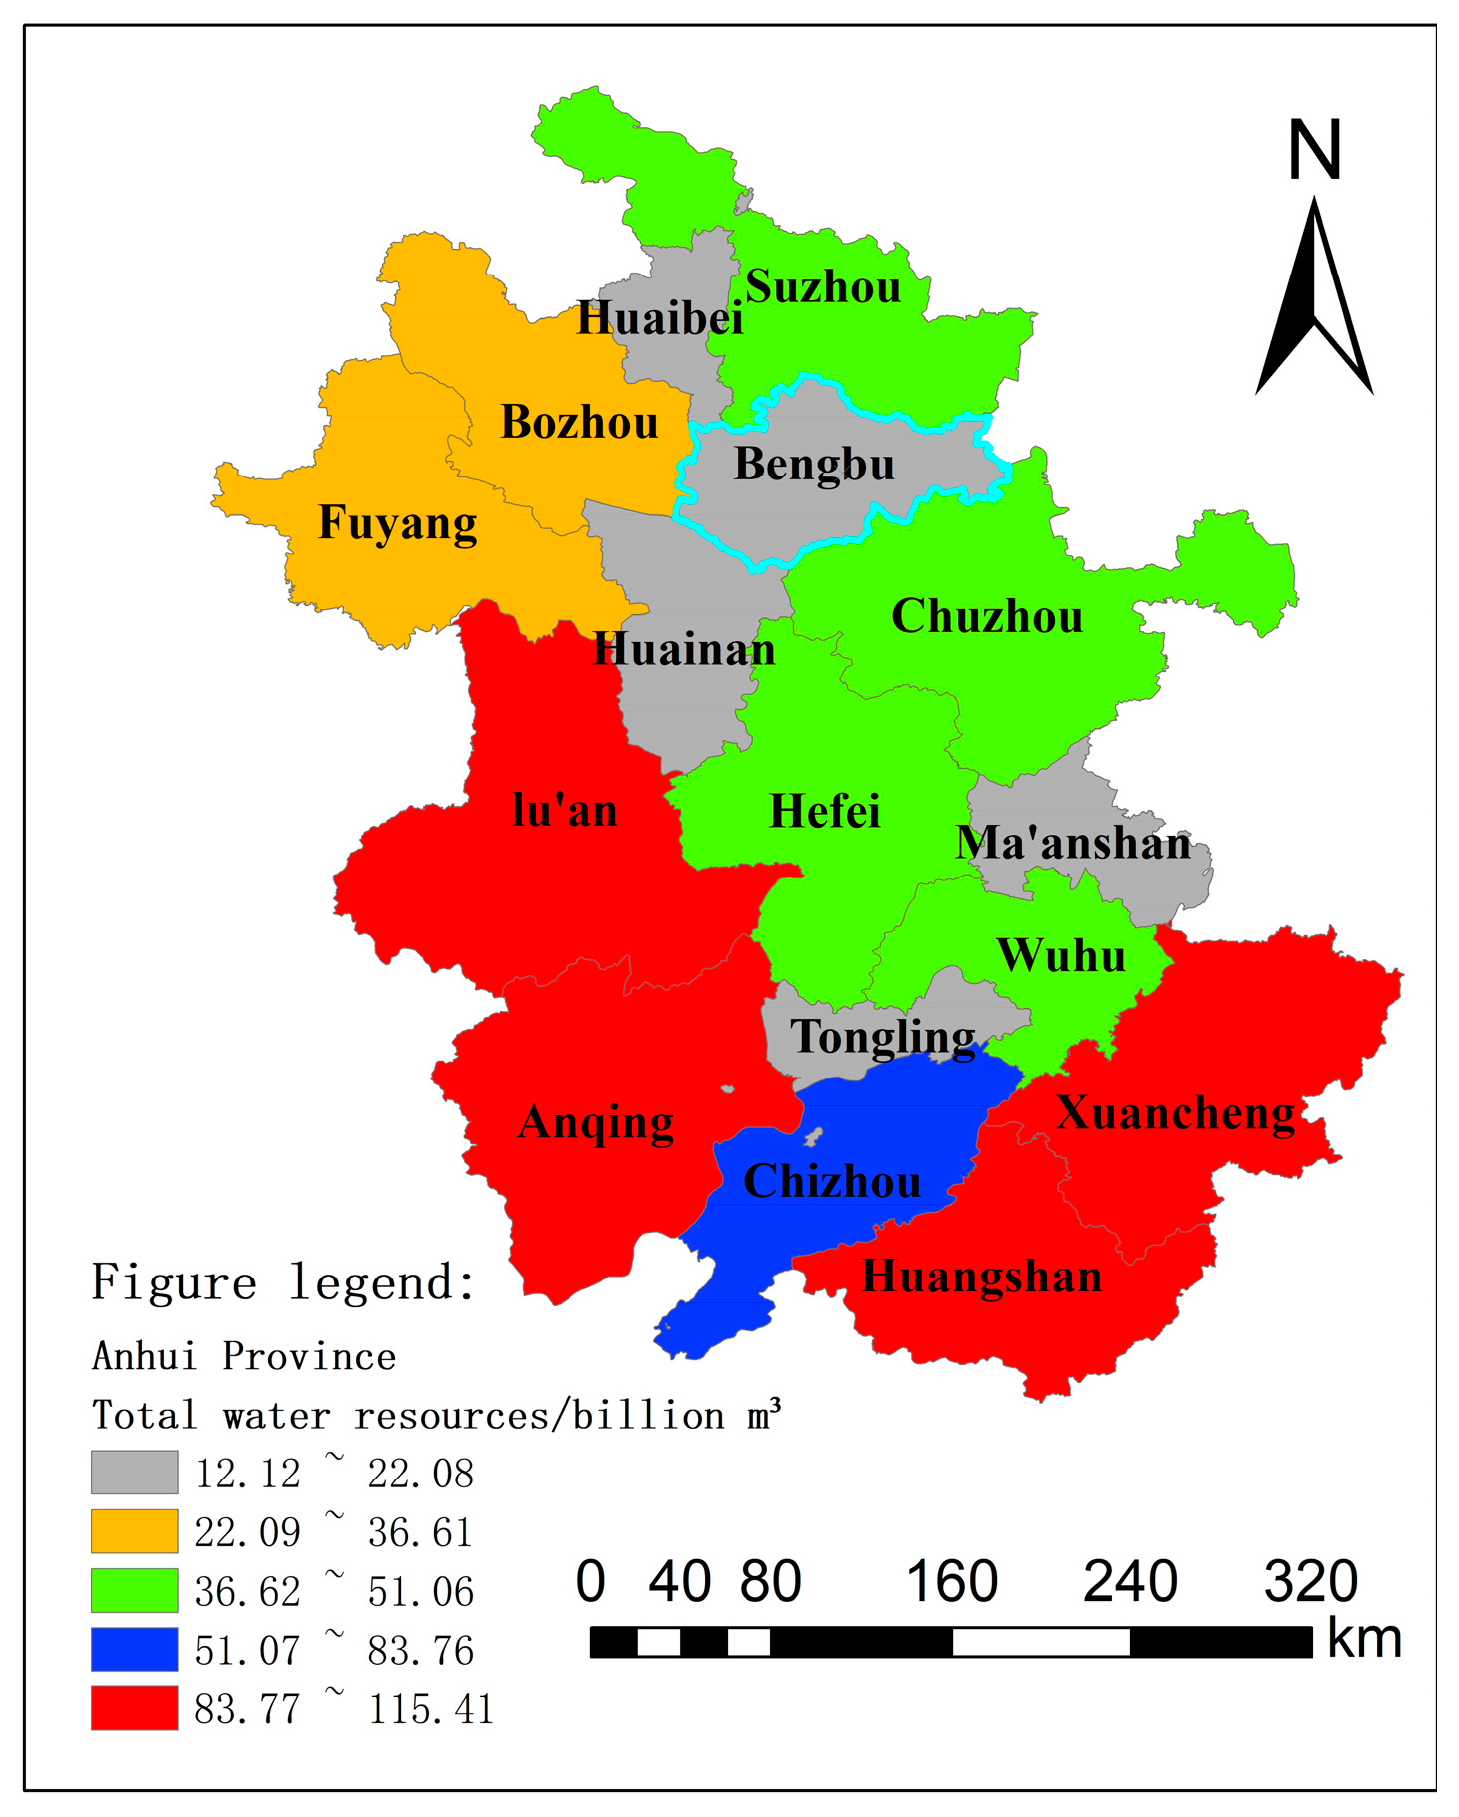
2. Study Area
3. Materials and Methods
3.1. Data Sources
3.2. Evaluation Index System
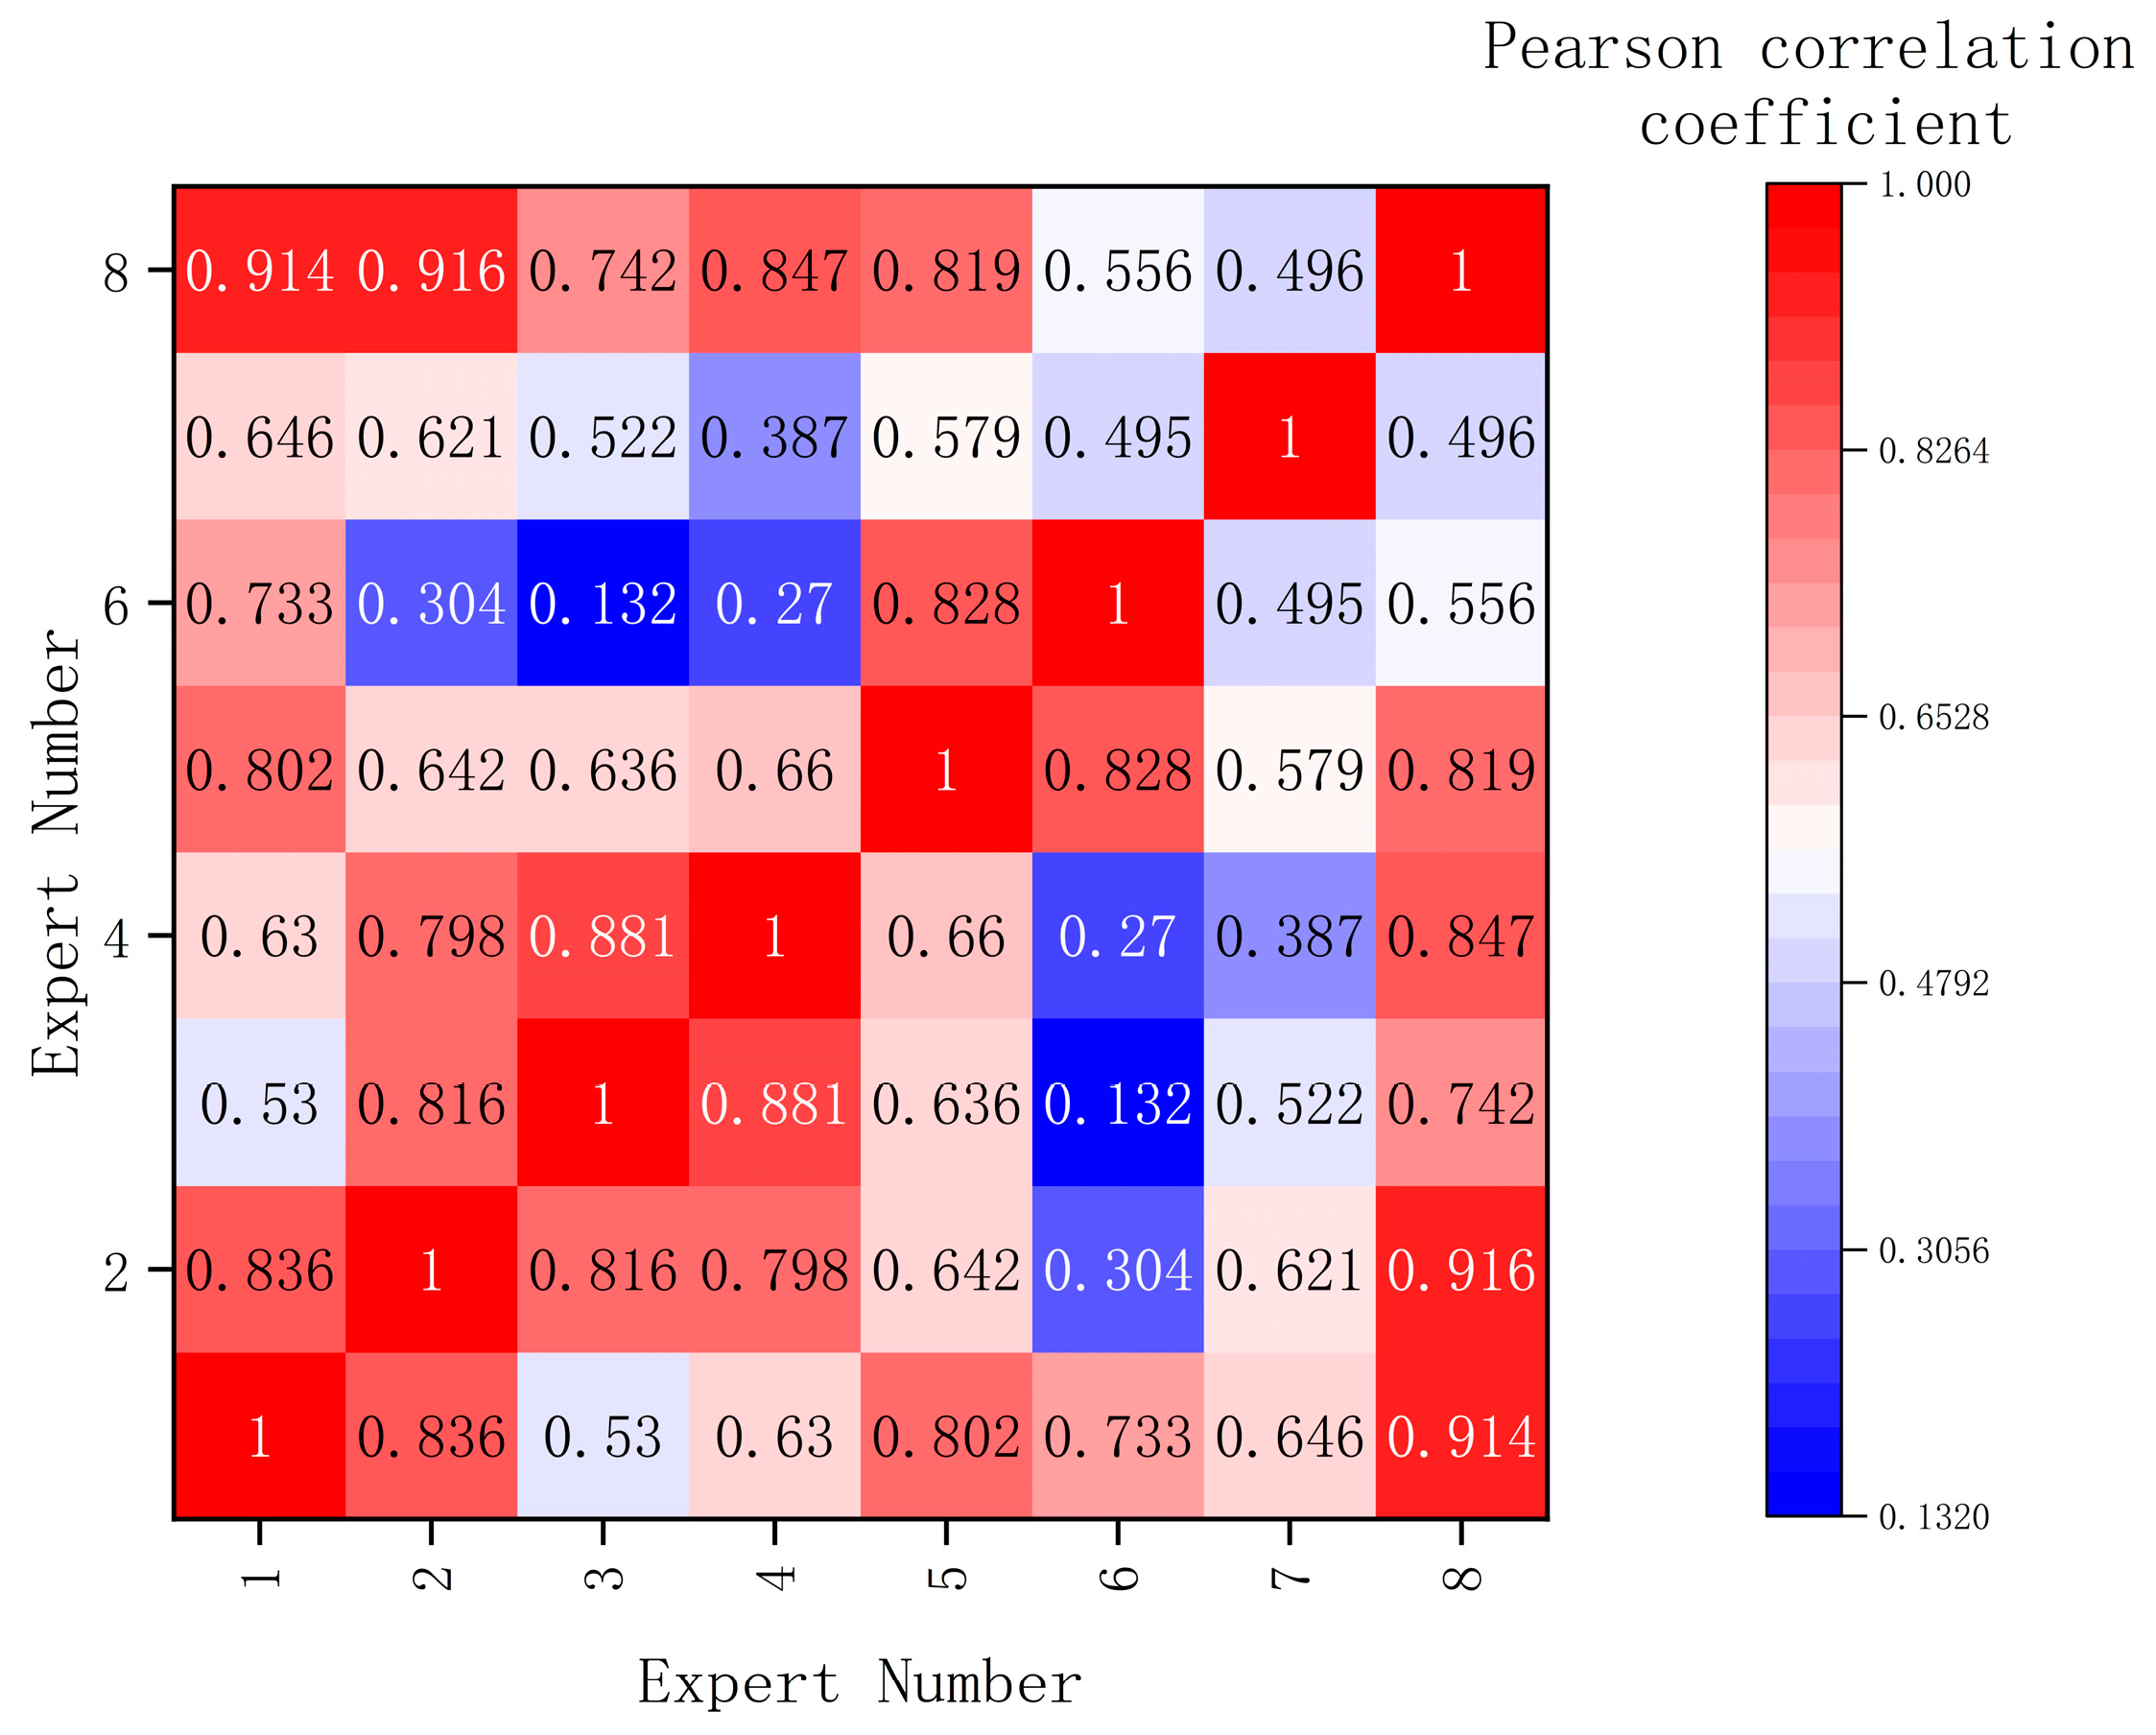
3.3. Structural Entropy Weight Method
3.4. EWM
3.5. Portfolio Weights
3.6. TOPSIS
4. Results and Discussion
4.1. Results of Weight Calculation
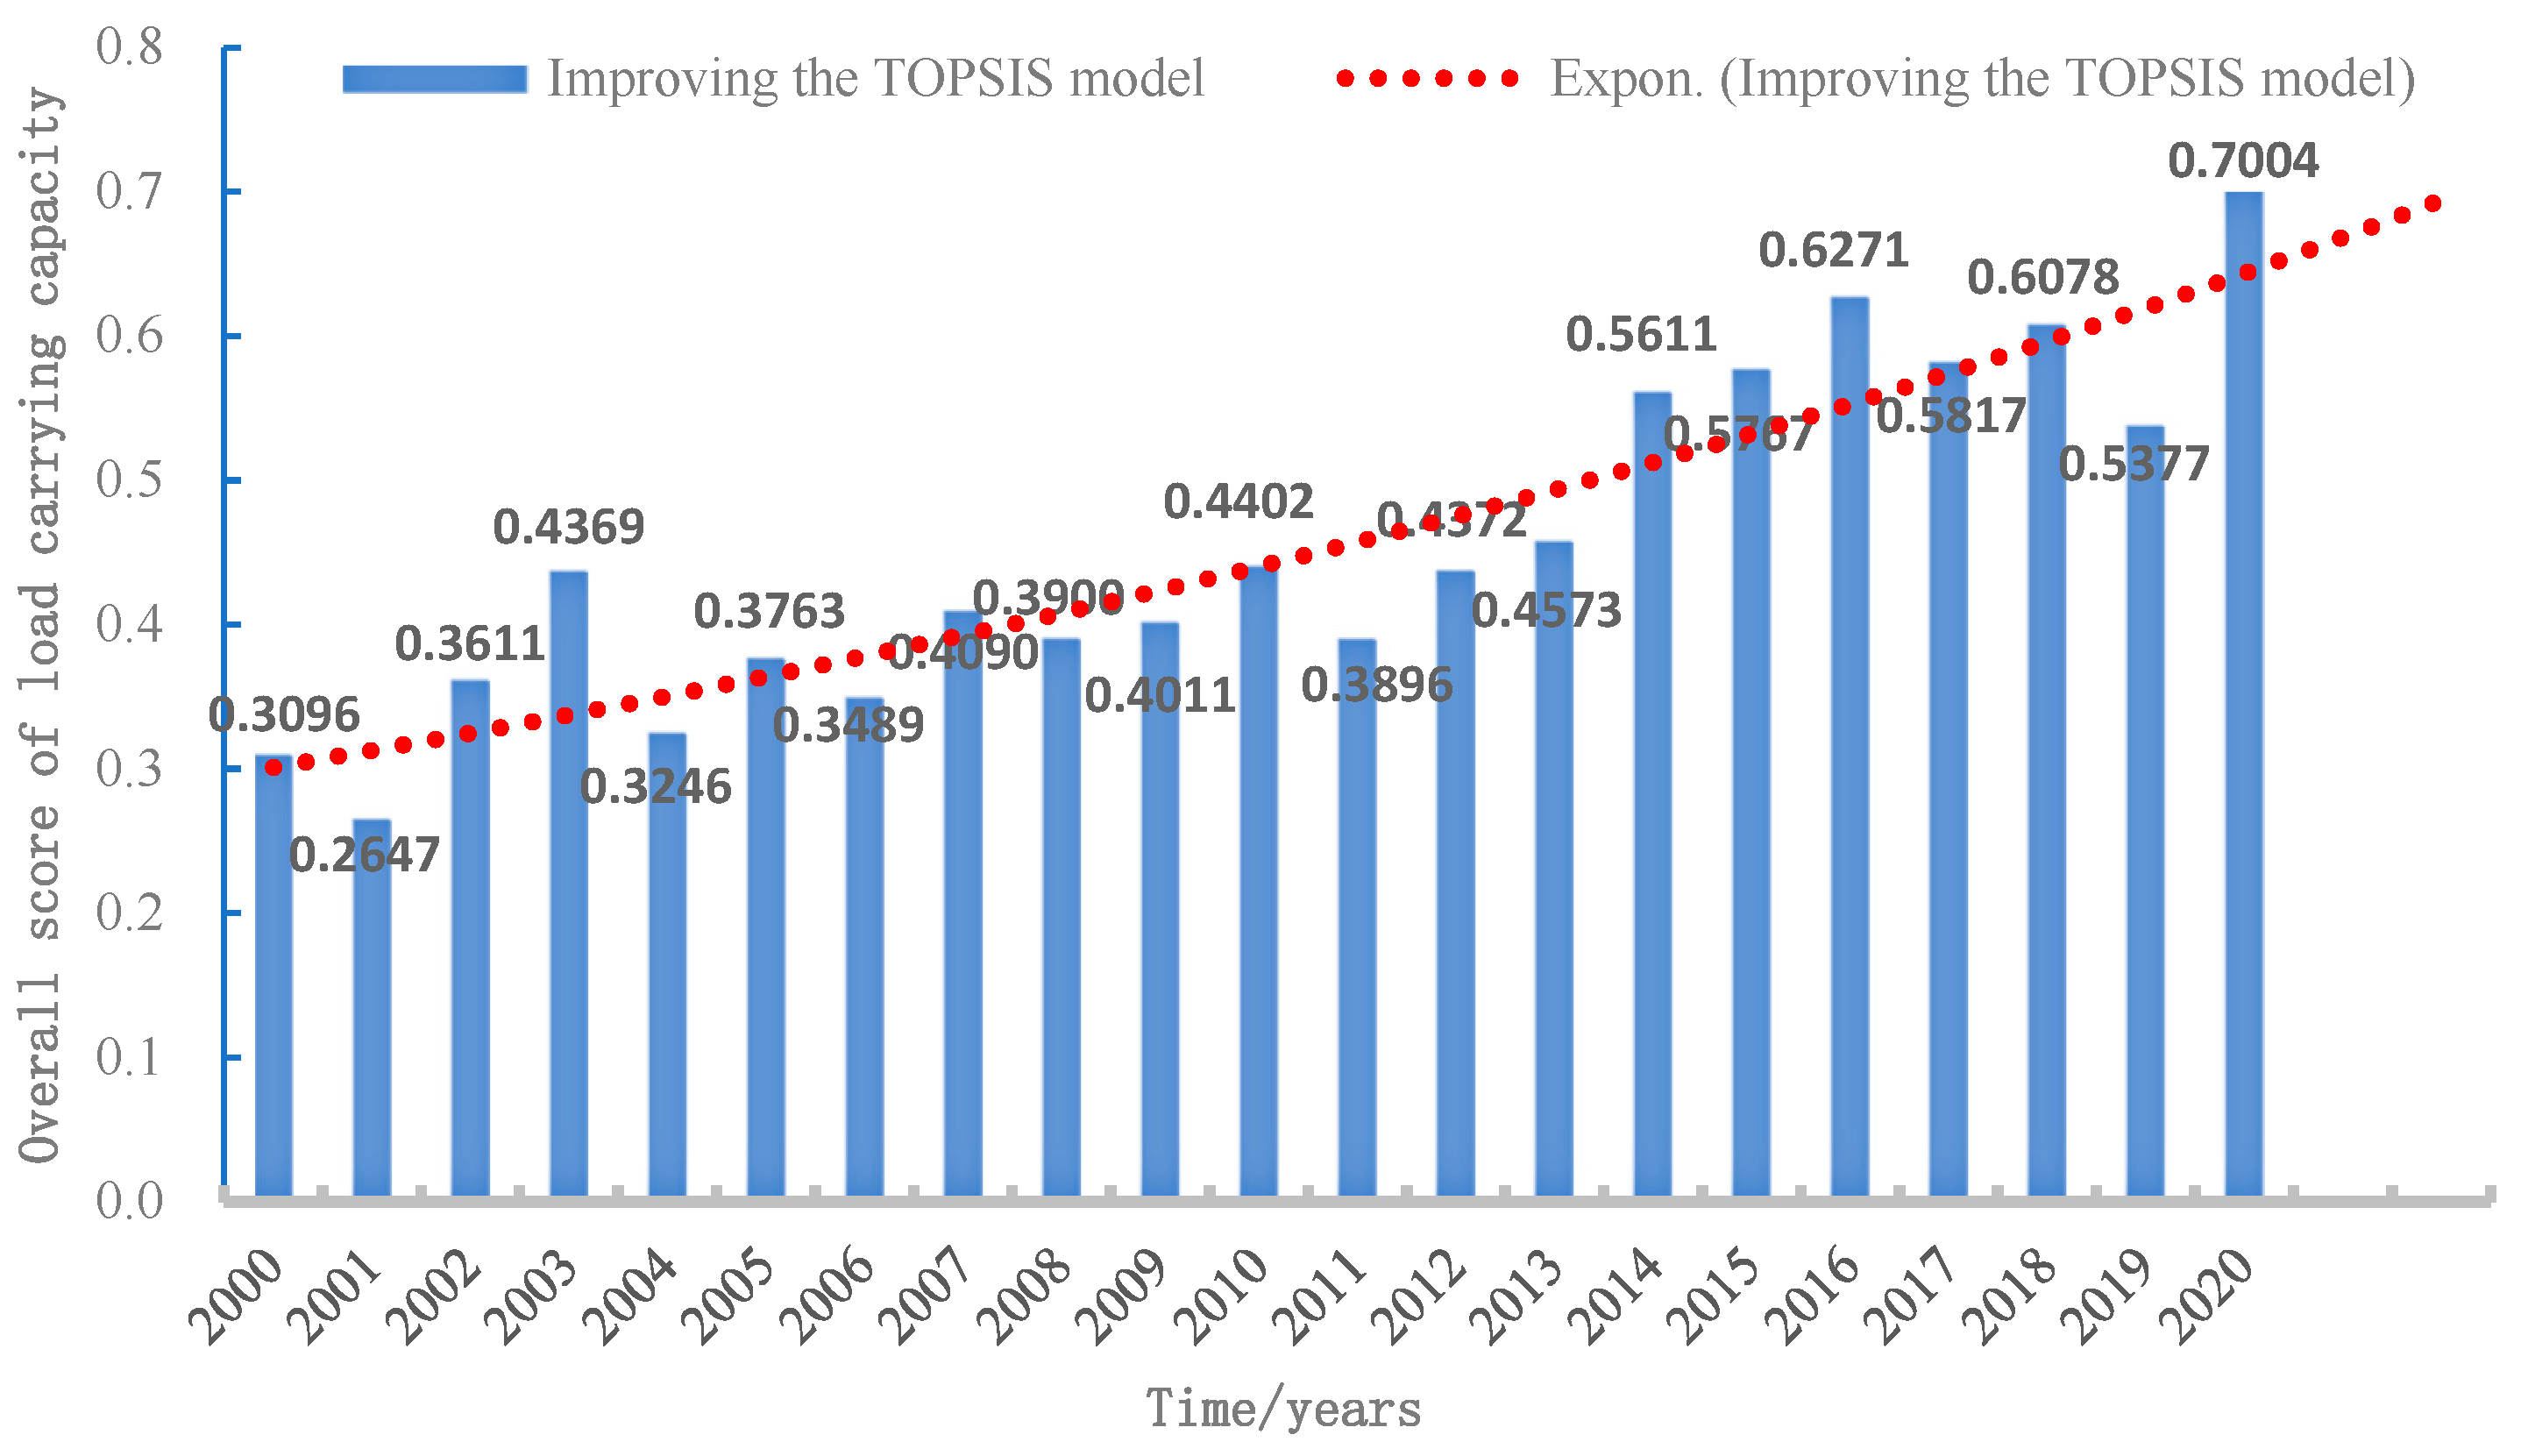
4.2. Carrying Capacity Evaluation Results
5. Conclusions
- Specifically, this paper utilizes an improved structural entropy weight method based on the traditional TOPSIS model to determine the weight of each evaluation index. This approach effectively addresses the issue of subjective and objective bias, resulting in weights that better reflect the actual situation in Anhui Province. Moreover, by employing weighted gray correlation instead of Euclidean distance, the paper successfully overcomes the challenge of distinguishing evaluation results that are close to each other. The enhanced TOPSIS model demonstrates strong adaptability in evaluating the carrying capacity of agricultural water resources in Anhui Province. The obtained evaluation results can serve as a valuable reference for formulating policies for the sustainable development of agricultural water resources in the region.
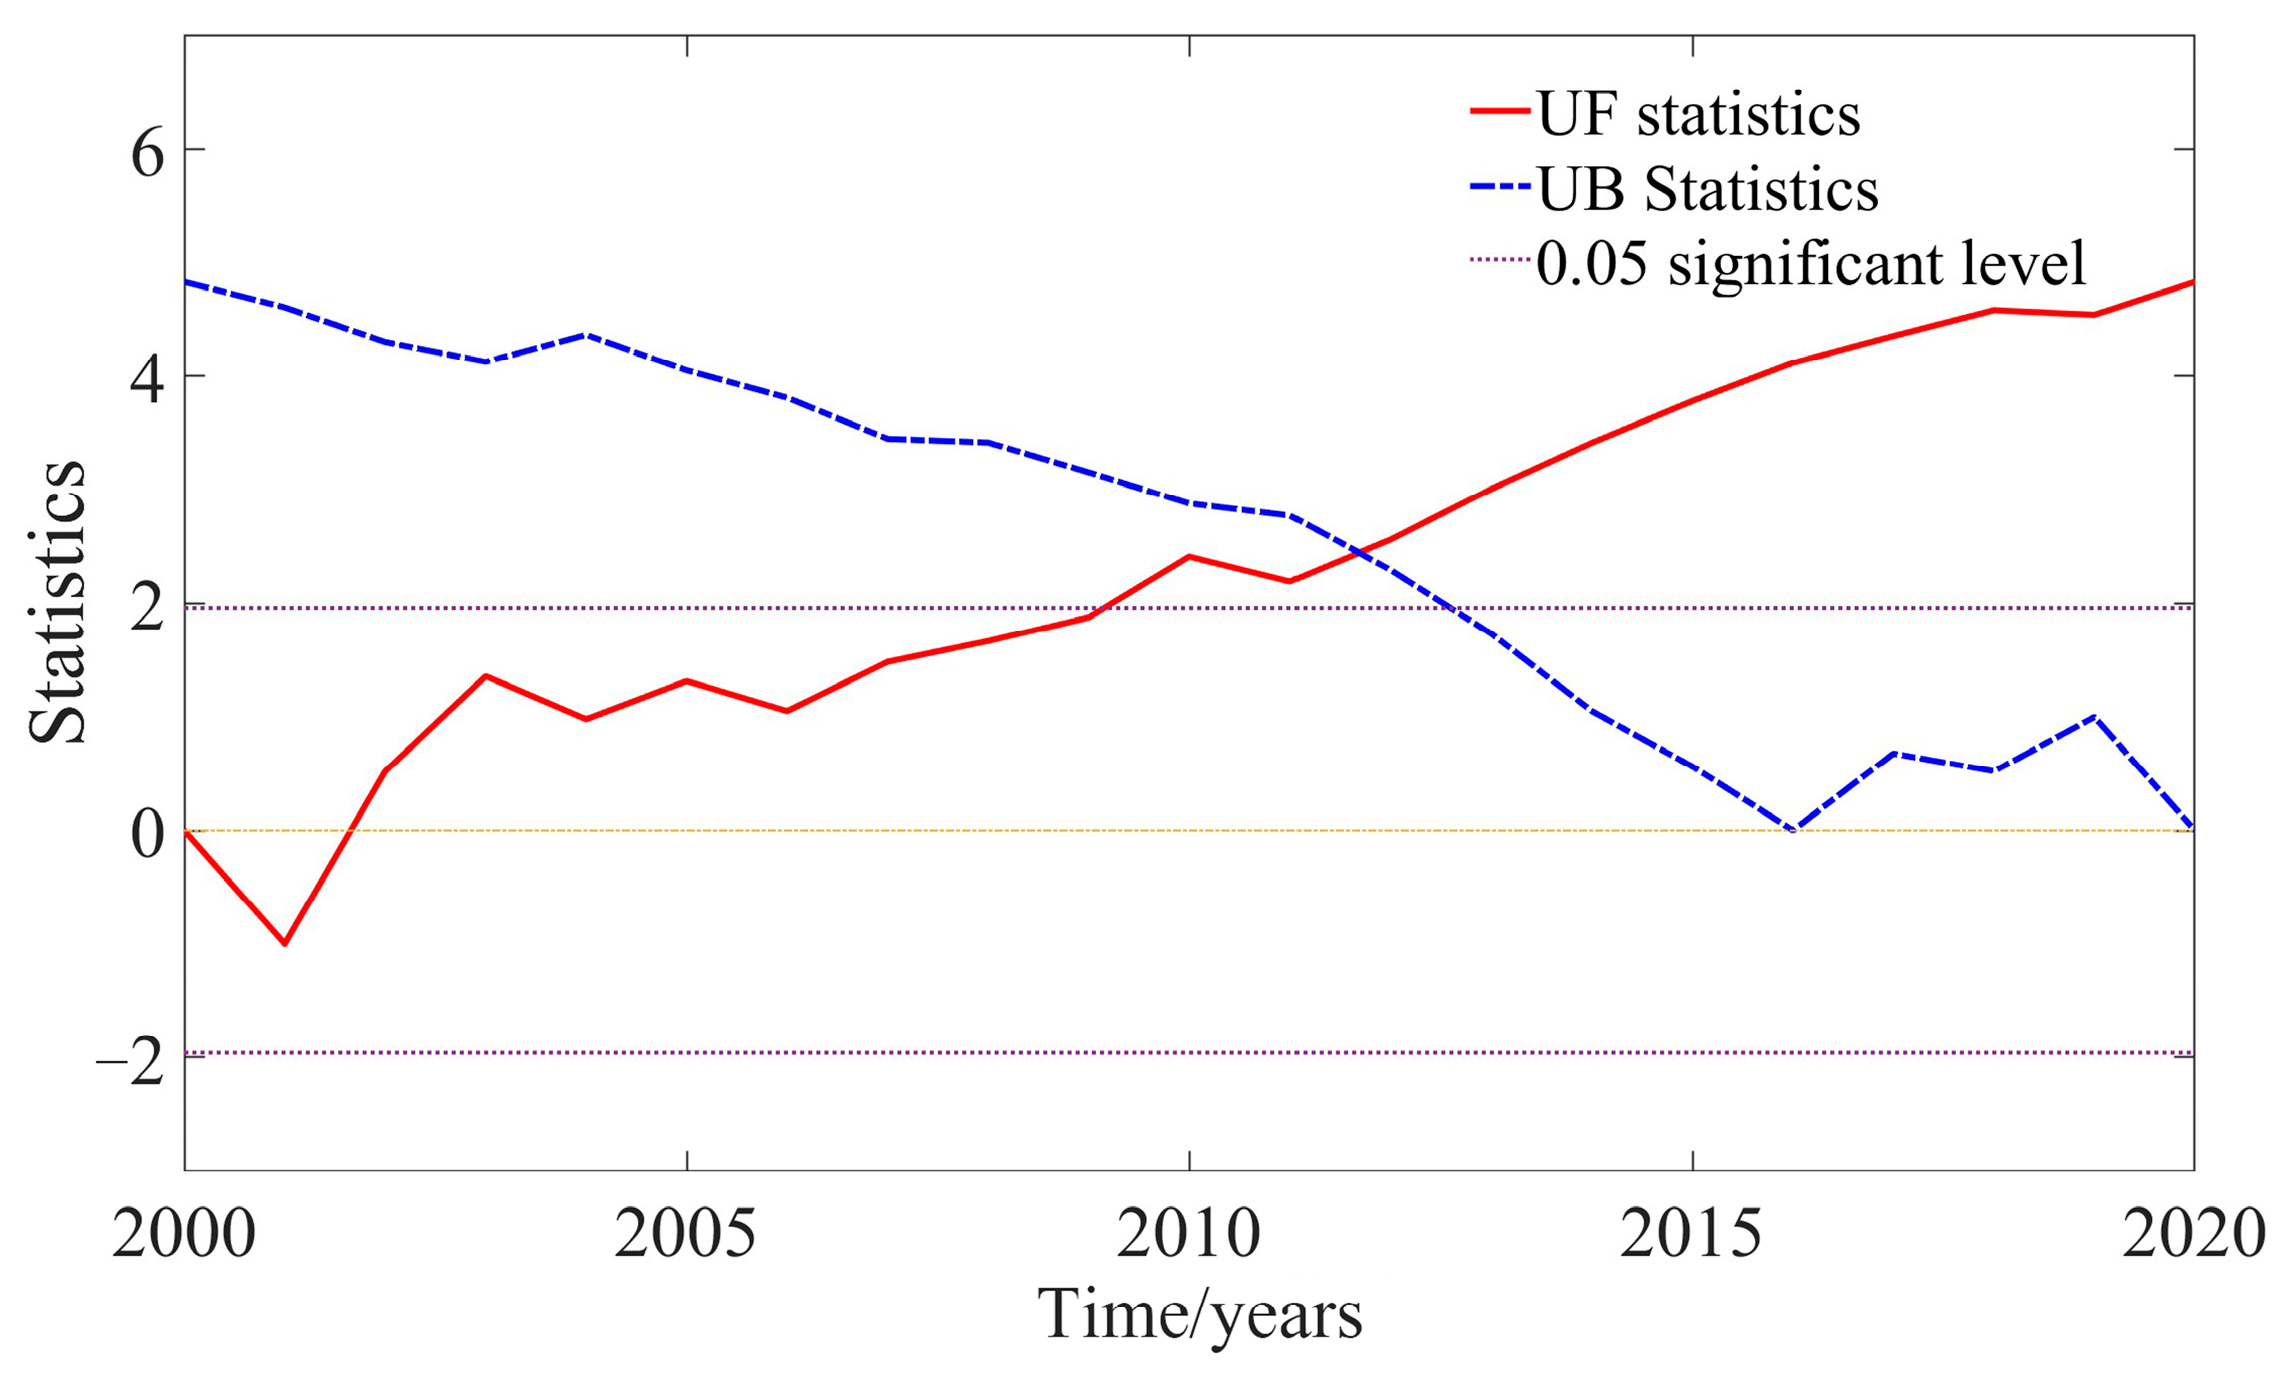
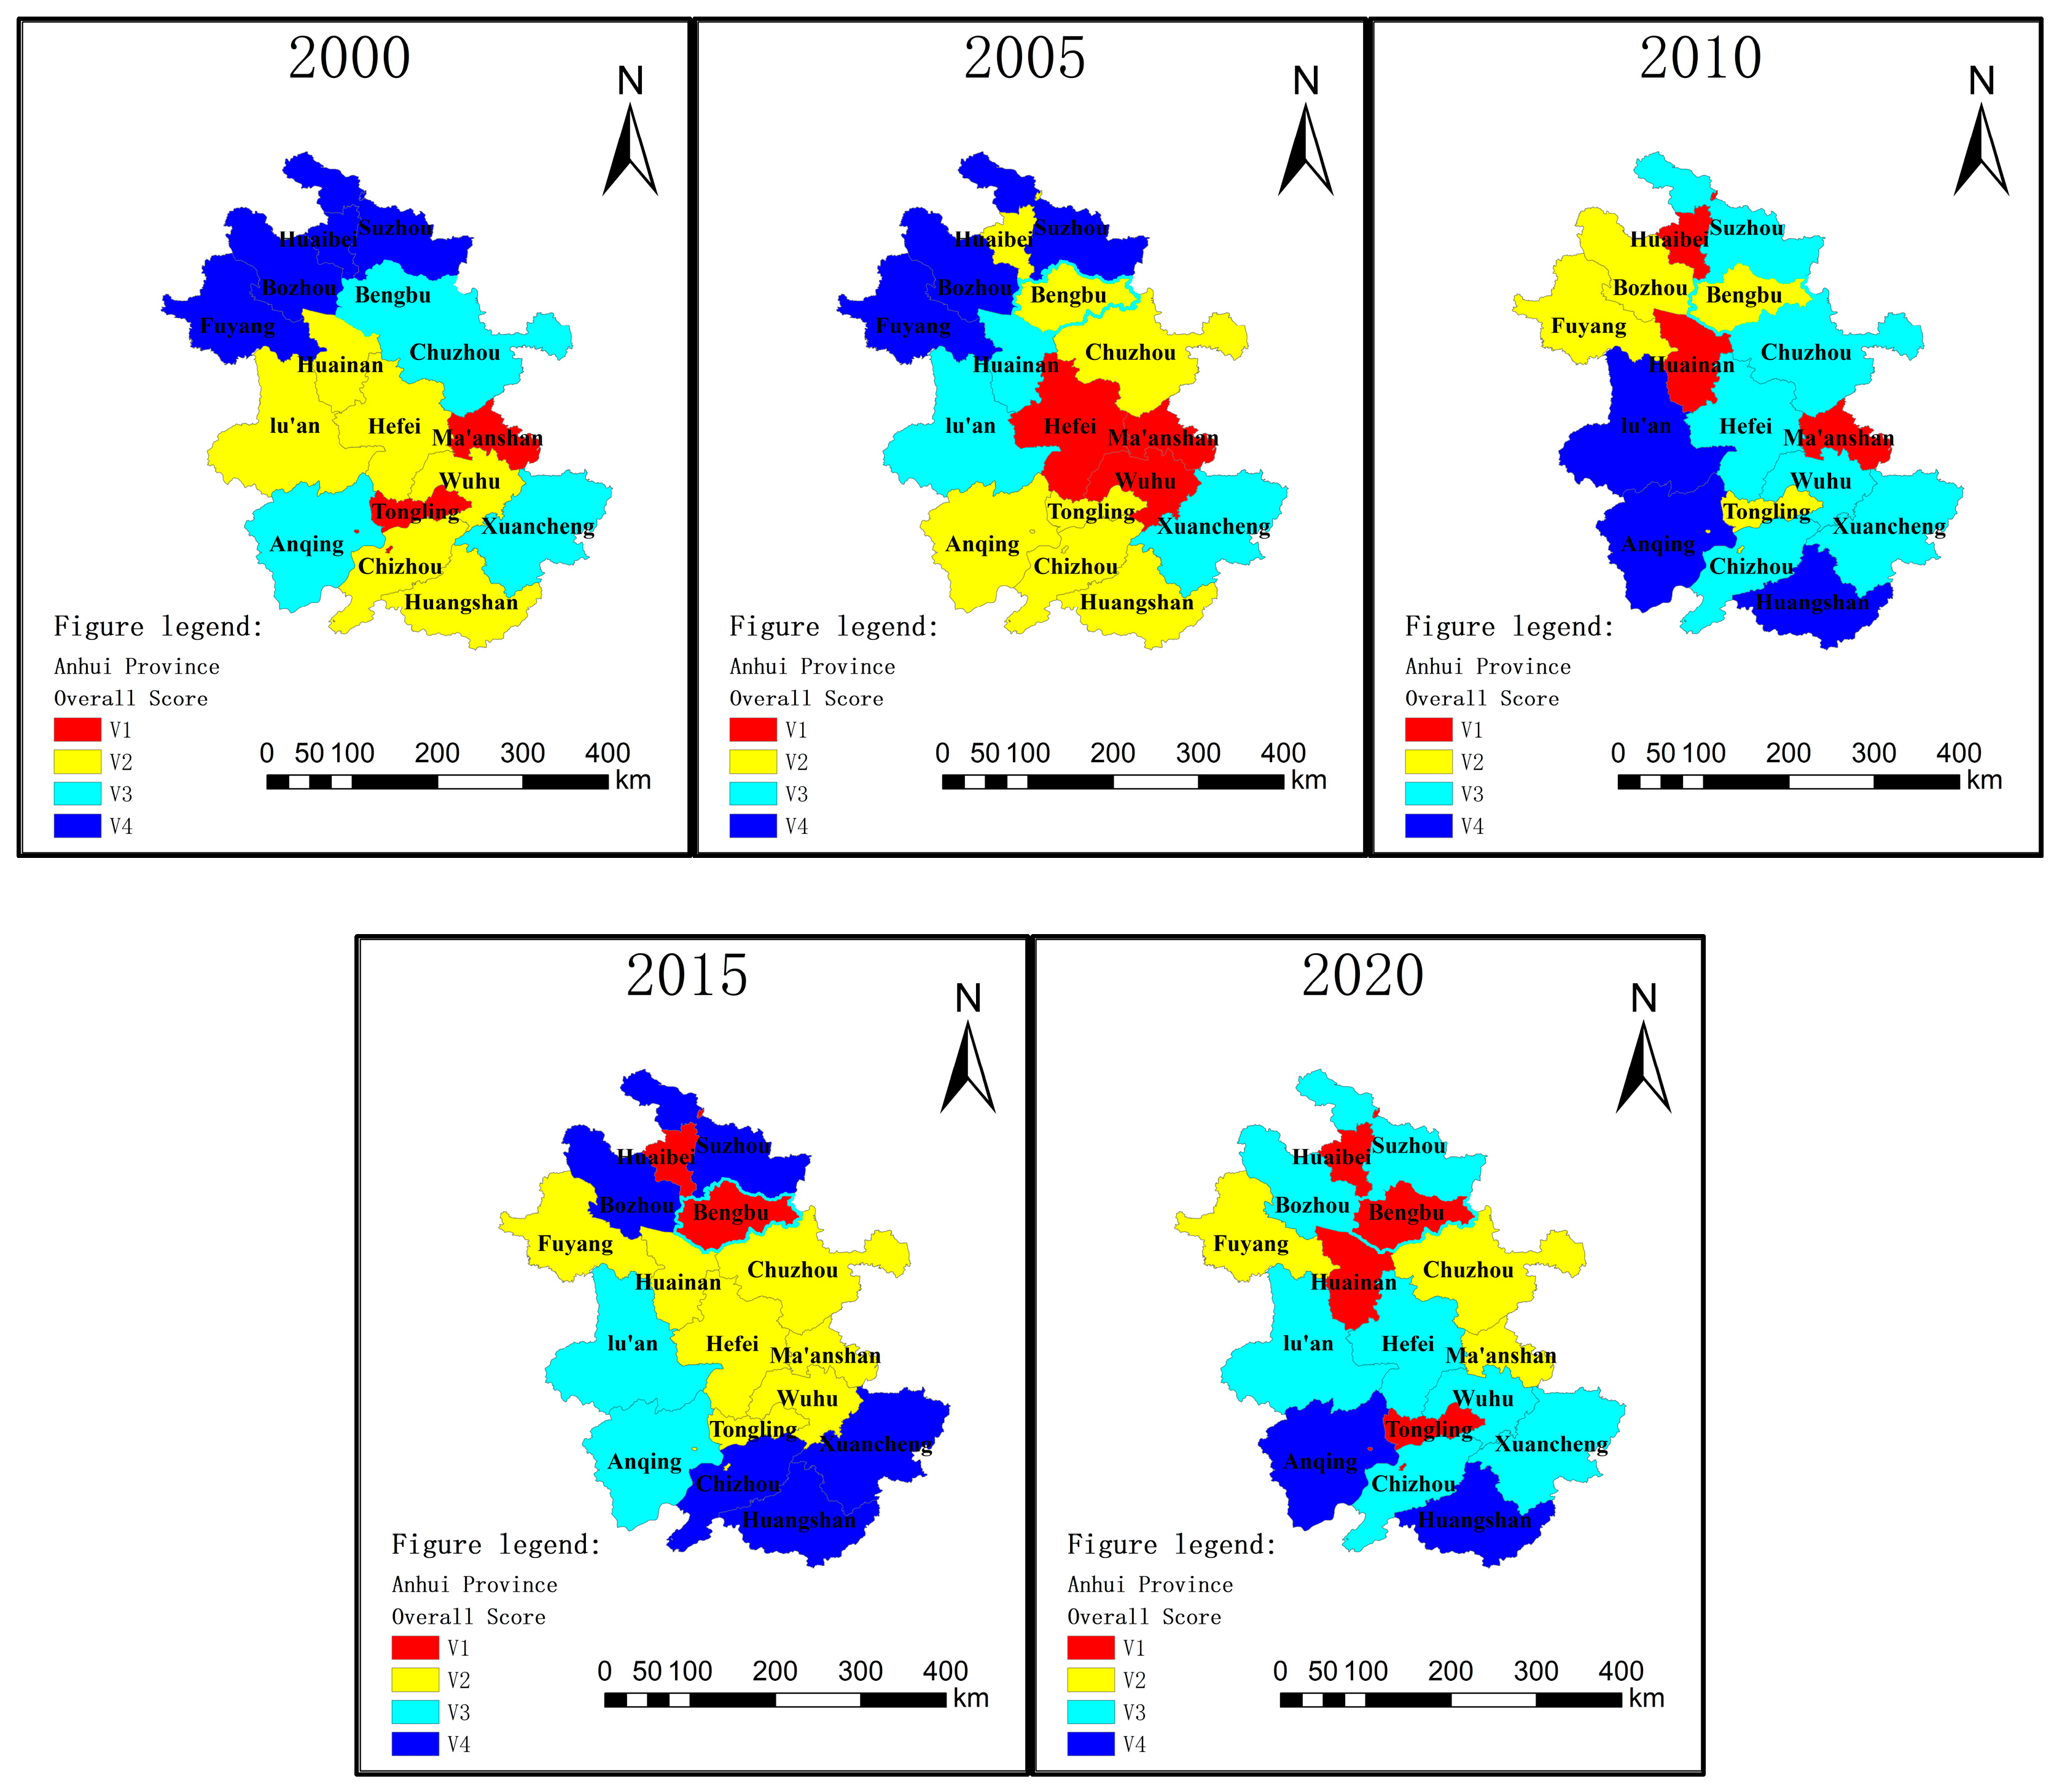
- Notably, the overall carrying capacity of agricultural water resources in Anhui Province exhibits a fluctuating upward trend. Specifically, the lowest carrying capacity was observed in 2001 with a comprehensive score of 0.2647, while the highest carrying capacity occurred in 2020 with a comprehensive score of 0.7004. Furthermore, the M-K trend test indicates a potential future increase in the carrying capacity of agricultural water resources in Anhui Province, suggesting that Anhui Province is likely to experience greater carrying capacity.
- Looking ahead, Anhui Province should prioritize the sustainable use of agricultural water resources and the coordinated utilization of water resources in different areas. The government can play a crucial role by formulating relevant policies to address these issues. It is essential to enhance agricultural water resource management and promote the construction of water-saving facilities in agricultural fields. Additionally, real-time monitoring of water usage in agriculture should be implemented to ensure efficient and responsible water practices. Moreover, active efforts should be made to foster the development of high-standard farmland and promote high-quality agriculture. These measures will contribute to the sustainable development of agricultural water resources in Anhui Province.
Author Contributions
Funding
Institutional Review Board Statement
Informed Consent Statement
Data Availability Statement
Conflicts of Interest
References
- Li, J.H. Global water shortage and food crisis. Ecol. Econ. 2021, 37, 5–8. [Google Scholar]
- Shi, X.X.; Yuan, C.L.; Qian, H.; Xu, P.P.; Zheng, L. Evaluation of water resources carrying capacity and obstacle factors in Hebei Province based on the DPSIR-TOPSIS model. J. Water Resour. Water Eng. 2021, 32, 92–99. [Google Scholar]
- Xu, L.; Chen, J.; Liu, C. Comparison of irrigation water efficiency and influencing factors between small farmers and new types of agricultural management entities. Resour. Sci. 2021, 43, 1821–1833. [Google Scholar]
- Zhu, Y.; Xiong, Y.J.; Su, P.L.; Gu, S.X. Evaluation of agricultural water resources carrying capacity in the water-receiving area of central Yunnan. Yangtze River 2020, 51, 97–102+208. [Google Scholar]
- Zhao, W.J.; Yang, B.; Yi, Y.H.; Feng, Q.; Liu, D. Synergistic activation of smithsonite with copper-ammonium species for enhanced surface reactivity and xanthate adsorption. Int. J. Min. Sci. Technol. 2023, 33, 519–527. [Google Scholar]
- Shen, Z.; Wen, S.; Wang, H.; Miao, Y.; Wang, X.; Meng, S.; Feng, Q. Effect of dissolved components of malachite and calcite on surface properties and flotation behavior. Int. J. Miner. Metall. Mater. 2023, 30, 1297–1309. [Google Scholar]
- An, Q.; Wei, C.J.; He, H.X.; Cui, Y.J.; Nie, Q.W. Evaluation of water resources carrying capacity in the Central Plains Urban Agglomeration of Henan Province based on fuzzy comprehensive evaluation. Water-Sav. Irrig. 2019, 12, 65–71. [Google Scholar]
- Yuan, Y.M.; Sha, X.J.; Liu, Y.Q.; Gao, Y.H.; Liu, J. Application of improved fuzzy comprehensive evaluation method in water resources carrying capacity evaluation. Water Resour. Prot. 2017, 33, 52–56. [Google Scholar]
- Li, L.; Jiang, T.L.; Li, L.; Ma, Y.L.; Sun, D.Y.; Huang, B.; Zhao, Z.Y. Evaluation and Prediction of Water Resources Carrying Capacity in Wuwei City Based on Fuzzy Comprehensive Evaluation and TOPSIS Model. Water Resour. Plan. Des. 2023, 69–74+107+122. Available online: https://kns.cnki.net/kcms2/article/abstract?v=WGc0za3-fmIPQtyB-Z5jZU9QyV23qb_06ScFmvYYuSkcOF9xp2poZhUhIhtON1YOtBcgPVYAs5bGpsVKeOfrAT2aLWOidsYZZWYN7jmq2s-mts0II5JMeRKi3pqPR-Wx-mJuW-Gjv_s=&uniplatform=NZKPT&language=CHS (accessed on 23 July 2023).
- Ren, J.Y.; Bing, J.P.; Zhang, X. Evaluation and adaptability analysis of water resources carrying capacity in Tianmen City. J. Yangtze River Sci. Res. Inst. 2018, 35, 27–31. [Google Scholar]
- Huang, L.; Zhang, L.Z.; Zhu, J.X.; Huo, Z.B. Analysis of temporal and spatial characteristics of water resources carrying capacity in Henan Province. South-to-North Water Transf. Water Sci. Technol. 2019, 17, 54–60. [Google Scholar]
- Xiao, J.; Zheng, G.Z.; Guo, P.J.; Luo, Y.; Guo, Z.S. Evaluation of water resources carrying capacity in the Guanzhong-Tianshui Economic Zone based on principal component analysis. Chin. Agric. Resour. Reg. Plan. 2018, 39, 159–167. [Google Scholar]
- Chen, W.J.; Yao, R.Y.; Shi, W.H.; Li, Q.; Zhao, J.K.; Zhang, Y.G. Simulation analysis of water resources carrying capacity in Tianjin City based on system dynamics model. J. Water Resour. Water Eng. 2023, 34, 42–51. [Google Scholar]
- Li, W.Y.; Zhao, L.L.; Weng, X.X.; Liu, Y.M.; Song, X.Y. Water resources carrying capacity of the Zhu-Ao region based on system dynamics. J. Water Resour. Water Eng. 2022, 33, 103–110+119. [Google Scholar]
- Song, S.Q.; Feng, Q.; Wang, P.G.; Tang, G.H.; Xiong, X.H.; Ji, Y. Evaluation of water resources carrying capacity in Jiangxi Province based on system dynamics model. People’s Pearl River 2023, 44, 74–83. [Google Scholar]
- Xue, Q.; Yang, K. Water resources carrying capacity prediction and regulation research in Jiangsu Province based on BP neural network-system dynamics coupling model. Water Resour. Hydropower Eng. (Chin. Engl.) 2022, 53, 86–99. [Google Scholar]
- Wu, X.; Liu, B.; Liu, J.; Wu, R.Z. Research on water resources carrying capacity based on multi-objective decision analysis. Water Hydropower Sci. 2021, 39, 42–45+9. [Google Scholar]
- Hao, Z.J.; Li, J.D.; Zheng, B. Evaluation of water resources carrying capacity in Qinzhou City based on multi-objective decision analysis. People’s Pearl River 2018, 39, 124–128. [Google Scholar]
- Li, R.Y.; Shu, L.C.; Lu, C.P.; Si, H.Y.; Wu, X.Y. Comparison and application of water resources carrying capacity evaluation methods in Jining City. Water Resour. Prot. 2018, 34, 65–70. [Google Scholar]
- Ma, J.M.; Tuo, Y.F.; Wang, Q.; Wang, F.; Zheng, Y. Evaluation of water resources carrying capacity and obstacle factor diagnosis in Yunnan Province based on GRA-TOPSIS method. J. Water Resour. Water Eng. 2022, 33, 11–17+26. [Google Scholar]
- Yang, H.Y.; Fu, K.; Sun, X.B.; Tan, Y.N. Comprehensive evaluation of water resources carrying capacity in Yantai City based on CRITIC-GR-TOPSIS method. Bull. Soil Water Conserv. 2021, 41, 215–221+305. [Google Scholar]
- Tian, P.; Zhang, Z.H.; Xu, X.Y.; Yan, F.; Wu, Y.J. Comprehensive evaluation of water resources carrying capacity in the Yangtze River Economic Belt based on variable-weight TOPSIS model. J. Cent. China Norm. Univ. (Nat. Sci.) 2019, 53, 755–764. [Google Scholar]
- Xia, H.; Chen, J.; Xu, Y.; Zhang, X.Y.; Shi, Z.Z. Research on Water Resources Carrying Capacity of Lianyungang City Based on Improved TOPSIS Model. Water-Sav. Irrig. 2019, 86–90+95. Available online: https://kns.cnki.net/kcms2/article/abstract?v=WGc0za3-fmKxnlxHo2gKBP69zP6JvwAzQmJBAhNshBNgBhLToLQive1J1PWF1eKIowooog_6Py35vctDV8pW8wU2aKA6aZ07gitX8mzAXrxokrXSR0rXni_MfRBDSYEI1f1z07IWAh8=&uniplatform=NZKPT&language=CHS (accessed on 23 July 2023).
- Wang, J.X.; Yang, Y.K.; Sheng, Q. Evaluation of water resources carrying capacity in Gansu Province based on improved TOPSIS model. Water Hydropower Sci. 2022, 40, 35–39. [Google Scholar]
- Chen, Y.Q.; Xi, H.Y.; Li, B.; Cheng, W.J. Application of improved TOPSIS method in evaluating rural drinking water safety in Gansu Province. J. Water Resour. Water Eng. 2022, 33, 27–34. [Google Scholar]
- Sun, Y.R.; Dong, Z.C.; Liu, M. Evaluation of Water Resources Carrying Capacity and Obstacle Factor Diagnosis in Yancheng City Based on Improved TOPSIS Method. China Rural. Water Hydropower 2018, 101–105. Available online: https://kns.cnki.net/kcms2/article/abstract?v=WGc0za3-fmK8twuG1UM1V4Nl5pZrhA4DM-SDum92DHIMgVdQruk84_6m876_Rey9aSCnfU9Xc7Zm0sv3l6a1u0eGcyZnTYRMDDiDQPt-AwWcNzmhOx3Py4CCzcnmumtkQ_g4BijSj_c=&uniplatform=NZKPT&language=CHS (accessed on 23 July 2023).
- Wang, R.; Chen, Y.; Chen, X.W. Construction of evaluation index system for regional water resources sustainable utilization. J. Nat. Resour. 2014, 29, 1441–1452. [Google Scholar]
- Kang, J.; Wang, J.H.; Wang, S.F. Research on agricultural water resources carrying capacity in the Haihe River Basin. Water Conserv. Hydropower Technol. 2020, 51, 47–56. [Google Scholar]
- Zhang, L.X.; Liu, S.Y.; Wang, P.; Zhang, R.H.; Wang, J.Y. Research on agricultural water resources carrying capacity evaluation in the middle reaches of the Heihe River based on principal component analysis. J. Land Nat. Resour. Res. 2023, 71–74. [Google Scholar] [CrossRef]
- Cheng, Q.Y. Note on the determination of evaluation index weight by structural entropy weight method. Syst. Eng. Theory Pract. 2010, 30, 1225–1228. [Google Scholar]
- Sun, Y.R.; Dong, Z.C.; Zhou, Y.; Feng, S.N. Assessment of water resources carrying capacity in the lower reaches of the Yangtze River based on structural entropy weight method: A case study of Nanjing City. People’s Yangtze River 2018, 49, 47–51. [Google Scholar]
- Wang, L.Z.; Jiang, Z.Y. P2P platform financial risk evaluation based on structural entropy-TOPSIS model. J. Syst. Sci. Complex. 2020, 28, 95–99+128. [Google Scholar]
- Xiao, Z.H.; Wang, X.C. Note on “structural entropy weight method for determining evaluation index weight”. Oper. Res. Manag. Sci. 2020, 29, 145–149. [Google Scholar]
- Gu, F.W.; Lu, J.; Xia, G.H. Face recognition method based on Facenet Pearson Discrimination Network. J. Intell. 2022, 17, 107–115. [Google Scholar]
- Yuan, L.; Yang, Z.X.; Long, H.X.; Chen, G.P.; Li, Q.J. Spatiotemporal evolution analysis of water resources carrying capacity in Kunming City based on entropy weight-TOPSIS model. Environ. Eng. 2023, 41, 202–209. (In Chinese) [Google Scholar]
- Zhao, M.; Wang, M.Y.; Yin, S.B. Ballistic target threat assessment based on CRITIC-GR-TOPSIS method. Mil. Oper. Res. Syst. Eng. 2023, 38, 27–33. [Google Scholar]
- Wang, J.; Li, J.; Wei, H.Y.; Tian, P. Evaluation of Regional Water Resources Carrying Capacity Prediction Based on TOPSIS Method: A Case Study of Guanzhong Region in Shaanxi Province. Soil Water Conserv. Res. 2008, 161–163. Available online: https://kns.cnki.net/kcms2/article/abstract?v=WGc0za3-fmK1OrDZJtiKcZgvyfGW0TXLEMc8qsacCk7aJra6nVrrumhiydeSvZUVs4mW_G-OryyUSpkVEdXN0JQuYzdhDdfJMTB1rr5SnKI2AmqcsxkxxEmAR4Whj5bh&uniplatform=NZKPT&language=CHS (accessed on 23 July 2023).
- Xu, Z.H.; Cao, Y.M. Evaluation of water resources carrying capacity in Changchun City based on entropy weight-TOPSIS model. J. Saf. Environ. 2022, 22, 2900–2907. (In Chinese) [Google Scholar] [CrossRef]
- Jiang, Y.; Fu, J.C.; Li, Z.W.; Zhang, Y.Q.; Yin, J.G.; Yao, J.G. Evaluation of comprehensive index of building based on improved TOPSIS. J. Shanghai Jiao Tong Univ. 2023, 57, 868–877. (In Chinese) [Google Scholar]
- Liu, Y.F.; Yuan, Z.H.; Guo, L.X.; Feng, J.M.; Kong, W.; Dang, C.M. Analysis of spatiotemporal characteristics and influencing factors of green growth level in cities in Shaanxi Province. J. Nat. Resour. 2022, 37, 200–220. [Google Scholar]
- Yang, Q.Y.; Li, J.B.; Wang, K.L.; Xie, J.N. Evaluation of water resources development and utilization degree in Hunan Province. Bull. Soil Water Conserv. 2007, 150–153. [Google Scholar] [CrossRef]


| Target Layer | Guideline Layer | Indicator Layer | Unit | Indicator Meaning | Characteristic |
|---|---|---|---|---|---|
| Agriculture Industry Water Resources Source Undertake Load Force A | Water system B1 | Total water resources C1 | 108 m3 | - | Positive |
| Groundwater resources C2 | 108 m3 | - | Positive | ||
| Rainfall C3 | 108 m3 | - | Positive | ||
| Socio-economic system B2 | Arable land area C4 | hectares | - | Positive | |
| Food production per capita C5 | Kg/person | Total food production/agricultural population | Positive | ||
| Agricultural output per capita C6 | Yuan/person | Total agricultural output value/agricultural population | Positive | ||
| Agricultural water resource development and utilization system B3 | Effective irrigated area ratio C7 | % | Effective irrigated area/cultivated land area | Positive | |
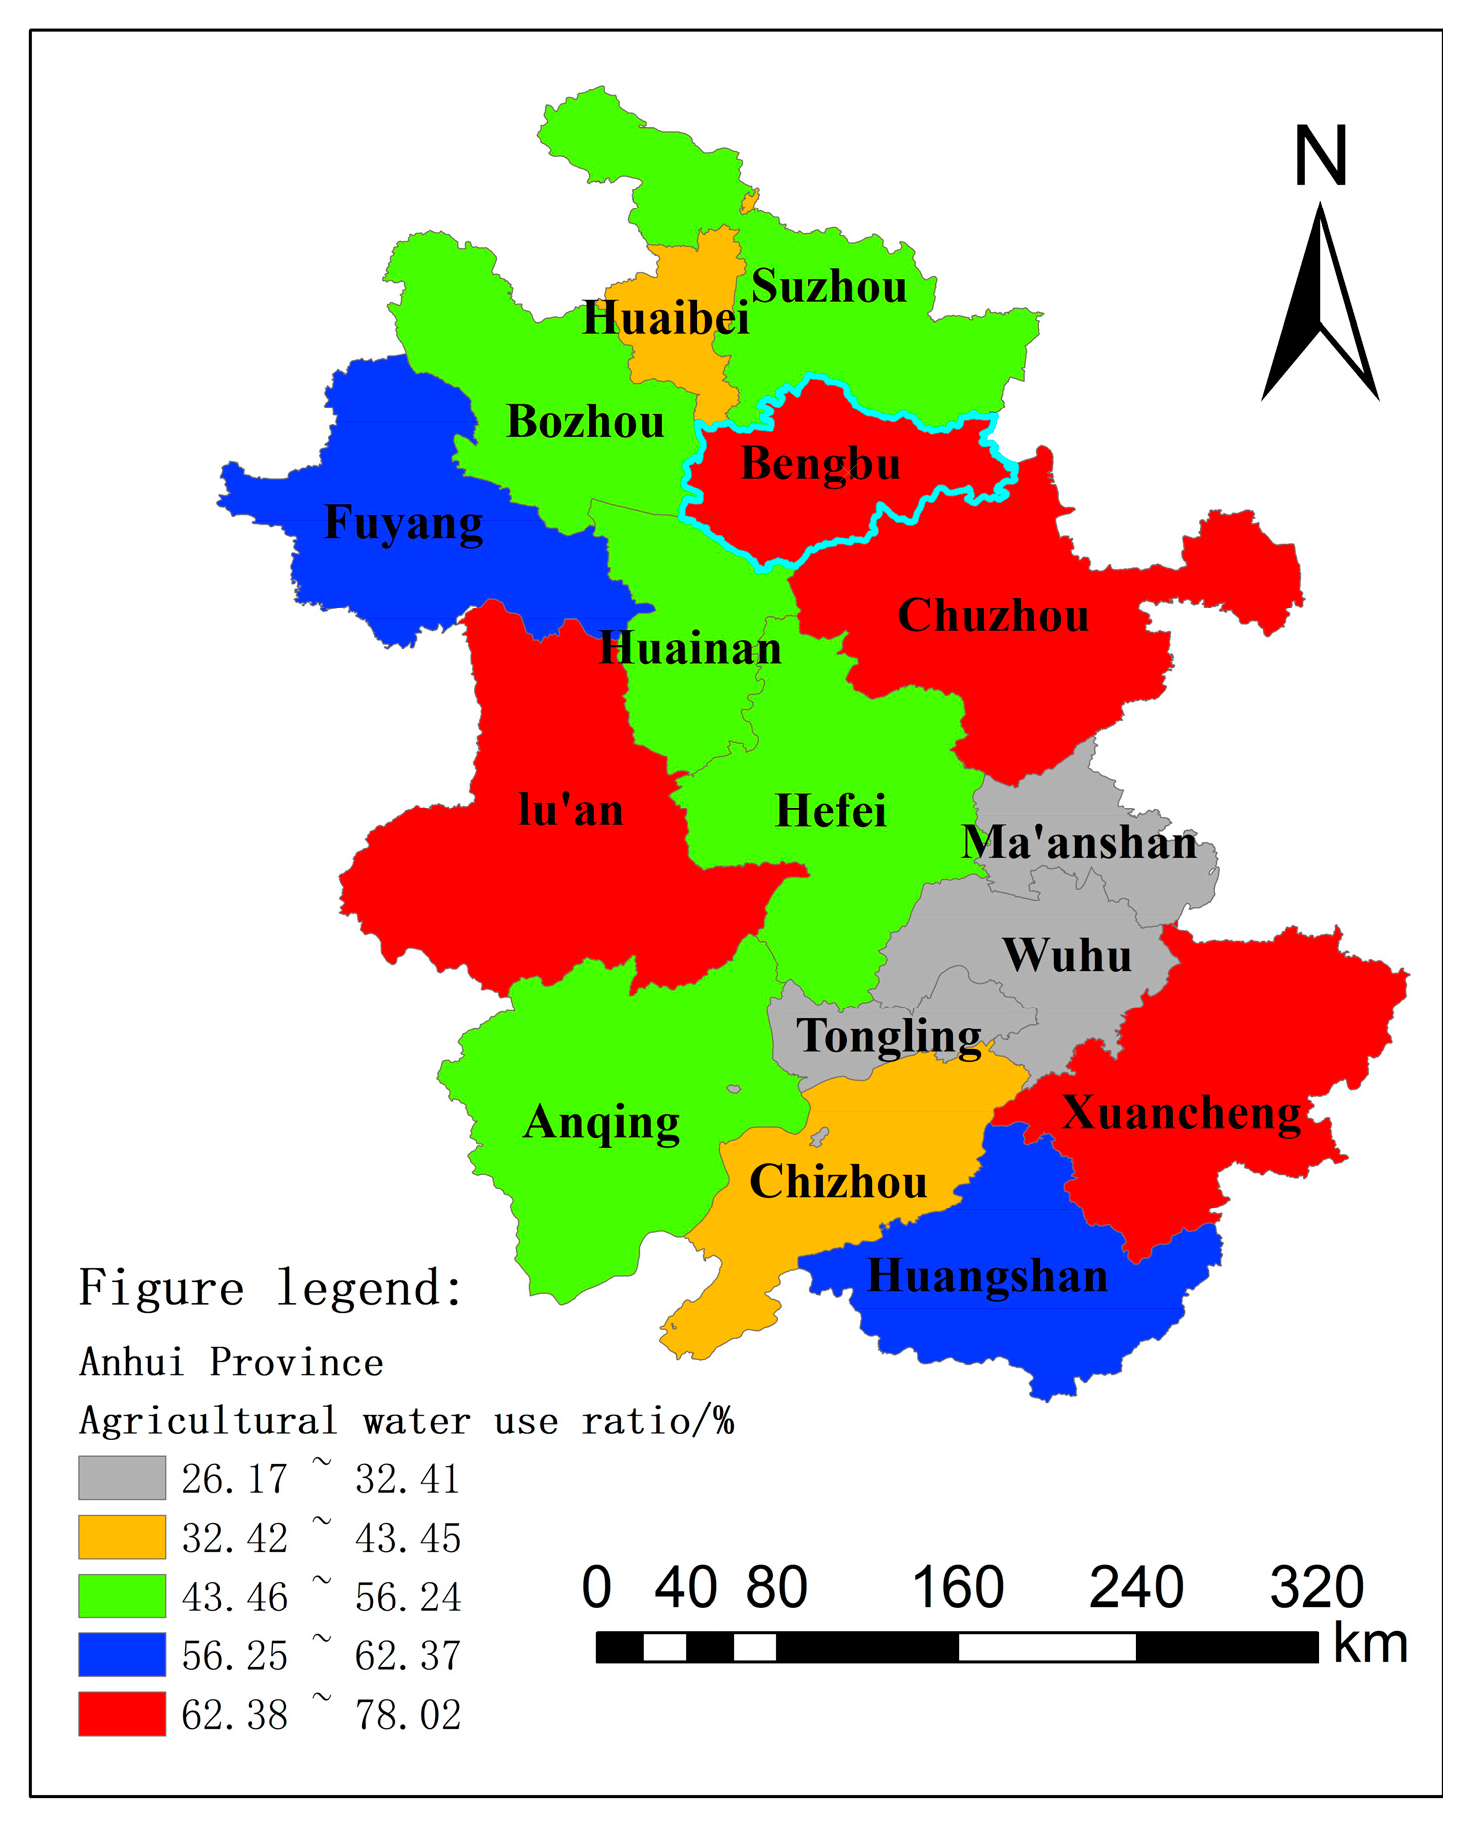
| Agricultural water use ratio C8 | % | Agricultural water consumption/total water consumption | Negative | ||
| Single-party water agricultural output C9 | Yuan/m3 | Total agricultural output value/agricultural water consumption | Positive |
| Evaluation Indicators | C1 | C2 | Cm | |
|---|---|---|---|---|
| Expert (1) ranking of indicators | ||||
| Expert (k) ranking of indicators |
| Year | Grading Criteria | |||
|---|---|---|---|---|
| V1 (0, V−S] | V2 (V−S, V] | V3 (V, V+S] | V4 (V+S, 1] | |
| 2000 | (0, 0.3742] | (0.3742, 0.4272] | (0.4272, 0.4802] | (0.4802, 1] |
| 2005 | (0, 0.3787] | (0.3787, 0.4373] | (0.4373, 0.4959] | (0.4959, 1] |
| 2010 | (0, 0.4072] | (0.4072, 0.4467] | (0.4467, 0.4862] | (0.4862, 1] |
| 2015 | (0, 0.4199] | (0.4199, 0.4627] | (0.4627, 0.5055] | (0.5055, 1] |
| 2020 | (0, 0.3924] | (0.3924, 0.4414] | (0.4414, 0.4905] | (0.4905, 1] |
| Evaluation Indicators | C1 | C2 | C3 | C4 | C5 | C6 | C7 | C8 | C9 |
|---|---|---|---|---|---|---|---|---|---|
| Expert 1 | 4 | 3 | 1 | 6 | 9 | 7 | 5 | 2 | 8 |
| Expert 2 | 3 | 1 | 1 | 2 | 6 | 5 | 4 | 3 | 5 |
| Expert 3 | 2 | 2 | 2 | 1 | 7 | 6 | 3 | 5 | 4 |
| Expert 4 | 1 | 2 | 2 | 3 | 6 | 7 | 4 | 5 | 5 |
| Expert 5 | 2 | 2 | 1 | 4 | 6 | 5 | 1 | 2 | 3 |
| Expert 6 | 4 | 5 | 3 | 9 | 8 | 7 | 2 | 1 | 6 |
| Expert 7 | 5 | 4 | 4 | 2 | 7 | 7 | 3 | 1 | 6 |
| Expert 8 | 3 | 2 | 1 | 5 | 8 | 7 | 5 | 4 | 6 |
| Evaluation Indicators | Expert Ranking | bj | Qj | xj | ωj′ | |||||
|---|---|---|---|---|---|---|---|---|---|---|
| Expert 1 | Expert 2 | Expert 5 | Expert 6 | Expert 7 | Expert 8 | |||||
| C1 | 4 | 3 | 2 | 4 | 5 | 3 | 0.2570 | 0.3631 | 0.4732 | 0.1044 |
| C2 | 3 | 1 | 2 | 5 | 4 | 2 | 0.1851 | 0.3265 | 0.5488 | 0.1211 |
| C3 | 1 | 1 | 1 | 3 | 4 | 1 | 0.0859 | 0.3198 | 0.6218 | 0.1372 |
| C4 | 6 | 2 | 4 | 9 | 2 | 5 | 0.2636 | 0.3604 | 0.4710 | 0.1039 |
| C5 | 9 | 6 | 6 | 8 | 7 | 8 | 0.2856 | 0.3342 | 0.4756 | 0.1049 |
| C6 | 7 | 5 | 5 | 7 | 7 | 7 | 0.3482 | 0.3662 | 0.4131 | 0.0911 |
| C7 | 5 | 4 | 1 | 2 | 3 | 5 | 0.2275 | 0.3466 | 0.5048 | 0.1113 |
| C8 | 2 | 3 | 2 | 1 | 1 | 4 | 0.1368 | 0.2938 | 0.6096 | 0.1345 |
| C9 | 8 | 5 | 3 | 6 | 6 | 6 | 0.3428 | 0.3678 | 0.4155 | 0.0916 |
| Guideline Layer | Guideline Layer Weights | Indicator Layer | Structural Entropy Weighting Method Weights | EWM Weights | Combination Weights |
|---|---|---|---|---|---|
| Water systems B1 | 0.3333 | Total water resources C1 | 0.1044 | 0.0975 | 0.1012 |
| Groundwater Resources C2 | 0.1211 | 0.0743 | 0.0993 | ||
| Rainfall C3 | 0.1372 | 0.0661 | 0.1041 | ||
| Socio-economic system B2 | 0.3333 | Arable land area C4 | 0.1039 | 0.2839 | 0.1876 |
| Food production per capita C5 | 0.1049 | 0.0946 | 0.1001 | ||
| Agricultural output per capita C6 | 0.0911 | 0.1352 | 0.1117 | ||
| Agricultural water resources development and utilization system B3 | 0.3334 | Effective irrigated area ratio C7 | 0.1113 | 0.1075 | 0.1096 |
| Agricultural water use ratio C8 | 0.1345 | 0.0424 | 0.0916 | ||
| Single-party water agricultural output C9 | 0.0916 | 0.0985 | 0.0948 |
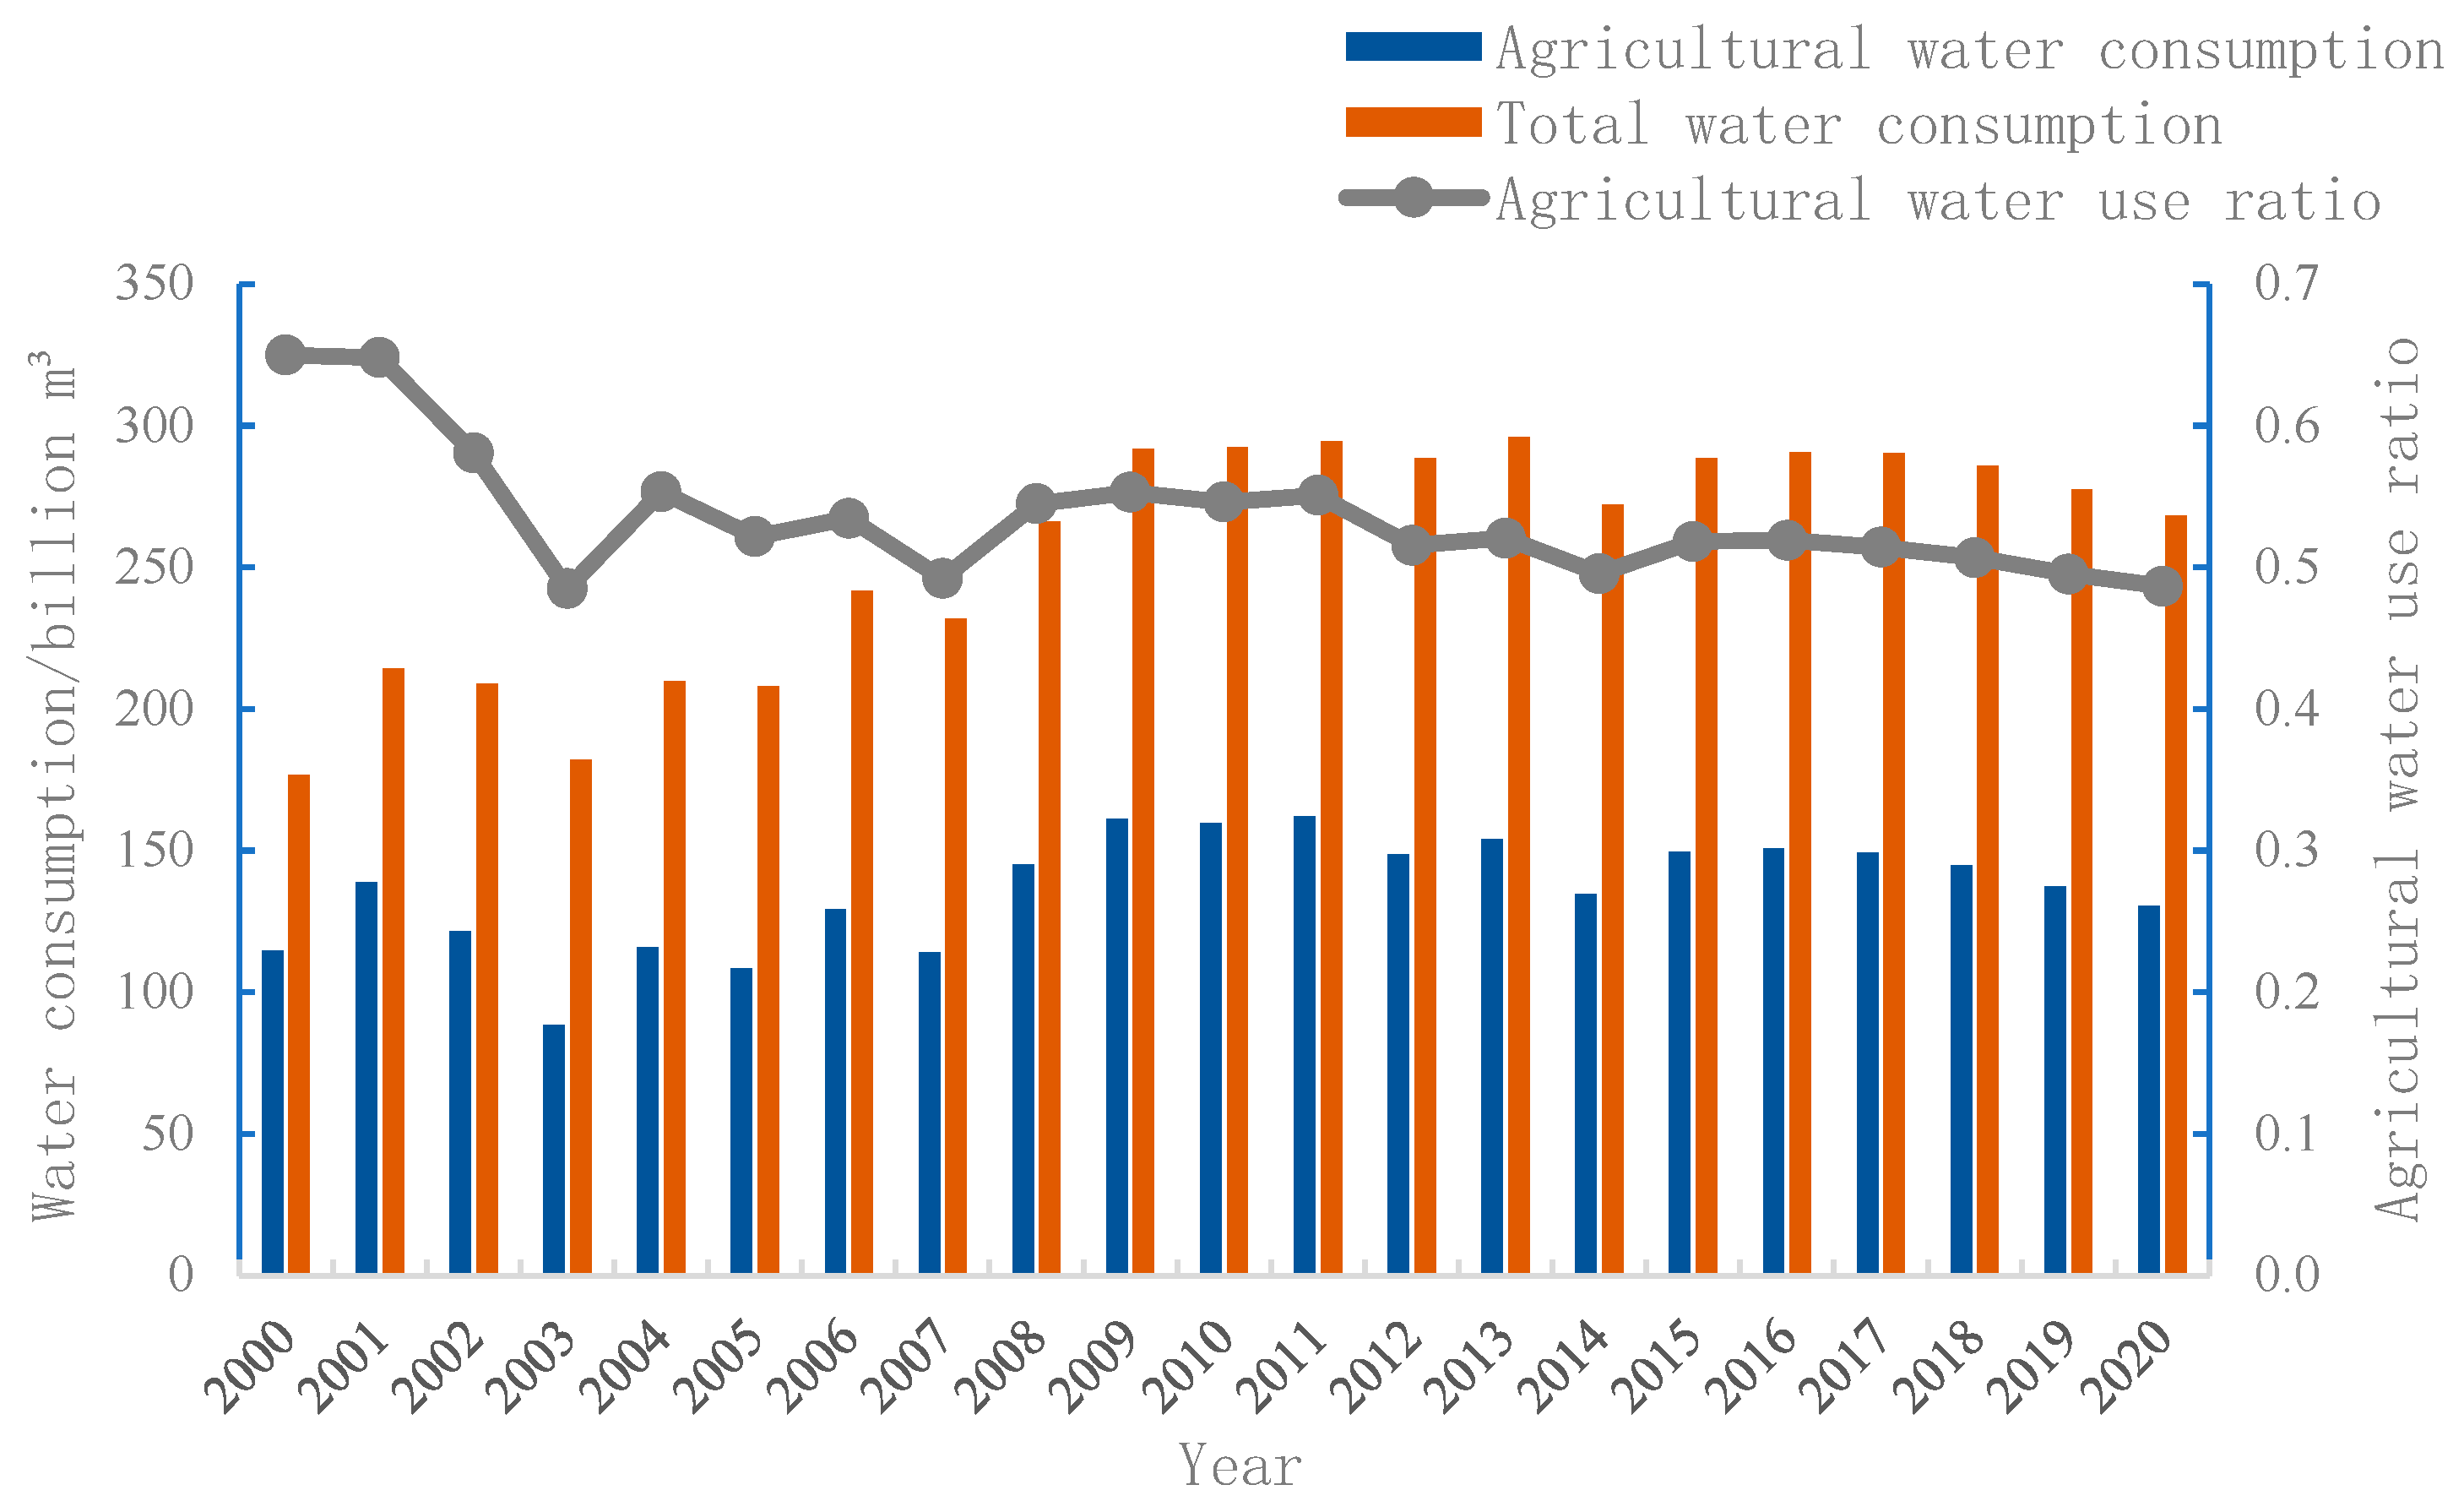
| Year | Total Water Resources/Billion Cubic Meters | Amount of Underground Water Resources/Billion Cubic Meters | Average Rainfall/mm | Arable Land Area/ha | Food Production per Capita (kg/Person) | Per capita Agricultural Output (yuan/Person) | Effective Irrigated Area Ratio/% | Agricultural Water Use Ratio/% | Agricultural Production Value per Square Meter of Water (yuan/m3) |
|---|---|---|---|---|---|---|---|---|---|
| 2000 | 644.21 | 188.74 | 1129.6 | 4,229,551 | 1234.77 | 3372.98 | 75.60 | 65.00 | 5.88 |
| 2001 | 474.27 | 132.63 | 876.2 | 4,218,689 | 1265.65 | 3482.49 | 76.53 | 64.81 | 4.95 |
| 2002 | 824.69 | 205.47 | 1266.0 | 4,177,761 | 1431.53 | 3688.20 | 78.12 | 58.09 | 5.86 |
| 2003 | 1083.01 | 252.34 | 1460.9 | 4,084,727 | 1190.37 | 3321.10 | 80.43 | 48.51 | 6.99 |
| 2004 | 500.65 | 151.97 | 998.0 | 4,108,856 | 1528.39 | 4691.71 | 80.40 | 55.34 | 7.26 |
| 2005 | 719.25 | 195.41 | 1208.3 | 4,092,451 | 1474.43 | 4632.04 | 81.39 | 52.17 | 7.54 |
| 2006 | 580.50 | 159.12 | 1069.0 | 4,116,941 | 1643.17 | 5201.37 | 81.30 | 53.47 | 7.00 |
| 2007 | 712.46 | 181.84 | 1174.3 | 4,144,171 | 1769.47 | 6428.04 | 82.54 | 49.21 | 9.23 |
| 2008 | 699.24 | 178.09 | 1146.0 | 4,144,981 | 1897.90 | 7519.69 | 83.32 | 54.50 | 8.25 |
| 2009 | 733.10 | 185.43 | 1194.0 | 4,171,222 | 1960.33 | 8236.23 | 83.53 | 55.30 | 7.99 |
| 2010 | 939.05 | 197.81 | 1308.9 | 4,181,295 | 2023.98 | 9706.29 | 84.18 | 54.61 | 9.25 |
| 2011 | 602.08 | 143.48 | 1064.4 | 4,184,323 | 2100.13 | 10,986.63 | 84.78 | 55.09 | 10.11 |
| 2012 | 700.98 | 159.22 | 1173.8 | 4,184,235 | 2243.74 | 12,186.80 | 85.68 | 51.55 | 12.01 |
| 2013 | 585.59 | 144.54 | 1023.4 | 4,188,104 | 2319.71 | 13,553.49 | 102.80 | 52.06 | 12.43 |
| 2014 | 778.48 | 178.91 | 1278.5 | 5,876,410 | 2448.10 | 14,528.01 | 73.71 | 49.56 | 15.03 |
| 2015 | 914.12 | 193.71 | 1362.8 | 5,876,640 | 2545.41 | 14,964.65 | 74.88 | 51.82 | 13.91 |
| 2016 | 1245.17 | 219.26 | 1612.7 | 5,873,000 | 2481.59 | 15,518.32 | 75.56 | 51.91 | 14.16 |
| 2017 | 784.90 | 200.95 | 1255.0 | 5,866,760 | 2557.95 | 16,494.37 | 76.77 | 51.42 | 15.01 |
| 2018 | 835.78 | 203.67 | 1314.7 | 5,885,950 | 2939.38 | 16,530.95 | 77.10 | 50.69 | 15.56 |
| 2019 | 539.87 | 144.85 | 935.8 | 5,550,000 | 2972.14 | 17,341.60 | 82.54 | 49.53 | 17.20 |
| 2020 | 1280.41 | 228.60 | 1665.6 | 5,890,000 | 3037.50 | 19,085.71 | 78.25 | 48.67 | 19.34 |
| Year | Traditional TOPSIS | Sort by | Composite Index Method | Sort by | Principal Component Analysis Method | Sort by | Fuzzy Integrated Evaluation Method | Sort by | Improved TOPSIS | Sort by |
|---|---|---|---|---|---|---|---|---|---|---|
| 2000 | 0.1836 | 20 | 0.1324 | 20 | 0.3202 | 12 | 0.4411 | 19 | 0.3096 | 20 |
| 2001 | 0.0467 | 21 | 0.0308 | 21 | 0.0084 | 21 | 0.3881 | 21 | 0.2647 | 21 |
| 2002 | 0.2894 | 17 | 0.2422 | 17 | 0.4024 | 9 | 0.5004 | 17 | 0.3611 | 17 |
| 2003 | 0.4309 | 9 | 0.3832 | 11 | 0.5528 | 7 | 0.5865 | 9 | 0.4369 | 11 |
| 2004 | 0.2061 | 19 | 0.1600 | 19 | 0.0283 | 20 | 0.4273 | 20 | 0.3246 | 19 |
| 2005 | 0.3155 | 15 | 0.2694 | 16 | 0.2555 | 15 | 0.5068 | 16 | 0.3763 | 16 |
| 2006 | 0.2519 | 18 | 0.2081 | 18 | 0.0881 | 19 | 0.4553 | 18 | 0.3489 | 18 |
| 2007 | 0.3549 | 12 | 0.3188 | 12 | 0.2221 | 16 | 0.5434 | 12 | 0.4090 | 12 |
| 2008 | 0.3149 | 16 | 0.2922 | 15 | 0.2678 | 14 | 0.5185 | 14 | 0.3900 | 14 |
| 2009 | 0.3334 | 13 | 0.3146 | 13 | 0.3360 | 10 | 0.5353 | 13 | 0.4011 | 13 |
| 2010 | 0.4091 | 10 | 0.3954 | 9 | 0.5092 | 8 | 0.5876 | 8 | 0.4402 | 9 |
| 2011 | 0.3234 | 14 | 0.2946 | 14 | 0.1822 | 17 | 0.5087 | 15 | 0.3896 | 15 |
| 2012 | 0.4057 | 11 | 0.3863 | 10 | 0.2933 | 13 | 0.5688 | 10 | 0.4372 | 10 |
| 2013 | 0.4434 | 8 | 0.4184 | 8 | 0.1456 | 18 | 0.5459 | 11 | 0.4573 | 8 |
| 2014 | 0.5837 | 6 | 0.6156 | 6 | 0.6098 | 6 | 0.6624 | 6 | 0.5611 | 6 |
| 2015 | 0.6146 | 5 | 0.6488 | 5 | 0.7541 | 4 | 0.6837 | 5 | 0.5767 | 5 |
| 2016 | 0.6837 | 2 | 0.7484 | 2 | 1.0428 | 2 | 0.7108 | 2 | 0.6271 | 2 |
| 2017 | 0.6156 | 4 | 0.6515 | 4 | 0.6948 | 5 | 0.6882 | 4 | 0.5817 | 4 |
| 2018 | 0.6493 | 3 | 0.6999 | 3 | 0.7658 | 3 | 0.7063 | 3 | 0.6078 | 3 |
| 2019 | 0.5477 | 7 | 0.5743 | 7 | 0.3349 | 11 | 0.6318 | 7 | 0.5377 | 7 |
| 2020 | 0.7637 | 1 | 0.8870 | 1 | 1.1719 | 1 | 0.7791 | 1 | 0.7004 | 1 |
Disclaimer/Publisher’s Note: The statements, opinions and data contained in all publications are solely those of the individual author(s) and contributor(s) and not of MDPI and/or the editor(s). MDPI and/or the editor(s) disclaim responsibility for any injury to people or property resulting from any ideas, methods, instructions or products referred to in the content. |
© 2023 by the authors. Licensee MDPI, Basel, Switzerland. This article is an open access article distributed under the terms and conditions of the Creative Commons Attribution (CC BY) license (https://creativecommons.org/licenses/by/4.0/).
Share and Cite
Wang, C.; Li, Z.; Chen, H.; Wang, M. Comprehensive Evaluation of Agricultural Water Resources’ Carrying Capacity in Anhui Province Based on an Improved TOPSIS Model. Sustainability 2023, 15, 13297. https://doi.org/10.3390/su151813297
Wang C, Li Z, Chen H, Wang M. Comprehensive Evaluation of Agricultural Water Resources’ Carrying Capacity in Anhui Province Based on an Improved TOPSIS Model. Sustainability. 2023; 15(18):13297. https://doi.org/10.3390/su151813297
Chicago/Turabian StyleWang, Chao, Zhijun Li, Haifeng Chen, and Meibo Wang. 2023. "Comprehensive Evaluation of Agricultural Water Resources’ Carrying Capacity in Anhui Province Based on an Improved TOPSIS Model" Sustainability 15, no. 18: 13297. https://doi.org/10.3390/su151813297
APA StyleWang, C., Li, Z., Chen, H., & Wang, M. (2023). Comprehensive Evaluation of Agricultural Water Resources’ Carrying Capacity in Anhui Province Based on an Improved TOPSIS Model. Sustainability, 15(18), 13297. https://doi.org/10.3390/su151813297