
Study on Shear Behavior and Mechanism Based on Shear Functional Unit of Loess Microstructure

 ,
,
Abstract
1. Introduction
2. Materials and Methods
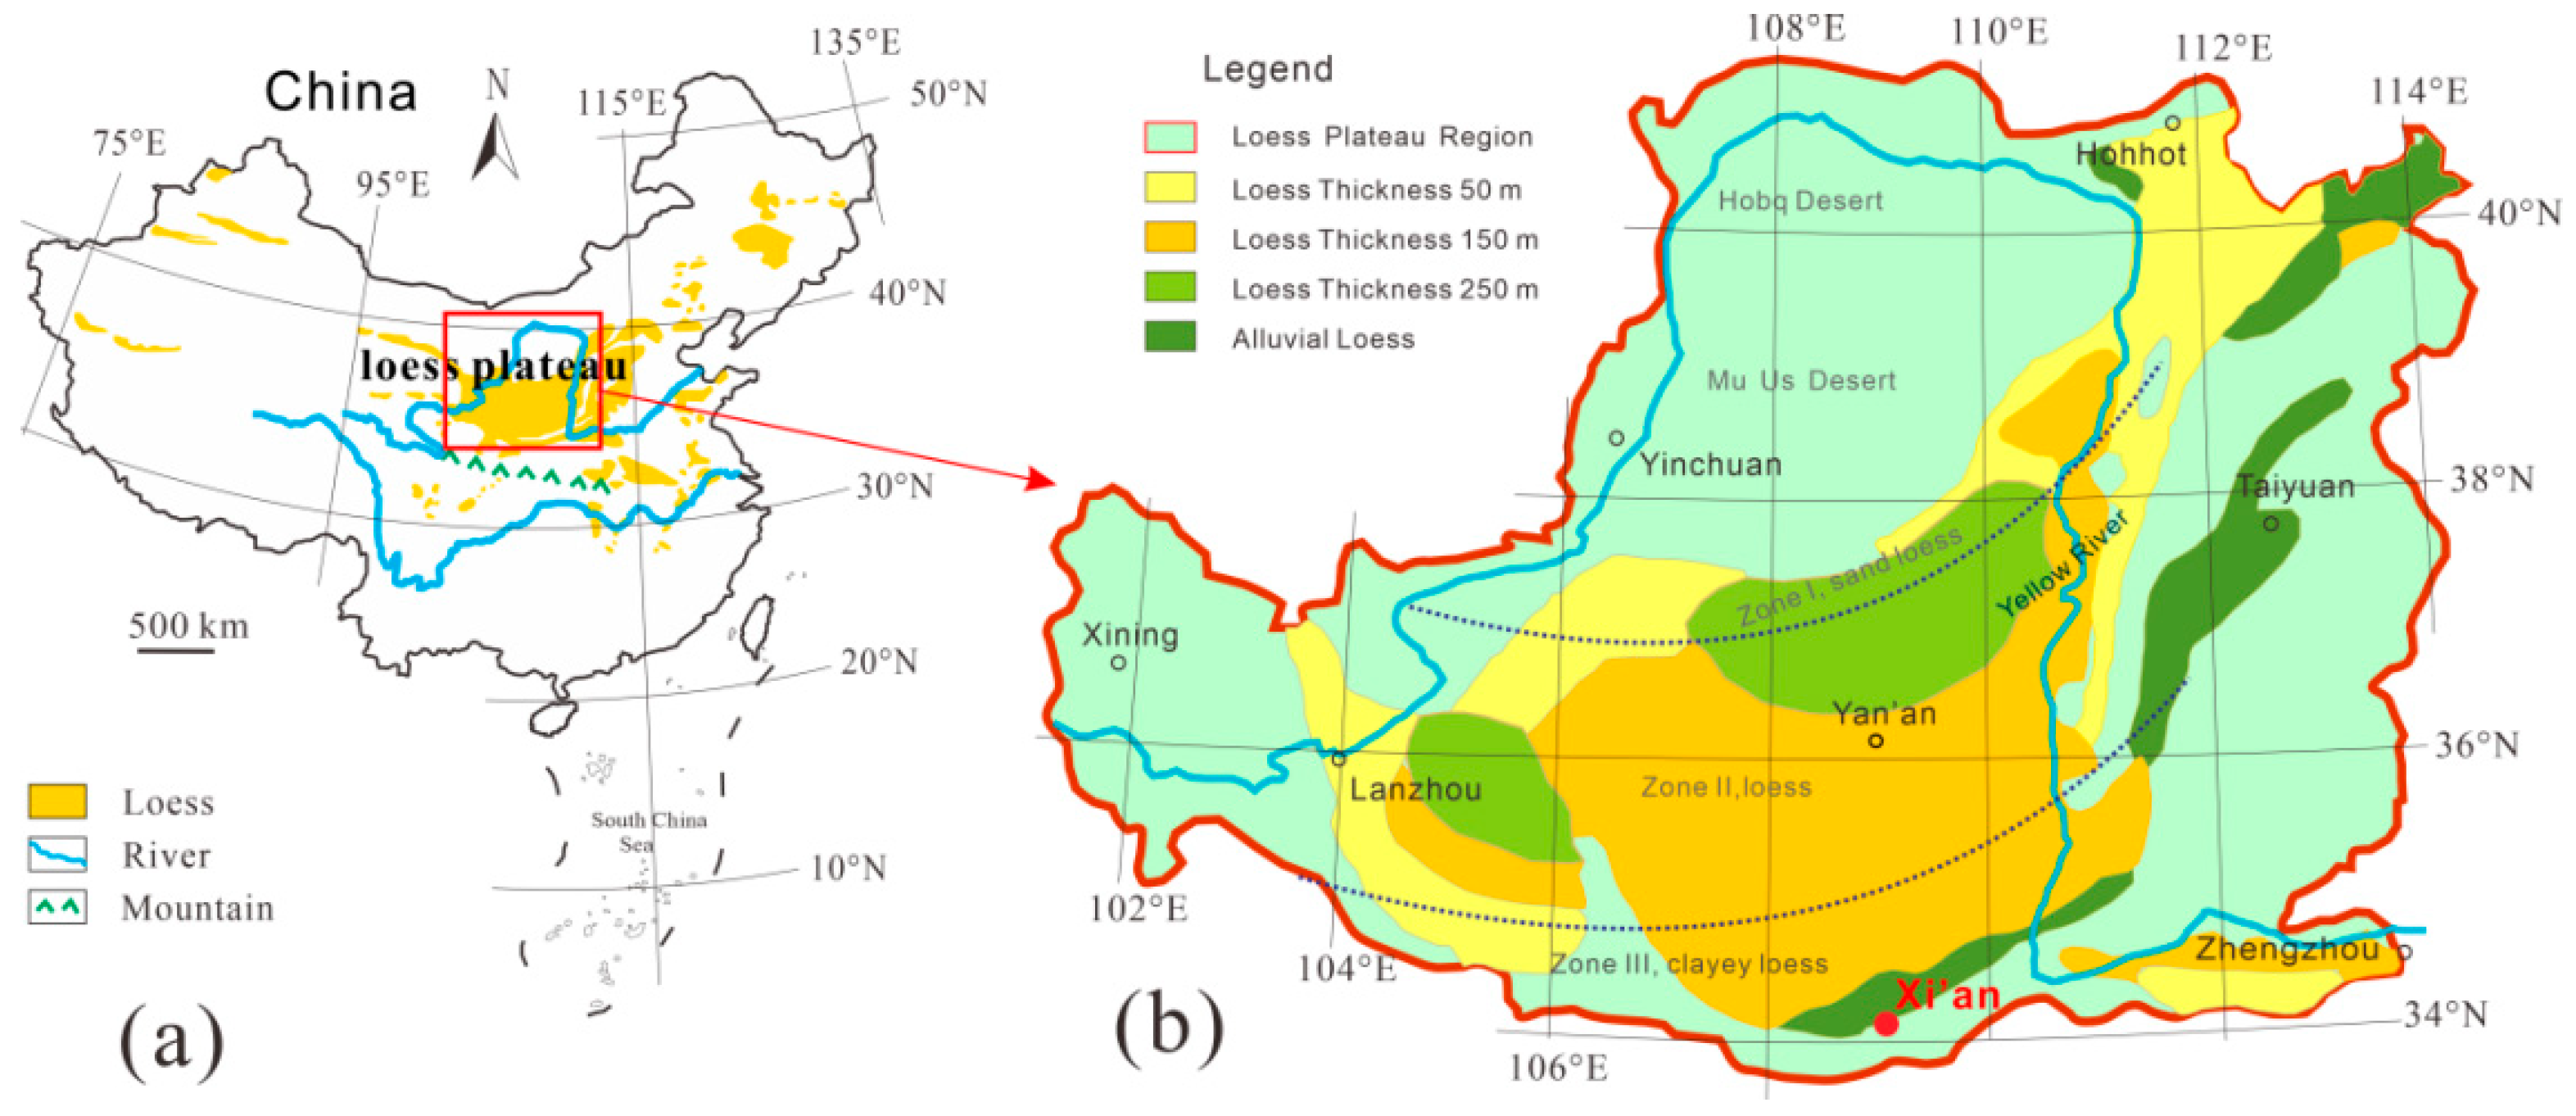
2.1. Test Materials
2.2. Methods
2.2.1. Sample Preparation
2.2.2. Direct Shear Test
2.2.3. Microscopic Test
3. Results
3.1. Mass Strain Parameters of Soil Samples
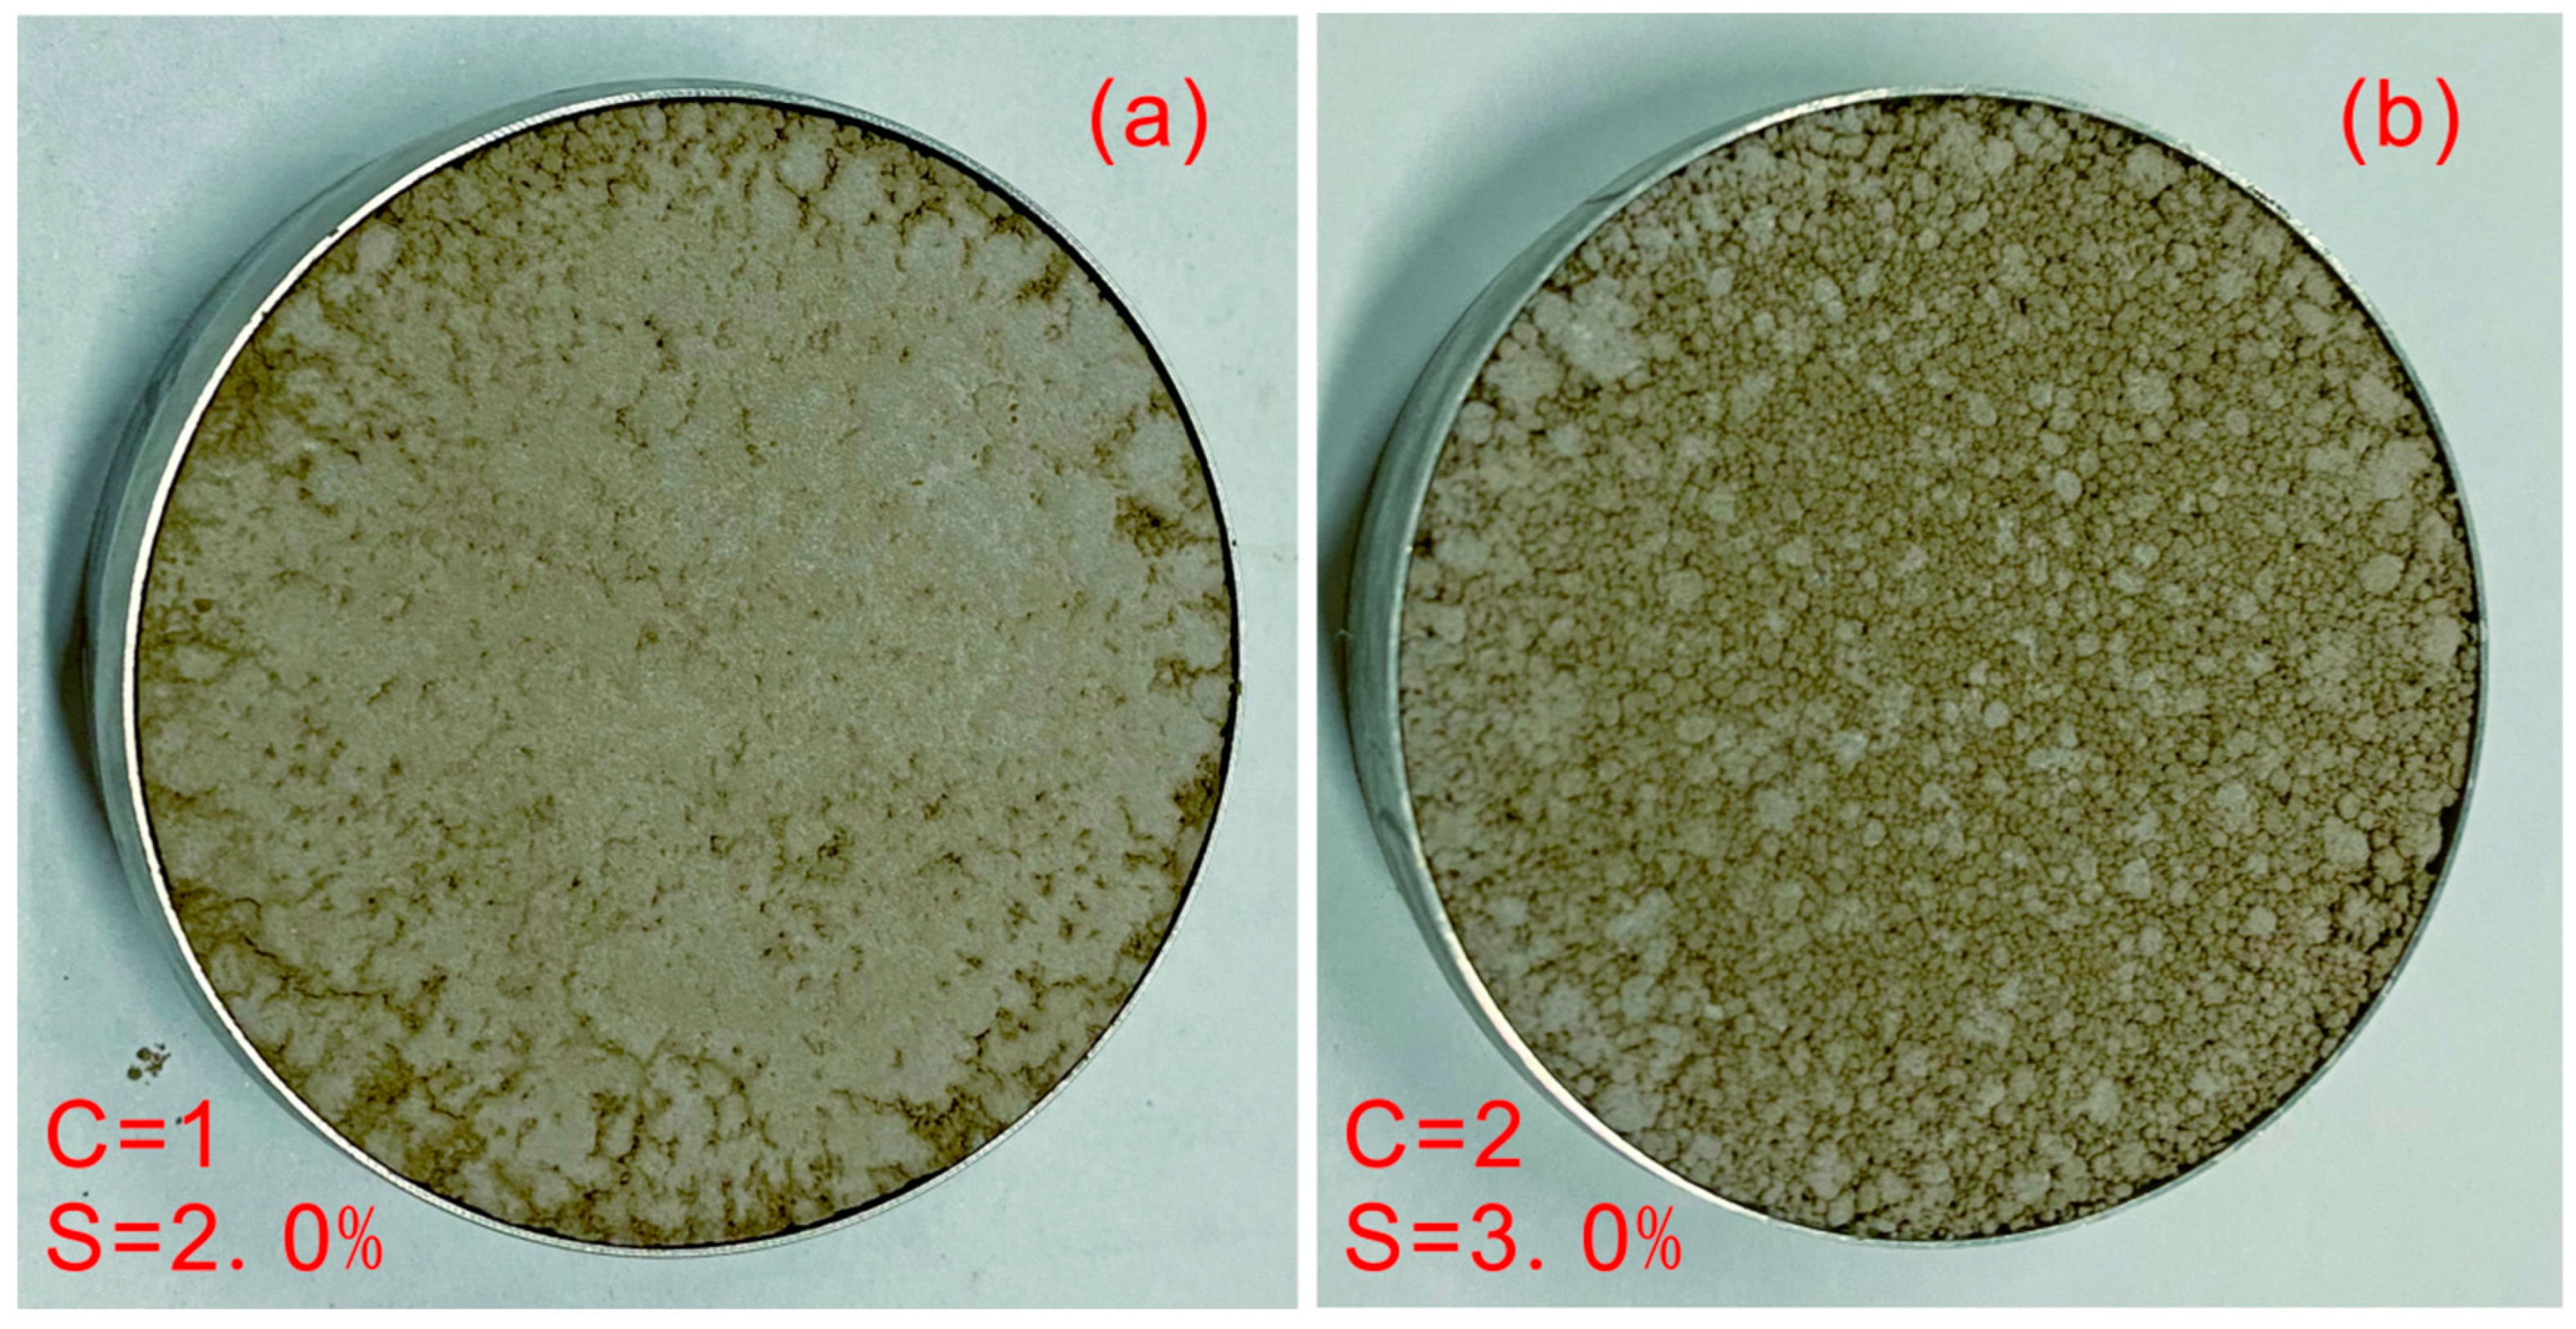
3.2. Surface Cracking and Crack Rate Variation
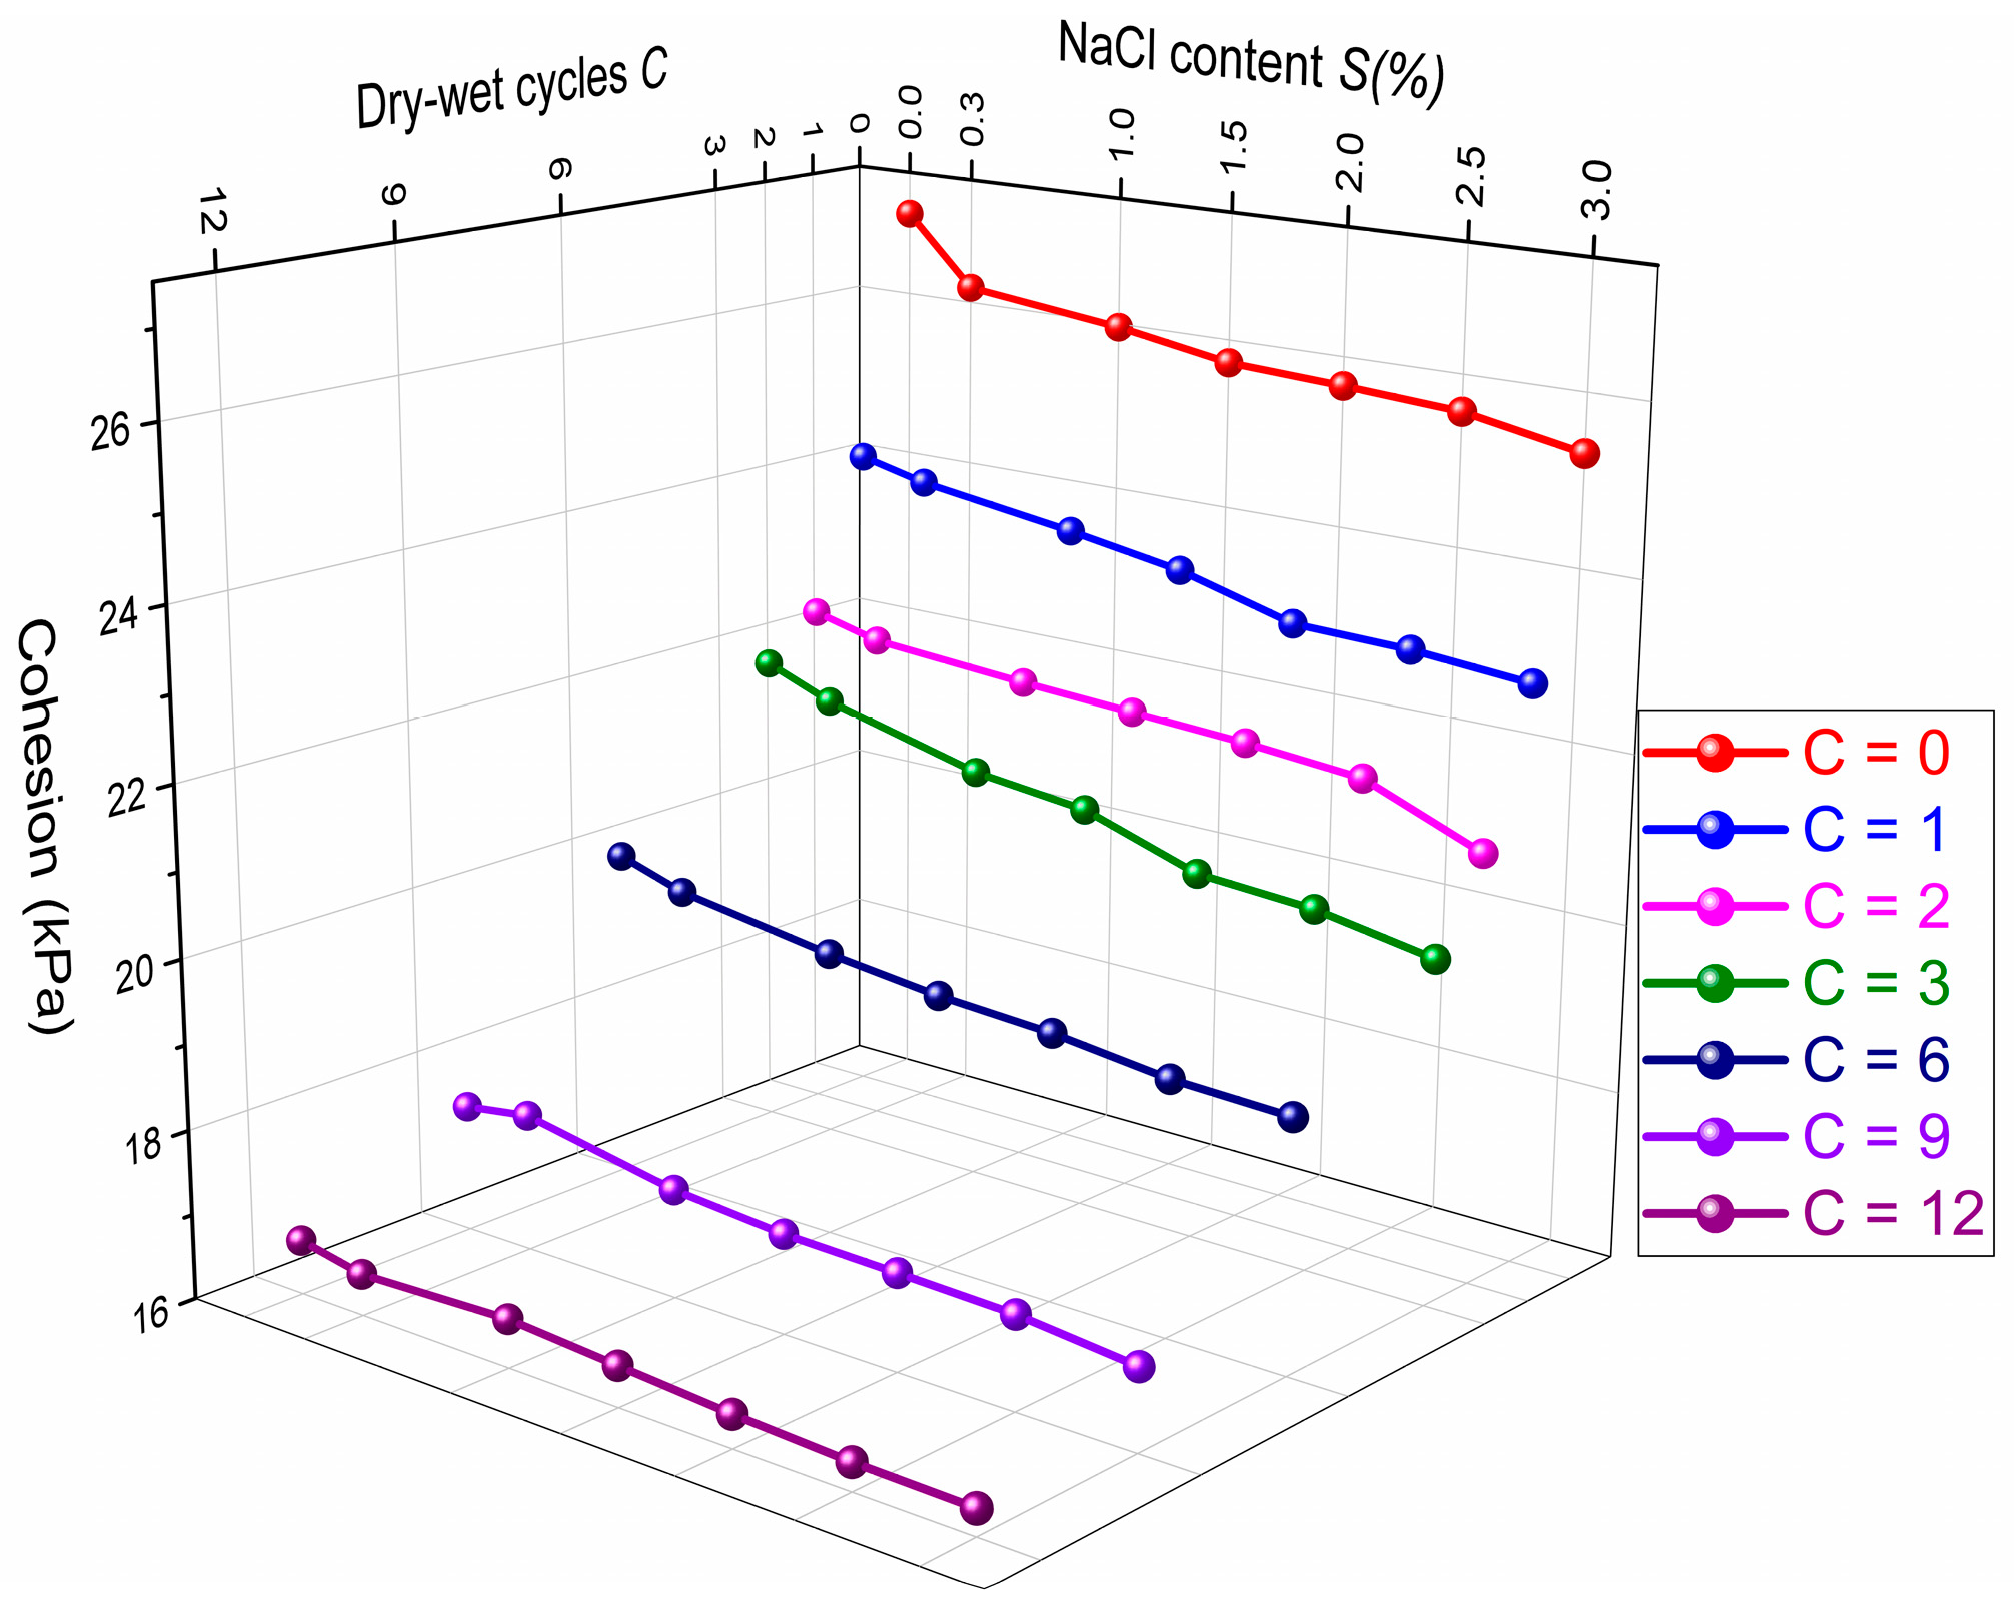
3.3. Shear Strength
4. Discussion
4.1. Relationships between Soil Structural Disturbance and Dry–Wet-Salt Erosion
4.2. Microstructural Analysis of Loess
4.2.1. Structural Difference of Loess Based on SEM Images
4.2.2. Analysis of Microscopic Cracks
4.3. Micro Mechanism Analysis of the Basic Shear Structural Units and the Shear Process of Loess
5. Conclusions
- (1)
- The mass strain parameter effectively reflects the mass loss rate, and the increase in both dry–wet cycles and salt content causes an increase in the mass loss of soil samples.
- (2)
- The development of surface cracks in soil samples is closely related to the dry–wet-salt erosion. The surface crack rate can be used to qualitatively evaluate the shrinkage characteristics of soil and also quantitatively assess the development pattern of cracks as they increase with the increase in dry–wet cycles and salt erosion.
- (3)
- The dual effects of salt and water disturb the soil structure and change the original cementation structure, and the cohesion of soil samples shows an overall decreasing trend with the increase in dry–wet-salt erosion. While the internal friction angle shows a trend of increasing at the beginning and decreasing at the end in the whole process, which has little change in general.
- (4)
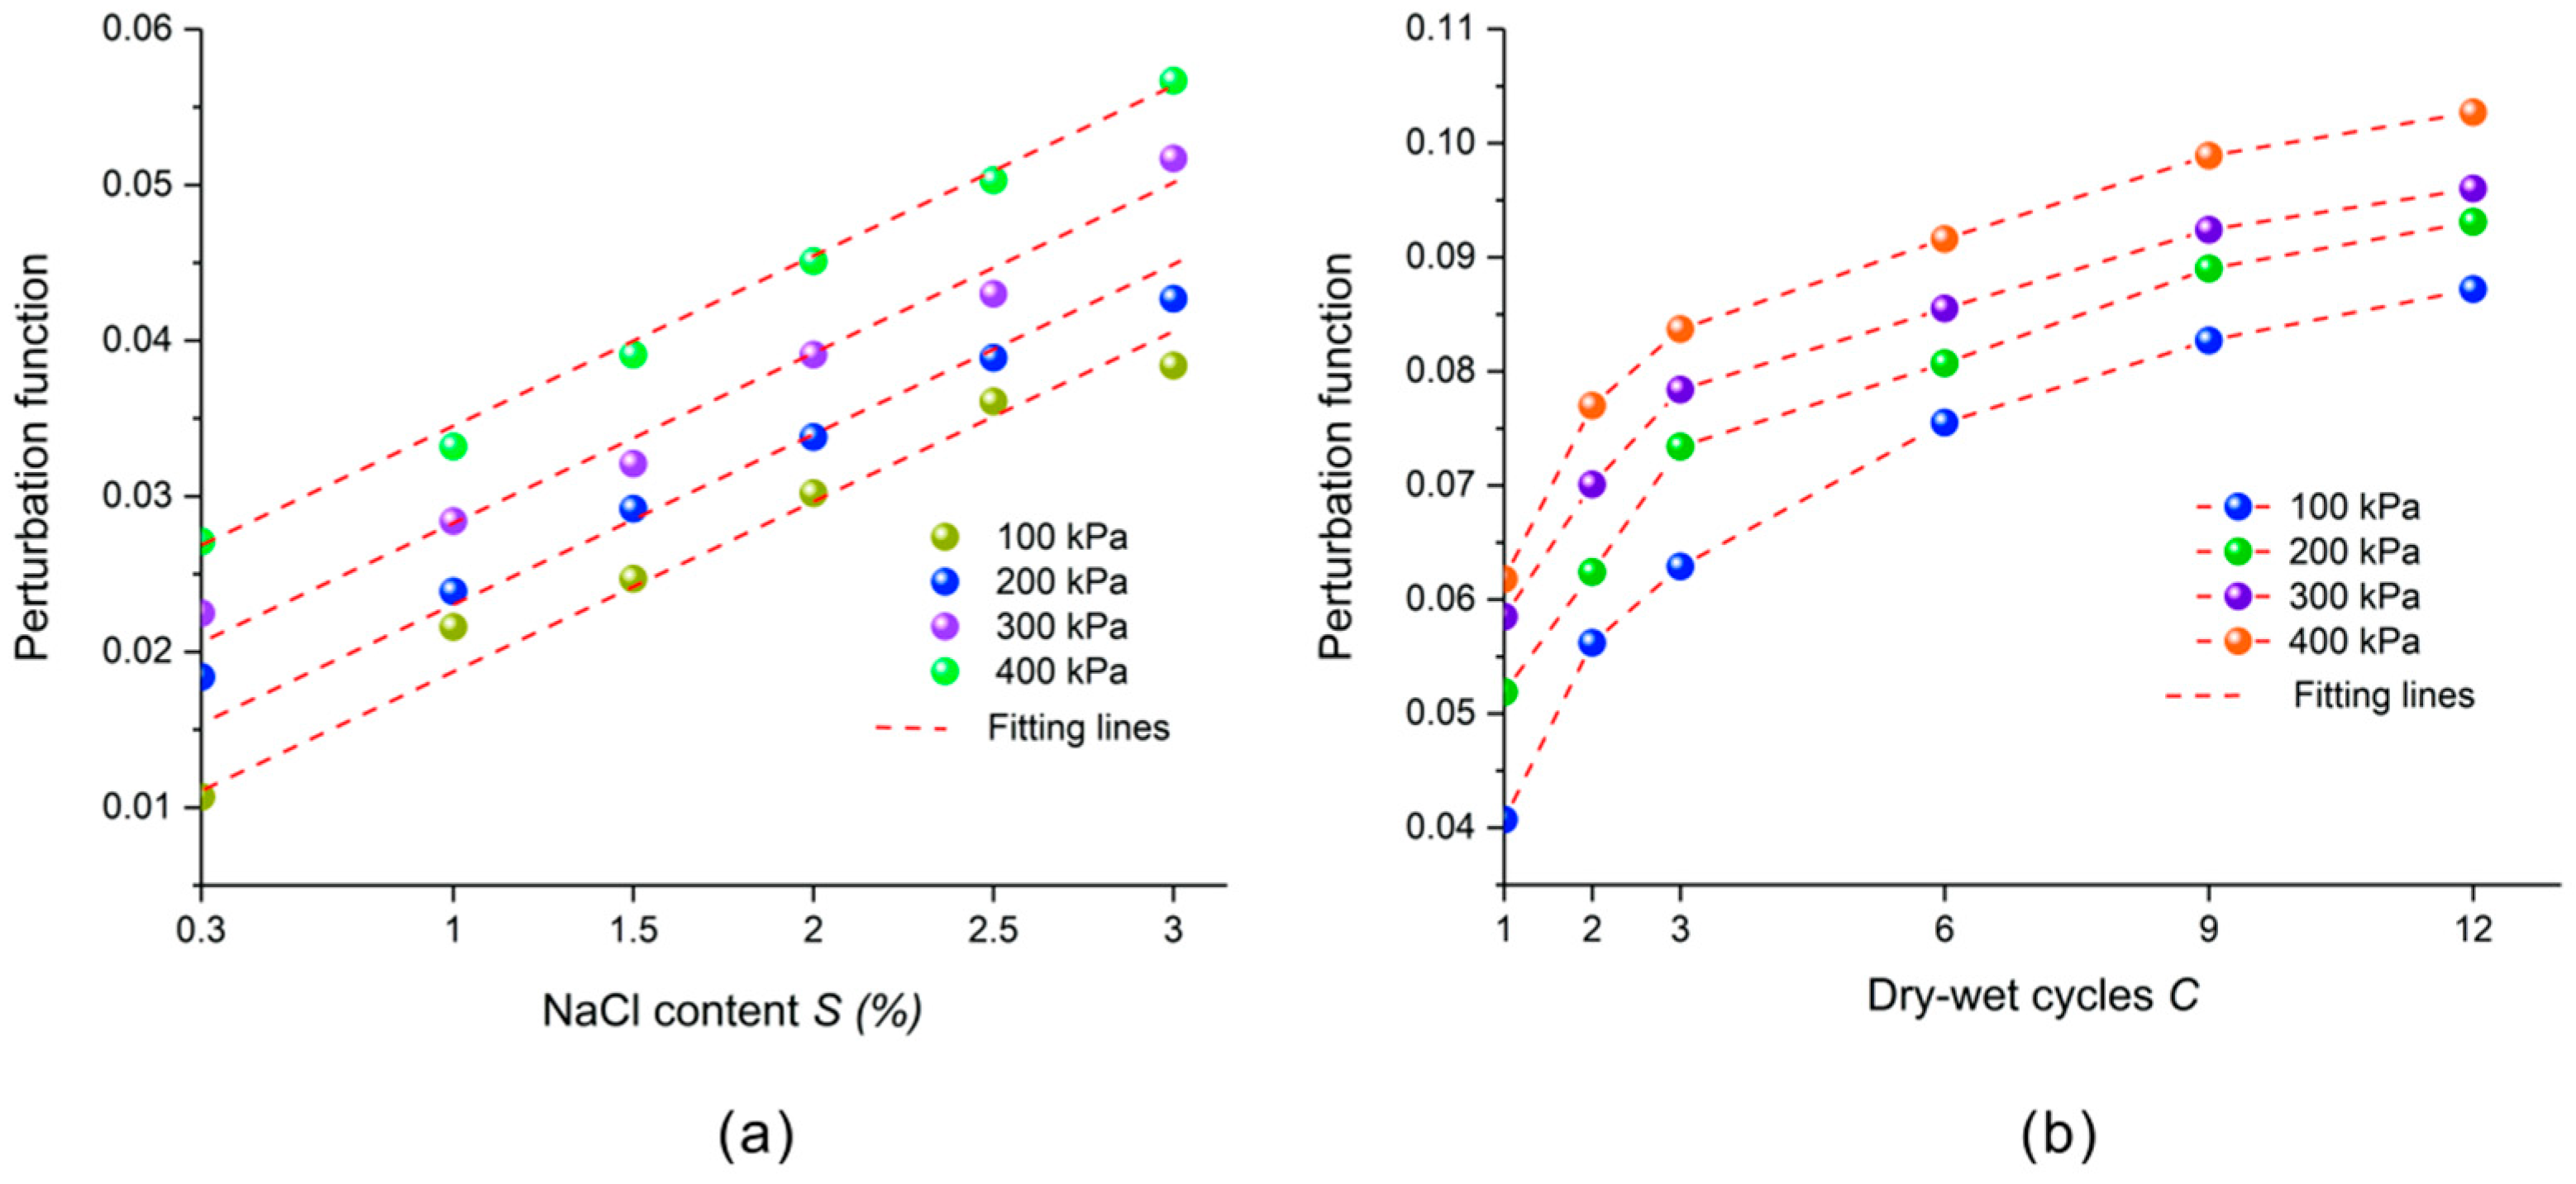
- A further univariate analysis of the soil structural disturbance parameters for dry–wet-salt erosion is conducted. The structural disturbance parameters have a positive correlation with salt content and a power function relationship with the number of dry–wet cycles.
Author Contributions
Funding
Data Availability Statement
Conflicts of Interest
References
- Pye, K. The nature, origin and accumulation of loess. Quat. Sci. Rev. 1995, 14, 653–667. [Google Scholar] [CrossRef]
- Smalley, I.J.; Smalley, V. Loess Material and Loess Deposits: Formation, Distribution and Consequences. In Developments in Sedimentology; Elsevier: Amsterdam, The Netherlands, 1983; pp. 51–68. [Google Scholar] [CrossRef]
- Yu, B.; Fan, W.; Dijkstra, T.; Wei, Y.; Deng, L. Pore structure evolution due to loess collapse: A comparative study using MIP and X-ray micro-CT. Geoderma 2022, 424, 115955. [Google Scholar] [CrossRef]
- Song, Z.; Cheng, Q.; Zhang, W.; Meng, F. Analysis of microstructure and collapsibility of undisturbed loess. J. Eng. Geol. 2007, 15, 8. [Google Scholar] [CrossRef]
- Sun, J. Loess Science; Hong Kong Archaeological Society: Hong Kong, China, 2005. [Google Scholar]
- Derbyshire, E.; Mellors, T.W. Geological and geotechnical characteristics of some loess and loessic soils from China and Britain: A comparison. Eng. Geol. 1988, 25, 135–175. [Google Scholar] [CrossRef]
- Grabowska-Olszewska, B. Skeletal microstructure of loesses—Its significance for engineering-geological and geotechnical studies. Appl. Clay Sci. 1989, 4, 327–336. [Google Scholar] [CrossRef]
- Zhang, T.; Wang, X. Progress and trend of soil degradation research. J. Nat. Resour. 2000, 15, 280. [Google Scholar] [CrossRef]
- Lal, R.E.; Blum, W.H.E.; Valentin, C.E.; Stewart, E. Methods for Assessment of Soil Degradation; CRC Press: Boca Raton, FL, USA, 1998. [Google Scholar]
- Oldeman, L.R.; Hakkeling, R.T.A.; Sombroek, W.G. World Map of the Status of Human-Induced Soil Degradation: An Explanatory Note, 2nd ed.; International Soil Reference and Information Centre: Wageningen, The Netherland, 1991. [Google Scholar]
- Sorbino, G.; Nicotera, M.V. Unsaturated soil mechanics in rainfall-induced flow landslides. Eng. Geol. 2013, 165, 105–132. [Google Scholar] [CrossRef]
- Wu, L.Z.; Zhou, Y.; Sun, P.; Shi, J.S.; Liu, G.G.; Bai, L.Y. Laboratory characterization of rainfall-induced loess slope failure. CATENA 2017, 150, 1–8. [Google Scholar] [CrossRef]
- Xu, J.; Li, Y.; Wang, S.; Wang, Q.; Ding, J. Shear strength and mesoscopic character of undisturbed loess with sodium sulfate after dry-wet cycling. Bull. Eng. Geol. Environ. 2020, 79, 1523–1541. [Google Scholar] [CrossRef]
- Xu, L.; Dai, F.C.; Tham, L.G.; Tu, X.B.; Min, H.; Zhou, Y.F.; Wu, C.X.; Xu, K. Field testing of irrigation effects on the stability of a cliff edge in loess, North-west China. Eng. Geol. 2011, 120, 10–17. [Google Scholar] [CrossRef]
- Ye, W.J.; Li, C.Q.; Ma, W.C. Study on the mechanism of joint fissure development and expansion in Loess under the action of dry wet cycle. Sci. Technol. Eng. 2016, 16, 6. [Google Scholar] [CrossRef]
- Xu, J.; Li, Y.; Ren, C.; Lan, W. Damage of saline intact loess after dry-wet and its interpretation based on SEM and NMR. Soils Found. 2020, 60, 911–928. [Google Scholar] [CrossRef]
- Aldaood, A.; Bouasker, M.; Al-Mukhtar, M. Impact of wetting-drying cycles on the microstructure and mechanical properties of lime-stabilized gypseous soils. Eng. Geol. Amst. 2014, 174, 11–21. [Google Scholar] [CrossRef]
- Tripathy, S. Cyclic swell-shrink behaviour of compacted expansive soils. Geotech. Geol. Eng. 2008, 27, 89–103. [Google Scholar] [CrossRef]
- Fu, L.; Li, M. Analysis of influence of dry wet cycle on permeability coefficient of undisturbed and remolded loess. J. Luoyang Inst. Technol. Nat. Sci. Ed. 2018, 28, 6. [Google Scholar]
- Liu, J.Y.; Li, X.A.; Xue, Q.; Guo, Z.Z. Experimental study on air permeability and microscopic mechanism of intact and remolded Malan loess, Loess Plateau, China. Bull. Eng. Geol. Environ. 2020, 79, 3909–3919. [Google Scholar] [CrossRef]
- Zhang, F.; Wang, G.; Kamai, T.; Chen, W.; Zhang, D.; Yang, J. Undrained shear behavior of loess saturated with different concentrations of sodium chloride solution. Eng. Geol. 2013, 155, 69–79. [Google Scholar] [CrossRef]
- Barzegar, A.R.; Oades, J.M.; Rengasamy, P. Soil Structure Degradation and Mellowing of Compacted Soils by Saline-Sodic Solutions. Soil Sci. Soc. Am. J. 1996, 60, 583–588. [Google Scholar] [CrossRef]
- Xu, H.L.; Gao, M.X.; Li, X.F.; Wang, Z.Y.; Liu, W.J.; Lu, Y. Study on influence of soluble salt concentration on shear strength index of soil. J. Inn. Mong. Agric. Univ. Nat. Sci. Ed. 2012, 33, 3. [Google Scholar]
- Dijkstra, T.A.; Rogers, C.D.F.; Smalley, I.J.; Derbyshire, E.; Li, Y.J.; Meng, X.M. The loess of north-central China: Geotechnical properties and their relation to slope stability. Eng. Geol. 1994, 36, 153–171. [Google Scholar] [CrossRef]
- Yan, Y.J.; Wen, B.P.; Huang, Z.Q. Effect of soluble salt on shear strength of Lanzhou unsaturated remolded loess. Rock Soil Mech. 2017, 38, 7. [Google Scholar] [CrossRef]
- Zhang, N.; Luo, Y. Effect of soluble salt on strength characteristics of Loess. Yellow River 2014, 36, 3. [Google Scholar] [CrossRef]
- Li, X.A.; Hong, B.; Li, L.C.; Wang, L. Experimental study on the influence of loess collapsibility on permeability coefficient. China J. Highw. Transp. 2017, 30, 12. [Google Scholar] [CrossRef]
- Meng, J.; Li, X.A. Effects of carbonate on the structure and properties of loess and the corresponding mechanism: An experimental study of the Malan loess, Xi’an area, China. Bull. Eng. Geol. Environ. 2019, 78, 4965–4976. [Google Scholar] [CrossRef]
- Liu, X.; Zhang, M.; Zhang, H.; Jia, Y.; Zhu, C.; Shan, H. Physical and mechanical properties of loess discharged from the Yellow River into the Bohai Sea, China. Eng. Geol. 2017, 227, 4–11. [Google Scholar] [CrossRef]
- Shao, X.X.; Zhang, H.; Tan, Y. Collapse behavior and microstructural alteration of remolded loess under graded wetting tests. Eng. Geol. 2018, 233, 11–22. [Google Scholar] [CrossRef]
- Wen, B.P.; Yan, Y.J. Influence of structure on shear characteristics of the unsaturated loess in Lanzhou, China. Eng. Geol. 2014, 168, 46–58. [Google Scholar] [CrossRef]
- He, L. Control Law of Mineral Composition and Hydrochemical Composition on Shear Strength of Cohesive Soil and Its Application. Ph.D. Thesis, China University of Geosciences, Beijing, China, 2014. [Google Scholar]
- Deng, Y.F.; Yue, X.B.; Cui, Y.J.; Shao, G.H.; Liu, S.Y.; Zhang, D.W. Effect of pore water chemistry on the hydro-mechanical behaviour of Lianyungang soft marine clay. Appl. Clay Sci. 2014, 95, 167–175. [Google Scholar] [CrossRef]
- Dutta, J.; Mishra, A.K. A study on the influence of inorganic salts on the behaviour of compacted bentonites. Appl. Clay Sci. 2015, 116, 85–92. [Google Scholar] [CrossRef]
- Wang, X. Study on Influence of Dry Wet Cycle on Shear Strength, Structure and Slope Stability of Loess. Master’s Thesis, Xi’an University of Technology, Xi’an, China, 2017. [Google Scholar] [CrossRef]
- Li, G.Y.; Wang, F.; Ma, W.; Fortier, R.; Mu, Y.H.; Mao, Y.C.; Hou, X. Variations in strength and deformation of compacted loess exposed to wetting-drying and freeze-thaw cycles. Cold Reg. Sci. Technol. 2018, 151, 159–167. [Google Scholar] [CrossRef]
- Li, P.; Li, T.L.; Vanapalli, S.K. Vanapalli, Prediction of soil-water characteristic curve for Malan loess in Loess Plateau of China. J. Cent. South Univ. 2018, 25, 432–447. [Google Scholar] [CrossRef]
- Lian, B.Q.; Wang, X.G.; Zhan, H.B.; Wang, J.D.; Peng, J.B.; Gu, T.F.; Zhu, R.S. Creep mechanical and microstructural insights into the failure mechanism of loess landslides induced by dry-wet cycles in the Heifangtai platform, China. Eng. Geol. 2022, 300, 106589. [Google Scholar] [CrossRef]
- Sadeghi, H.; Hossen, S.B.; Chiu, A.C.F.; Cheng, Q.; Ng, C.W.W. Water retention curves of intact and re-compacted loess at different net stresses. Jpn. Geotech. Soc. Spec. Publ. 2016, 2, 221–225. [Google Scholar] [CrossRef]
- SL237-1999; Industrial Standard of the People’s Republic of China: Geotechnical Test Code. Ministry of Water Resources of the People’s Republic of China: Beijing, China, 1999.
- Li, X.A.; Li, L.C. Quantification of the pore structures of Malan loess and the effects on loess permeability and environmental significance, Shaanxi Province, China: An experimental study. Environ. Earth Sci. 2017, 76, 523. [Google Scholar] [CrossRef]
- Li, X.A.; Li, L.C.; Song, Y.; Hong, B.; Wang, L.; Sun, J.Q. Characterization of the mechanisms underlying loess collapsibility for land-creation project in Shaanxi Province, China-a study from a micro perspective. Eng. Geol. 2019, 249, 77–88. [Google Scholar] [CrossRef]
- Xu, L.N.; Deng, H.Y.; Niu, L.; Zheng, J.J.; Qian, Y.M. Experimental study on mechanical properties of fiber cement soil cured at low temperature under salt dry wet cycle. J. Civ. Environ. Eng. 2022, 44, 10. [Google Scholar]
- Liu, C.; Tang, C.S.; Shi, B.; Suo, W.B. Automatic quantification of crack patterns by image processing. Comput. Geosci. 2013, 57, 77–80. [Google Scholar] [CrossRef]
- Yin, J.; Hu, T. Mechanical properties of collapsible loess and effect of dry wet cycle on fissure development. Yellow River 2022, 44, 143–146. [Google Scholar] [CrossRef]
- Lu, Z.H.; Chen, Z.H.; Pu, Y.B. CT study on the crack evolution of expansive soil during drying and wetting cycles. Chin. Geogr. Sci. 2002, 23, 417–422. [Google Scholar] [CrossRef]
- Tang, C.S.; Shi, B.; Liu, C.; Wang, B.J. Factors affecting the surface cracking in clay due to drying shrinkage. J. Hydraul. Eng. 2007, 38, 8. [Google Scholar]
- Mcdowell, G.R.; Bolton, M.D. On the micromechanics of crushable aggregates. Géotechnique 1998, 48, 667–679. [Google Scholar] [CrossRef]
- Iverson, N.R.; Mann, J.E.; Iverson, R.M. Effects of soil aggregates on debris-flow mobilization: Results from ring-shear experiments. Eng. Geol. 2010, 114, 84–92. [Google Scholar] [CrossRef]
- Kong, F.S.; Nie, L.; Xu, Y.; Rui, X.J.; He, Y.Y.; Zhang, T.; Wang, Y.Z.; Du, C.; Bao, C.H. Effects of freeze-thaw cycles on the erodibility and microstructure of soda-saline loessal soil in Northeastern China. CATENA 2022, 209, 105812. [Google Scholar] [CrossRef]
- Qin, P.; Qin, Z. Study on the law of strength decrease of compacted fill with the increase of immersion time. J. Zhejiang Inst. Water Resour. Hydropower 2010, 2, 61–64. [Google Scholar] [CrossRef]
- Shao, S.J.; Zhou, F.F.; Long, J.Y. Long, Structural properties of loess and its quantitative parameter. J. For. Res. 2004, 15, 243–245. [Google Scholar] [CrossRef]
- Xie, D.; Qi, J. A new approach to the study of soil structure and its quantitative parameters. Chin. J. Geotech. Eng. 1999, 21, 651–656. [Google Scholar]
- Tiwari, B.; Tuladhar, G.R.; Marui, H. Variation in Residual Shear Strength of the Soil with the Salinity of Pore Fluid. Journal of Geotechnical and Geoenvironmental Engineering. J. Geotech. Geoenviron. Eng. 2005, 131, 1445–1456. [Google Scholar] [CrossRef]
- Wen, B.P.; He, L. Influence of lixiviation by irrigation water on residual shear strength of weathered red mudstone in Northwest China: Implication for its role in landslides’ reactivation. Eng. Geol. 2012, 151, 56–63. [Google Scholar] [CrossRef]
- Wang, S.; Xie, W.; Chang, Y.; Shan, S.; Jing, X. Study on microstructure and fractal characteristics of collapsible loess under water immersiona. Geol. J. Univ. 2023, 29, 280–288. [Google Scholar]
- Hao, Z.H.; Li, X.A.; Gao, R.R.; Hu, W.; Zhang, J.; He, J. Experimental study of the effect of bound water on the shear strength and structural units of Malan loess. Q. J. Eng. Geol. Hydrogeol. 2022, 56, qjegh2021-168. [Google Scholar] [CrossRef]


| Particle Size Fraction (%) | (%) | (%) | Gs | (%) | ρd (g/cm3) | ||
|---|---|---|---|---|---|---|---|
| >0.075 mm | 0.075–0.005 mm | <0.005 mm | |||||
| 2.78 | 73.06 | 24.16 | 29.12 | 17.50 | 2.70 | 16.92 | 1.41 |
Disclaimer/Publisher’s Note: The statements, opinions and data contained in all publications are solely those of the individual author(s) and contributor(s) and not of MDPI and/or the editor(s). MDPI and/or the editor(s) disclaim responsibility for any injury to people or property resulting from any ideas, methods, instructions or products referred to in the content. |
© 2023 by the authors. Licensee MDPI, Basel, Switzerland. This article is an open access article distributed under the terms and conditions of the Creative Commons Attribution (CC BY) license (https://creativecommons.org/licenses/by/4.0/).
Share and Cite
Hao, Z.; Li, X.; Gao, R.; Yao, W.; Wang, Y.; Zhao, W.; Sang, H. Study on Shear Behavior and Mechanism Based on Shear Functional Unit of Loess Microstructure. Sustainability 2023, 15, 11402. https://doi.org/10.3390/su151411402
Hao Z, Li X, Gao R, Yao W, Wang Y, Zhao W, Sang H. Study on Shear Behavior and Mechanism Based on Shear Functional Unit of Loess Microstructure. Sustainability. 2023; 15(14):11402. https://doi.org/10.3390/su151411402
Chicago/Turabian StyleHao, Zhitao, Xi’an Li, Rongrong Gao, Wang Yao, Yukun Wang, Wenqi Zhao, and Hongbo Sang. 2023. "Study on Shear Behavior and Mechanism Based on Shear Functional Unit of Loess Microstructure" Sustainability 15, no. 14: 11402. https://doi.org/10.3390/su151411402
APA StyleHao, Z., Li, X., Gao, R., Yao, W., Wang, Y., Zhao, W., & Sang, H. (2023). Study on Shear Behavior and Mechanism Based on Shear Functional Unit of Loess Microstructure. Sustainability, 15(14), 11402. https://doi.org/10.3390/su151411402