Article

Multi-Level Fuzzy Comprehensive Evaluation for Water Resources Carrying Capacity in Xuzhou City, China

1
School of Resources and Geosciences, China University of Mining and Technology, Xuzhou 221116, China
2
State Key Laboratory of Hydrology-Water Resources and Hydraulic Engineering, Nanjing Hydraulic Research Institute, Nanjing 210029, China
3
Research Center for Climate Change, Ministry of Water Resources, Nanjing 210029, China
4
Jiangsu Research Center of Land and Resources, Nanjing 210017, China
5
Jiangsu Hydraulic Research Institute, Nanjing 210017, China
*
Author to whom correspondence should be addressed.
Sustainability 2023, 15(14), 11369; https://doi.org/10.3390/su151411369
Submission received: 11 May 2023 / Revised: 13 July 2023 / Accepted: 19 July 2023 / Published: 21 July 2023

Abstract

:
Water resources, as an essential natural resource, plays an irreplaceable role in the ecological environment, social economy, and human survival. Water resource carrying capacity (WRCC), as an important indicator of sustainable development, has been widely used to assess the capacity of water resources to support economic and social development. Using Xuzhou City as a case study, the sustainable capacity of water resources in the current (from 2012 to 2020) and future (projected scenarios in 2025 and 2030) stages were investigated by constructing a multi-level fuzzy-based evaluation model. The results indicated that the average WRCC score is 0.4388 in Xuzhou City, ranging from 0.2908 to 0.6330, with a significant decline in the score value of 0.4644 in 2019 but an apparent improvement in WRCC from 2012 to 2020. However, the continued pressure on water resources sustainable development is unchanged in Xuzhou, according to the projected assessment of WRCC in 2025 and 2030. Overall, the WRCC in Xuzhou City will be overloaded under future development scenarios, i.e., sustainable development mode (Scenario A), water conservation mode (Scenario B), rapid socioeconomic development mode (Scenario C), and adjustment of industrial structure mode (Scenario D). Thus, several measures, such as industrial restructuring and water conservation and utilization, should be conducted to enhance the carrying capacity of regional water resources and ensure the quality and sustainability of regional social and economic development. The results can provide a reference for the rational utilization of water resources in Xuzhou and are of some significance in promoting the city’s coordinated socioeconomic growth.

1. Introduction

Water resource is a crucial natural resource for socioeconomic development and a contributory factor to regional sustainability [1,2,3], which is the ultimate connector in the global commitment towards a sustainable future: the 2030 Agenda for Sustainable Development [4] and its 17 sustainable development goals (SDGs). According to the United Nations World Water Development Report 2020, global water consumption has increased sixfold over the past 100 years, and it is projected to grow steadily at a rate of about 1% per year due to the increasing population, economic development and shifting consumption patterns [5]. Thus, the shortage of water resources severely restricts the global and regional sustainable development of society and the economy under the changing environments [6,7], e.g., Northern Africa [8], Western Asia, Western USA [9], and so on [10]. As we know, China is a country with a relative lack of water resources, one of the 13 water-poor countries in the world [11], as its per capita water supply is barely 25% of the global average. More than 400 cities in China suffer from a water shortage crisis, with a shortage of 6 billion cubic meters of water [12]. In the northern Jiangsu Province, Xuzhou has experienced rapid social and economic development in recent years, with the gross domestic product (GDP) increasing from 295.147 billion yuan to 731.977 billion yuan during 2000–2020. The increasing water crisis, such as water shortages, water environment pollution, and low water resource utilization, has become a major bottleneck for the regional economy and society’s sustainable development. Therefore, it is imperative to rationally allocate the regional water resources in Xuzhou by coordinating the urban water use in all sectors comprehensively [13].
Carrying capacity began in ecology and was first applied to population issues by Parker and Burgess in 1921 [14]. Subsequently, in the fields of basic and applied ecology, carrying capacity is typically defined as the maximum population size that can be supported indefinitely by a given environment [15]. This concept or idea was applied in many fields, such as food system, life science, biodiversity, environmental system, land use planning, and so on [16,17,18,19]. For example, in the early 1980s, the United Nations Education Scientific and Cultural Organization (UNESCO) introduced the concept of “resource carrying capacity”, and then carrying capacity became the margin of the habitat’s or environment’s ability to provide the resources necessary to sustain human life, which is an important indicator to represent the sustainable status of economy and society [20]. Similarly, water resources carrying capacity (WRCC) was first defined by the Xinjiang Water Resources Soft Science Project Group in 1989. Certainly, the WRCC, as an essential component of resource carrying capacity, is a natural combination of carrying capacity and the water resources system [21,22]. However, there is no precise definition of WRCC due to the complexity of the water system [23]. On the one hand, WRCC can be defined as the maximum capacity of water resources in a certain area to support the socioeconomic development of the area after scientific and reasonable allocation under a certain economic level and/or social production conditions, keeping an ecosystem in a benign state by following the principles of sustainable development [24,25]. For example, Zuo et al. [26] comprehensively considered social, economic and environmental indexes and adopted AHP-FMADM to assess the WRCC of 15 regions in the Xinjiang Uygur autonomous region, from 2004 to 2017, on the premise of maintaining the benign and sustainable development of the ecosystem. On the other hand, WRCC can be evaluated from the perspective of focusing on water resources supply and demand analysis and sustainable development. For example, Ait-Aoudia et al. [27] used water supply and demand analysis to analyze the balance between water supply and domestic demand to assess the WRCC of Algeria; Chapagain et al. [28] estimated water availability and demand in terms of the extent of socioeconomic growth supported by water availability to assess the WRCC in Kaski District, Nepal. In addition, some new methods have been proposed in recent years. For instance, Magria et al. [29] proposed a new method using the eponymous index (WODBI) and the sustainable development index (SDIW) to assess the water carrying capacity of the Oran region in two stages and to obtain the maximum population and the optimal GDP per capita through water regulation optimization; Khorsandi et al. [30] evaluated Iran’s water carrying capacity by combining land and water constraints into the human appropriated net primary production (HANPP) evaluation.
Due to the characteristics of the enormous population and the challenge of water resources in China, many scholars have extensively paid attention to the WRCC in China. Recently, various methods and theories are applied to analyze the urban, regional, and watershed WRCC in China, such as complex system analysis, indicator evaluation system, and so on. The complex system analysis methods include the system dynamics method (SD), pressure-state-response (PSR) analysis, ecological footprint analysis, cloud model analysis method, and so on. The SD method [31,32] is to construct a model using computer simulation technology to evaluate the WRCC in a region. For example, the SD model was used by Sun et al. [33] to simulate the WRCC in Xiong’an New Area under four different scenarios, including the original planning scenario, industrialization acceleration scenario, environmental governance scenario, and optimized development scenario. However, the SD model is based on assumptions and simplifications, which may not fully represent the complex and dynamic nature of water resource systems. It is difficult to accurately capture parameters in the simulation of the SD model in long-term development planning for water resources, so. scholars combined the SD method with other methods to evaluate the WRCC in a region and obtained good simulation results [34,35]. The PSR model [36,37] can fully reflect the interrelationship between pressure and change in the environment. For instance, using a two-stage network DEA model and the DPSIR (driving force–pressure–state–impact–response) model, Tan et al. [38] analyzed water and land carrying capacity and utilization efficiency. However, existing studies have only focused on the evaluation of the carrying capacity with a single factor, and the PSR method is not very useful for socioeconomic indexes. The ecological footprint model [39,40] results tend to be static and unable to predict the future trend of the WRCC in a region. The cloud model [41,42] has a novel algorithm and high reliability of the weight calculated for evaluating the regional WRCC. However, the model involves a massive amount of computation and many complex factors, making it difficult to comprehensively evaluate [43]. In summary, these complex system analysis methods can reflect the coupling relationship of the internal systems of the regional WRCC in theory and can also calculate the scale of the regional WRCC [44]. However, the amount of index data required for calculation is huge, and the calculation process is complicated, so they are not suitable to be applied in the region with insufficient data. In contrast, index evaluation system methods are more widely used due to their simple operation.
The index evaluation system methods include artificial neural networks, comprehensive index analysis, principal component analysis, and fuzzy comprehensive evaluation (FCE) methods. The artificial neural networks method can approximate any nonlinear function in theory, and can usually predict multivariable nonlinear systems with satisfactory results: for example, Shi and Zhang [45] used it to predict water consumption in Zhaozhou County; however, the artificial neural network prediction is based on relatively independent systems, making it challenging to consider the coupling between systems [46]. The principal component analysis [47,48] is a statistical analysis method for reducing dimensionality that can replace the original information of many variables with a few independent comprehensive indexes. For instance, after selecting the most important indexes, Cao et al. [49] calculated the natural support capacity(NSC) level of water resources in the Fuyang district by using the weighted average values of the principal components. However, it is not suitable for water resource prediction because of the poor coincidence with prediction. For the comprehensive index method [50,51], the index selection is often greatly affected by subjective factors, and further studies are needed on whether the index selection is appropriate and whether the indexes selected can accurately reflect the current WRCC status. In addition, the FCE model uses the fuzzy mathematics principle to enhance the quantitative evaluation of fuzzy information to evaluate the WRCC of a region. For instance, based on the FCE model, Zhang et al. [52] selected 15 indicators from the three main aspects of resources, society, and environment and calculated the WRCC value in Wuhan from 2013 to 2017. However, in the classical FCE model, many scholars tended to adopt a single method for weight calculation, such as the entropy weight method [53] or the analytic hierarchy process (AHP) method [54], which may lead to objectivity or subjectivity in weight determination. Previous studies on predicting the future of the WRCC in Xuzhou have not comprehensively considered the changes in future water conditions, local development planning, and future development trends.
Therefore, after selecting a total of 14 main influence indexes in the four subsystems of water resources, social economy and ecosystem, this paper combined the AHP method and entropy weight method to carry out the weight distribution of each index and finally built a multi-level fuzzy comprehensive evaluation model to evaluate the WRCC in Xuzhou from 2012 to 2020. Moreover, this paper comprehensively considered the future water situation change, local development planning and future development trends of Xuzhou City. Thus, the possible WRCC in the short-term (2025) and long-term (2030) future were assessed based on the above model, considering the different development modes, such as sustainable development, water conservation, rapid socioeconomic development, and adjustment of industrial structure, with the three levels of water resources scenarios (i.e., dry, normal and wet levels). These findings will provide some basis for the future water resources development planning of Xuzhou City and also bring some reference value for water resources assessment in other areas.

2. Study Area and Data Sources

2.1. Study Area

The study area (Figure 1, 116.358°~118.667° E and 33.717°~34.976° N) is located in the northwestern region of Jiangsu Province, China, a border zone between the provinces of Jiangsu, Henan, Shandong, and Anhui, with a total area of 11,765 km2 including five districts (i.e., Gulou, Quanshan, Yunlong, Tongshan, Jiawang), three counties (i.e., Suining, Fengxian, Peixian) and two county-level cities (i.e., Pizhou and Xinyi). Agricultural land accounts for 74.5% of the total land area of Xuzhou. The surface water system is bounded by the abandoned Yellow River, which is divided into two water systems (i.e., Yi, Shu and Si water systems in the north, and the Huaihe River system in the south). There are several artificial lakes in Xuzhou, such as Yunlong Lake, Dalong Lake and Jinlong Lake. In the last five years, due to the remarkable achievements of groundwater management in Xuzhou City, the average depth of deep groundwater has increased from 17.09 m to 13.82 m. At the end of 2020, the city had a total population of around 9.08 million with regional GDP of 731.977 billion yuan (https://www.yearbookchina.com accessed on 6 November 2022). Precipitation is mainly concentrated between June and September, with an average annual precipitation of 825 mm, which is lower than the average annual evaporation of 874 mm. Consequently, seasonal water resource shortages are common. Despite its location in a temperate climate zone, water resources are extremely scarce and have uneven spatiotemporal distribution, making it one of the 40 cities in China severely afflicted by water shortages [55]. As the primary center city in the Huaihai Economic Zone, ensuring the sustainable and coordinated development of water resources, socioeconomics, and ecology is a top concern for the region.

2.2. Data Sources

In this study, a total of 14 indexes were utilized, which were mainly collected from the Xuzhou Statistical Yearbook (1996–2021) (https://www.yearbookchina.com accessed on 6 November 2022), the Xuzhou Water Resources Bulletin (2012–2020), the 14th Five-Year Plan for National Economic and Social Development of Xuzhou City and Outline of Vision 2035, and Xuzhou “14th Five-Year Plan” related special development plannings (http://xz.gov.cn/fiveplan/index.html accessed on 6 November 2022). The details for these indexes from 2012 to 2020 can be seen in Table S1.

3. Methodology

3.1. Creation of the Evaluation Index System and Grading Standard

3.1.1. Selection of the Evaluation Indexes

Based on the concept of the WRCC index system, the conceptual framework of the WRCC assessment system was defined in this work, as shown in Figure 2. In this study, the WRCC index system of Xuzhou City comprised three levels: The first level refers to the target layer (A, i.e., the WRCC in this work); the second level is the criterion layer (Ui), including four subsystems: the water resources subsystem (U1), the social development subsystem (U2), the economic development subsystem (U3), and the ecosystem subsystem (U4). The third level is the index layer (Uij), which consists of the assessment indexes selected in U1, U2, U3, and U4. These indexes were classified into two groups, i.e., positive and negative indexes. For the positive indexes, a greater value means a stronger WRCC, whereas a greater value of the negative indexes means a weaker WRCC [56,57].

3.1.2. Classification of the Evaluation Grades

Following previous studies [58,59], these indexes were classified into three grades (V1, V2, V3) in this work, as shown in Table 1. V1 means a strong WRCC, i.e., a strong capacity for sustainable development, indicating that current water resources support socioeconomic development. V3 represents a weak WRCC, meaning that the ecological environment has deteriorated without adequate water resources to ensure socioeconomic development. Relatedly, V2 falls between V1 and V3, indicating that the WRCC of the region is moderate but still has considerable room for further development and utilization.

3.2. Multi-Level Fuzzy Comprehensive Evaluation Model

3.2.1. Model Theory

The FCE model can avoid the uncertainty and fuzziness of the evaluation system boundary and improve the objectivity and accuracy of the evaluation results to more comprehensively reflect the regional water resources situation [60,61,62]. The basic principle is as follows. Construct a factor set: U = {U1, U2, …, Ui} (i = 1, 2, …, n), where Ui (i = 1, 2, …, n) are the n evaluation indexes of the objects being evaluated. Construct an evaluation set: V = {V1, V2, …, Vh}, (h = 1, 2, …, m), where Vh (h = 1, 2, …, m) are the m evaluation grades of the objects being evaluated. The membership degree of the evaluation set V corresponding to each index of U is bi1, bi2, …, bij, which forms a fuzzy set on V denoted as Bi = (bi1, bi2, …, bij). Hence, a fuzzy relation matrix R:
R = B 1 B 2 B i = b 11 b 12 b 1 j b 21 b 22 b 2 j b i 1 b i 2 b i j
Then, assuming that a combined weight set of each index for W = {W1, W2, …, Wi}, the combined weight set needs to satisfy the condition that W1 + W2 +…+ Wi = 1 (0 ≤ WI ≤ 1). The fuzzy relation matrix R is multiplied by the combined weight of each index to obtain the comprehensive evaluation matrix B:
B = W R = W 1 , W 2 , , W i R
where Wi is the combined index weight; R is the fuzzy relation matrix.

3.2.2. Calculation of the Membership Degree

To eliminate the jumping phenomenon caused by the slight difference between evaluation grades, the fuzzy method was used to construct the membership function, making all evaluation grades transition smoothly [63]. The membership function in this paper employed the trapezoidal distribution method. Set the critical value of V1 and V2 as k1, the critical value of V2 and V3 as k3, and the interval midpoint value of V2 as k2 (k2 = (k1 + k3)/2). Moreover, set the membership degree of the interval midpoint value of V2 to be 1, the membership degree of the two critical points to be 0.5, and the value decreases from the middle to both sides.
If the value of an evaluation index increases with the evaluation level k, it is referred to as a positive index (PI). Otherwise, it is called a negative index (NI) [64]. Out of 14 evaluation indexes, there are 8 positive indexes (U11, U12, U14, U31, U33, U42, U43 and U44) and 6 negative indexes (U13, U21, U22, U23, U32 and U41). The calculation formula is as follows:
μ V 1 ( U i j ) = 0.5 ( 1 + U i j k 1 U i j k 2 ) ( P I : U i j k 1   or   N I : U i j k 1 ) 0.5 ( 1 k 1 U ij k 1 k 2 ) ( P I : k 2 U i j < k 1   or   N I : k 2 U i j > k 1   ) 0 ( P I : U i j < k 2   or   N I : U i j > k 2 )
μ V 3 ( U i j ) = 0 ( P I : U i j k 2   or   N I : U i j k 2 ) 0.5 ( 1 U i j k 3 k 2 k 3 ) ( P I : k 3 U i j < k 2   or   N I : k 2 < U i j k 3 ) 0.5 ( 1 + k 3 U ij k 2 U i j ) ( P I : U i j < k 3   or   N I : U i j > k 3 )
μ V 2 ( U i j ) = 0.5 ( 1 U ij k 1 U i j k 2 ) ( P I : U i j k 1   or   N I : U i j k 1 ) 0.5 ( 1 + k 1 U i j k 1 k 2 ) ( P I : k 2 U i j < k 1   or   N I : k 2 U i j > k 1 ) 0.5 ( 1 + U i j k 3 k 2 k 3 ) ( P I : k 3 U i j < k 2   or   N I : k 3 U i j > k 2 ) 0.5 ( 1 k 3 U i j k 2 U i j ) ( P I : U i j < k 3   or   N I : U i j > k 3 )
where k1~k3 are the critical values of the evaluation grades; Uij is the value of the jth index of the ith sample; μV(Uij) is the extent to which Uij belongs to level k. The closer μV(Uij) is near 1, the more closely Uij belongs to level k.

3.2.3. Determination of the Evaluation Index Weight

Entropy Method

The entropy weight method can judge the degree of dispersion of each index value and measure the weight more objectively. The lower the index entropy value, the higher the weight, and the greater the impact on WRCC. On the contrary, the impact on WRCC is smaller [65,66,67,68]. The specific steps of the entropy method are as follows:
Create the initial evaluation matrix R:
R = ( U i j ) n × m   ( i = 1 , 2 , , n ; j = 1 , 2 , , m )
where Uij is the value of the jth index of the ith sample.
The normalization formula of index data [69,70]:
For a positive index:
b i j = U i j min U i j max U i j min U i j ( i = 1 , 2 , , n ; j = 1 , 2 , , m )
For a negative index:
b i j = max U i j U i j max U i j min U i j ( i = 1 , 2 , , n ; j = 1 , 2 , , m )
where Uij is the value of the jth index of the ith sample; bij is the data after Uij normalization processing; min(Uij) and max(Uij) are the minimum and maximum values of the original data of the indexes.
Determine the entropy value of the evaluation index ej:
p i j = b i j j = 1 m ( 1 + b i j )
e j = 1 ln m j = 1 m p i j ln ( p i j )
when pij = 0, the calculation of ln(pij) is meaningless, hence the value of pij is adjusted as:
p i j = 1 + b i j j = 1 m ( 1 + b i j )
Calculate the evaluation index weights wi:
w i = 1 e j j = 1 n ( 1 e j )

Analytic Hierarchy Process

The AHP, proposed by T.L. Satty, represents subjective judgments with objectively quantified values [71,72]. The AHP method consists of the following steps:
(1)
Construction of hierarchy: Divide the evaluation indexes of the WRCC in Xuzhou into three layers: the target layer, the criterion layer and the index layer.
(2)
Create a judgment matrix R′: Compare factors and determine their relative importance. Calculate the rank of a comparative judgment matrix using the 1–9 scale of importance (Table 2).
R = ( U i j ) n × n
where Uij is the comparison of the significance of index i and index j.
(3)
Calculating the resultant λmax and the corresponding eigenvectors w′. The eigenvectors (weights) w′ were determined:
w i ¯ = ( j = 1 n U i j ) 1 n ( i = 1 , 2 , , n )
w = w i ¯ i = 1 n w i ¯
where wi’ is the ith component of w’ obtained from the calculation of R’.
Thus, the maximum eigenvalue was determined:
λ max = i = 1 n ( R w ) n w i
where (Rw’)i represents the ith eigenvector component (Rw’).
(4)
Due to the complexity of water resources systems and the subjectivity of people’s perceptions, a matrix consistency test was required to eliminate conflicts in the judgments from two comparisons. Consistency was tested using the following formula:
C I = λ max n n 1
C R = C I R I
where RI is the average value of the random consistency test index; CI is the consistency index, which only passes the consistency test if CR = CI/RI < 0.1; and the value of RI is proportional to the order n of R′ (Table 3).
In this work, the Yaahp10.3 software was used to estimate the index weights in the AHP method due to its consistency (http://www.jeffzhang.cn/yaahp10.X-release-note/ accessed on 27 November 2022).

The Combined Weights

The combined weights were obtained by the formula of multiplication integration:
w i = w i w i i = 1 n w i w i
where wi″ is the combined weight of indexes; wi is the index weight obtained by the entropy weight method; wi′ is the index weight obtained through the analytic hierarchy process.

3.2.4. Classification of the Evaluation Grades

Set the scoring interval to be (0,1), and then the comprehensive score C of WRCC was calculated by using Formula (20) to score the evaluation set (V1, V2, V3). By referencing the WRCC grading standards in other related papers and combining them with the actual situation in Xuzhou City, the WRCC grade was divided reasonably [73,74], as shown in Table 4.
C = j = 1 3 b j k c j j = 1 3 b j k
where bj is the membership degree of the corresponding evaluation index; cj is the score value for each grade, and take c1 = 0.95, c2 = 0.5, c3 = 0.05 for grades V1, V2, V3, respectively; when evaluating the WRCC of a region, the value of k is typically 1.

3.3. Projection of Approaching and Long-Term Water Resources Carrying Capacity

3.3.1. Projection of Relevant Indexes

Projection of Social and Economic Development-Related Indexes

The GM (1,1) grey prediction model was widely used to forecast regional socioeconomic indexes with a high degree of confidence [75,76], such as population and GDP development, etc. Thus, in this paper, the GM (1,1) model was used to predict the values of economy and population-related indexes for Xuzhou in 2025 and 2030, concerning the future planning of Xuzhou’s economy and population. The model equation is shown as follows:
X ( 0 ) = X ( 0 ) ( i ) , i = 1 , 2 , , n
X ( 1 ) ( k ) = ( X ( 0 ) ( 1 ) u a ) e a k + u a
where X(0)(i) is the ith original data; X(1)(k) is the kth permutation data accumulated after correlation data processing; a and u are the correlation parameters.
The GM (1,1) grey prediction model was adopted and combined with the Construction Plan of Industrial Transformation and Upgrading Demonstration Zone of Xuzhou City, Jiangsu Province (2019–2025), and the predicted values of social and economic development-related indexes in 2025 and 2030 were obtained, as shown in Tables S2 and S3.

Projection of Water Supply and Demand-Related Indexes

(1)
Annual average precipitation
The occurrence of annual precipitation events is random, which contributes to the difficulty in precipitation forecasting [77]. It is difficult to determine whether 2025 and 2030 will be wet years, normal years or dry years by some model forecasting methods, such as the ARIMA model. Therefore, the P-Ⅲ frequency calculation method was adopted to predict the annual average precipitation of Xuzhou City in 2025 and 2030, which was divided into three water resources scenarios (i.e., dry, normal and wet years). The process of the P-III frequency calculation method is: the data on the annual average precipitation of Xuzhou City from 1990 to 2020 were obtained from the Statistical Yearbook of Xuzhou City, and relevant operations such as sorting from largest to smallest, calculating the modulus ratio coefficient, and calculating Cv and Cs were carried out to predict the annual average precipitation at a 25% guaranteed rate (wet year), a 50% guaranteed rate (normal year), and a 75% guaranteed rate (dry year) to be 950.0 mm, 843.9 mm and 740.8 mm.
(2)
Total water resources and water production modulus
Based on Xuzhou City’s 2012–2020 total water resources series, the total multi-year average water resources were calculated to be 3.824 billion m3, and using the P-III frequency calculation, the total water resources at a 25% guarantee rate (wet year), a 50% guaranteed rate (normal year), and a 75% guaranteed rate (dry year) are 4.292 billion m3, 3.751 billion m3, and 3.275 billion m3, respectively. Similarly, the water production modulus for the 25% guaranteed rate (wet year), the 50% guaranteed rate (normal year), and the 75% guaranteed rate (dry year) are 381.8 million m3/km2, 333.4 million m3/km2, and 290.8 million m3/km2, respectively.
(3)
Total water demand
Total water demand includes domestic water demand, water demand from industry, agriculture, forestry, livestock, and fisheries, and water demand from ecosystems [78]. Domestic water demand refers to urban and rural domestic water demand, both of which can be deduced by the trend extension method. Here is the formula for trend extension:
W D = P 0 ( 1 + ε ) n K
where WD is the annual demand for domestic water; P0 is the current population; ε is the annual growth rate of the urban or rural population; K is the intended integrated urban or rural domestic quota for one year in m3/a; n represents the number of forecast years.
Based on the per capita water consumption quota data of urban and rural areas from 2012 to 2020, by the method of the average multi-year growth rate, the per capita water consumption quota of urban and rural areas in 2025 was predicted to be 153 L/d and 87 L/d, respectively. The per capita water consumption quota for urban and rural areas in 2030 was predicted to be 178 L/d and 89 L/d, respectively. Based on the multi-year growth rates of urban and rural populations in 2025 and 2030, the urban and rural domestic water demand was predicted to be 0.366 billion m3 and 0.088 billion m3 in 2025 and was predicted to be 0.489 billion m3 and 0.078 billion m3 in 2030, respectively. The final total domestic water demand in Xuzhou was forecasted to be 0.454 billion m3 in 2025 and 0.568 billion m3 in 2030.
Due to the lack of data on each industrial sector, it is impossible to calculate the forecast process of industrial water demand by improving the reuse rate. Therefore, based on the values of the secondary sector’s water consumption in Xuzhou from 2012 to 2020, the total industrial water demand of Xuzhou in 2025 and 2030 was predicted to be 0.277 billion m3 and 0.281 billion m3, respectively. Similarly, it was anticipated that the total water demand for agriculture, forestry, and fisheries in Xuzhou will be 3.017 billion m3 in 2025 and 2.982 billion m3 in 2030. According to Xuzhou’s 14th Five-Year Plan, the expectation of Xuzhou citizens for the construction of an ecological civilization city will gradually increase, and the demand for water in the ecological environment of Xuzhou will gradually increase. Therefore, this paper forecasts that the water demand for Xuzhou’s ecological environment will increase at a rate of 30% per year, with final projections of 0.078 billion m3 in 2025 and 0.29 billion m3 in 2030.
The values of the other indexes were collected from the Outline of the 14th Five-Year Plan for National Economic and Social Development and Long-Range Objectives Through the Year 2035 of Xuzhou City. Based on the predicted annual growth rate of −5%, the industrial wastewater discharge in Xuzhou was predicted to be 19.6824 million tons in 2025 and 15.2298 million tons in 2030, respectively. Based on the plan, Xuzhou City’s urban sewage treatment rate should exceed 95% by 2025; consequently, Xuzhou City’s urban sewage treatment rate was predicted to reach 98% in 2025 and 100% in 2030. Similarly, the forest coverage rate in Xuzhou was predicted to reach 30% by 2025 and 32% by 2030. The predicted values for the corresponding indices were summarized in Tables S2 and S3.

3.3.2. Scenario Design

To predict the WRCC of Xuzhou City more scientifically and reasonably, it is necessary to study the WRCC under different scenarios [33,79,80,81,82]. In this paper, the WRCC of Xuzhou was predicted in four development scenarios: sustainable development mode, water conservation mode, rapid socioeconomic development mode, and adjustment of industrial structure mode. The setting of four scenario modes was illustrated in Table 5.
Due to the unpredictability of the future water resource situation, the water resources situation was divided into three conditions: wet years, normal years, and dry years based on the four scenarios. A summary of specific index values for the three water resource scenarios under the four development scenarios for 2025 and 2030 is shown in Tables S2 and S3.

4. Results and Discussion

4.1. Analysis of the WRCC Status Evaluation Results

4.1.1. Results of Membership Degree

The membership degree of each index between 2012 and 2020 was calculated based on the statistical data of Xuzhou City and the evaluation grades. The results are shown in Figure 3.
Taking the year 2020 as an example, the results illustrated that in 2020, the actual values of indexes U11, U14, U22, U31, U33, and U42 are closer to k1, and the membership degree μV1 is closer to 1, which is more favourable for the WRCC assessment in Xuzhou; In contrast, the actual values of indexes U12, U43, and U44 are close to k3, which has a more adverse impact on evaluation of the WRCC in Xuzhou.

4.1.2. Results of the WRCC Evaluation Index Weight

To estimate the combined weights, the relative weights of the four subsystems and fourteen indexes were calculated by the entropy weight method and the hierarchical analysis approach, as shown in Figure 4.
Based on Figure 4a–c, respectively, it can be observed that in the evaluation system of the WRCC in Xuzhou in the application of the entropy weight method, the water resources (U1), social development (U2), and ecosystem (U4) subsystems are found to have higher weights relative to the economic development subsystem (U3). In the adoption of the AHP method, water resources (U1), economy development (U3), and ecosystem (U4) subsystems are found to have a higher weight relative to the social development subsystem (U2). After the integration of the two methods, the water resources (U1), economic development (U3) and economy (U4) subsystems exhibit comparatively higher combined weights than the social development subsystem (U2). It can be seen from (c) that U11, U14 and U41 account for more than 10%, respectively, indicating that evaluation indexes with high weights are related to water resources and economy subsystems. U33 accounted for nearly 10%, which also indicated that the evaluation results of WRCC were related to the economic development subsystem.

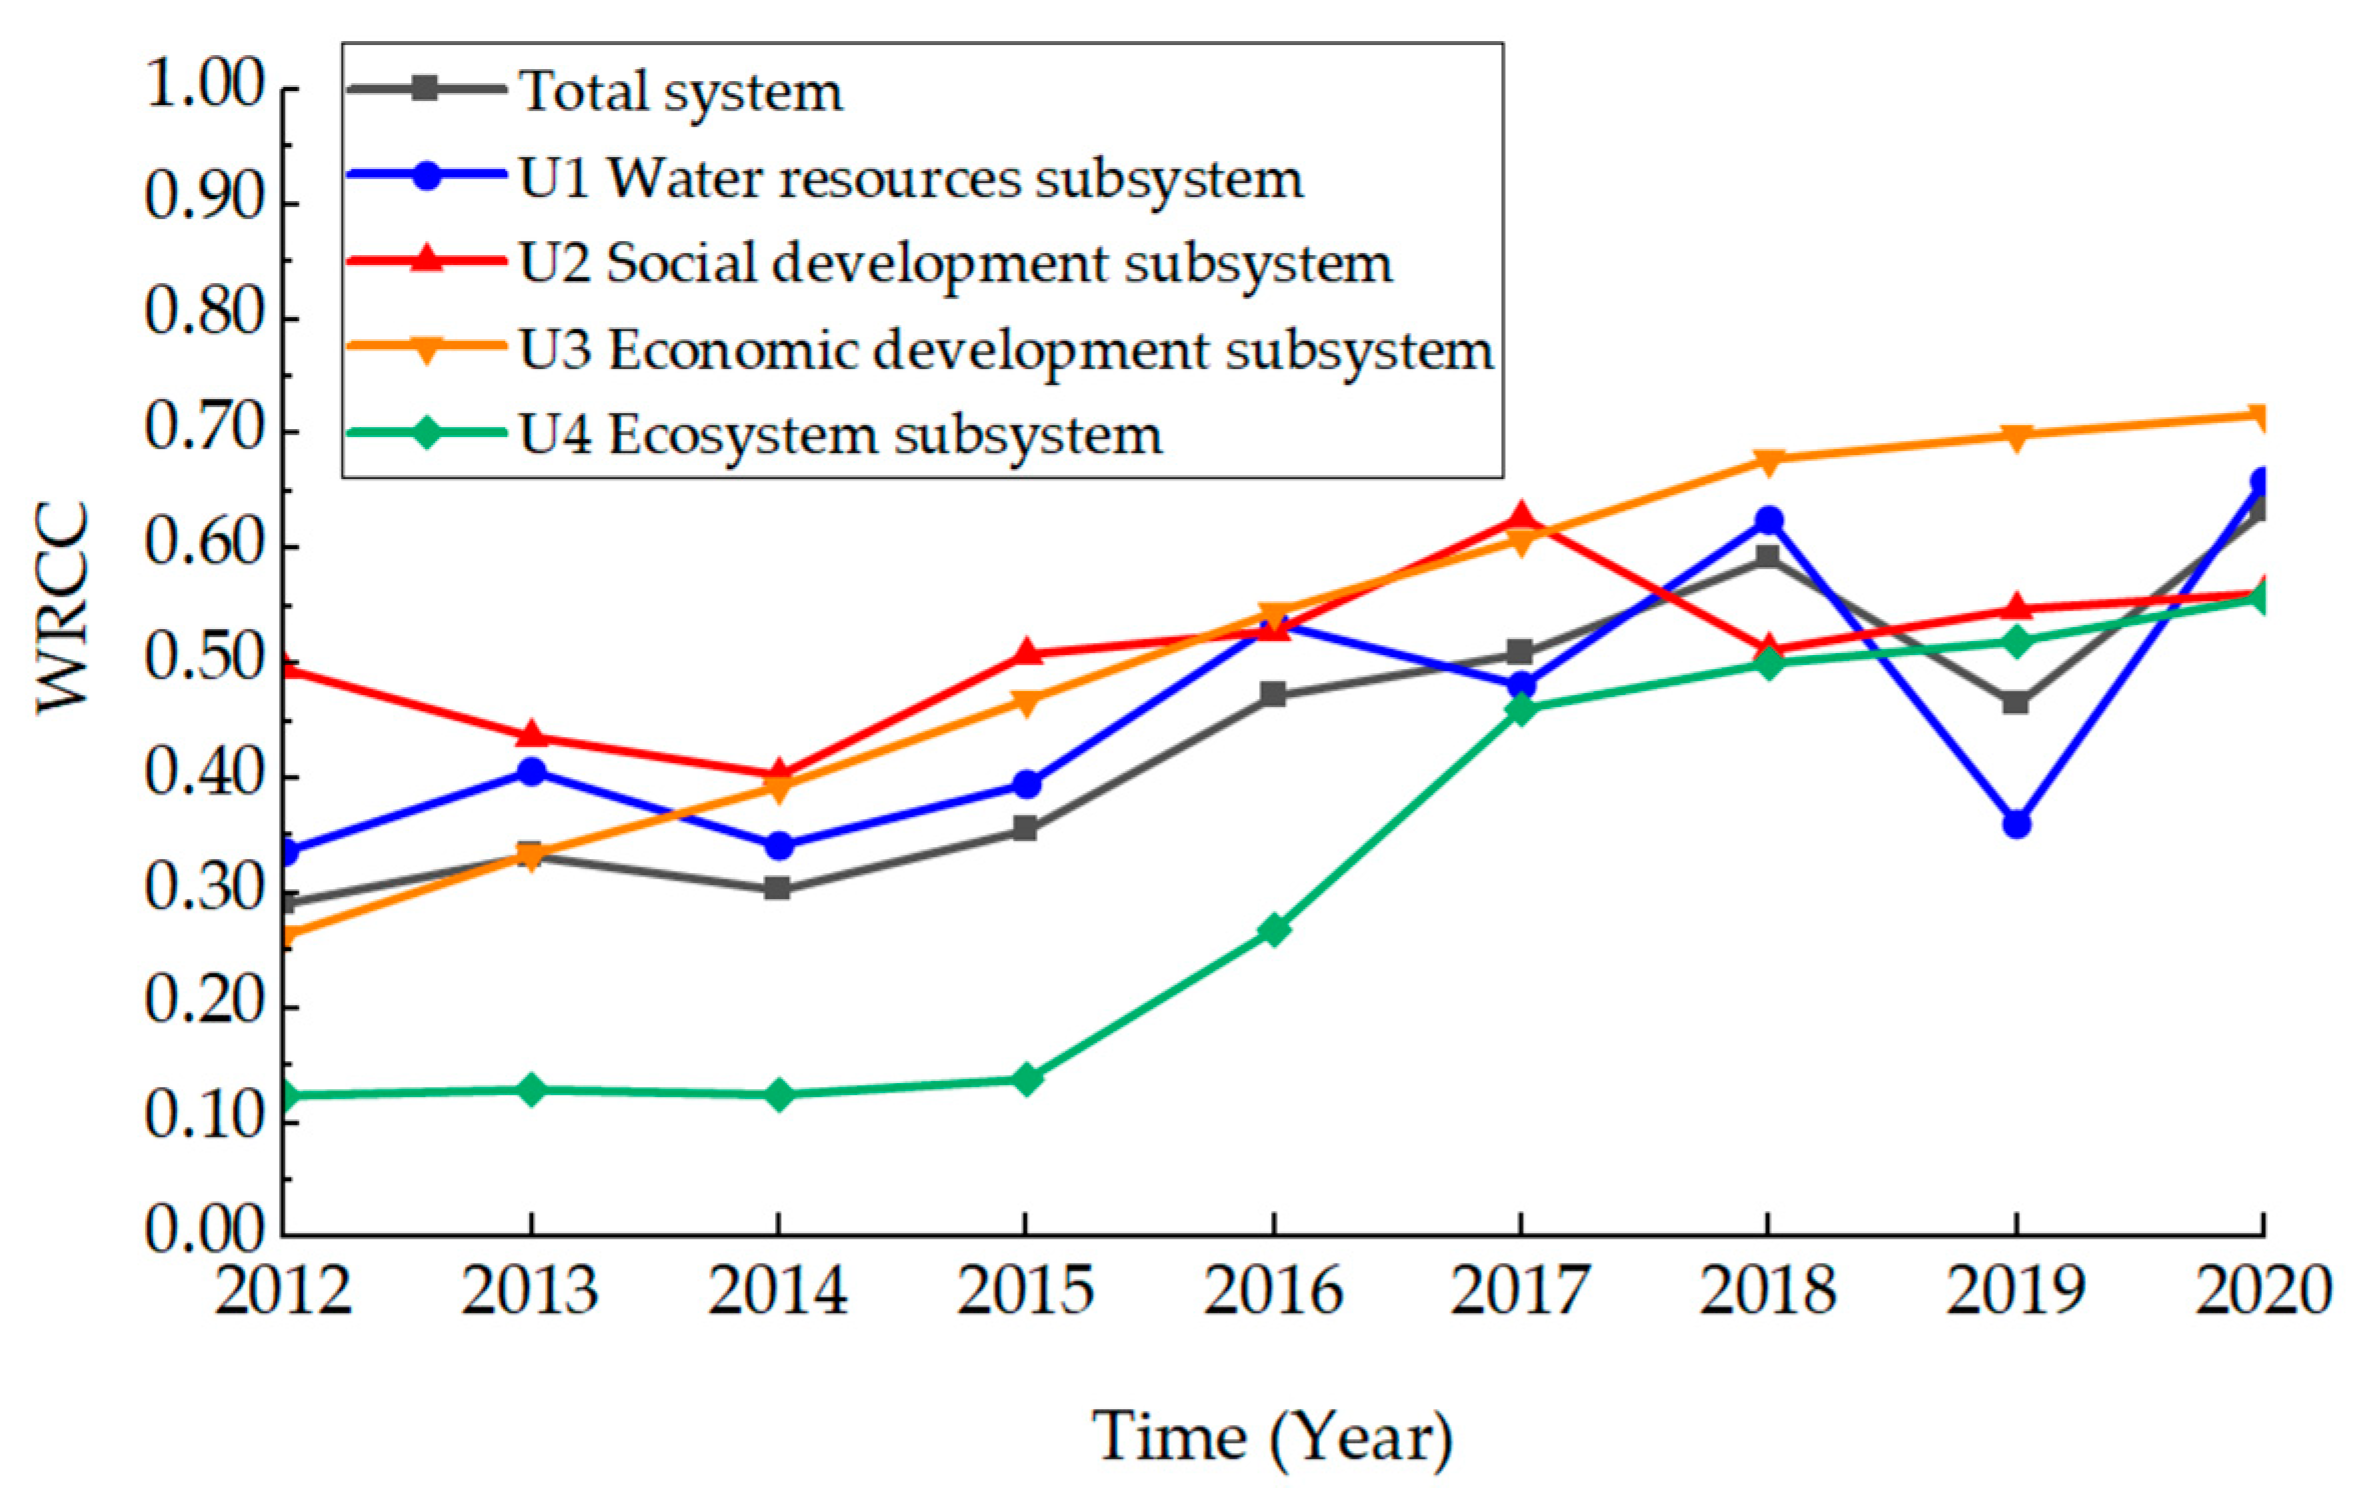
4.1.3. Analysis of the WRCC Status Evaluation

The membership matrices for the water resources subsystem, social development subsystem, economic development subsystem, and ecosystem environment subsystem were set up as RU1, RU2, RU3 and RU4, respectively, and the comprehensive score in 2020 was calculated as follows:
B U 1 = W U 1 · R U 1 = 0.3286   0.1326   0.1601   0.3787 · 0.5786 0.4214 0 0 0.5190 0.4810 0 0.6766 0.3234 0.7367 0.2633 0 = 0.4691   0 . 4154   0 . 1156
B U 2 = W U 2 · R U 2 = 0.3505   0.1864   0.4631 · 0 0.9750 0.0250 0.8349 0.1651 0   0 0.9770 0.0230 = 0.1556   0 . 8250   0 . 0194
B U 3 = W U 3 · R U 3 = 0.1591   0.2991   0.5419 · 0.5223 0.4777 0 0.4110 0.5890 0 0.5098 0.4902 0 = 0.4822   0 . 5178   0
B U 4 = W U 4 · R U 4 = 0 . 4912   0.2209   0.1798   0 . 1081 · 0.3188 0.6812 0 0.5455 0.4545 0 0 0.5800 0.4200 0 0.3185 0.6815 = 0.2771   0 . 5737   0 . 1492
B 2020 = W · R 2020 = 0.5200   0 . 1003   0 . 1396   0 . 2401 · 0.4691 0.4154 0.1156 0.1556 0.8250 0.0194 0.4822 0.5178 0 0.2771 0.5737 0.1492 = 0.3934 0.5088 0.0979
The final comprehensive score of each subsystem and WRCC in Xuzhou in 2020 are as follows:
CU1 = 0.6591 CU2 = 0.5613 CU3 = 0.7170 CU4 = 0.5575
C2020 = 0.3934 × 0.95 + 0.5088 × 0.5 + 0.0979 × 0.05 = 0.6330
According to the comprehensive score of each subsystem and the overall situation in 2020, it can be seen that the economic development subsystem has the highest score, within the range of V good carrying level, indicating that the water resources of Xuzhou City can carry the development of the economic subsystem, and the carrying condition of this subsystem is excellent. The scores of the social development and ecosystem subsystems are relatively low and within the III critical carrying level, indicating that Xuzhou’s water resources are in poor condition for supporting the social development and ecosystem subsystems. The score of the water resources subsystem is within the range of the weak carrying level IV, indicating that the water resources are in an average carrying condition for the water resources subsystem, and the total amount of water resources is sufficient due to the wet year in 2020, which is largely consistent with the actual development of local water resources. The score of the total system is within the IV level of weak loadable, meaning that the water resources of Xuzhou City in 2020 are inadequate to support the development of the economy, society and ecological environment. Similarly, a comprehensive score of WRCC of the total system and four subsystems in Xuzhou City from 2012 to 2019 was estimated, as shown in Figure 5.
As shown in Figure 5 and Figure 6, the water resources subsystem of Xuzhou City has fluctuating rating values over the nine years from 2012 to 2020, with an average rating value of 0.4598, which is within the general overload range, indicating the inadequate WRCC. The reason for the nine-year fluctuation of the water resources subsystem may lie in the changes of natural water conditions and the significant influence of the large weight of the indexes U11 and U14. The average per capita water resources of Xuzhou over nine years is approximately 430 m3, which is below the international absolute water scarcity criterion of 500 m3. The degree of water resources exploitation and utilization is exceptionally high, reaching 140% in 2014, suggesting that water consumption is mostly dependent on groundwater, which has led to water shortages as a result of groundwater overexploitation. In addition, the decline in score value in 2019 is primarily attributable to the change of the index values U11 and U14. The average annual precipitation in Xuzhou in 2019 was 29.2% less than in 2018, and both surface and groundwater resources decreased significantly, whereas the values of the indexes U11 and U14 increased significantly in 2020, a wet year, causing the scoring value to increase and the carrying capacity to enhance.
As demonstrated in Figure 5 and Figure 6, the social development subsystem of Xuzhou City composite score value exhibits a fluctuating tendency, with a major reduction in 2018 and a minimal development trend from 2019–2020, with an average score value of 0.5131 over the past nine years, which falls within the region of critical overload. This is due to the high population density in Xuzhou, which has been increasing over the past nine years, reaching 771 person/km2 in 2020, far exceeding the average population density in China. While at the same time, the urbanisation rate has been increasing, with Xuzhou City having an urbanisation rate of 70.46% by the end of 2020, far higher than the national urbanisation level, and the significant increase in population density and urban population has increased the water demand. The reduction in the 2018 score is primarily attributable to the decline in the natural population growth rate, which became negative by 2020 and will be affected by the introduction of the national three-child policy. To effectively coordinate the link between social and water resources subsystems, it is vital to increase water conservation awareness among all Xuzhou residents.
As seen in Figure 5 and Figure 6, the comprehensive rating value of the economic development subsystem increased over the nine years from 2012 to 2020, reaching 0.7170 by the end of 2020, with the WRCC level at a good level, indicating that water resources and economic development subsystems are well coordinated. During the nine years, per capita GDP has nearly doubled from RMB 46,864 in 2012 to RMB 80,674 in 2020. Simultaneously, in recent years, low-carbon and energy-saving models have dominated, and the economic structure of Xuzhou has been continuously optimised, with the tertiary sector accounting for more than 50% of GDP in 2018–2020. However, the downside is that water consumption per 10,000 yuan of GDP remains high, and there is much room for improvement.
Since 2015, the comprehensive rating value of the ecosystem subsystem in Xuzhou has climbed, with an average rating value of 0.3135 over the preceding nine years, indicating a general overload condition. The discharge of industrial wastewater, which exceeded 10,000,000 tons from 2012 to 2014 and even approached 15,000,000 tons in 2014, is the primary reason for its fluctuating score. With the release and implementation of relevant laws in Xuzhou, the discharge of industrial wastewater will reach around 20 million tons by 2020, and the urban sewage treatment rate up to standard has reached 95.5%, while the ecological water consumption rate has decreased over the past few years. Therefore, the interaction between the ecosystem and the water resources subsystems must be further harmonised for the ecosystem to provide Xuzhou with greater ecological benefits.
From Figure 5a–h and Figure 6, it is apparent that the comprehensive scores of the total system in Xuzhou lie between 0.2908 and 0.6330 and that the water resources carrying capacity rating lie between II and IV, which is generally overloaded to weakly bearable; its nine-year average comprehensive rating is 0.4388, indicating a general overload situation. The overall pattern begins with a steady climb, followed by a sharp decrease in 2019 and a return in 2020. The overall trend is similar to the graph of the integrated score value of the water resources subsystem, indicating that the WRCC of Xuzhou is most influenced by the water resources subsystem, reflecting that the WRCC of Xuzhou is diminished to some degree as a result of the decline in the average annual precipitation. As 2020 is a high-flow year in Xuzhou, the average annual precipitation rises, and the mutual coordination between the various subsystems improves, causing the integrated score value for the WRCC in Xuzhou to bounce quickly after reaching a low point in 2019.

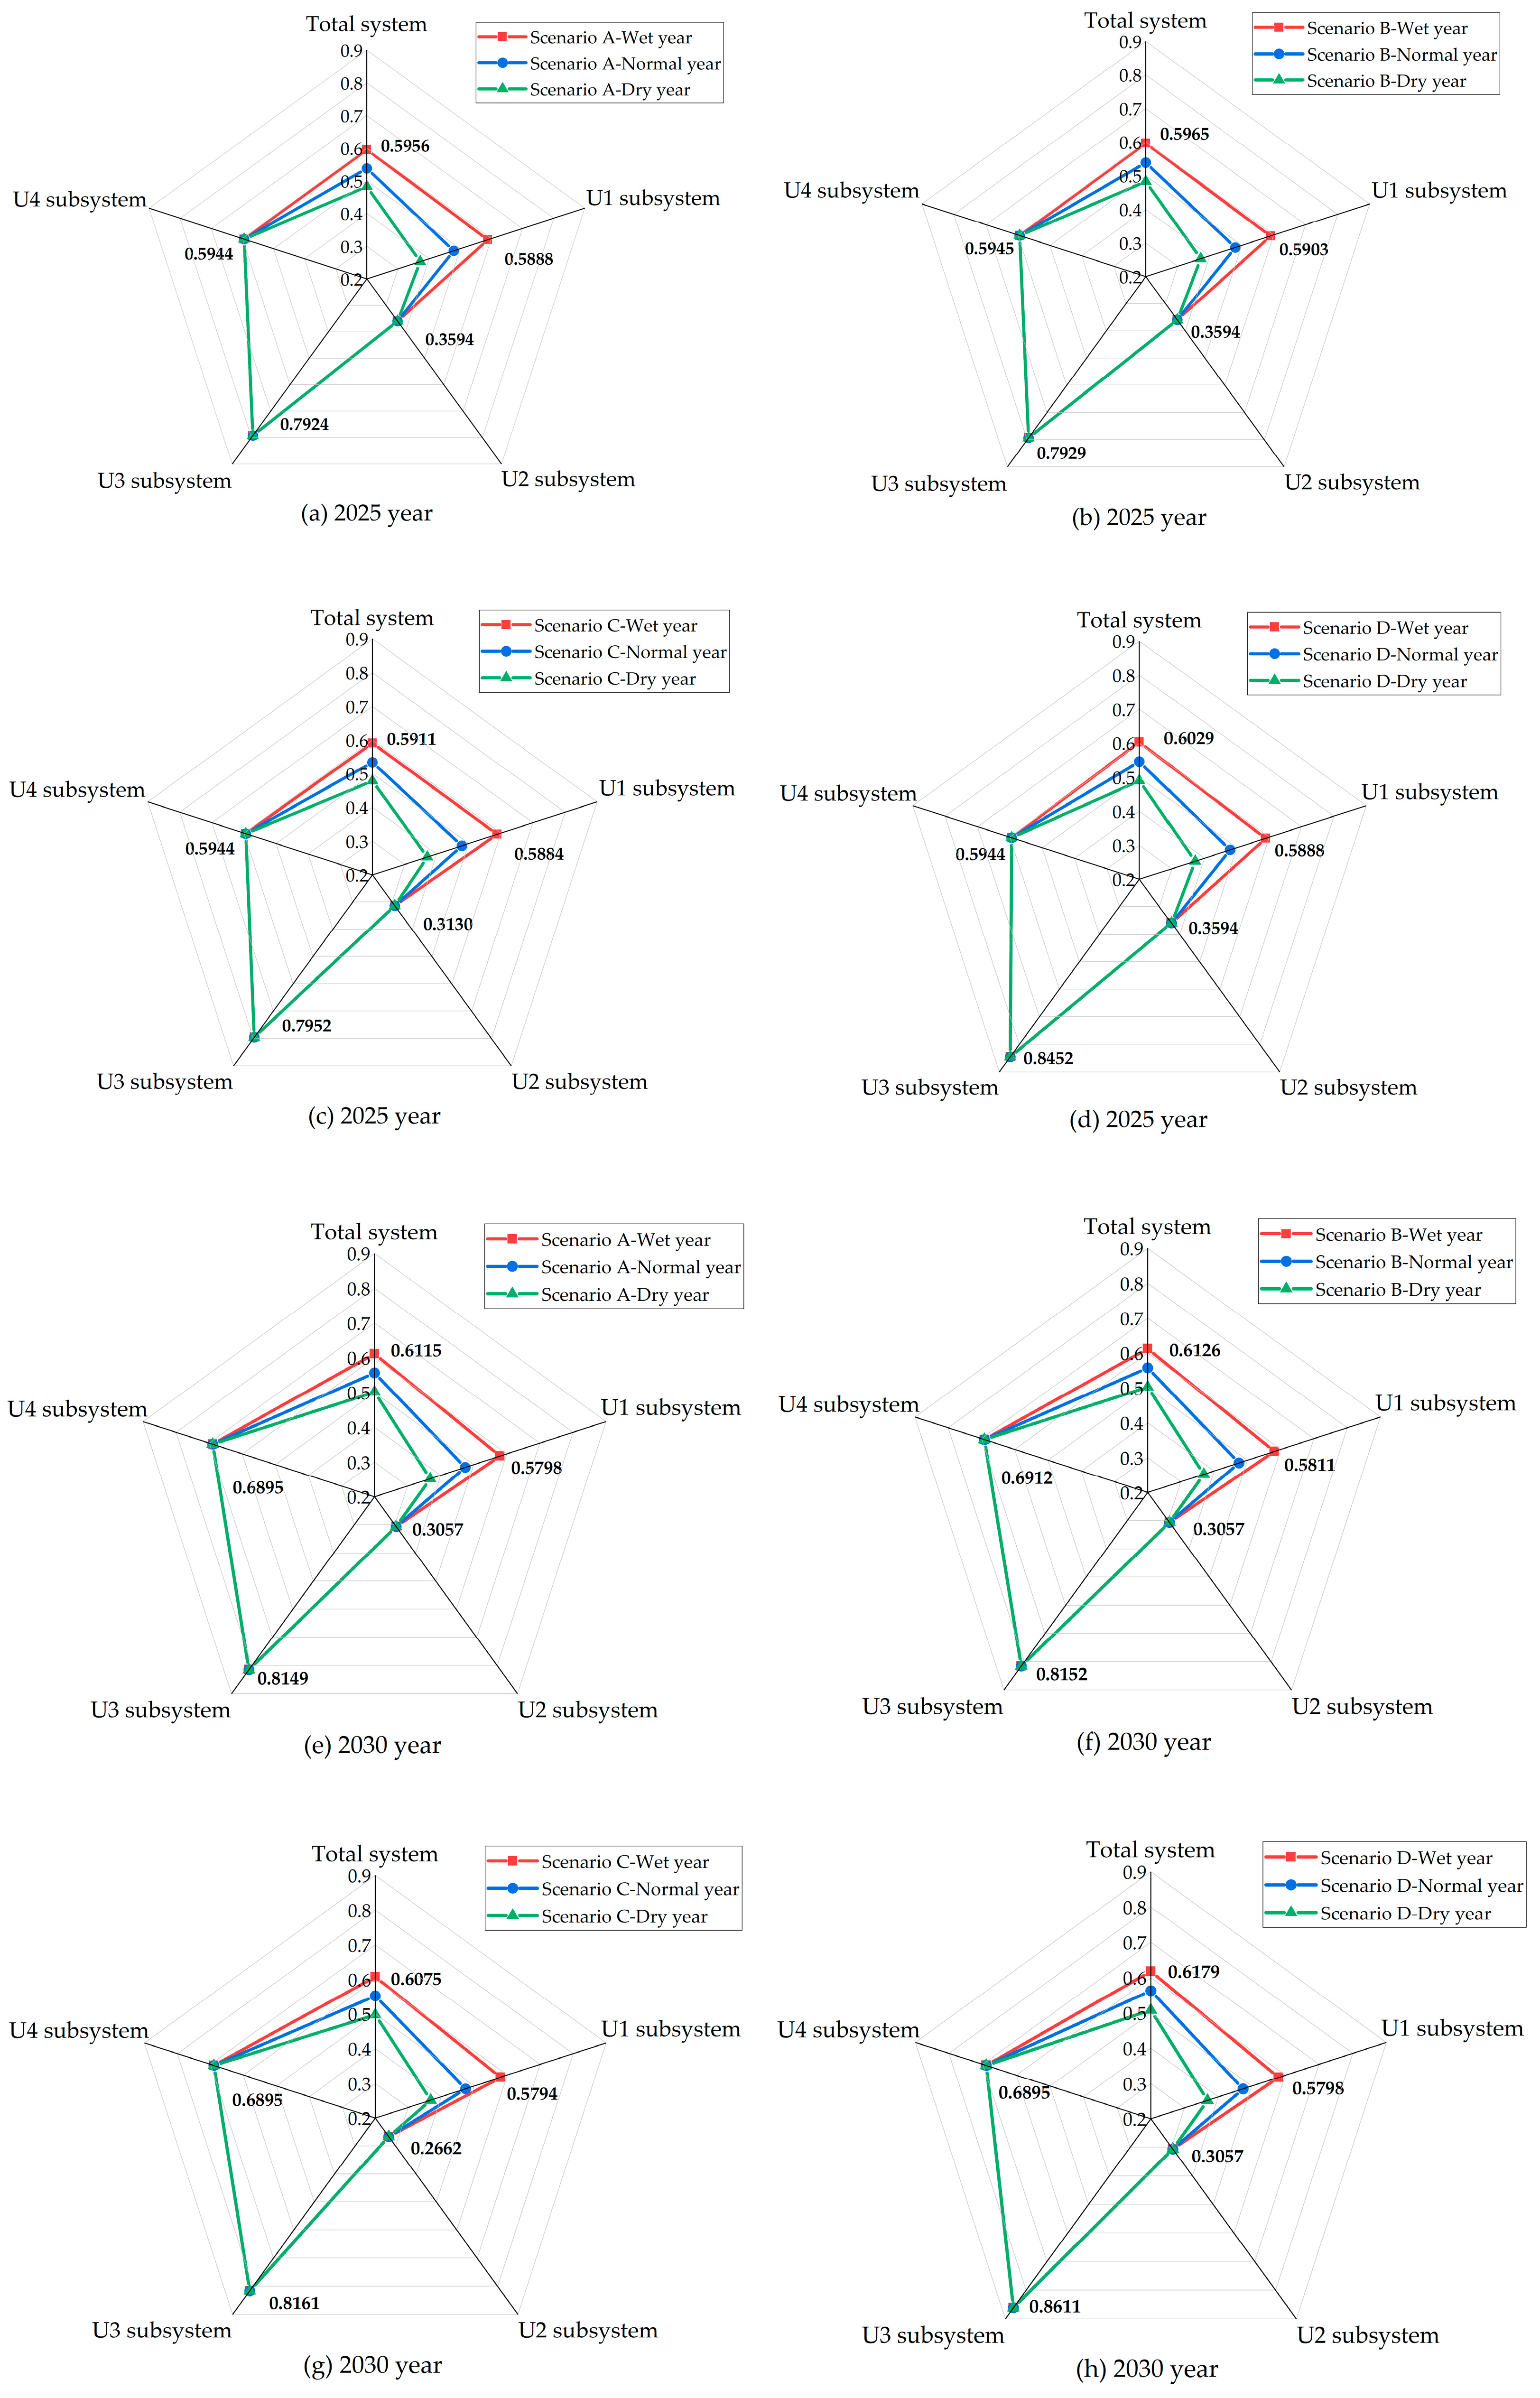
4.2. Analysis of WRCC Predictions under Different Scenarios

4.2.1. Scenario A: Sustainable Development

From Figure 7a and Figure 8a,e, it can be seen that during the wet years, the comprehensive value of the total system in Xuzhou in 2025 and 2030 is 0.5956 and 0.6115, respectively, and the WRCC levels are III and IV, respectively, which are the critical overload and weakly bearable states; the economic development and the ecosystem subsystems are better coordinated in the development process, and the economic development has a greater positive impact on the ecological environment. The economic subsystem will reach its optimal carrying capacity as early as 2030, whereas the social development subsystem will be in a state of general overflow by 2025. In normal years, the overall water resources assessment value of the total system in Xuzhou in 2025 and 2030 is 0.5384 and 0.5565, respectively, with a WRCC rating of III, indicating a serious overloading state. In dry years, the overall water resources assessment value of the total system in Xuzhou in 2025 and 2030 is 0.4826 and 0.5016, respectively, and the WRCC levels are II and III, indicating general overload and critical overload. The data indicate that the WRCC of Xuzhou in 2030 is greater than that of 2025, with the highest WRCC scores in wet years and the lowest WRCC scores in dry years, as a result of the water resources subsystem’s direct influence on the entire system.

4.2.2. Scenario B: Water Conservation

From Figure 7b and Figure 8b,f, it is apparent that the comprehensive water resources assessment value of the total system in Xuzhou City in 2025 and 2030 is 0.5965 and 0.6126, respectively. In wet years, the WRCC rating is III and IV, respectively, which is the state of critical overload and weakly bearable; the water resources, the economic development, and the ecosystem subsystems are better integrated, with the water resources subsystem scoring considerably better than scenario A. In normal years, the overall water resources assessment value of the total system in Xuzhou in 2025 and 2030 is 0.5390 and 0.5573, respectively, with a WRCC rating of III, indicating a state of critical overload, and the social development subsystem is under greater pressure in the process of sustainable development. In dry years, the overall water resources assessment value of the total system in Xuzhou in 2025 and 2030 is 0.4829 and 0.5022, respectively. The WRCC levels are II and III, indicating general overload and critical overload, and the water resources and social development subsystems are under increased pressure. The results of the data show that the WRCC of Xuzhou in 2030 is better than that in 2025 under different water resource regimes.

4.2.3. Scenario C: Rapid Socioeconomic Development

Figure 7c and Figure 8c,g show that in 2025 and 2030, the comprehensive water resources assessment value for the total system in Xuzhou City is 0.5911 and 0.6075, respectively. The WRCC levels are III and IV, which are critical overload and weakly bearable, and the economic development subsystem is well coordinated with the ecosystem subsystem in the development process. Nonetheless, by 2030, the social development subsystem score is 0.2662, indicating that Xuzhou City has severe demographic issues and a severe imbalance in sustainable development and that coordination between social development and other subsystems must be addressed immediately. In normal years, the overall water resources assessment value of the total system in Xuzhou in 2025 and 2030 is 0.5340 and 0.5526, respectively, with a WRCC rating of III, indicating a serious overloading state. In dry years, the overall water resources assessment value of the total system in Xuzhou in 2025 and 2030 is 0.4782 and 0.4977, respectively, with a WRCC rating of II, indicating a general overload and an increase in pressure on the water resources and the social development subsystems. The findings indicate that the WRCC of Xuzhou in 2030 will be greater than that of 2025 under the rapid socioeconomic development scenario.

4.2.4. Scenario D: Adjustment of Industrial Structure

According to Figure 7d and Figure 8d,h, the comprehensive water resources assessment value of the total system in Xuzhou City in 2025 and 2030 is 0.6029 and 0.6179, respectively, and the WRCC level is IV, which is a weak carrying capacity. The economic development subsystem is sufficiently developed. However, the water resources and ecosystem subsystems are severely overloaded. In normal years, the overall water resources assessment value of the total system in Xuzhou in 2025 and 2030 is 0.5458 and 0.5630, respectively, with a WRCC rating of III, indicating a state of critical overload. In dry years, the overall water resources assessment value of the total system in Xuzhou in 2025 and 2030 is 0.4899 and 0.5080, respectively, and the WRCC levels are II and III, indicating a general overload and a critical overload. In 2025 and 2030, the water resources and social development subsystems in Xuzhou are under increased strain and must be coordinated to achieve a balance with the development of the other two subsystems. The data results indicate that the WRCC of Xuzhou in 2030 is greater than that in 2025 according to the scenario model of industrial restructuring and that the economic development subsystem in 2025 and 2030 has reached the ideal bearable state, regardless of whether it is a wet year, a normal year, or a dry year.

4.2.5. Prediction Analysis under Three Water Regimes

As shown in Figure 9, it can be observed that the overall increase and decrease variation of WRCC in Xuzhou City during the period of 2020–2030 is relatively minimal in wet years, while the overall variation of WRCC is greatest in dry years. In normal years, for instance, the WRCC in Xuzhou declines less between 2020 and 2025 and increases more between 2025 and 2030 in scenario D, whereas it increases and lowers more in scenario C. Overall, from 2020 to 2025, the WRCC in Xuzhou City gradually decreases and transitions from a weakly bearable state to a critical overload state; from 2025 to 2030, the WRCC in Xuzhou City tends to gradually increase, but the water resources continue to be in a critical overload state. The primary reason for this is that 2020 is a wet year, and its precipitation and other indexes have a high integrated weighting; thus, the WRCC is in a weak loadable state in the current evaluation. In the following five years, the water resources situation may be in normal or dry years, which reduced the significant impact of the water resources subsystem on the evaluation results. Furthermore, changes in the predicted values primarily depend on indexes such as population growth, economic development, and industrial structural adjustments. The comprehensive weight values of these indexes are relatively low, resulting in minimal overall changes in the carrying capacity state, which remains at a critical overloaded state. Therefore, as a result of the socioeconomic and industrial structure optimization in 2030, the WRCC of Xuzhou in 2030 is marginally greater than in 2025.

5. Conclusions

Over time, the WRCC of Xuzhou City has been in a state of general overload, with the overall trend indicating a continuous increase at first, a decline in 2019, and a comeback to a weak carrying capacity in 2020. This is a result of the coexistence of water quality and resource-based water scarcity in Xuzhou City, which has developed and utilized a very large scale of water resources. Current water resources have very limited space for further development and utilization, and the rapid economic development and population size of nearly nine million people puts significant pressure on sustainable development. However, water resources, socio and economic development subsystems have high scores overall, and the cooperation between the four subsystems increases the total WRCC of Xuzhou City.
In the four scenario projections, water conservation and adjustment of the industrial structure are more conducive to relieving the pressure on the WRCC of Xuzhou in the future, and the water situation is in a wet year, i.e., the more abundant the water resources, the greater Xuzhou’s water resources carrying capacity in 2025 and 2030. The Xuzhou region is much less advantageous in terms of water resources than other cities in Jiangsu Province due to its location and climate. To ensure the coordinated development of all subsystems in Xuzhou, it is required to enhance people’s awareness of water saving and water protection and improve the efficacy of water resource utilization in the region of Xuzhou. In addition, several measures, such as supporting the restructuring of enterprises, optimising the layout structure of state-owned capital, accelerating technological innovation, controlling industrial pollution, and promoting the adjustment of industrial green structure, should be conducted to ensure the quality and sustainability of regional social and economic development.
Compared to previous studies, the total system scores of the status evaluation results of Xuzhou City from 2012 to 2015 calculated by previous scholars are less than 0.40, which is in a state of medium overloading and basically consistent with the results of this paper. The WRCC situation in Xuzhou City between 2016 and 2020 was primarily predicted by previous scholars, and the results were not ideal. Moreover, with a lack of research on WRCC in Xuzhou after 2020, this study fills the gap by providing scenario predictions for the years 2025 and 2030 in Xuzhou City, which may have a certain practical value for the future development and utilization of local water resources. However, despite the fact that the AHP method selected in this paper can decompose multi-level index evaluation into single-level index evaluation layer by layer, it still has certain subjectivity when judging the relative importance between two indexes, which leads to the comprehensive weight combined by the entropy weight method; the AHP method is also affected by the judgment subjectivity. In the future, the influence situation of each index on the whole Huaihai region will be considered to judge the importance between the two indexes to reduce the influence of subjectivity on the comprehensive weight. In addition, in terms of the future prediction of WRCC in Xuzhou City, the development trend of some indexes in the future may be uncertain, and the prediction methods adopted for each index may also be inadaptable. The artificial control of some index values in the scenario prediction mode may not be considered sufficiently. Therefore, in order to reflect the WRCC of Xuzhou more accurately, it is necessary to further improve the evaluation index system and the selection of the evaluation method of WRCC in the future.

Supplementary Materials

The following supporting information can be downloaded at: https://www.mdpi.com/article/10.3390/su151411369/s1, Table S1: Statistics on evaluation indexes for the years 2012–2020; Table S2: Data collection of indexes under four scenarios and three water resources scenarios in 2025; Table S3: Data collection of indexes under four scenarios and three water resources scenarios in 2030.

Author Contributions

Conceptualization, Y.Z. and X.S.; methodology, Y.Z. and X.W.; software, Y.Z.; formal analysis, Y.Z.; investigation, Y.Z.; writing—original draft preparation, Y.Z.; writing—review and editing, X.S., X.W., Z.J. and F.C.; visualization, Y.Z.; supervision, X.S. and X.W.; funding acquisition, X.S. All authors have read and agreed to the published version of the manuscript.

Funding

This research was funded by the National Natural Science Foundation of China (No. 51979271, 52121006), the Natural Science Foundation of Jiangsu Province of China (No. BK20211247), the China Postdoctoral Science Foundation (No. 2018M632333), China Water Resource Conservation and Protection Project (No. 126302001000160081), Research Project of Ministry of Natural Resources (No. 20210103), Research Project of Jiangsu Provincial Department of Natural Resources (No. 2021003, 2022022), Research Project of Jiangsu Land and Resources Research Center (No. 2020TDZY06, ZK202106, ZK22003), Six Talents Peak Project of Jiangsu Province (No. JNHB-068), 333 High-level Talents Cultivation Project of Jiangsu Province and the Open Foundation of State Key Laboratory of Hydrology-Water Resources and Hydraulic Engineering (No. 2015490411).

Data Availability Statement

“The Xuzhou Statistical Yearbook (1996–2021)” at https://www.yearbookchina.com accessed on 6 November 2022; “The 14th Five-Year Plan for National Economic and Social Development of Xuzhou City and Outline of Vision 2035, and Xuzhou “14th Five-Year Plan” related special development plannings” at http://xz.gov.cn/fiveplan/index.html accessed on 17 January 2023.

Acknowledgments

We greatly appreciate the editor and reviewers for their insightful comments.

Conflicts of Interest

The authors declare no conflict of interest.

References

  1. Zhang, H.; Jin, G.; Yu, Y. Review of River Basin Water Resource Management in China. Water 2018, 10, 425. [Google Scholar] [CrossRef] [Green Version]
  2. Bazrkar, M.H.; Tavakoli-Nabavi, E.; Zamani, N.; Eslamian, S. System dynamic approach to hydro-politics in Hirmand transboundary river basin from sustainability perspective. Int. J. Hydrol. Sci. Technol. 2013, 3, 378–398. [Google Scholar] [CrossRef]
  3. Moisello, U.; Todeschini, S.; Vullo, F. The effects of water management on annual maximum floods of Lake Como and River Adda at Lecco (Italy). Civ. Eng. Environ. Syst. 2013, 30, 56–71. [Google Scholar] [CrossRef]
  4. Kummu, M.; Guillaume, J.H.A.; de Moel, H.; Eisner, S.; Flörke, M.; Porkka, M.; Siebert, S.; Veldkamp, T.I.E.; Ward, P.J. The World’s Road to Water Scarcity: Shortage and Stress in the 20th Century and Pathways towards Sustainability. Sci. Rep. 2016, 6, 38495. [Google Scholar] [CrossRef] [Green Version]
  5. United Nations Educational, Scientific and Cultural Organization. The United Nations World Water Development Report 2020: Water and Climate Change; United Nations Educational, Scientific and Cultural Organization: Paris, France, 2020; p. 232. [Google Scholar]
  6. Wada, Y.; van Beek, L.P.H.; Bierkens, M.F.P. Modelling Global Water Stress of the Recent Past: On the Relative Importance of Trends in Water Demand and Climate Variability. Hydrol. Earth Syst. Sci. 2011, 15, 3785–3808. [Google Scholar] [CrossRef] [Green Version]
  7. He, C.; Liu, Z.; Wu, J.; Pan, X.; Fang, Z.; Li, J.; Bryan, B.A. Future Global Urban Water Scarcity and Potential Solutions. Nat. Commun. 2021, 12, 4667. [Google Scholar] [CrossRef]
  8. Schilling, J.; Hertig, E.; Tramblay, Y.; Scheffran, J. Climate Change Vulnerability, Water Resources and Social Implications in North Africa. Reg. Environ. Chang. 2020, 20, 15. [Google Scholar] [CrossRef] [Green Version]
  9. Lee, U.; Xu, H.; Daystar, J.; Elgowainy, A.; Wang, M. AWARE-US: Quantifying Water Stress Impacts of Energy Systems in the United States. Sci. Total Environ. 2019, 648, 1313–1322. [Google Scholar] [CrossRef]
  10. United Nations, Department of Economic and Social Affairs. The Sustainable Development Goals Report 2022; United Nations, Department of Economic and Social Affairs: New York, NY, USA, 2022. [Google Scholar]
  11. Zhao, H.; Miller, T.R.; Ishii, N.; Kawasaki, A. Global Spatio-Temporal Change Assessment in Interregional Water Stress Footprint in China by a High Resolution MRIO Model. Sci. Total Environ. 2022, 841, 156682. [Google Scholar] [CrossRef]
  12. Wu, Y.; Ma, Z.; Li, X.; Sun, L.; Sun, S.; Jia, R. Assessment of Water Resources Carrying Capacity Based on Fuzzy Comprehensive Evaluation—Case Study of Jinan, China. Water Supply 2021, 21, 513–524. [Google Scholar] [CrossRef]
  13. Wu, F.; Zhuang, Z.; Liu, H.-L.; Shiau, Y.-C. Evaluation of Water Resources Carrying Capacity Using Principal Component Analysis: An Empirical Study in Huai’an, Jiangsu, China. Water 2021, 13, 2587. [Google Scholar] [CrossRef]
  14. Ross, E.A. Introduction to the Science of Society (Robert, E. Park, Ernest, W. Burgess). Am. J. Sociol. 1921, 27, 393–394. [Google Scholar] [CrossRef]
  15. Hixon, M.A. Carrying Capacity. In Encyclopedia of Ecology; Elsevier: Amsterdam, The Netherlands, 2008; pp. 528–530. [Google Scholar]
  16. Lane, M.; Dawes, L.; Grace, P. The Essential Parameters of a Resource-Based Carrying Capacity Assessment Model: An Australian Case Study. Ecol. Model. 2014, 272, 220–231. [Google Scholar] [CrossRef] [Green Version]
  17. Lane, M. The Carrying Capacity Imperative: Assessing Regional Carrying Capacity Methodologies for Sustainable Land-Use Planning. Land Use Policy 2010, 27, 1038–1045. [Google Scholar] [CrossRef] [Green Version]
  18. Peters, C.J.; Bills, N.L.; Wilkins, J.L.; Fick, G.W. Foodshed Analysis and Its Relevance to Sustainability. Renew. Agric. Food Syst. 2009, 24, 1–7. [Google Scholar] [CrossRef] [Green Version]
  19. Shen, L.; Cheng, G.; Du, X.; Meng, C.; Ren, Y.; Wang, J. Can Urban Agglomeration Bring “1 + 1 > 2Effect”? A Perspective of Land Resource Carrying Capacity. Land Use Policy 2022, 117, 106094. [Google Scholar] [CrossRef]
  20. Knapp, G.W. Latin American Studies: Geography. In International Encyclopedia of the Social & Behavioral Sciences; Smelser, N.J., Baltes, P.B., Eds.; Pergamon: Oxford, UK, 2001; pp. 8413–8417. [Google Scholar]
  21. Chao, Z.; Song, X.; Feng, X. Concept and Connotation of Water Resources Carrying Capacity in Water Ecological Civilization Construction. IOP Conf. Ser. Earth Environ. Sci. 2018, 111, 012003. [Google Scholar] [CrossRef]
  22. Ren, C.; Guo, P.; Li, M.; Li, R. An Innovative Method for Water Resources Carrying Capacity Research—Metabolic Theory of Regional Water Resources. J. Environ. Manag. 2016, 167, 139–146. [Google Scholar] [CrossRef]
  23. Wang, L.; Zeng, W.; Cao, R.; Zhuo, Y.; Fu, J.; Wang, J. Overloading Risk Assessment of Water Environment-Water Resources Carrying Capacity Based on a Novel Bayesian Methodology. J. Hydrol. 2023, 622, 129697. [Google Scholar] [CrossRef]
  24. Hu, M.; Li, C.; Zhou, W.; Hu, R.; Lu, T. An Improved Method of Using Two-Dimensional Model to Evaluate the Carrying Capacity of Regional Water Resource in Inner Mongolia of China. J. Environ. Manag. 2022, 313, 114896. [Google Scholar] [CrossRef]
  25. Feng, W.; Xu, P.; Qian, H. Study on Water Resource Carrying Capacity of Xi’an Based on AHP-Fuzzy Synthetic Evaluation Model. IOP Conf. Ser. Earth Environ. Sci. 2020, 467, 012149. [Google Scholar] [CrossRef] [Green Version]
  26. Zuo, Q.; Guo, J.; Ma, J.; Cui, G.; Yang, R.; Yu, L. Assessment of Regional-Scale Water Resources Carrying Capacity Based on Fuzzy Multiple Attribute Decision-Making and Scenario Simulation. Ecol. Indic. 2021, 130, 108034. [Google Scholar] [CrossRef]
  27. Naimi-Ait-Aoudia, M.; Berezowska-Azzag, E. Algiers Carrying Capacity with Respect to per Capita Domestic Water Use. Sustain. Cities Soc. 2014, 13, 1–11. [Google Scholar] [CrossRef]
  28. Chapagain, S.K.; Aryal, A.; Mohan, G.; Shrestha, S.; Mishra, B.K.; Fukushi, K. Analysis of the Climate Change Impact on Water Availability and the Links between Water Pollution and Economy for Sustainable Water Resource Management in Kaski District, Nepal. J. Water Clim. Chang. 2022, 13, 3030–3045. [Google Scholar] [CrossRef]
  29. Magri, A.; Berezowska-Azzag, E. New Tool for Assessing Urban Water Carrying Capacity (WCC) in the Planning of Development Programs in the Region of Oran, Algeria. Sustain. Cities Soc. 2019, 48, 101316. [Google Scholar] [CrossRef]
  30. Khorsandi, M.; Homayouni, S.; van Oel, P. The Edge of the Petri Dish for a Nation: Water Resources Carrying Capacity Assessment for Iran. Sci. Total Environ. 2022, 817, 153038. [Google Scholar] [CrossRef]
  31. Liu, B.; Qin, X.; Zhang, F. System-Dynamics-Based Scenario Simulation and Prediction of Water Carrying Capacity for China. Sustain. Cities Soc. 2022, 82, 103912. [Google Scholar] [CrossRef]
  32. Liu, X.; Liu, Y. The Study on Supply and Demand of Water Resources in Alar City Based on the System Dynamics Model. J. Phys. Conf. Ser. 2019, 1324, 012017. [Google Scholar] [CrossRef]
  33. Sun, B.; Yang, X. Simulation of Water Resources Carrying Capacity in Xiong’an New Area Based on System Dynamics Model. Water 2019, 11, 1085. [Google Scholar] [CrossRef] [Green Version]
  34. Liu, T.; Yang, X.; Geng, L.; Sun, B. A Three-Stage Hybrid Model for Space-Time Analysis of Water Resources Carrying Capacity: A Case Study of Jilin Province, China. Water 2020, 12, 426. [Google Scholar] [CrossRef] [Green Version]
  35. Zhang, J.; Dong, Z. Assessment of Coupling Coordination Degree and Water Resources Carrying Capacity of Hebei Province (China) Based on WRESP2D2P Framework and GTWR Approach. Sustain. Cities Soc. 2022, 82, 103862. [Google Scholar] [CrossRef]
  36. Long, X.; Wu, S.; Wang, J.; Wu, P.; Wang, Z. Urban Water Environment Carrying Capacity Based on VPOSR-Coefficient of Variation-Grey Correlation Model: A Case of Beijing, China. Ecol. Indic. 2022, 138, 108863. [Google Scholar] [CrossRef]
  37. Mou, S.; Yan, J.; Sha, J.; Deng, S.; Gao, Z.; Ke, W.; Li, S. A Comprehensive Evaluation Model of Regional Water Resource Carrying Capacity: Model Development and a Case Study in Baoding, China. Water 2020, 12, 2637. [Google Scholar] [CrossRef]
  38. Tan, C.; Peng, Q.; Ding, T.; Zhou, Z. Regional Assessment of Land and Water Carrying Capacity and Utilization Efficiency in China. Sustainability 2021, 13, 9183. [Google Scholar] [CrossRef]
  39. Yang, X.; Han, W.; Mao, C. A Comprehensive Analysis on Water Resources Carrying Capacity in Tongliao Based on Ecological Footprint Method. IOP Conf. Ser. Earth Environ. Sci. 2019, 237, 052017. [Google Scholar] [CrossRef]
  40. Li, J.; Lei, X.; Fu, Q.; Li, T.; Qiao, Y.; Chen, L.; Liao, W. Multi-Scale Research of Time and Space Differences about Ecological Footprint and Ecological Carrying Capacity of the Water Resources. Appl. Water Sci. 2018, 8, 22. [Google Scholar] [CrossRef] [Green Version]
  41. Zhu, L.; Li, X.; Bai, Y.; Yi, T.; Yao, L. Evaluation of Water Resources Carrying Capacity and Its Obstruction Factor Analysis: A Case Study of Hubei Province, China. Water 2019, 11, 2573. [Google Scholar] [CrossRef] [Green Version]
  42. Cao, W.; Deng, J.; Yang, Y.; Zeng, Y.; Liu, L. Water Carrying Capacity Evaluation Method Based on Cloud Model Theory and an Evidential Reasoning Approach. Mathematics 2022, 10, 266. [Google Scholar] [CrossRef]
  43. Peng, T.; Deng, H.; Lin, Y.; Jin, Z. Assessment on Water Resources Carrying Capacity in Karst Areas by Using an Innovative DPESBRM Concept Model and Cloud Model. Sci. Total Environ. 2021, 767, 144353. [Google Scholar] [CrossRef]
  44. Wang, Y.; Wang, Y.; Su, X.; Qi, L.; Liu, M. Evaluation of the Comprehensive Carrying Capacity of Interprovincial Water Resources in China and the Spatial Effect. J. Hydrol. 2019, 575, 794–809. [Google Scholar] [CrossRef]
  45. Shi, C.; Zhang, Z. A Prediction Method of Regional Water Resources Carrying Capacity Based on Artificial Neural Network. Earth Sci. Res. J. 2021, 25, 169–177. [Google Scholar] [CrossRef]
  46. Kai, X.; Qiu, X.; Wang, Y.; Zhang, W.; Yin, J. The Water Environment Carrying Capacity of the Aiyi River Based on Artificial Neural Networks. Pol. J. Environ. Stud. 2019, 29, 131–139. [Google Scholar] [CrossRef]
  47. Wang, H.; Xu, Y.; Suryati Sulong, R.; Ma, H.; Wu, L. Comprehensive Evaluation of Water Carrying Capacity in Hebei Province, China on Principal Component Analysis. Front. Environ. Sci. 2021, 9, 761058. [Google Scholar] [CrossRef]
  48. Liu, C.; Wang, R.; Zhang, X.; Cheng, C.; Song, H.; Hu, Y. Comparative Analysis of Water Resources Carrying Capacity Based on Principal Component Analysis in Beijing-Tianjin-Hebei Region from the Perspective of Urbanization. AIP Conf. Proc. 2017, 1794, 030012. [Google Scholar]
  49. Cao, F.; Lu, Y.; Dong, S.; Li, X. Evaluation of Natural Support Capacity of Water Resources Using Principal Component Analysis Method: A Case Study of Fuyang District, China. Appl. Water Sci. 2020, 10, 192. [Google Scholar] [CrossRef]
  50. Yan, B.; Xu, Y. Evaluation and Prediction of Water Resources Carrying Capacity in Jiangsu Province, China. Water Policy 2022, 24, 324–344. [Google Scholar] [CrossRef]
  51. An, M.; Fan, L.; Huang, J.; Yang, W.; Wu, H.; Wang, X.; Khanal, R. The Gap of Water Supply—Demand and Its Driving Factors: From Water Footprint View in Huaihe River Basin. PLoS ONE 2021, 16, e0247604. [Google Scholar] [CrossRef]
  52. Zhang, J.; Fu, J.; Liu, C.; Qu, Z.; Li, Y.; Li, F.; Yang, Z.; Jiang, L. Evaluating Water Resource Assets Based on Fuzzy Comprehensive Evaluation Model: A Case Study of Wuhan City, China. Sustainability 2019, 11, 4627. [Google Scholar] [CrossRef] [Green Version]
  53. Jia, Y.; Shen, J.; Wang, H. Calculation of Water Resource Value in Nanjing Based on a Fuzzy Mathematical Model. Water 2018, 10, 920. [Google Scholar] [CrossRef] [Green Version]
  54. Zhao, Q.; Gao, Q.; Zhu, M.; Li, X. Evaluation of Water Resources Carrying Capacity in Shandong Province Based on Fuzzy Comprehensive Evaluation. E3S Web Conf. 2018, 38, 01012. [Google Scholar] [CrossRef] [Green Version]
  55. Xie, M.; Wang, R.; Yang, J.; Cheng, Y. A Monitoring and Control System for Stormwater Management of Urban Green Infrastructure. Water 2021, 13, 1438. [Google Scholar] [CrossRef]
  56. Deng, L.; Yin, J.; Tian, J.; Li, Q.; Guo, S. Comprehensive Evaluation of Water Resources Carrying Capacity in the Han River Basin. Water 2021, 13, 249. [Google Scholar] [CrossRef]
  57. Gao, H.; Sun, L. Grey Clustering Evaluation of Water Resources Carrying Capacity Based on Triangle Whitening Weight Function. IOP Conf. Ser. Earth Environ. Sci. 2018, 208, 012101. [Google Scholar] [CrossRef]
  58. Ren, L.; Gao, J.; Song, S.; Li, Z.; Ni, J. Evaluation of Water Resources Carrying Capacity in Guiyang City. Water 2021, 13, 2155. [Google Scholar] [CrossRef]
  59. Zhi, X.; Anfuding, G.; Yang, G.; Gong, P.; Wang, C.; Li, Y.; Li, X.; Li, P.; Liu, C.; Qiao, C.; et al. Evaluation of the Water Resource Carrying Capacity on the North Slope of the Tianshan Mountains, Northwest China. Sustainability 2022, 14, 1905. [Google Scholar] [CrossRef]
  60. Xie, M.; Zhang, C.; Zhang, J.; Wang, G.; Jin, J.; Liu, C.; He, R.; Bao, Z. Projection of Future Water Resources Carrying Capacity in the Huang-Huai-Hai River Basin under the Impacts of Climate Change and Human Activities. Water 2022, 14, 2006. [Google Scholar] [CrossRef]
  61. Ge, Y.; Wu, J.; Zhang, D.; Jia, R.; Yang, H. Uncertain Analysis of Fuzzy Evaluation Model for Water Resources Carrying Capacity: A Case Study in Zanhuang County, North China Plain. Water 2021, 13, 2804. [Google Scholar] [CrossRef]
  62. Ai, L. Water Resources Carrying Capacity and Circular Economy Based on Fuzzy Multilayer Algorithm. Comput. Intell. Neurosci. 2022, 2022, 9959933. [Google Scholar] [CrossRef] [PubMed]
  63. Wang, G.; Xiao, C.; Qi, Z.; Liang, X.; Meng, F.; Sun, Y. Water Resource Carrying Capacity Based on Water Demand Prediction in Chang-Ji Economic Circle. Water 2020, 13, 16. [Google Scholar] [CrossRef]
  64. Zhou, R.; Jin, J.; Cui, Y.; Ning, S.; Zhou, L.; Zhang, L.; Wu, C.; Zhou, Y. Spatial Equilibrium Evaluation of Regional Water Resources Carrying Capacity Based on Dynamic Weight Method and Dagum Gini Coefficient. Front. Earth Sci. 2022, 9, 790349. [Google Scholar] [CrossRef]
  65. Wang, X.; Liu, L.; Zhang, S. Integrated Model Framework for the Evaluation and Prediction of the Water Environmental Carrying Capacity in the Guangdong-Hong Kong-Macao Greater Bay Area. Ecol. Indic. 2021, 130, 108083. [Google Scholar] [CrossRef]
  66. Deng, Z.; Dai, L.; Deng, B.; Tian, X. Evaluation and Spatial-Temporal Evolution of Water Resources Carrying Capacity in Dongting Lake Basin. J. Water Clim. Chang. 2021, 12, 2125–2135. [Google Scholar] [CrossRef]
  67. Jia, R.; Jiang, X.; Shang, X.; Wei, C. Study on the Water Resource Carrying Capacity in the Middle Reaches of the Heihe River Based on Water Resource Allocation. Water 2018, 10, 1203. [Google Scholar] [CrossRef] [Green Version]
  68. Sun, X.; Guo, C.; Cui, J. Research on Evaluation Method of Water Resources Carrying Capacity Based on Improved TOPSIS Model. La Houille Blanche 2020, 106, 68–74. [Google Scholar] [CrossRef]
  69. Cui, G.; Zhang, X.; Zhang, Z.; Cao, Y.; Liu, X. Comprehensive Land Carrying Capacities of the Cities in the Shandong Peninsula Blue Economic Zone and Their Spatio-Temporal Variations. Sustainability 2019, 11, 439. [Google Scholar] [CrossRef] [Green Version]
  70. Liu, H.; Liu, Y.; Li, L.; Gao, H. Study of an Evaluation Method for Water Resources Carrying Capacity Based on the Projection Pursuit Technique. Water Supply 2017, 17, 1306–1315. [Google Scholar] [CrossRef]
  71. Yang, L.; Wang, L. Comprehensive Assessment of Urban Water Resources Carrying Capacity Based on Basin Unit: A Case Study of Qingdao, China. Water Supply 2022, 22, 1347–1359. [Google Scholar] [CrossRef]
  72. Ouma, Y.; Tateishi, R. Urban Flood Vulnerability and Risk Mapping Using Integrated Multi-Parametric AHP and GIS: Methodological Overview and Case Study Assessment. Water 2014, 6, 1515–1545. [Google Scholar] [CrossRef] [Green Version]
  73. Zhou, K. Comprehensive Evaluation on Water Resources Carrying Capacity Based on Improved AGA-AHP Method. Appl. Water Sci. 2022, 12, 103. [Google Scholar] [CrossRef]
  74. Xu, Y.; Ma, L.; Khan, N.M. Prediction and Maintenance of Water Resources Carrying Capacity in Mining Area—A Case Study in the Yu-Shen Mining Area. Sustainability 2020, 12, 7782. [Google Scholar] [CrossRef]
  75. Guo, X.; Zhang, R.; Xie, N.; Jin, J. Predicting the Population Growth and Structure of China Based on Grey Fractional-Order Models. J. Math. 2021, 2021, 7725125. [Google Scholar] [CrossRef]
  76. Wang, B.; Ge, Y. Predicting the Influence of Guangfo Metro on the Economic Level of Foshan City Based on the GM(1,1) Model. IOP Conf. Ser. Earth Environ. Sci. 2021, 634, 012013. [Google Scholar] [CrossRef]
  77. Wang, Y.; Yuan, Z.; Liu, H.; Xing, Z.; Ji, Y.; Li, H.; Fu, Q.; Mo, C. A New Scheme for Probabilistic Forecasting with an Ensemble Model Based on CEEMDAN and AM-MCMC and Its Application in Precipitation Forecasting. Expert Syst. Appl. 2022, 187, 115872. [Google Scholar] [CrossRef]
  78. Liu, Z.; Xue, L. Forecast of Water Demand in Beijing in 2030. Chongqing City, China. IOP Conf. Ser. 2017, 1864, 020125. [Google Scholar]
  79. Qin, G.; Li, H.; Wang, X.; Ding, J. Research on Water Resources Design Carrying Capacity. Water 2016, 8, 157. [Google Scholar] [CrossRef] [Green Version]
  80. Guo, L.; Wang, L. Will China’s Water Resources Be Safe in 2030? Water Policy 2021, 23, 417–431. [Google Scholar] [CrossRef]
  81. Wang, X.; Liu, L.; Zhang, S.; Gao, C. Dynamic Simulation and Comprehensive Evaluation of the Water Resources Carrying Capacity in Guangzhou City, China. Ecol. Indic. 2022, 135, 108528. [Google Scholar] [CrossRef]
  82. Wang, G.; Xiao, C.; Qi, Z.; Meng, F.; Liang, X. Development Tendency Analysis for the Water Resource Carrying Capacity Based on System Dynamics Model and the Improved Fuzzy Comprehensive Evaluation Method in the Changchun City, China. Ecol. Indic. 2021, 122, 107232. [Google Scholar] [CrossRef]
Figure 1. Location of Xuzhou in China and its major rivers.
Sustainability 15 11369 g001
Figure 2. The framework of the evaluation index system used for assessing the WRCC in Xuzhou.
Sustainability 15 11369 g002
Figure 3. The membership degree of each index during 2012 and 2020.
Sustainability 15 11369 g003
Figure 4. The weights for indexes that affect the evaluation of the WRCC. (a,b) represent the index weights obtained by the entropy weight method and the hierarchical analysis approach, respectively; (c) represents the combined weight.
Sustainability 15 11369 g004
Figure 5. Comprehensive scores of WRCC of the total system and four subsystems in Xuzhou City from 2012 to 2020. (ai) represent the scores for the WRCC from 2012 to 2020, respectively.
Sustainability 15 11369 g005
Figure 6. The trend changes of WRCC comprehensive score of the total system and four subsystems in Xuzhou City from 2012 to 2020.
Sustainability 15 11369 g006
Figure 7. The trend of WRCC under four scenarios and three water regimes in 2025 and 2030. (ad) represent the comprehensive scores changes of different scenarios in 2025 and 2030, respectively.
Sustainability 15 11369 g007
Figure 8. The specific situation of WRCC comprehensive scores of the total system and four subsystems in Xuzhou City in 2025. (ad) represent the comprehensive scores of different scenarios in 2025, (eh) represent the comprehensive scores of different scenarios in 2030.
Sustainability 15 11369 g008
Figure 9. The trend of WRCC comprehensive scores in Xuzhou City in 2025 and 2030 under different water resources regimes. (ac) represent a wet year, normal year and dry year, respectively.
Sustainability 15 11369 g009
Table 1. Classification of the evaluation index grades.
Evaluation IndexesUnitIndex TypeV1 (Strong)V2 (Average)V3 (Weak)
U11 (annual average precipitation)mmpositive>1000750–1000<750
U12 (per capita water resources)m3/peoplepositive>1700500–1700<500
U13 (utilization rate of water resources)%negative<4040–90>90
U14 (water production modulus)104 m3/km2positive>3415–34<15
U21 (population density)person/km2negative<750750–790>790
U22 (natural population growth rate)negative<55–10>10
U23 (urbanization rate)%negative<6060–80>80
U31 (per capita GDP)CNY 10,000positive>85–8<5
U32 (water consumption per CNY 10,000 GDP)m3/CNY 10,000negative<5050–80>80
U33 (proportion of tertiary industry in GDP)%positive>5040–50<40
U41 (industrial wastewater discharge)104 tonsnegative<20002000–5000>5000
U42 (urban sewage treatment rate up to standard)%positive>9585–95<85
U43 (ecological water consumption rate)%positive>105–10<5
U44 (forest coverage rate)%positive>4030–40<30
Table 2. Scale method and meaning.
Relative ImportanceDefinition
1Equal significance between the two factors
3Slight significance of one factor compared to the other
5Strong significance of one factor compared to the other
7Dominance of one factor over the other
9Absolute dominance of one factor over the other
2,4,6,8Intermediate state between the above two judgments
ReciprocalIf the ratio of the significance of factors i and j is aij, then the ratio of the significance of factors j and i is aji = 1/aij
Table 3. Random consistency index RI.
n12345678910
RI000.58 0.90 1.12 1.24 1.32 1.41 1.45 1.49
Table 4. Classification criteria of comprehensive score values of WRCC.
Comprehensive ScoreGrading Standards of the WRCC
(0,0.25)I—Severe overloading
[0.25,0.50)II—Medium overloading
[0.50,0.60)III—Critical overloading
[0.60,0.70)IV—Weak loadable
[0.70,0.80)V—Good loadable
[0.80,1)VI—Ideal loadable
Table 5. The setting details of four scenario development modes.
Scenarios DesignModeDetails
Scenario Asustainable development modeTaking the 14th Five-Year Plan of Xuzhou City as a reference, the corresponding method is selected for each index value to predict. Use the values of the predicted indexes as a reference for other scenarios.
Scenario Bwater conservation modeThe per capita water consumption quota in both urban and rural areas was reduced by 10% to obtain the relevant index values, while the other index values remain the same as predicted by the sustainable development scenario.
Scenario Crapid socioeconomic development modeThe index values related to the economy, population and urbanization rate will be raised by 5%, 2% and 3%, respectively, and other index values will be the same as those in the sustainable development scenario.
Scenario Dadjustment of industrial structure modeThe proportion of tertiary industry in GDP is increased by 5% based on sustainable development, while the other indexes values remain the same as predicted by the sustainable development scenario.
Disclaimer/Publisher’s Note: The statements, opinions and data contained in all publications are solely those of the individual author(s) and contributor(s) and not of MDPI and/or the editor(s). MDPI and/or the editor(s) disclaim responsibility for any injury to people or property resulting from any ideas, methods, instructions or products referred to in the content.

