Article

Research on Energy Management Method of Fuel Cell/Supercapacitor Hybrid Trams Based on Optimal Hydrogen Consumption

School of Mechanical Engineering, Beijing Institute of Technology, Beijing 100081, China
*
Author to whom correspondence should be addressed.
Sustainability 2023, 15(14), 11234; https://doi.org/10.3390/su151411234
Submission received: 8 June 2023 / Revised: 13 July 2023 / Accepted: 14 July 2023 / Published: 19 July 2023
(This article belongs to the Special Issue Sustainability Optimisation of Electrified Railways)

Abstract

:
In this paper, based on the operating states and characteristics of fuel cell/supercapacitor hybrid trams, an optimal hydrogen energy management method is proposed. This method divides the operating states into two parts: traction state and non-traction state. In the traction state, the real-time loss function of the hybrid power system, which is used to obtain the fuel cell optimal output power under the different demand powers and supercapacitor voltage, is established. In the non-traction state, the constant-power charging method, which is obtained by solving the power-voltage charging model, is used to ensure the supercapacitor voltage of the beginning-state and the end-state in an entire operation cycle are the same. The RT-LAB simulation platform is used to verify that the proposed method has the ability to control the hybrid real-time system. Using the comparative experiment between the proposed method and power-follow method, the results show that the proposed method offers a significant improvement in both fuel cell output stability and hydrogen consumption in a full operation cycle.

1. Introduction

Trams are increasingly welcomed by small- and medium-sized cities due to their “low cost and moderate capacity” features. Modern trams mostly exist in low-to-medium-capacity rail transit systems. They have the advantages of safety, reliability, environmental protection, comfort, etc., which are an effective supplement to subways, light rails, and public transportation systems. Trams can also be used as backbones for major cities, suburban ties, and small- and medium-sized railways. With the acceleration of urbanization, the demand for modern trams is enormous. At present, trams are used in more than 300 cities in Europe and the United States. However, due to the fact that conventional trams generally use a catenary power supply, the overhead catenary is increasingly not suited to the requirements of modern cities. Therefore, the demand for contactless network power technology is urgent [1,2].
Compared with existing non-catenary trams, fuel cell trams are equipped with fuel cell power generation systems, which do not rely on traction power supply systems and can achieve full-scale operation without catenary power. As hydrogen energy has “zero pollution, zero emissions” advantages, fuel cell trams have a bright future [3]. At present, there are many studies on fuel cell trams [4,5,6,7,8,9], but due to the generally low power level of fuel cells, the whole systems’ power level is low and the energy generated during braking cannot be recovered. Therefore, the hybrid system consisting of fuel cells and energy storage units has emerged [10,11,12,13,14,15,16]. Moreover, supercapacitors were used to absorb/provide fast power peaks of electromechanical actuators onboard [17,18], which have significant application prospects in hybrid systems.
In hybrid systems, the key part is the energy control strategy. Among the many existing research results, there are few control strategies for fuel cell/supercapacitor hybrid systems, and they all have certain limitations. Wahib Andari et al. [19] used the SOC of the supercapacitor as a criterion to control the output of the fuel cell or supercapacitor. However, this method only allows the supercapacitor to output during the acceleration interval. This method will inevitably increase the output power of the fuel cell during the later charging period, which increases hydrogen consumption throughout the operating range. Diego Feroldi et al. [20] divided the efficiency map into sections to encourage the hydrogen consumption of the vehicle reach a low level. However, this method cannot effectively control the SOC of the vehicle from beginning to end, which is not conducive to long-term continuous operation of the vehicle. The equivalent hydrogen consumption (EMSC) algorithm is a typical algorithm to solve the problem of energy distribution in fuel cell hybrid power systems. P. Rodatz et al. [21], Pablo Garcia et al. [22,23], and Zhang Wenbin et al. [24] implemented the equivalent hydrogen consumption algorithm in the hybrid system. Due to the low energy density of the supercapacitor, the voltage value drastically changes under complex operating conditions, which means the tram will run unstable. In addition, if the fuel cell’s rated power is large, its power–hydrogen consumption curve cannot be fitted with a linear function, which also results in an equivalent hydrogen consumption method that cannot be used to control a high-power fuel cell system.
Among the above-mentioned algorithms, there are very few control methods that are combined with the energy distribution considered in the entire interval operation state. For trams operating in a full cycle, especially for fuel cell/supercapacitor hybrid trams, the beginning and end states of the supercapacitor voltage need to be consistent. If the end-state voltage value is smaller than the beginning state, the supercapacitor will be depleted after running the similar cycles. Conversely, if the end-state voltage value is higher than the beginning state, it will affect the supercapacitor system’s absorbing braking energy, which reduces the overall vehicle efficiency.
Therefore, an optimal hydrogen consumption method is proposed in this paper. This method is based on system modeling and the tram operating status, and the cost function of the fuel cell system during the traction state is obtained. Under different required powers, the optimal output power of the fuel cell system is obtained according to off-line calculations of cost function. Finally, the charging process in the station ensures that the end-state voltage of the supercapacitor is the same as the initial state. In addition, this paper uses the RT-LAB hardware-in-the-loop simulation platform to verify that this method can be applied to the actual control system. Finally, through the actual contrast running test of trams, the proposed method is fully verified.
In this paper, Section 2 introduces the topology of the fuel cell hybrid tram and also demonstrates the modeling process of both the fuel cell system and the supercapacitor system, which focus on the modeling of energy consumption. The optimal hydrogen consumption method is given in Section 3, which shows different control strategies under the non-traction state and traction states. The details of derivation for the proposed method are also provided. Section 3 and Section 4 provide the experimental verification of the proposed method under both simulation and actual experiment conditions, and the results are obtained based on the comparison tests with the existing method, named power following.

2. The Model and Topology of the Hybrid System

The overall structure of the tram is shown in Figure 1. The power system of a tram consists of a single fuel cell system, a supercapacitor system, and the traction system and its auxiliary systems. The fuel cell system is the main power source, and the supercapacitor is the auxiliary power source.
In Figure 1, this prototype adopts a “two-motor and one-trailer” grouping form, which is designed to carry about 180 guests. Considering the system volume factor, the fuel cell and its hydrogen supply system are placed on the roof of the trailer car, and the supercapacitor system and traction system are placed on the roof of the motor car. The specifications of the overall prototype are shown in Table 1.
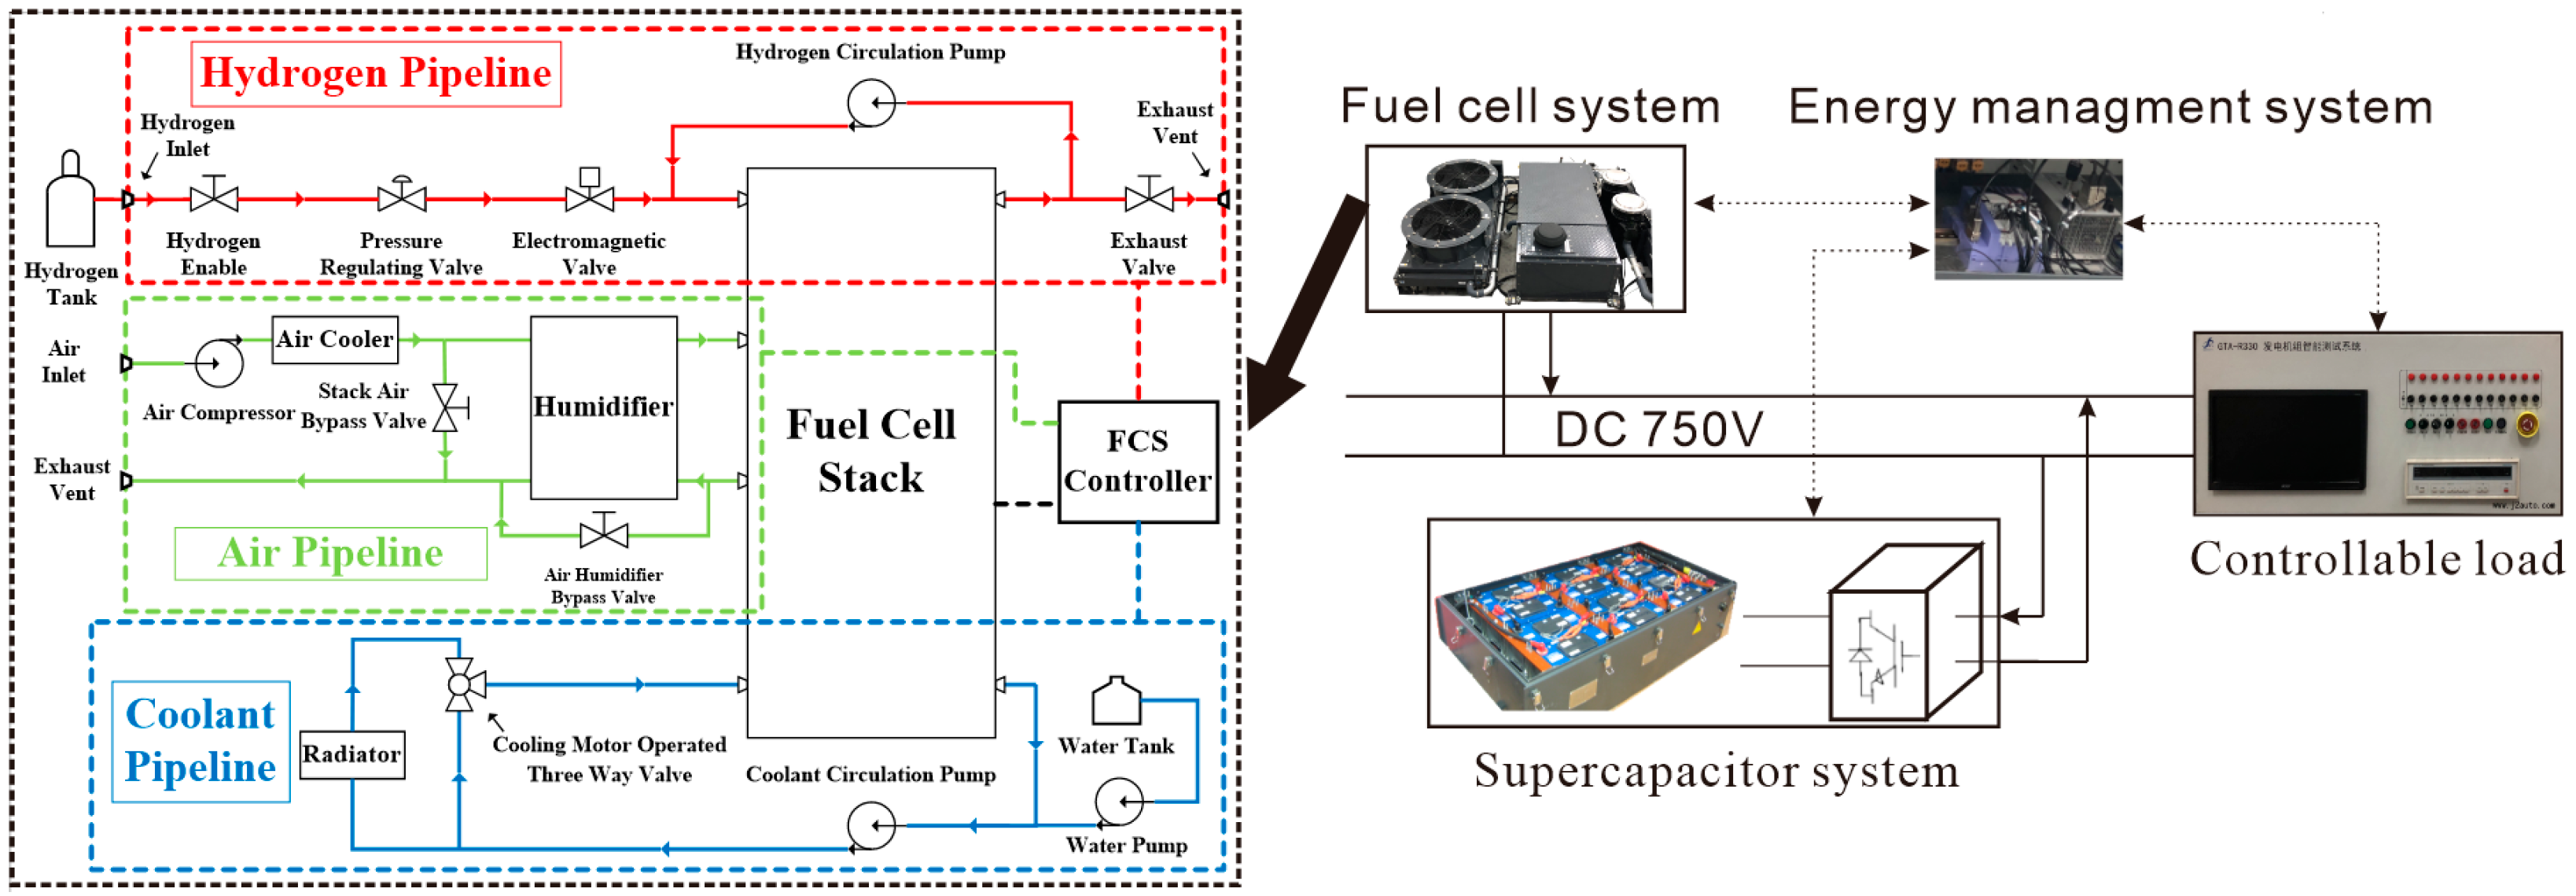
For the power system, the energy source system is connected to the bus through the DC/DC, and the traction system is connected to the bus through the traction inverter. Detailed circuit topology and fuel cell system structure are shown in Figure 2.
For the DC/DC converter applied in the tram, the interleaved parallel converters are applied successfully. Moreover, to ensure the system’s response speed, the PI control algorithm is used in the DC/DC converter. The tuning process of the PI parameters is mostly based on empirical values of both proportional and integral coefficients, and by fine-tuning during the real control process of the tram, we make it more suitable for hybrid systems.

2.1. Fuel Cell System Efficiency Model

Combined with the operating characteristics of the tram, Figure 2 shows the control mode of the fuel cell system. To simplify the control of the main controller, the switch and conversion of each state are controlled by the stack itself, except for the initial state and the normal state one and two which require the user to manually switch. Among them, normal statuses one and two are used as the two common conditions in the actual operation of the tram, namely, the standby state and the running state. The detailed parameters of the fuel cell system are shown in Table 2.
For the calculation of fuel cell system efficiency, this paper uses the calculation method based on the low calorific value of hydrogen in the actual measurement:
η F C = P F C m H 2 L H V
In (1), LHV is the low calorific value of hydrogen; mH2 is the mass of hydrogen consumed by the fuel cell system per second; and PFC is the output power of the fuel cell. mH2 can be calculated according to the change in hydrogen tank pressure [25]:
m H 2 = n M V R T [ p ( k + 1 ) Z ( k + 1 ) p ( k ) Z ( k ) ]
In (2), n is the number of hydrogen tanks; M is the molar mass of hydrogen, taking M = 2 g/mol; V is the volume of the hydrogen tank (each hydrogen tank volume is 140 L); R is the gas constant; p is the pressure of hydrogen, measured by the pressure sensor; and Z is the gas compression factor with the temperature at T and the pressure at p. Its value can be obtained using the look-up table.
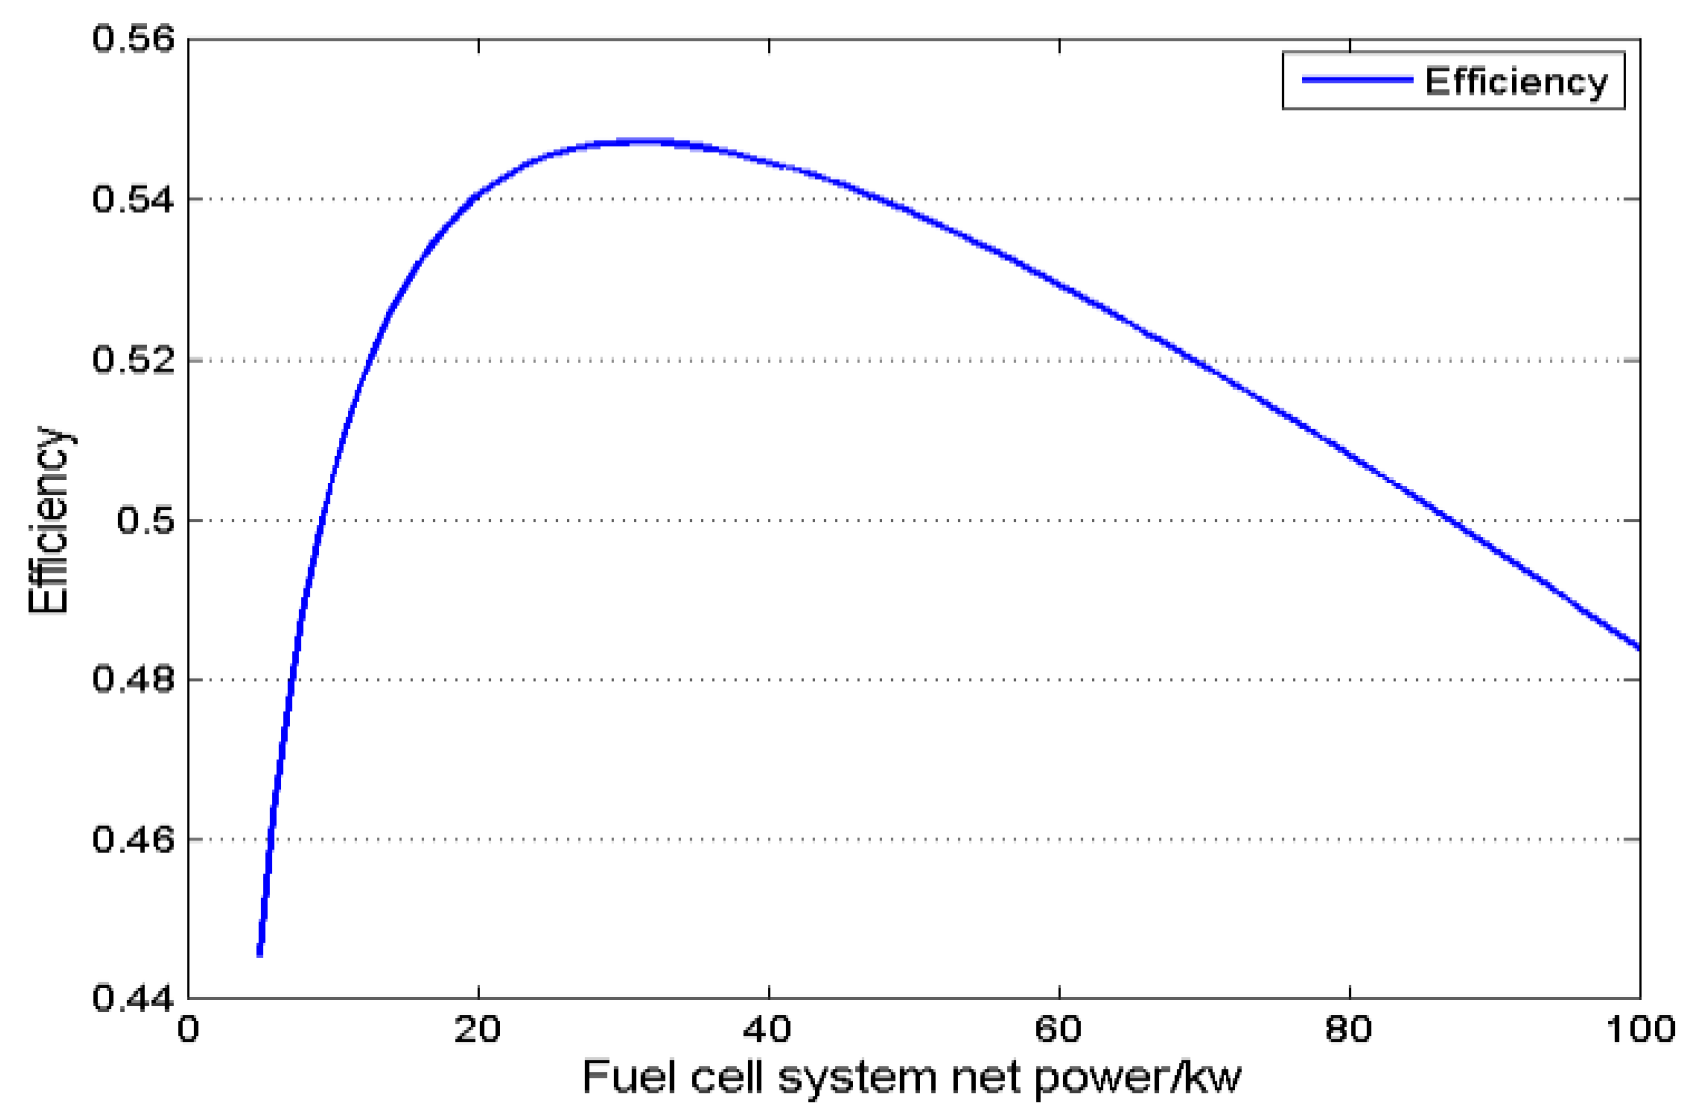
After the actual measurement, the efficiency curve of the fuel cell system is shown in Figure 3.
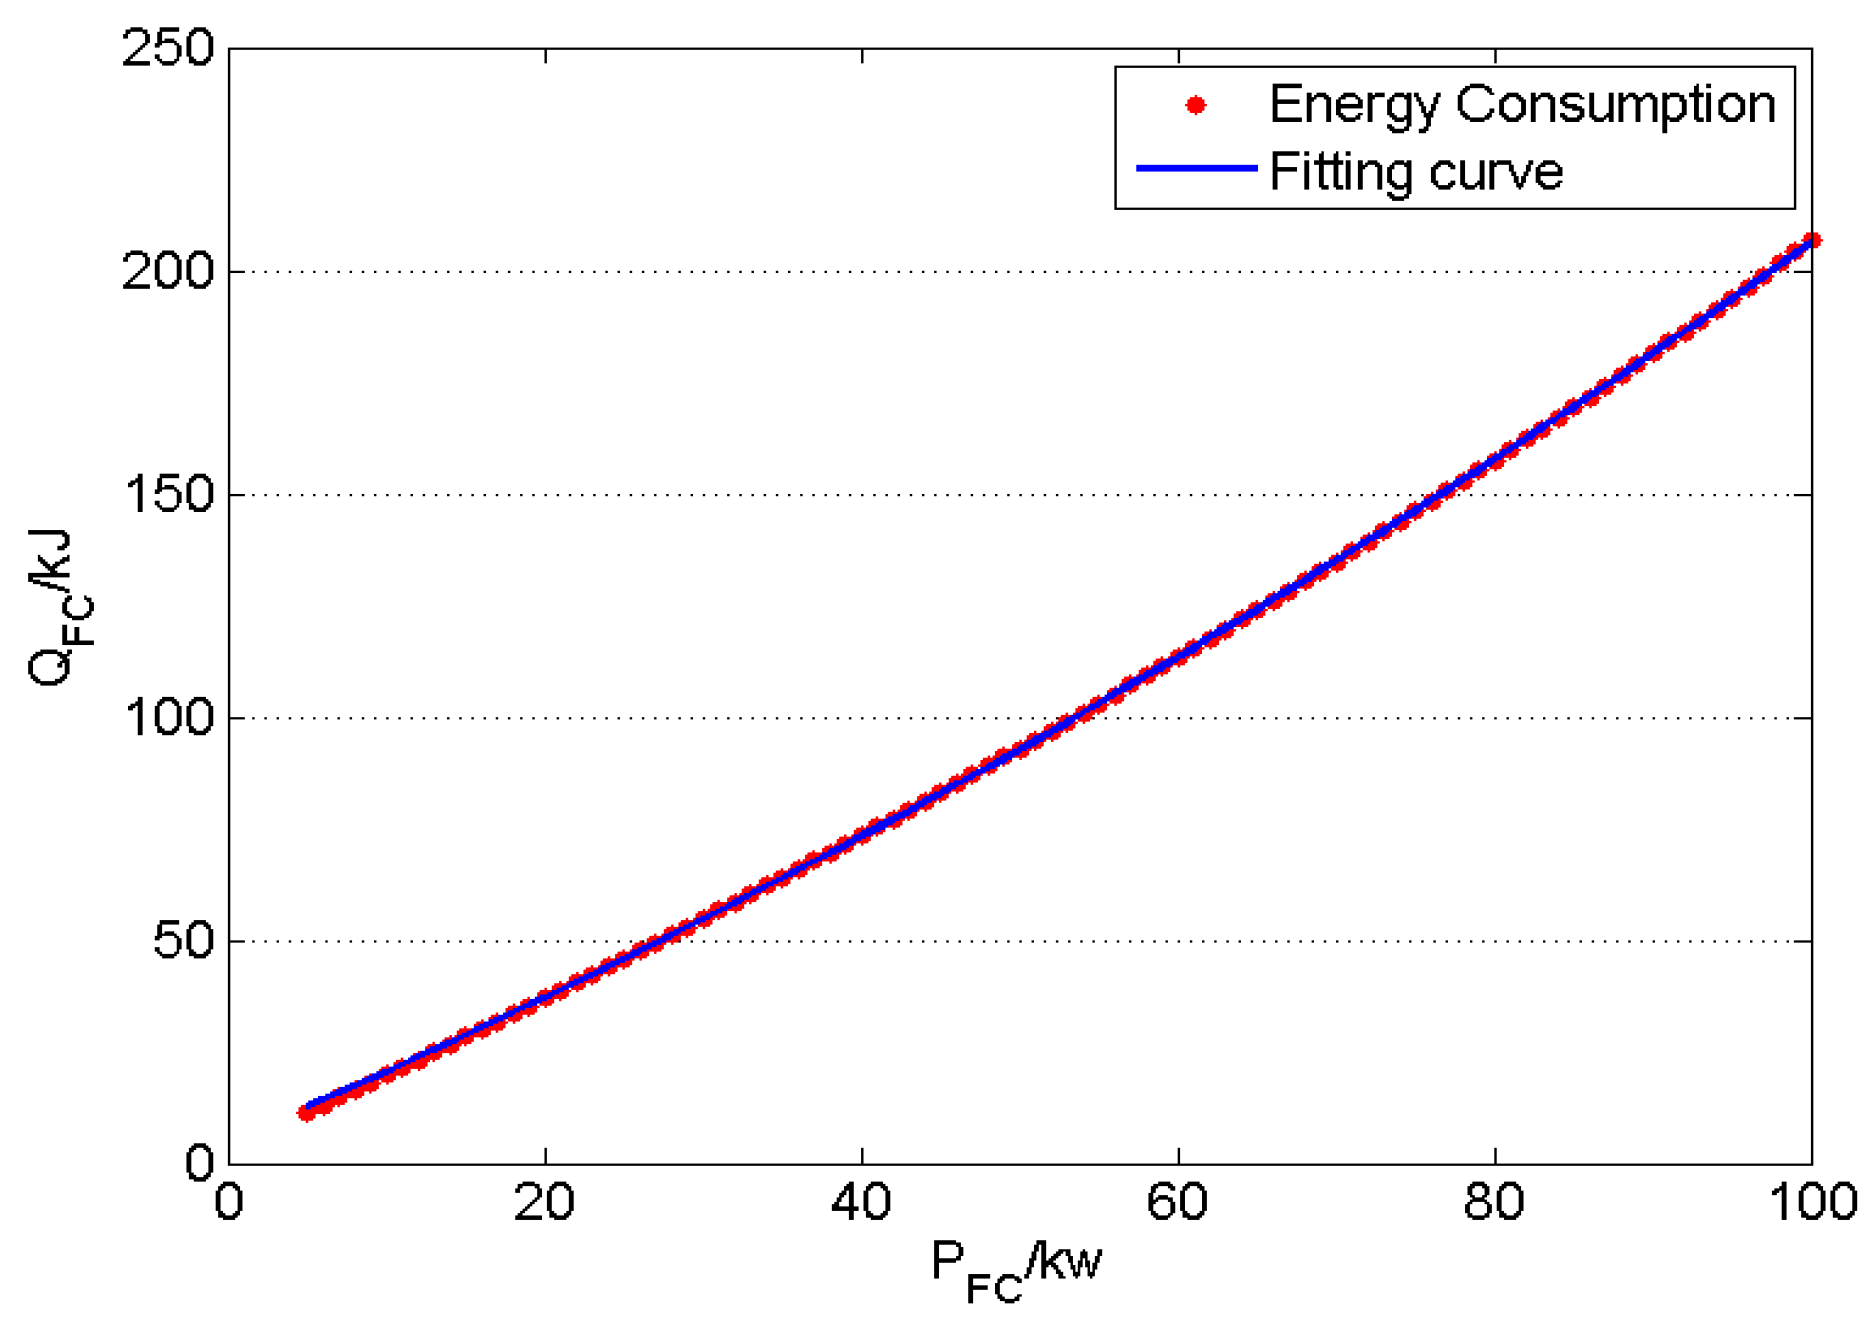
According to Figure 3, the energy consumption curve can be obtained by using the data from the fuel cell system net power divided by the efficiency. The results are given in Figure 4.
In Figure 4, the expression of the fitting curve is:
Q F C = d 1 P F C 2 + d 2 P F C + d 3
In (3), d1~d3 are the fitting coefficients, and their values are as follows (Table 3).

2.2. Supercapacitor System Efficiency Model

In Figure 2, the supercapacitor is connected to the bus by cascading a DC/DC converter. The control of the supercapacitor system is achieved by controlling the input/output power of the DC/DC. In terms of communication, in order to maintain consistency and stability of communication, the application layer communication protocol of the supercapacitor system also adopts the CANopen protocol that is consistent with the outside. The detailed parameters of the super capacitor system are as follows (Table 4):
In this paper’s charge–discharge model, only the constant power charge and discharge are discussed because power is used as the goal of optimal control in practical application [26].
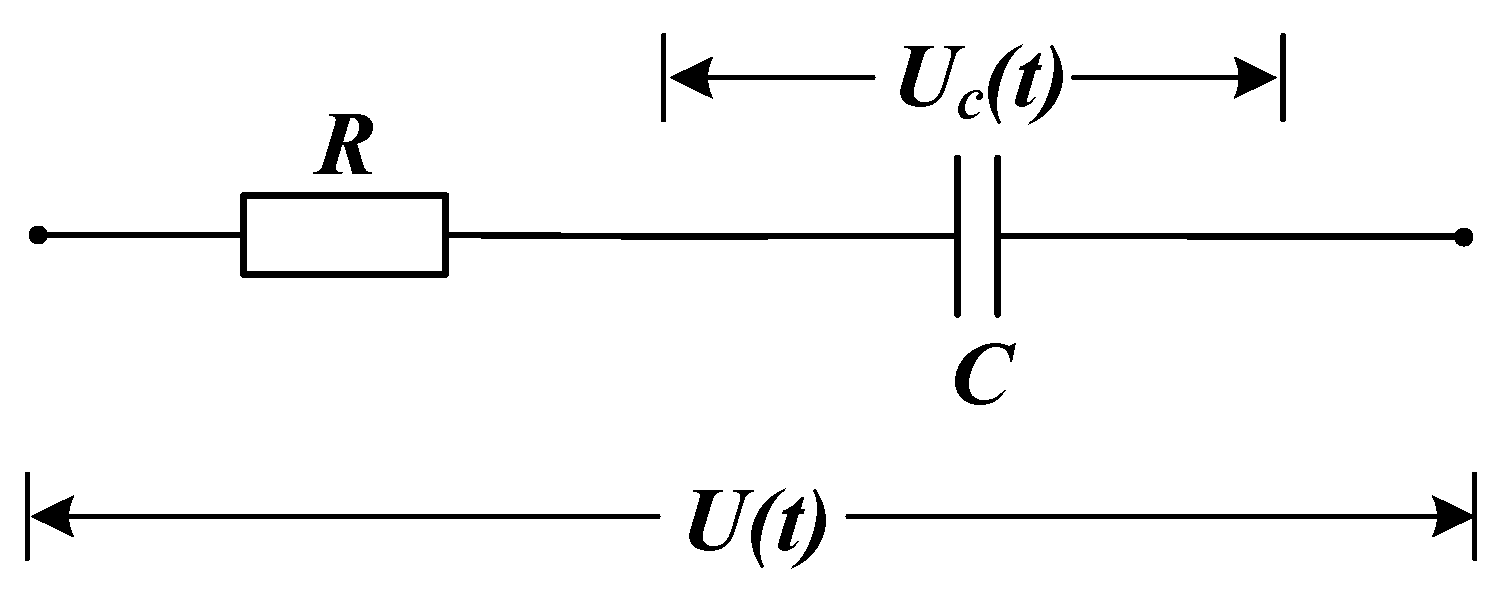
For the RC model in Figure 5, the charge–discharge model can be obtained:
t + A = C R ln ( U ) C 2 P S C U 2
In Equation (4), A is the constant term when t = 0; U is the terminal voltage of the supercapacitor, with the unit V. The efficiency model is shown as follows:
η c h g = 2 / ( 1 + 1 4 R P S C U o c v 2 ) P S C < 0 η d i s = 1 2 ( 1 + 1 4 R P S C U o c v 2 ) P S C 0
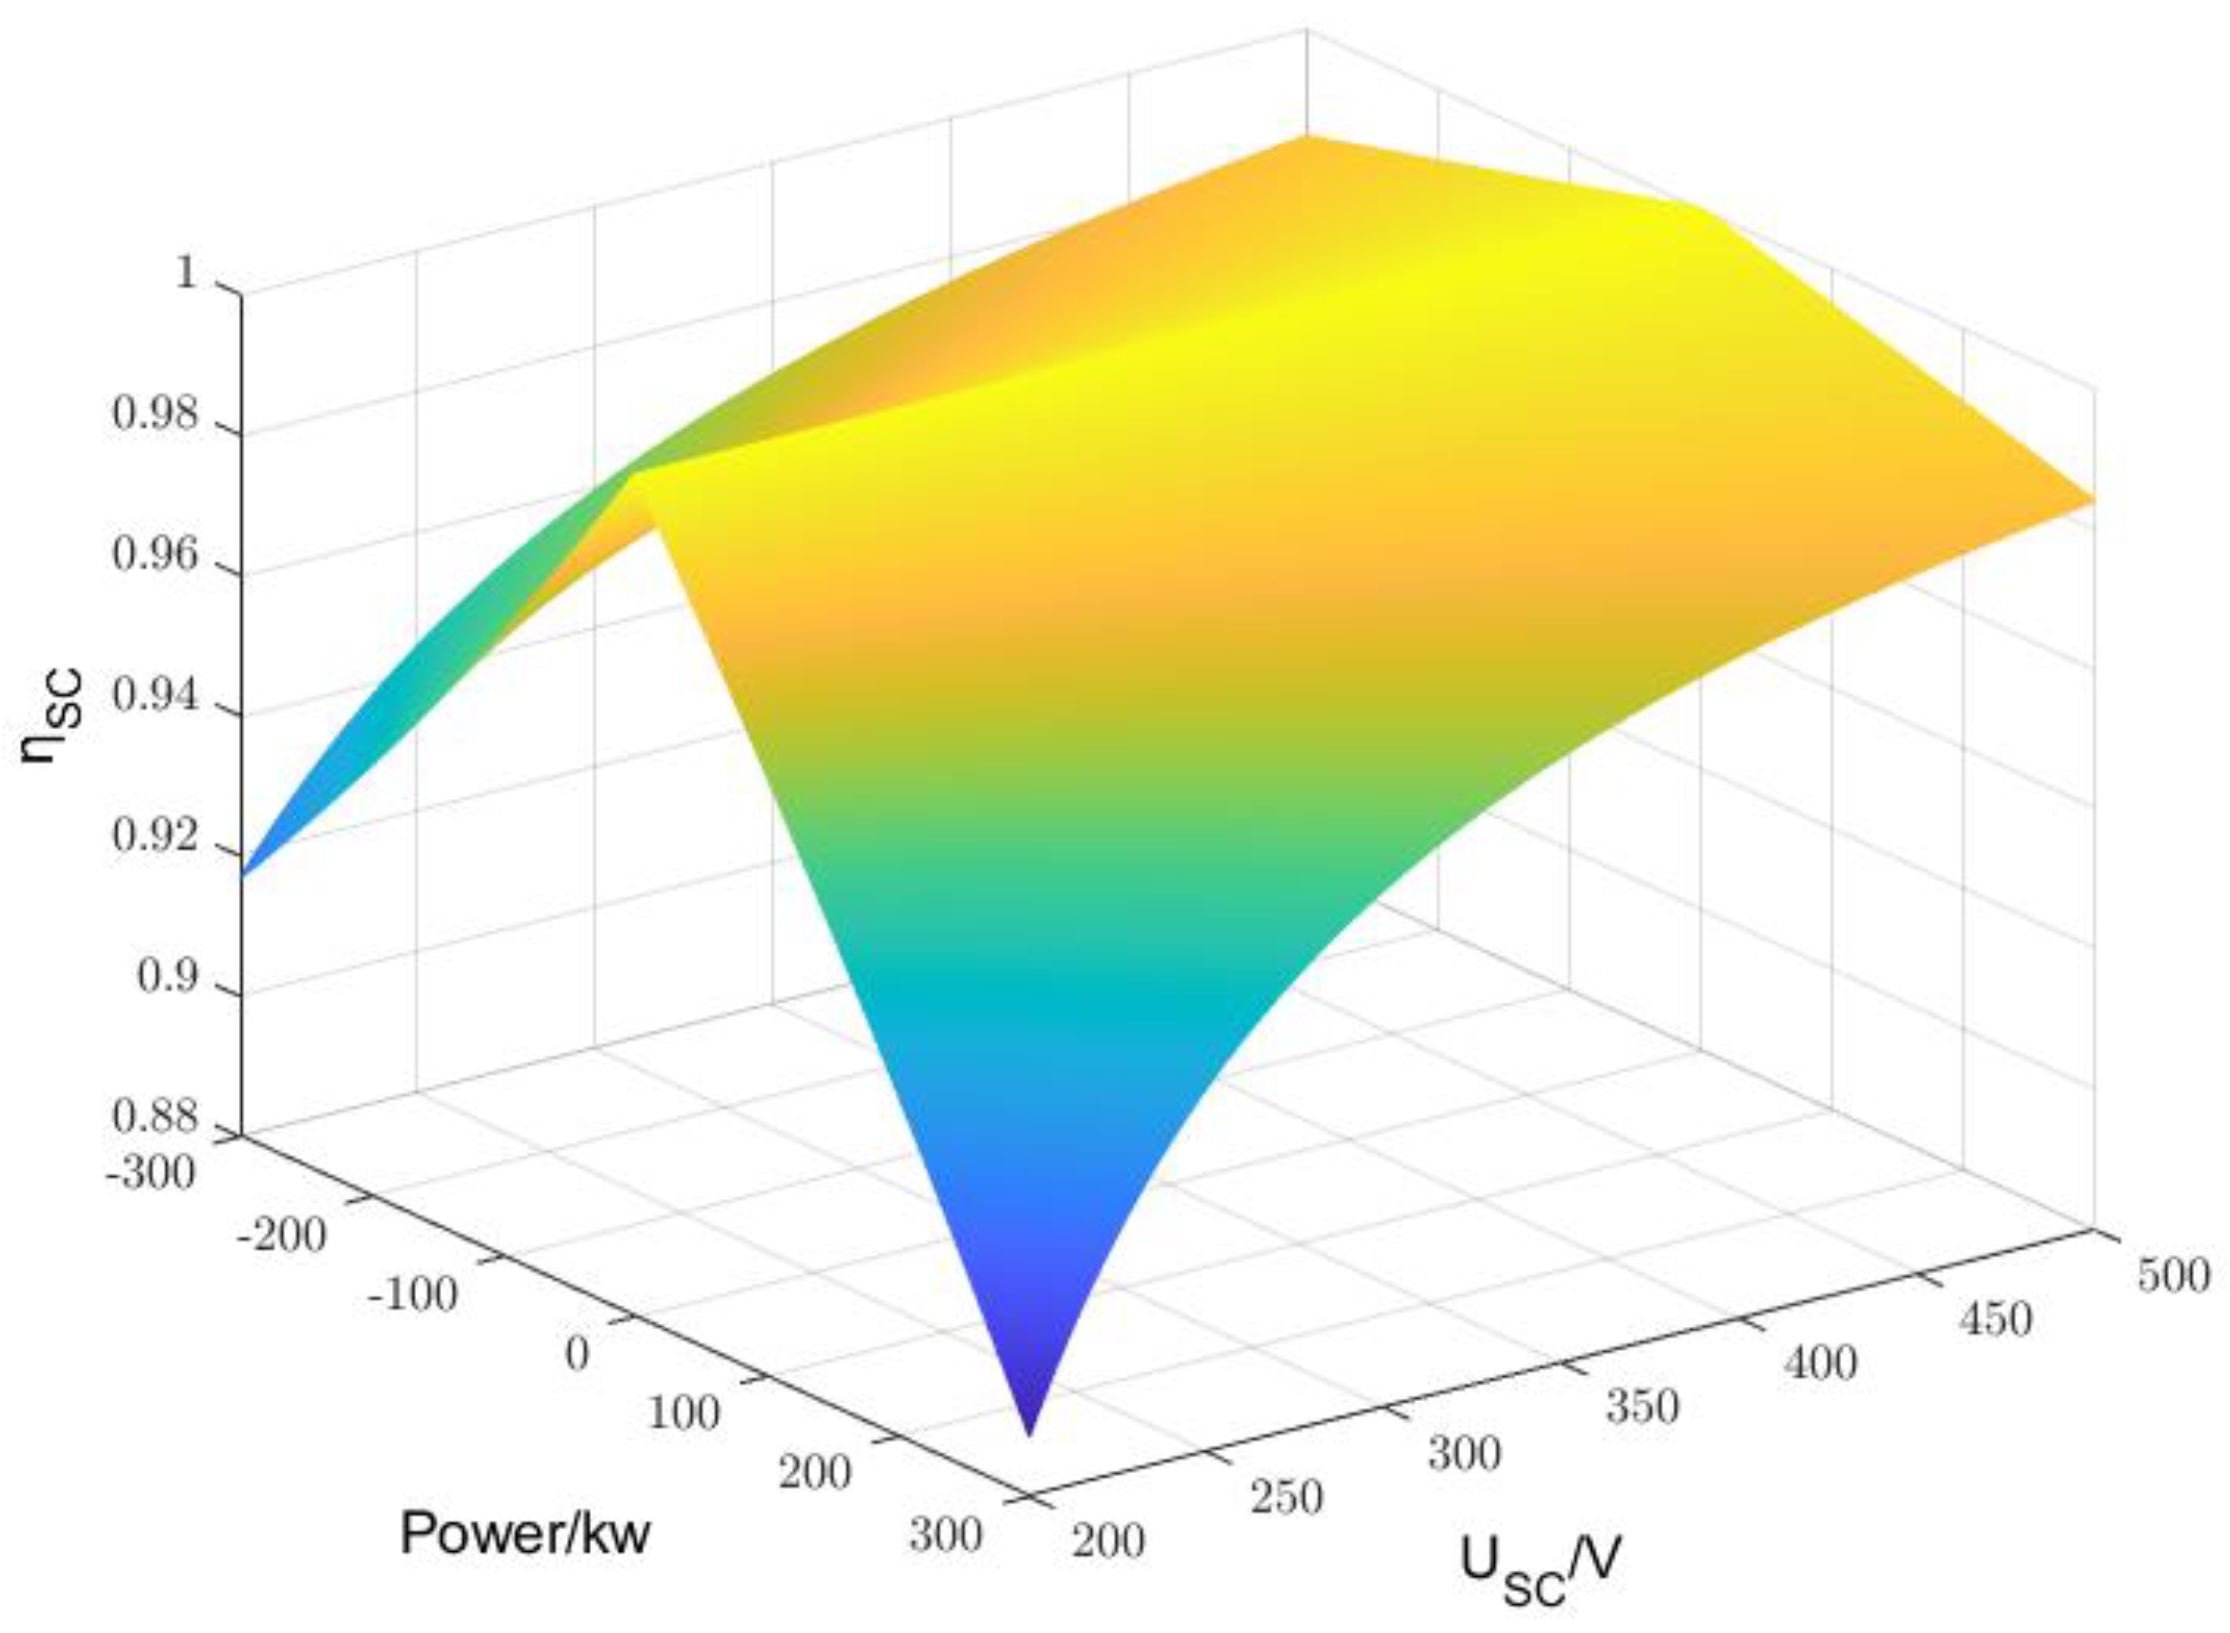
In (5), PSC is the charging or discharging power of the supercapacitor, R is the internal resistance of the supercapacitor with the unit ohms, Uocv is the terminal voltage of the supercapacitor, and the unit is V. After the simulation and calculation with (5), the efficiency model of SCS can be obtained.
The charge–discharge efficieny calculated by Equation (5) is given in Figure 6.

3. Optimal Hydrogen Consumption Method

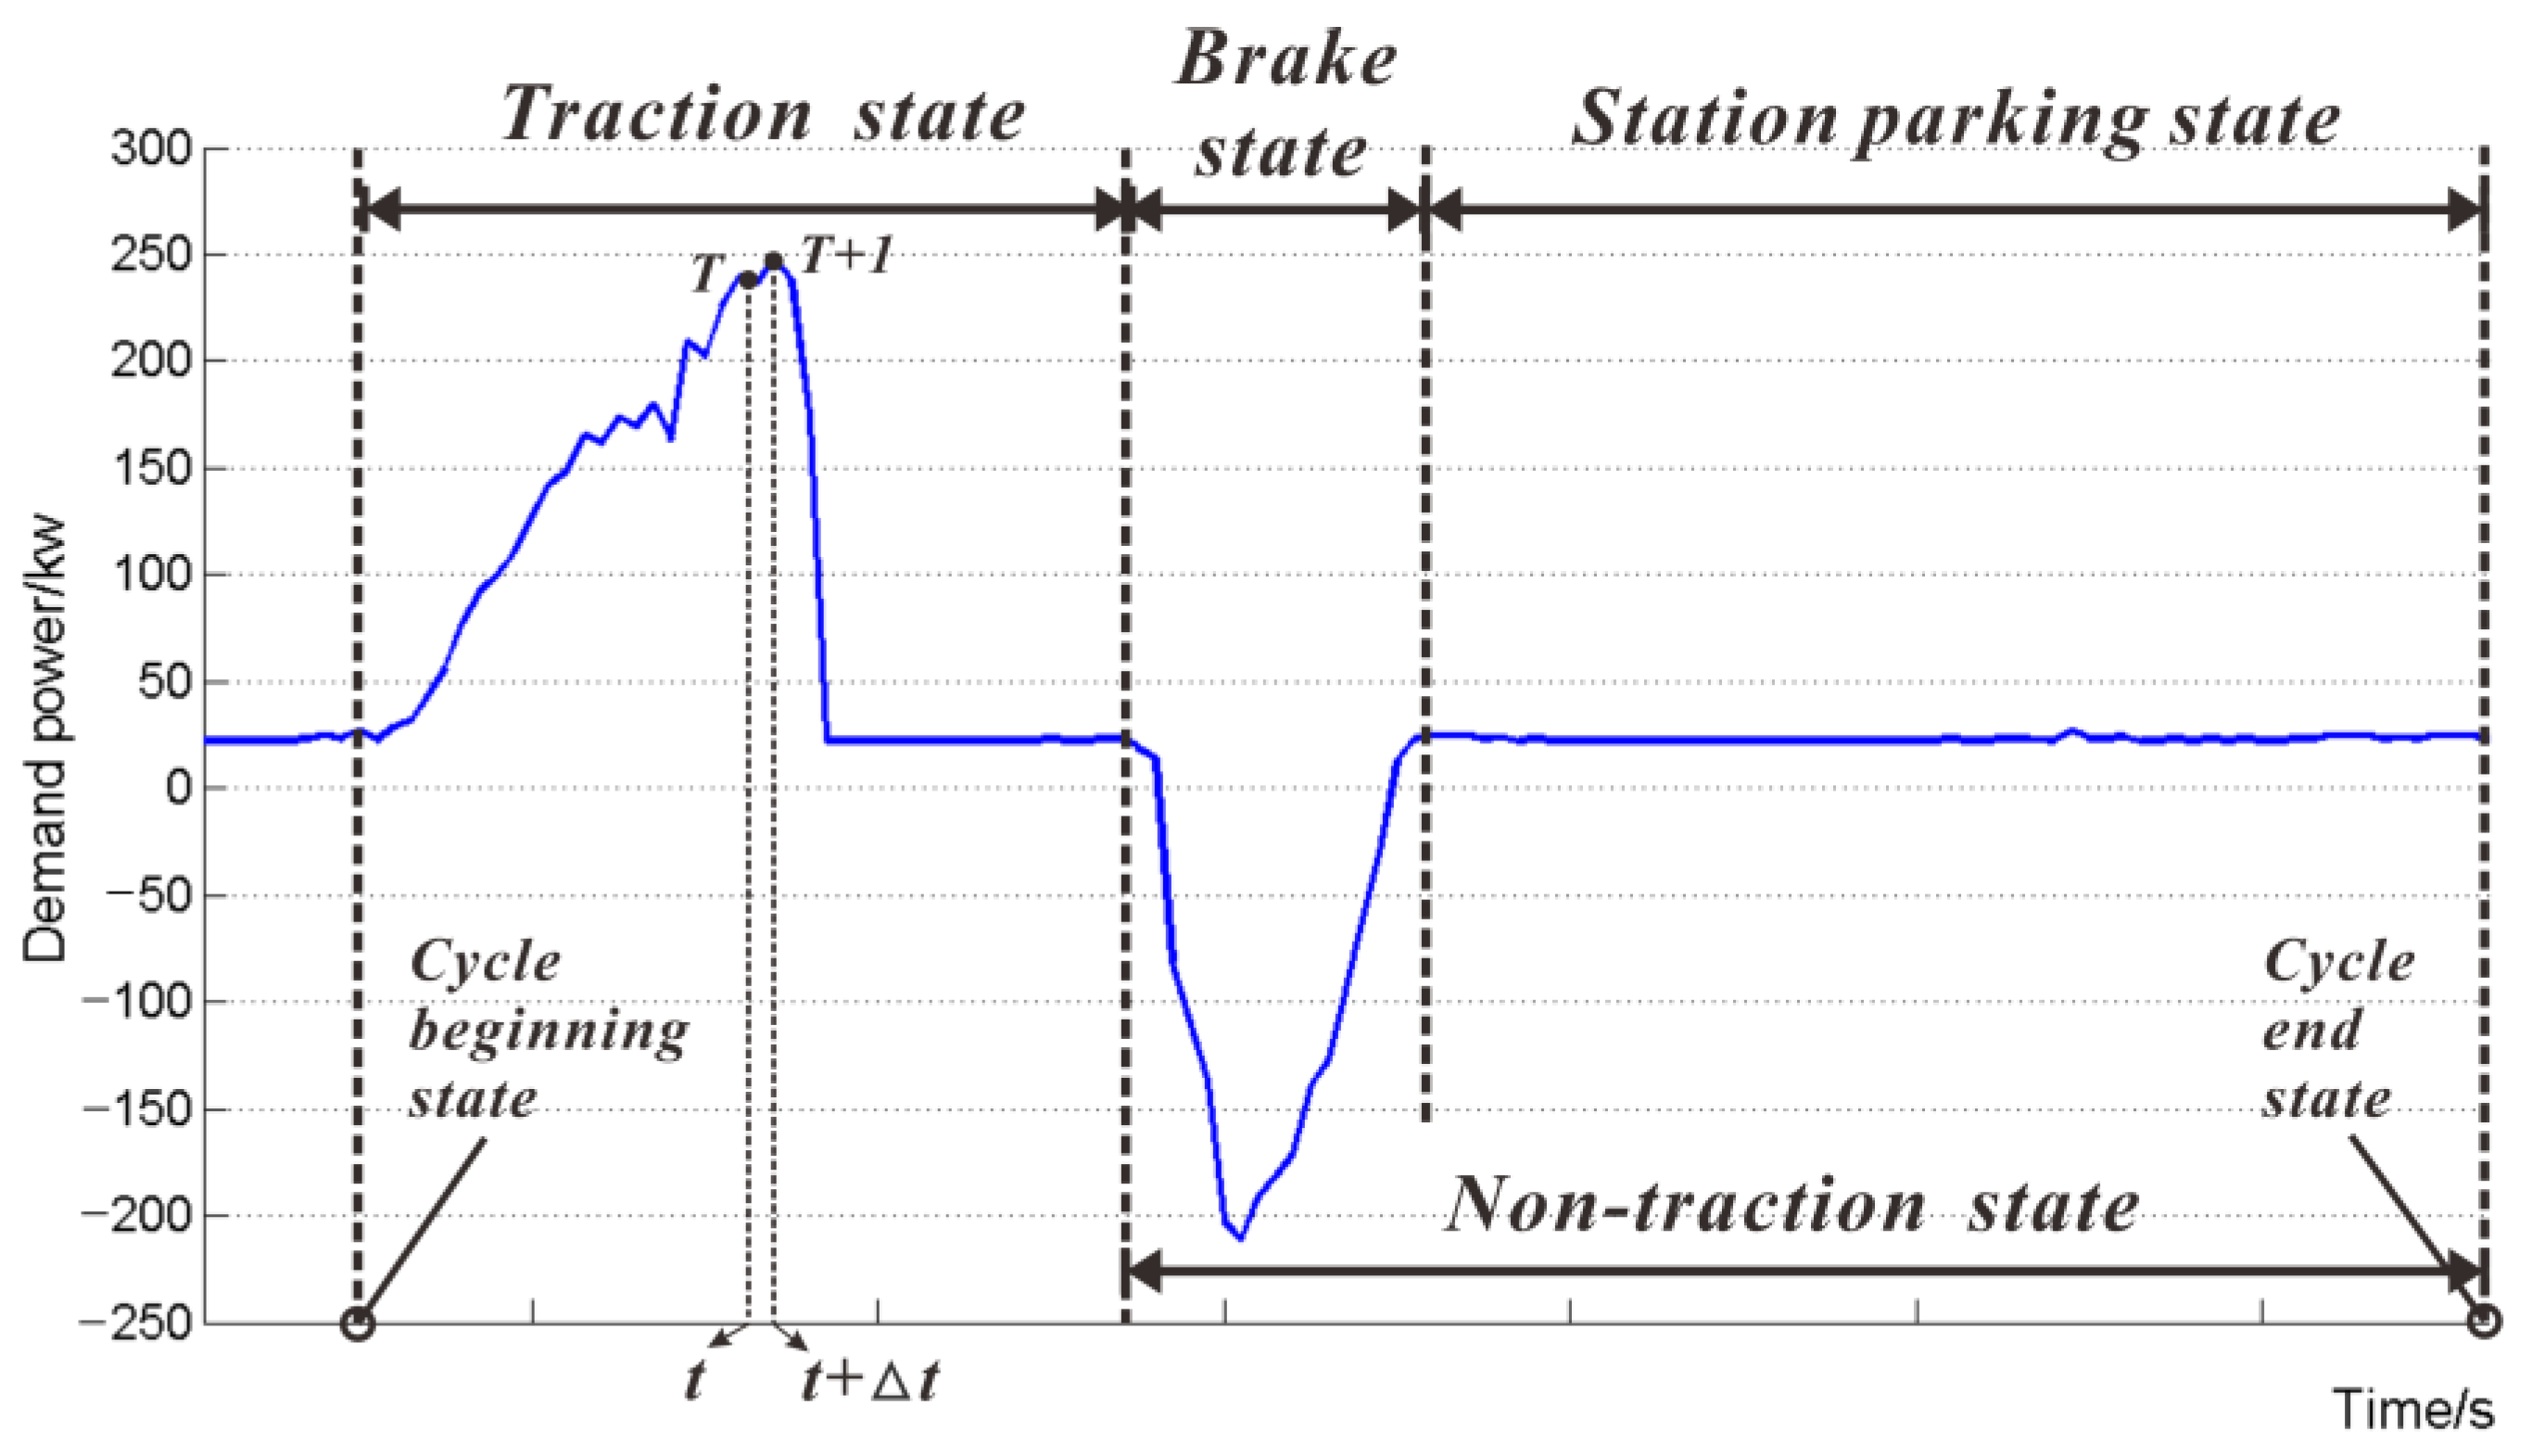
In a complete operating cycle, a hybrid tram generally experiences three states: traction state, braking state, and charging state, as shown in Figure 7. In order to ensure that trams can continue to operate stably, the voltage of the supercapacitor is required to be the same at the beginning state and the end state. The optimal hydrogen consumption method divides the entire operating cycle of a tram into two parts: traction state and non-traction state. When the tram is in the traction state, the optimal hydrogen consumption method will calculate the minimum value of the cost function Q at any moment T in the traction and use the minimum value point Qmin as the energy distribution method. Under the non-traction state, the optimal hydrogen consumption method will calculate the output power value of the fuel cell system based on the voltage value of the supercapacitor, so as to ensure that the beginning and the end voltage values of the supercapacitor are consistent during the entire operation cycle.

3.1. Non-Traction State

During the entire operating cycle of a tram, due to the unpredictability of demand power, the actual demand power value can only be obtained from the feedback value of the traction inverter. Each system power on the bus will satisfy:
P r e q = P S C + P F C
In (6), Preq is the bus demand power, PSC is the supercapacitor power and satisfies PSC ≥ 0 under the discharging state and PSC < 0 under the charging state. PFC is the net output power of the fuel cell system. During the braking process, the bus power will satisfy Preq < 0. In order to improve the efficiency of the tram, the braking energy will only be recovered by the supercapacitor. Therefore, in the braking state, the following conditions are met:
P r e q = P S C
After the braking state, the tram usually moves into the parking state in the station. Within this state, the fuel cell will charge the supercapacitor so that the voltage of the supercapacitor returns to the beginning-state value. According to (4), during the parking state in the station, in order to keep the end-state voltage of the supercapacitor consistent with the beginning-state voltage, the charging power of the supercapacitor in this state is:
P S C _ c h g = C ( U m 2 U s t a t i o n 2 ) 2 [ t c h g C R ln ( U m / U s t a t i o n ) ]
In (8), Um is the beginning-state value of the supercapacitor voltage and Ustation is the voltage value of the supercapacitor when the tram arrives in the station. tchg is the parking time of tram in the station, and the value takes tchg = 60 s in this paper. Taking into account the demand power of the bus at this time, the output power of the fuel cell system is obtained:
P F C = C ( U m 2 U s t a t i o n 2 ) 2 [ t c h g C R ln ( U m / U s t a t i o n ) ] + P t r a m

3.2. Traction State

The traction state of the tram is the main output state of the hybrid system. Due to the large power demand of the system, the supercapacitor is always maintained at the discharge state. Therefore, this paper adopts the optimal hydrogen consumption method to ensure that hydrogen consumption is at a low level during the entire operation cycle.
In order to solve the best energy distribution problem, this paper constructs the cost function Q from the perspective of full-cycle hydrogen consumption. At moment T during the traction state, the cost function Q consists of a real-time cost QFC and an expected cost Qcost, as shown in (10):
Q = Q F C + Q c o s t
In (11), the real-time cost function QFC will calculate the energy consumption of the fuel cell system at this moment, with unit J. Δt is the time interval between T and T + 1, using unit s:
Q F C = P F C Δ t η n e t ( P F C )
The expected cost function Qcost will assume that the tram will enter the braking state after the next moment T + 1 and calculate the energy consumption value according to charging process consumption during the parking state in the station. If the end-state voltage value is Um, according to (9), the function Qcost can be obtained:
Q c o s t = t c h g ( C ( U m 2 U 1 2 ) 2 [ t c h g C R ln ( U m / U 1 ) ] + P t r a m )
In (12), U1 is the voltage value of the supercapacitor at the next moment T + 1. Due to the unpredictability of the braking energy, it is not considered in the Qcost, that is, only the impact caused by the supercapacitor power PSC between T and T + 1 on the consumption of the station parking charging process is considered.
According to (6), QFC can be simplified as:
Q F C = P r e q P S C η n e t ( P r e q P S C )
According to (4), if the supercapacitor power is PSC between the moment T and T + 1, the relationship between PSC and U1 is:
P S C = C [ U 0 2 U 1 2 ] 2 [ Δ t C R ln ( U 0 / U 1 ) ]
In (14), U0 is the voltage value of the supercapacitor at moment T, which is a known quantity. Therefore, according to (12)–(14), the cost function Q can be expressed as a function related to the required power Preq, the supercapacitor voltage value U0 at the moment T, and the supercapacitor voltage value U1 at the moment T + 1. If the Preq and U0 are known at the moment T, the function Q will meet:
Q U 1 > 0 Q U 1 min Q U 1 max < 0
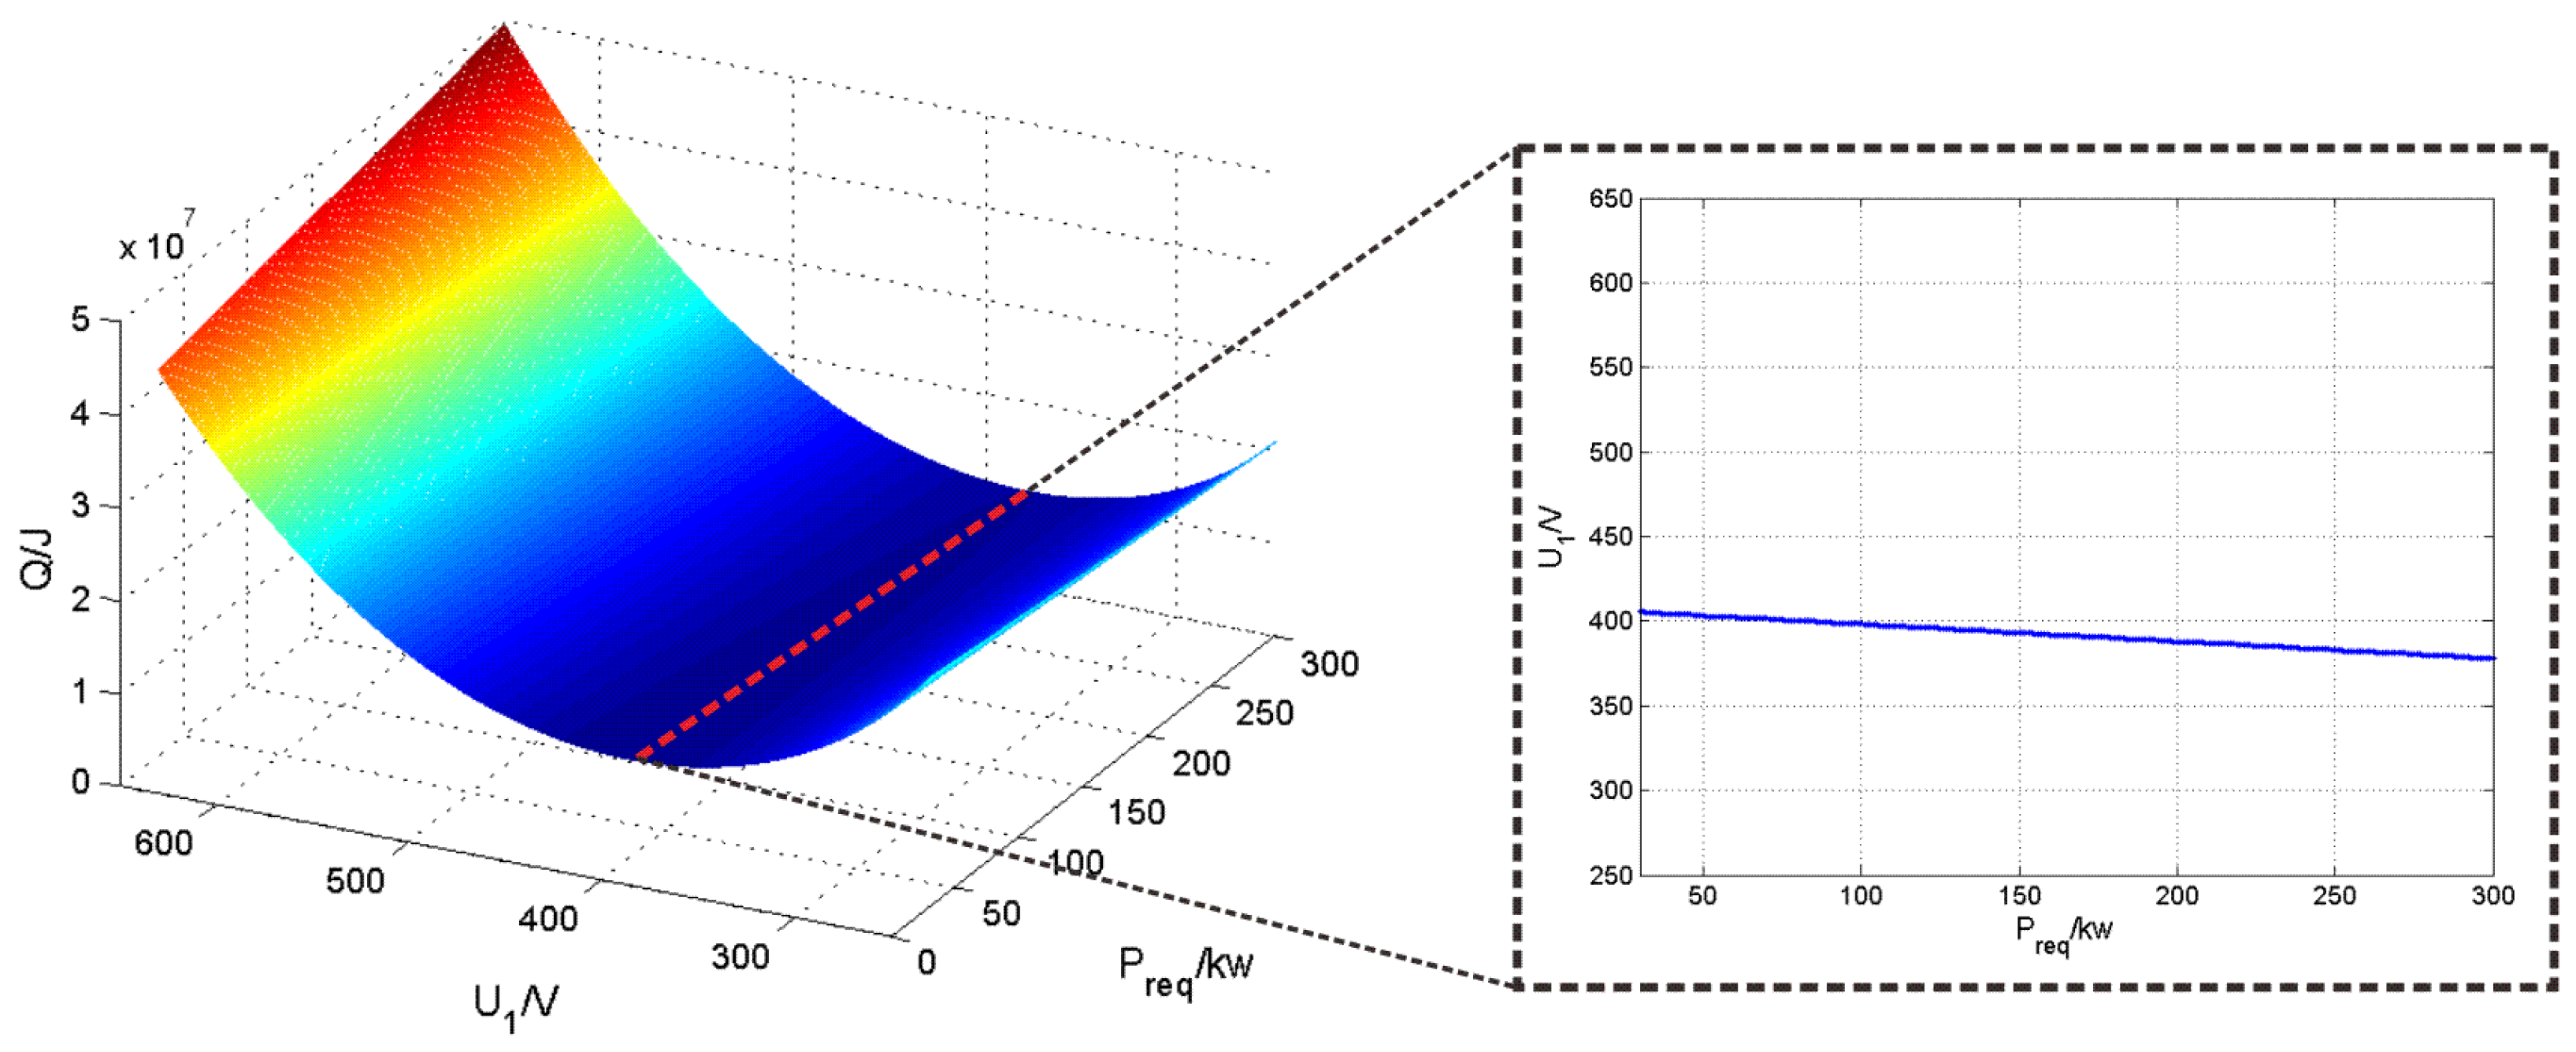
Equation (15) indicates that there must be a minimum value Qmin existing in the interval [U1min, U1max]. Therefore, under the different value of U1, the minimum value Qmin can be found by using an off-line calculation method. For example, when U0 = 400 V at the moment T, the waveform of the cost function Q is shown in Figure 8, and the minimum values Qmin under different demand powers Preq are marked by a red dotted line.
In Figure 8, the point (Preq, U1) on the Qmin line shows a straight-like distribution. As the analytical solution is hard to obtain, after the conversion of U1 to PSC by using (14), the fitting expression between PSC and Preq and U0 is:
P S C = k ( U 0 ) P r e q + b ( U 0 )
In (16), k(U0) and b(U0) are coefficients that change with the U0 value, which can be obtained by the nonlinear fitting calculation:
k ( U 0 ) = p 1 U 0 3 + p 2 U 0 3 + p 3 U 0 + p 4 b ( U 0 ) = q 1 U 0 3 + q 2 U 0 3 + q 3 U 0 + q 4
In (17), p1~p4 and q1~q4 are fitting coefficients, as are shown in Table 5.
According to (6) and (16), when the supercapacitor’s voltage is U0 with the demand power Preq, the optimal fuel cell system output is:
P F C = [ 1 k ( U 0 ) ] P r e q b ( U 0 ) P F C P r e q P r e q P F C > P r e q
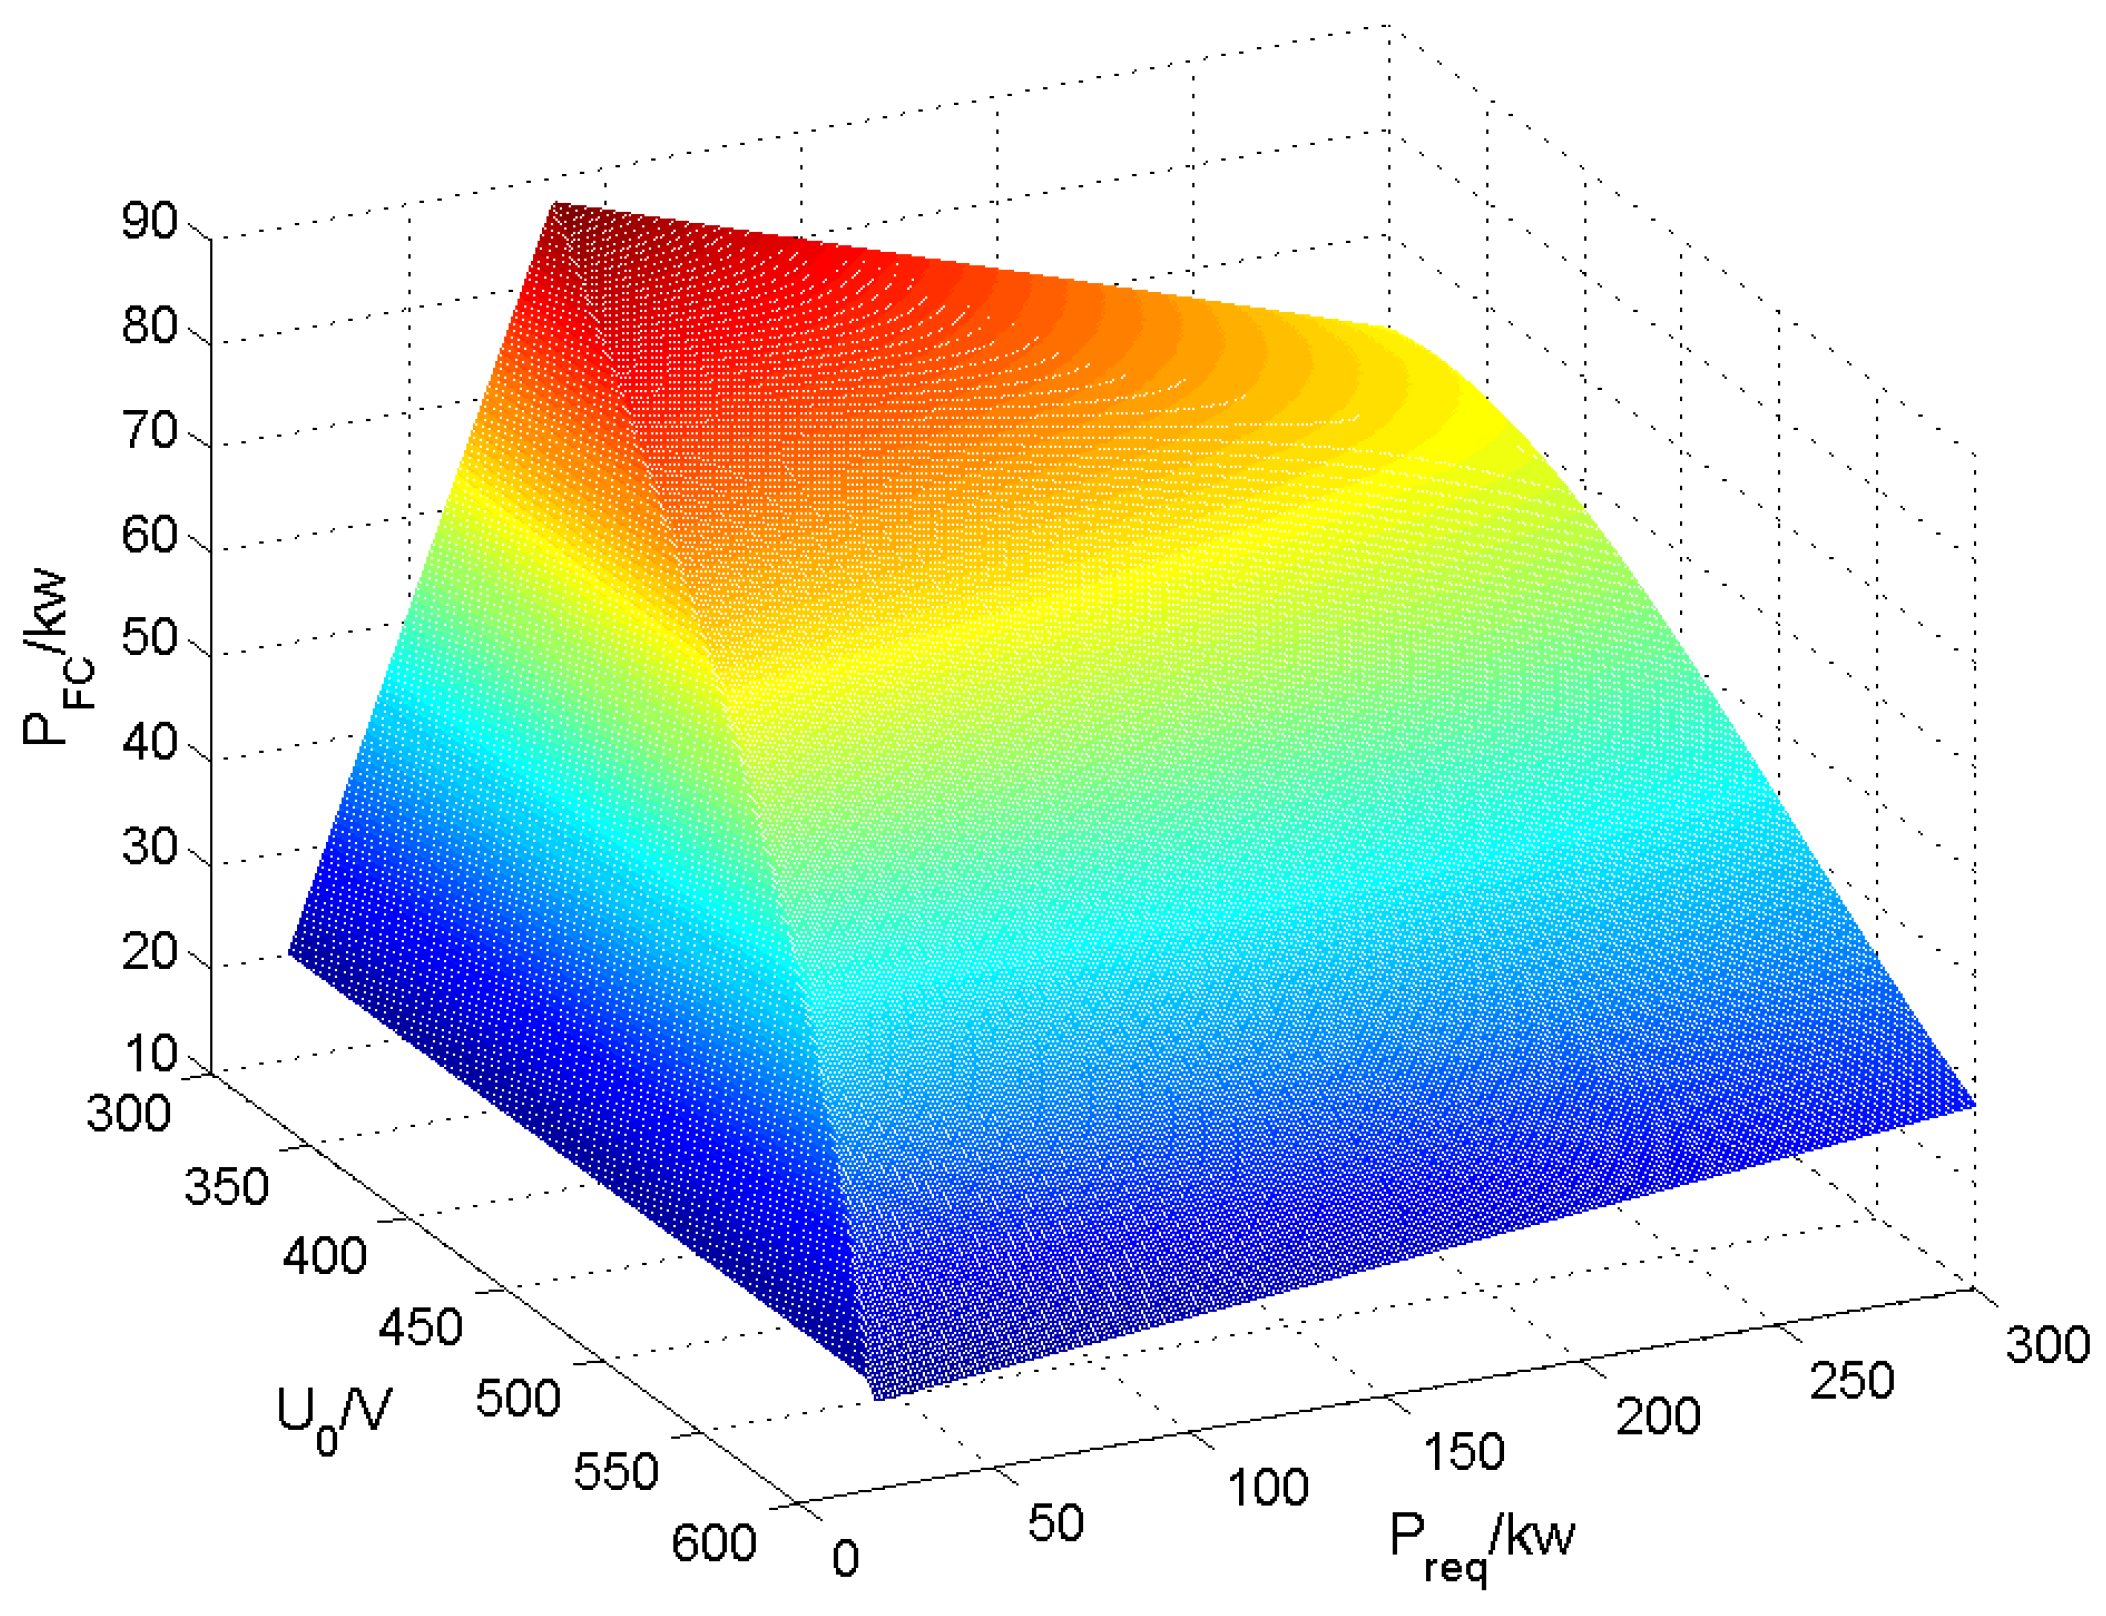
According to (18), the output power curve of the fuel cell system can be obtained.
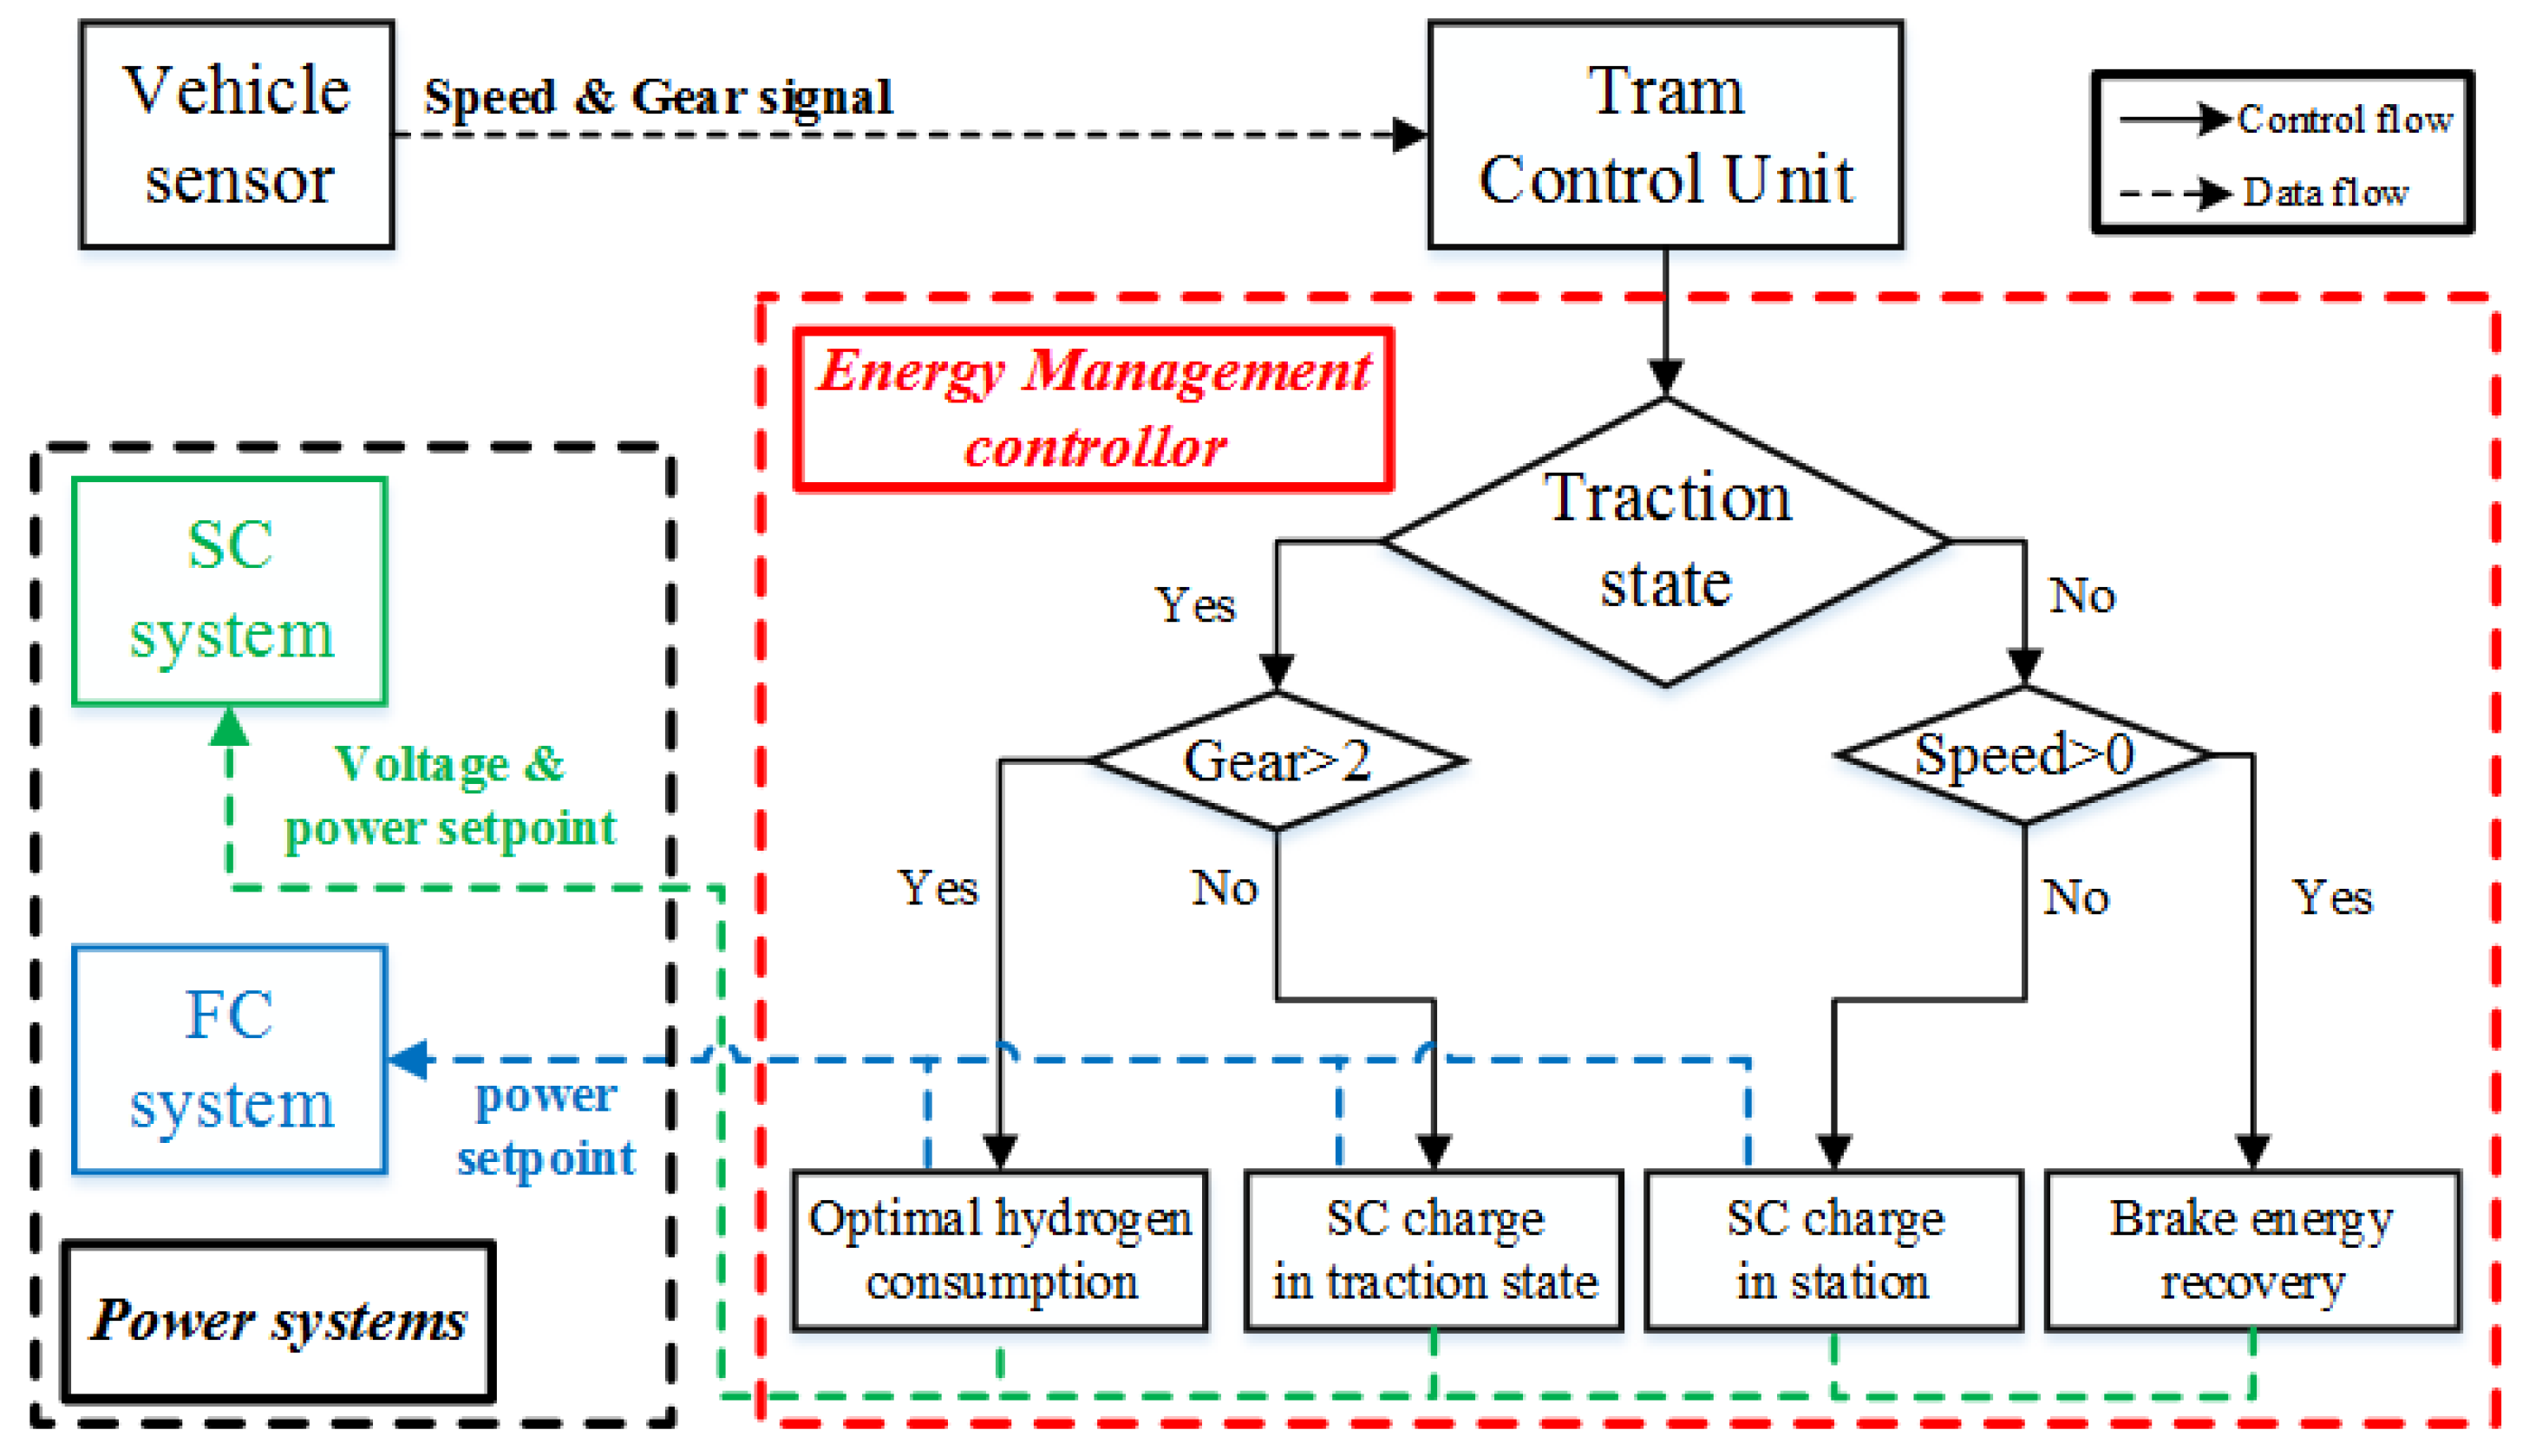
In summary, with the real-time detection of tram operating conditions and system parameters, the control loop of the optimal energy consumption method is shown in Figure 9.
In Figure 9, the energy management controller needs to deal with signals sent by the vehicle controller and power system controller. The vehicle controller sends the speed and gear signal to assist the controller in determining the operating status of the vehicle. The demand power of traction system as well as the voltage of the supercapacitor system are sent by the power system controller, which is used to calculate the power setpoint of the fuel cell system. Finally, the energy management controller provides the power setpoints of power systems under different operational conditions. And the calculation results of FCS setpoints are given in Figure 10.

4. Experimental Verification and Results

In order to verify the response ability and the actual control effect of this method, this paper verified the method using the RTLAB hardware-in-the-loop simulation platform and the actual prototype tram.

4.1. RTLAB Hardware-in-the-Loop Simulation

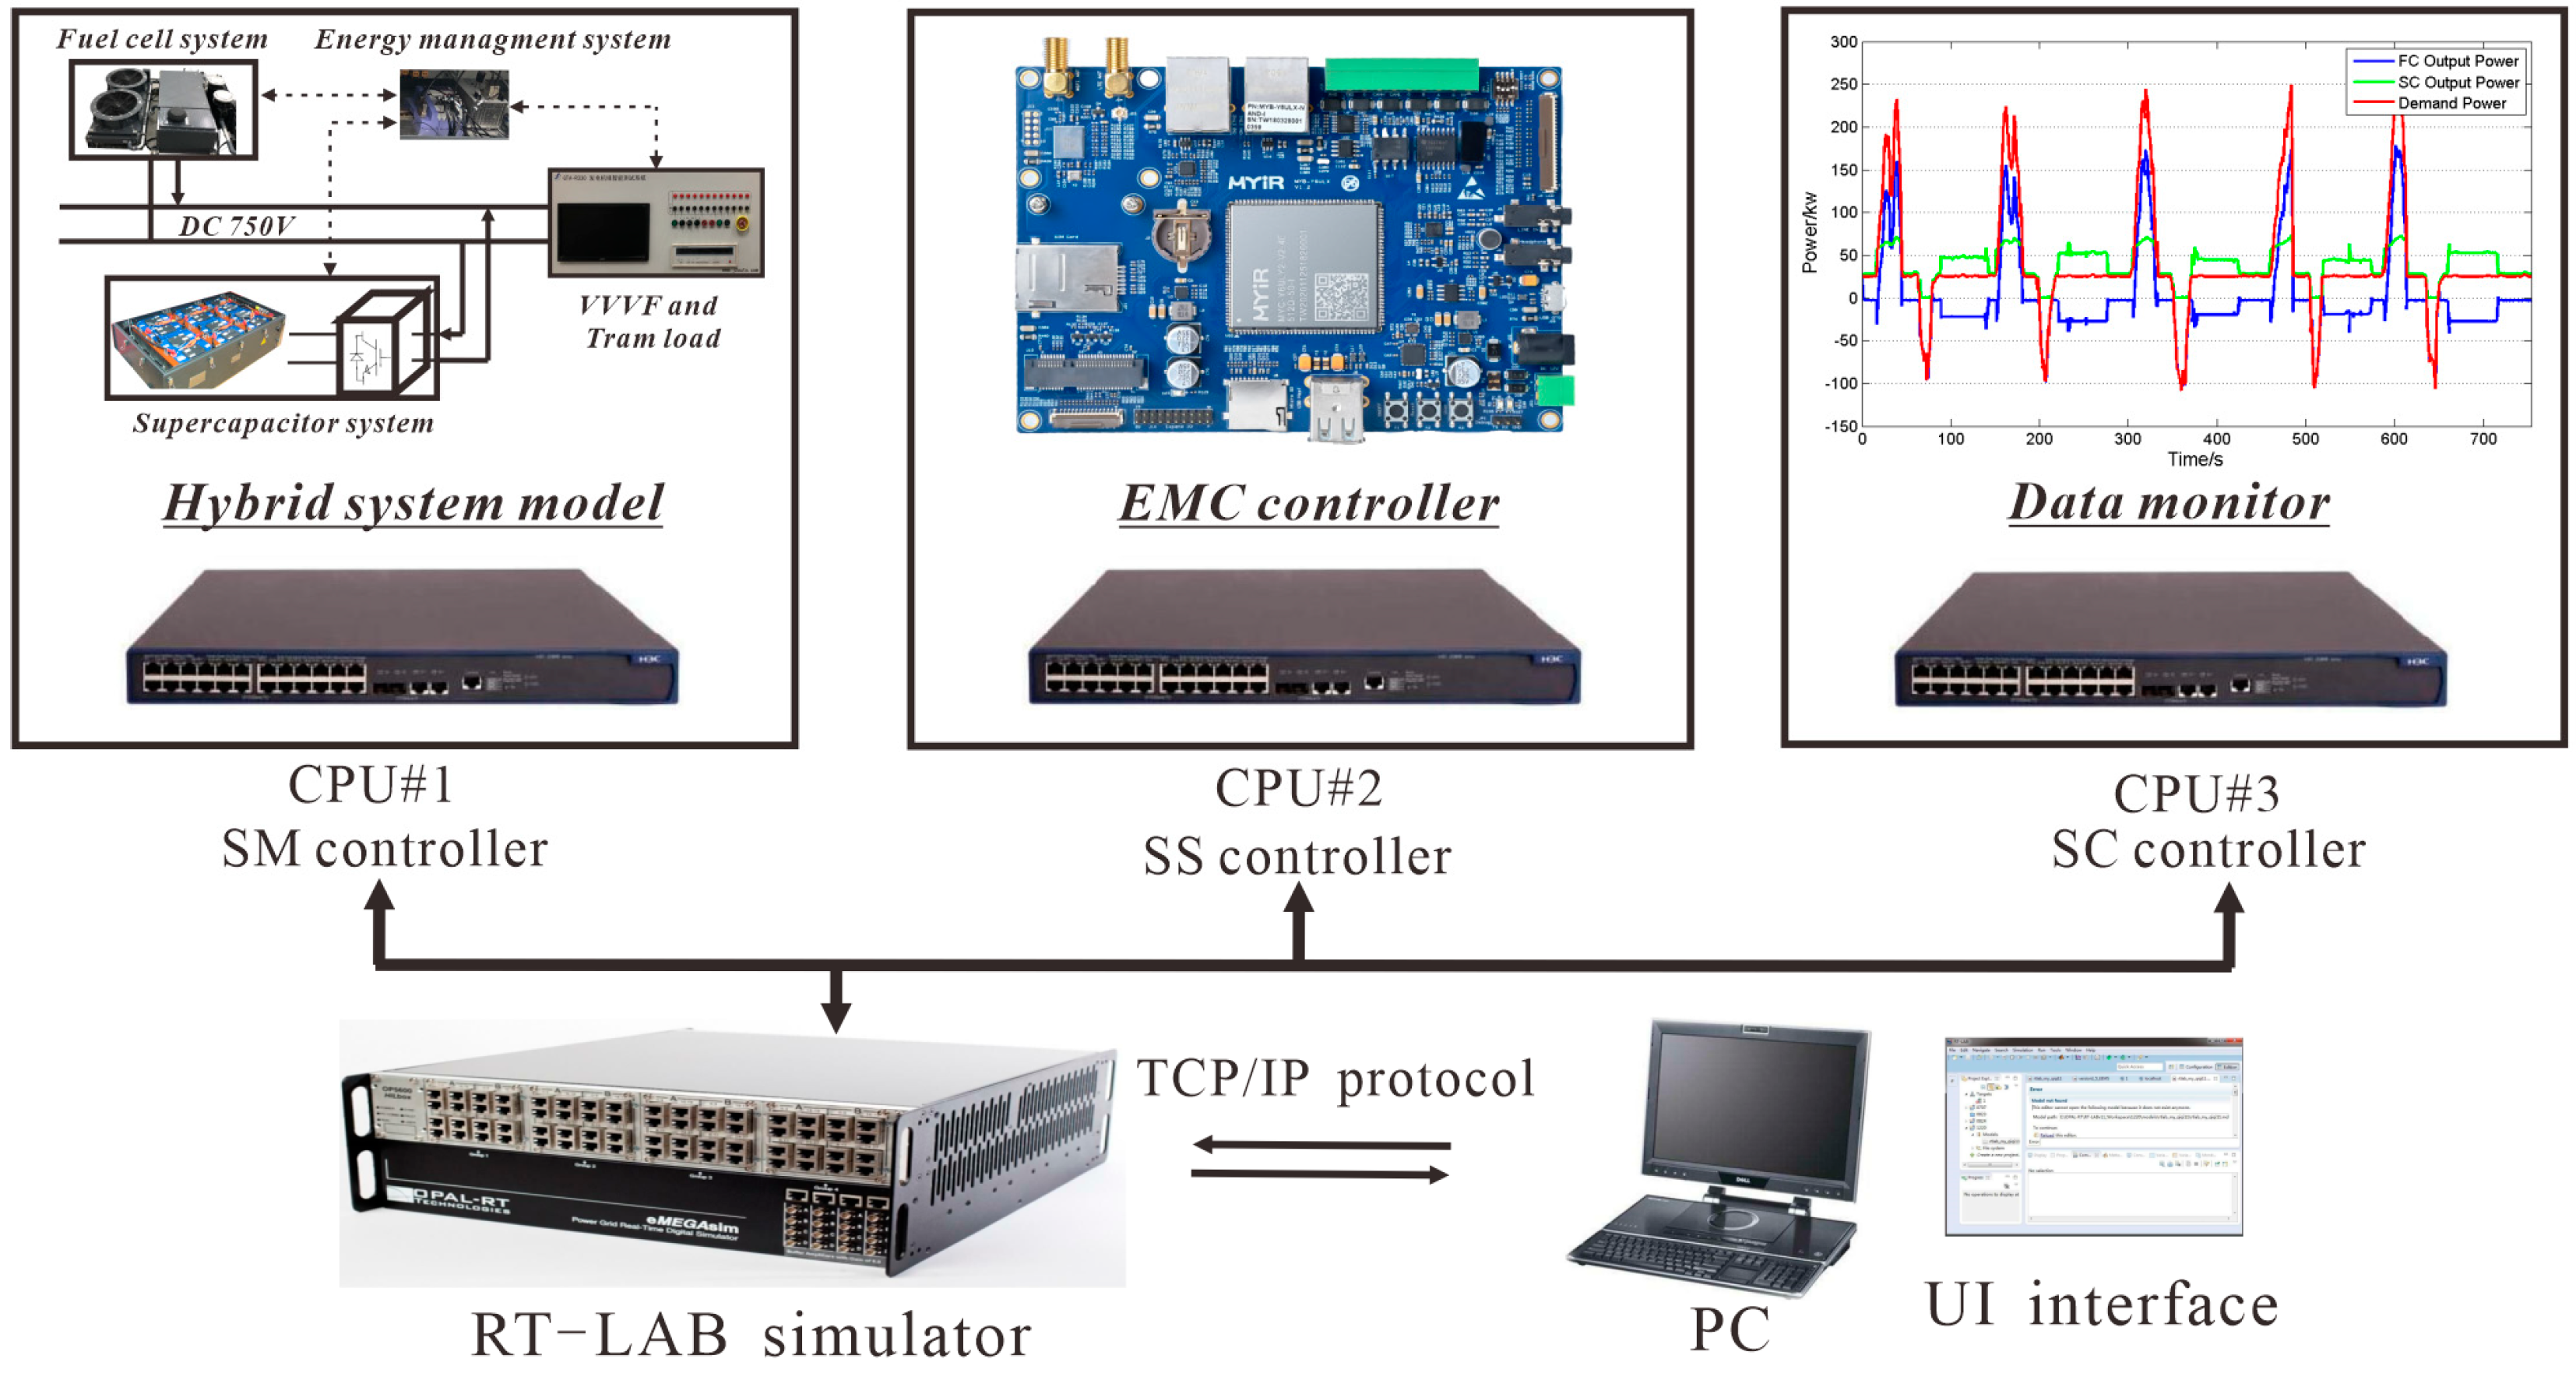
In order to verify the controllability of this method, the RTLAB hardware-in-the-loop simulation platform was used to make a simulation experiment with the combination of the actual operating data of trams. The structure of the RTLAB simulation platform is shown in Figure 11.
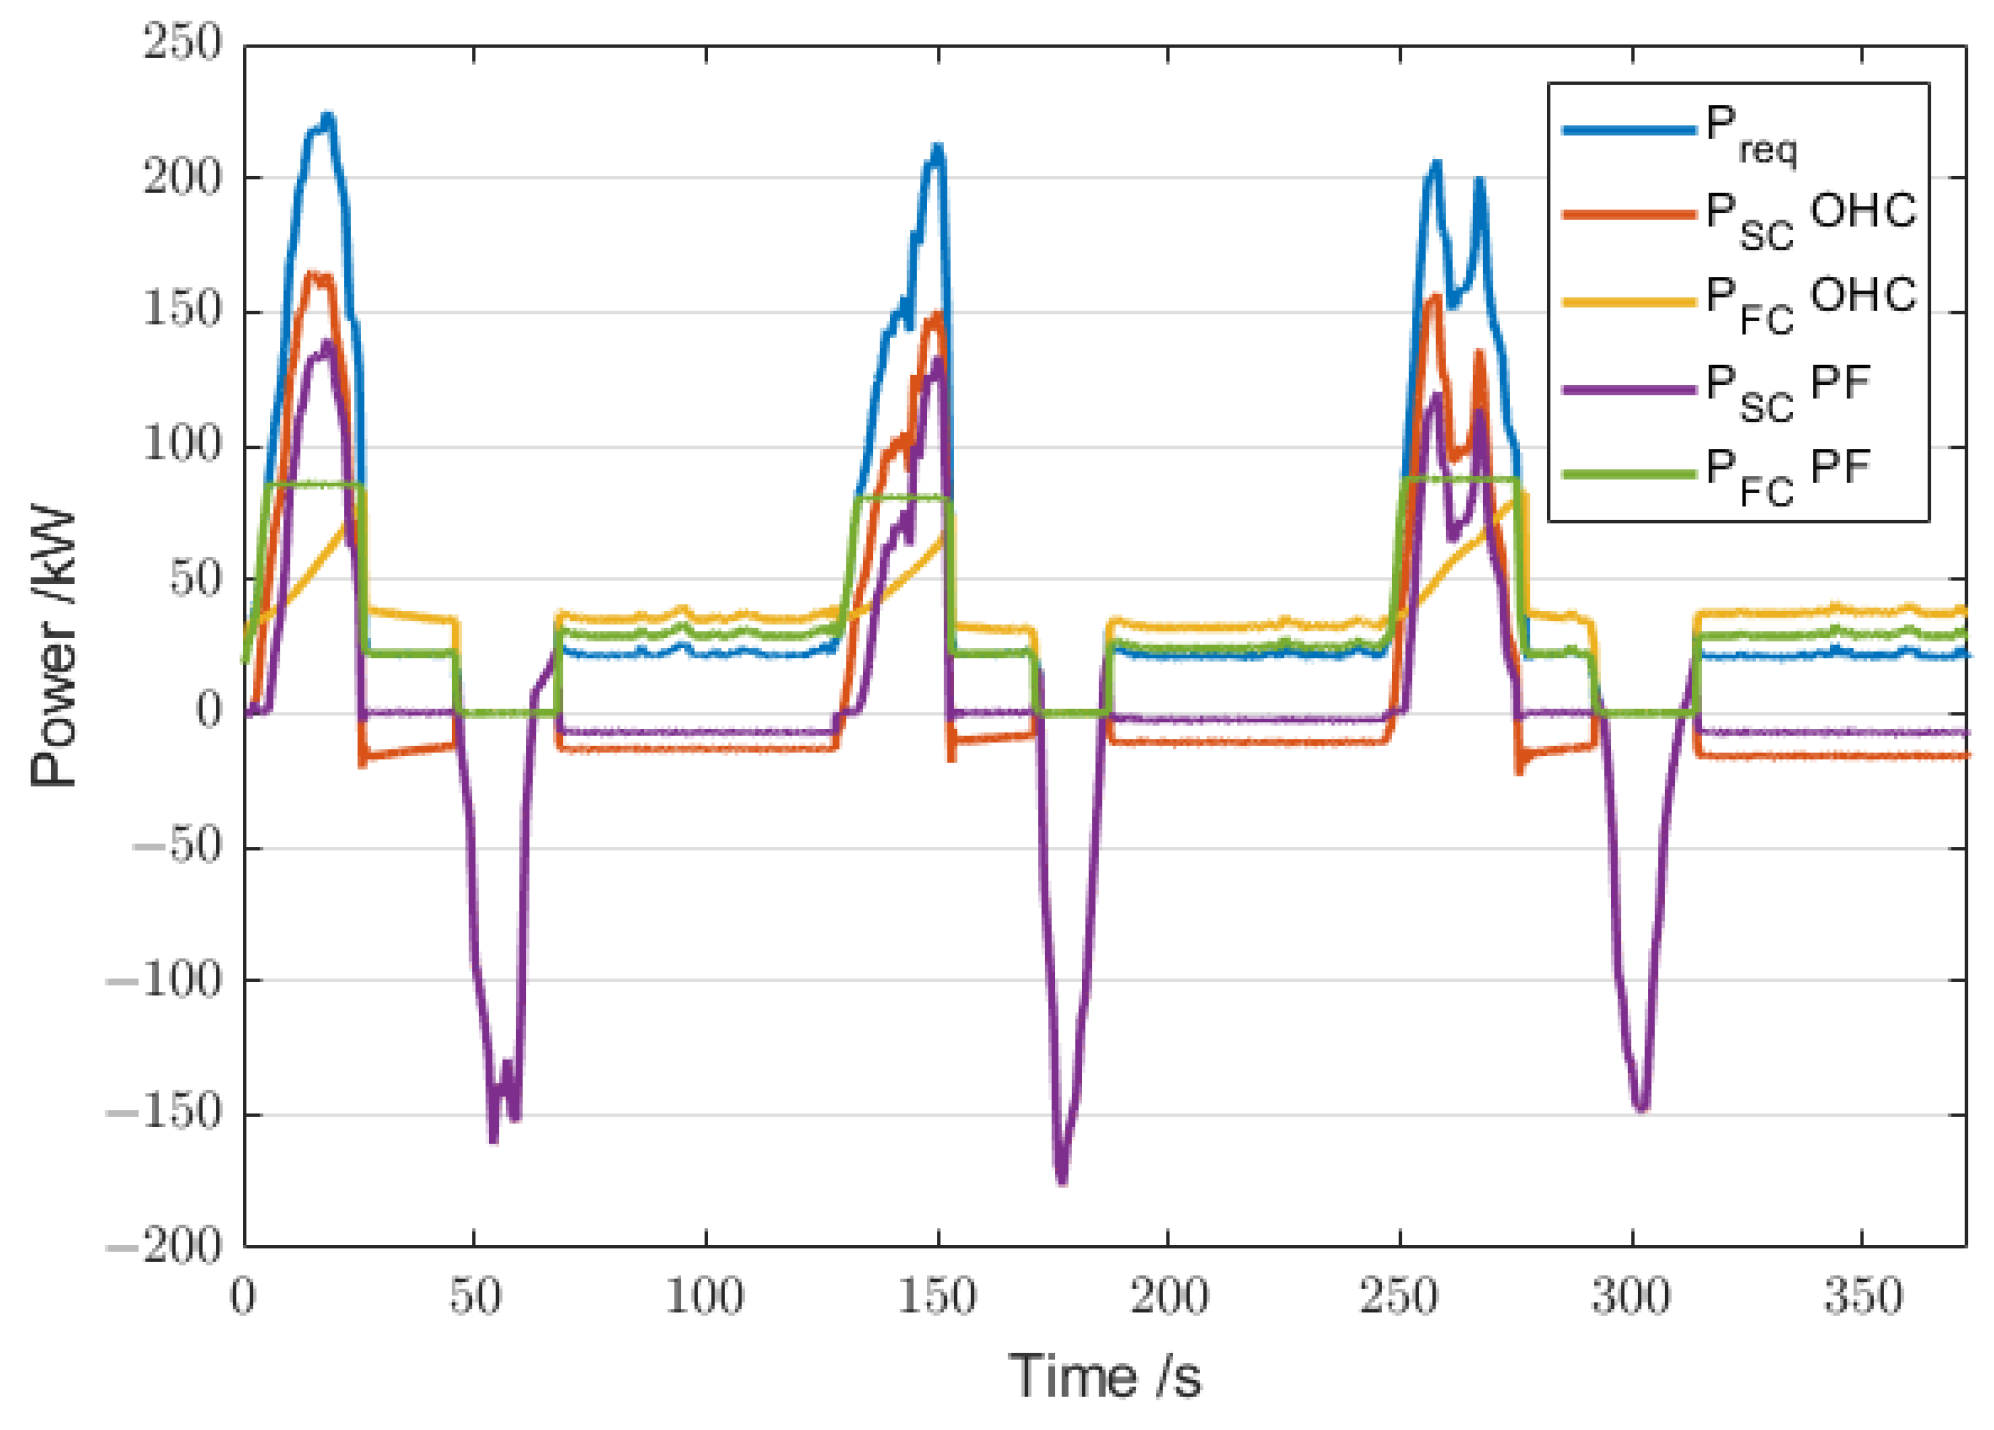
The power-following (PF) method is compared with the proposed method. After verification, the optimal hydrogen consumption method (OHC) can be effectively applied to online control. The RT-LAB simulation results are shown in Figure 12.
In Figure 12, in terms of output smoothness of the fuel cell system, the optimal hydrogen consumption method does not fluctuate greatly with the fluctuation of demand power, and only a brief power peak will occur when the voltage of the supercapacitor is low.
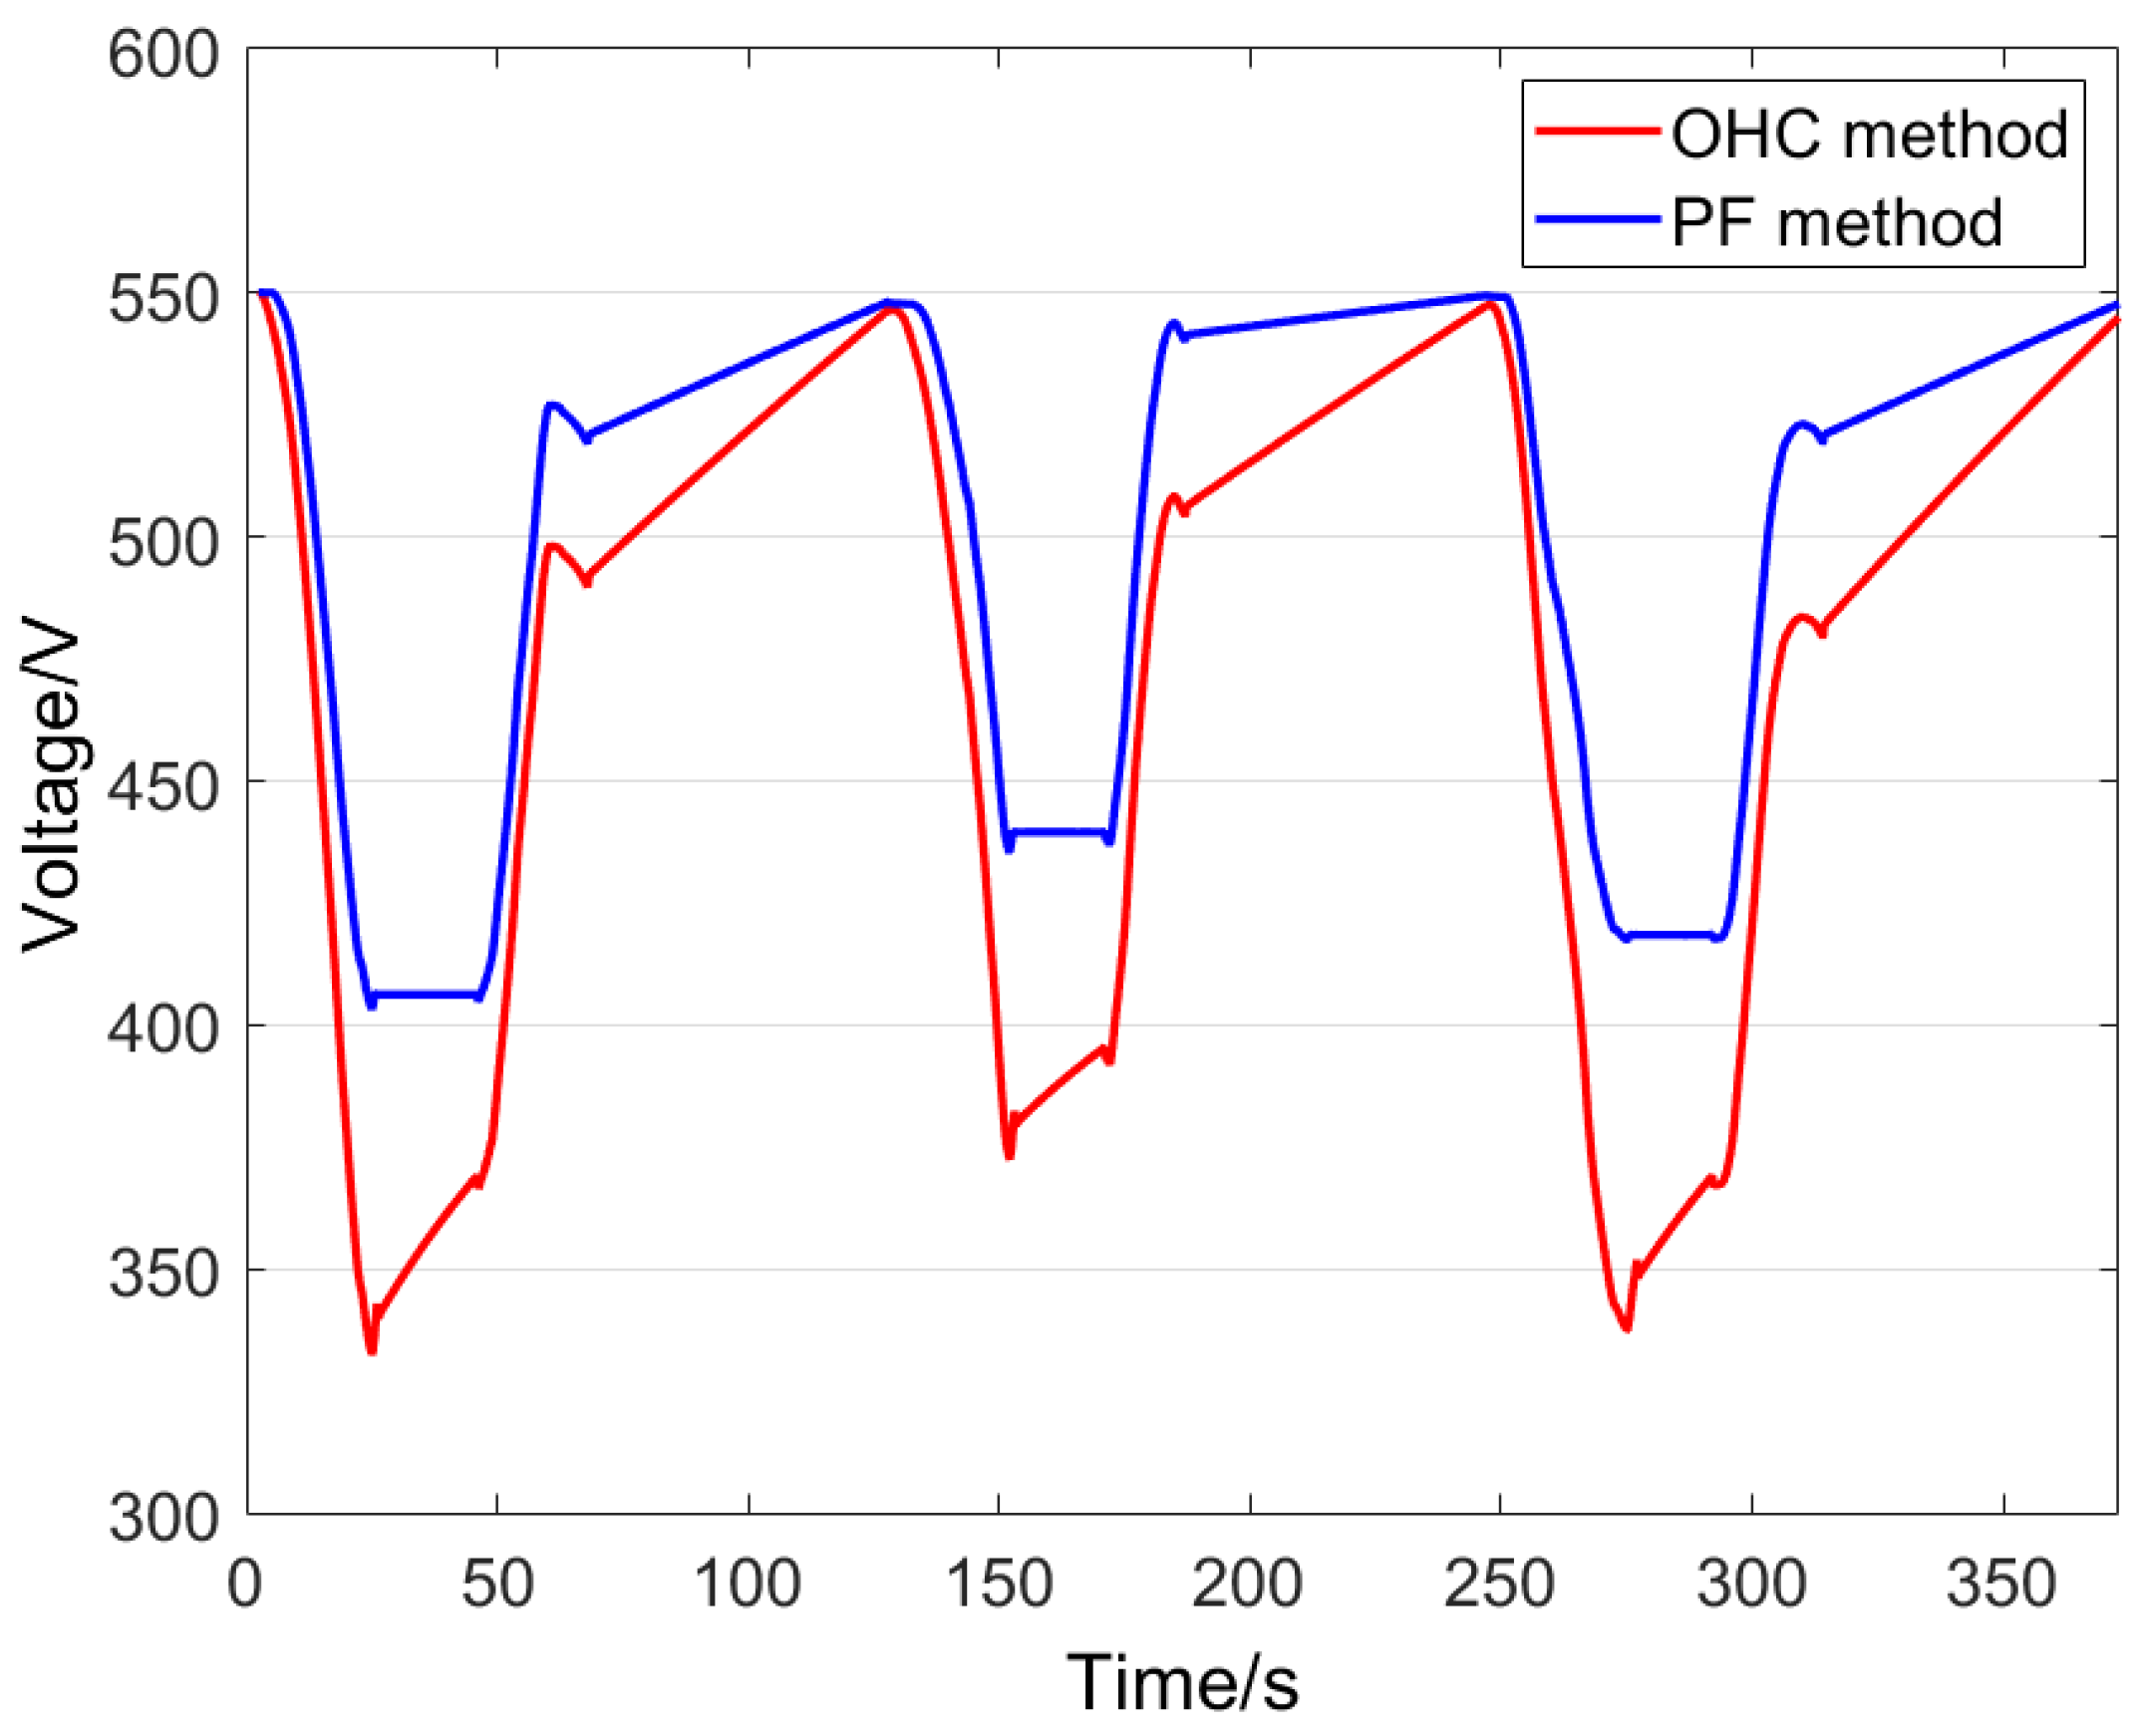
Considering the life cycle of FCS, the maximum net power is set as 90 kW in the PF method. As shown in Figure 12, the PF method has a significant step at the beginning and end states of the acceleration stage, and the FCS is almost under a large output power point in the acceleration stage. The voltage fluctuations in the supercapacitor under two methods are as follows.
In Figure 13, both methods can ensure that the beginning-state voltage and the end-state voltage are almost the same in each operating cycle. Therefore, both of them are conducive to the continued operation of trams. The hydrogen consumption in these operating cycles are as follows.
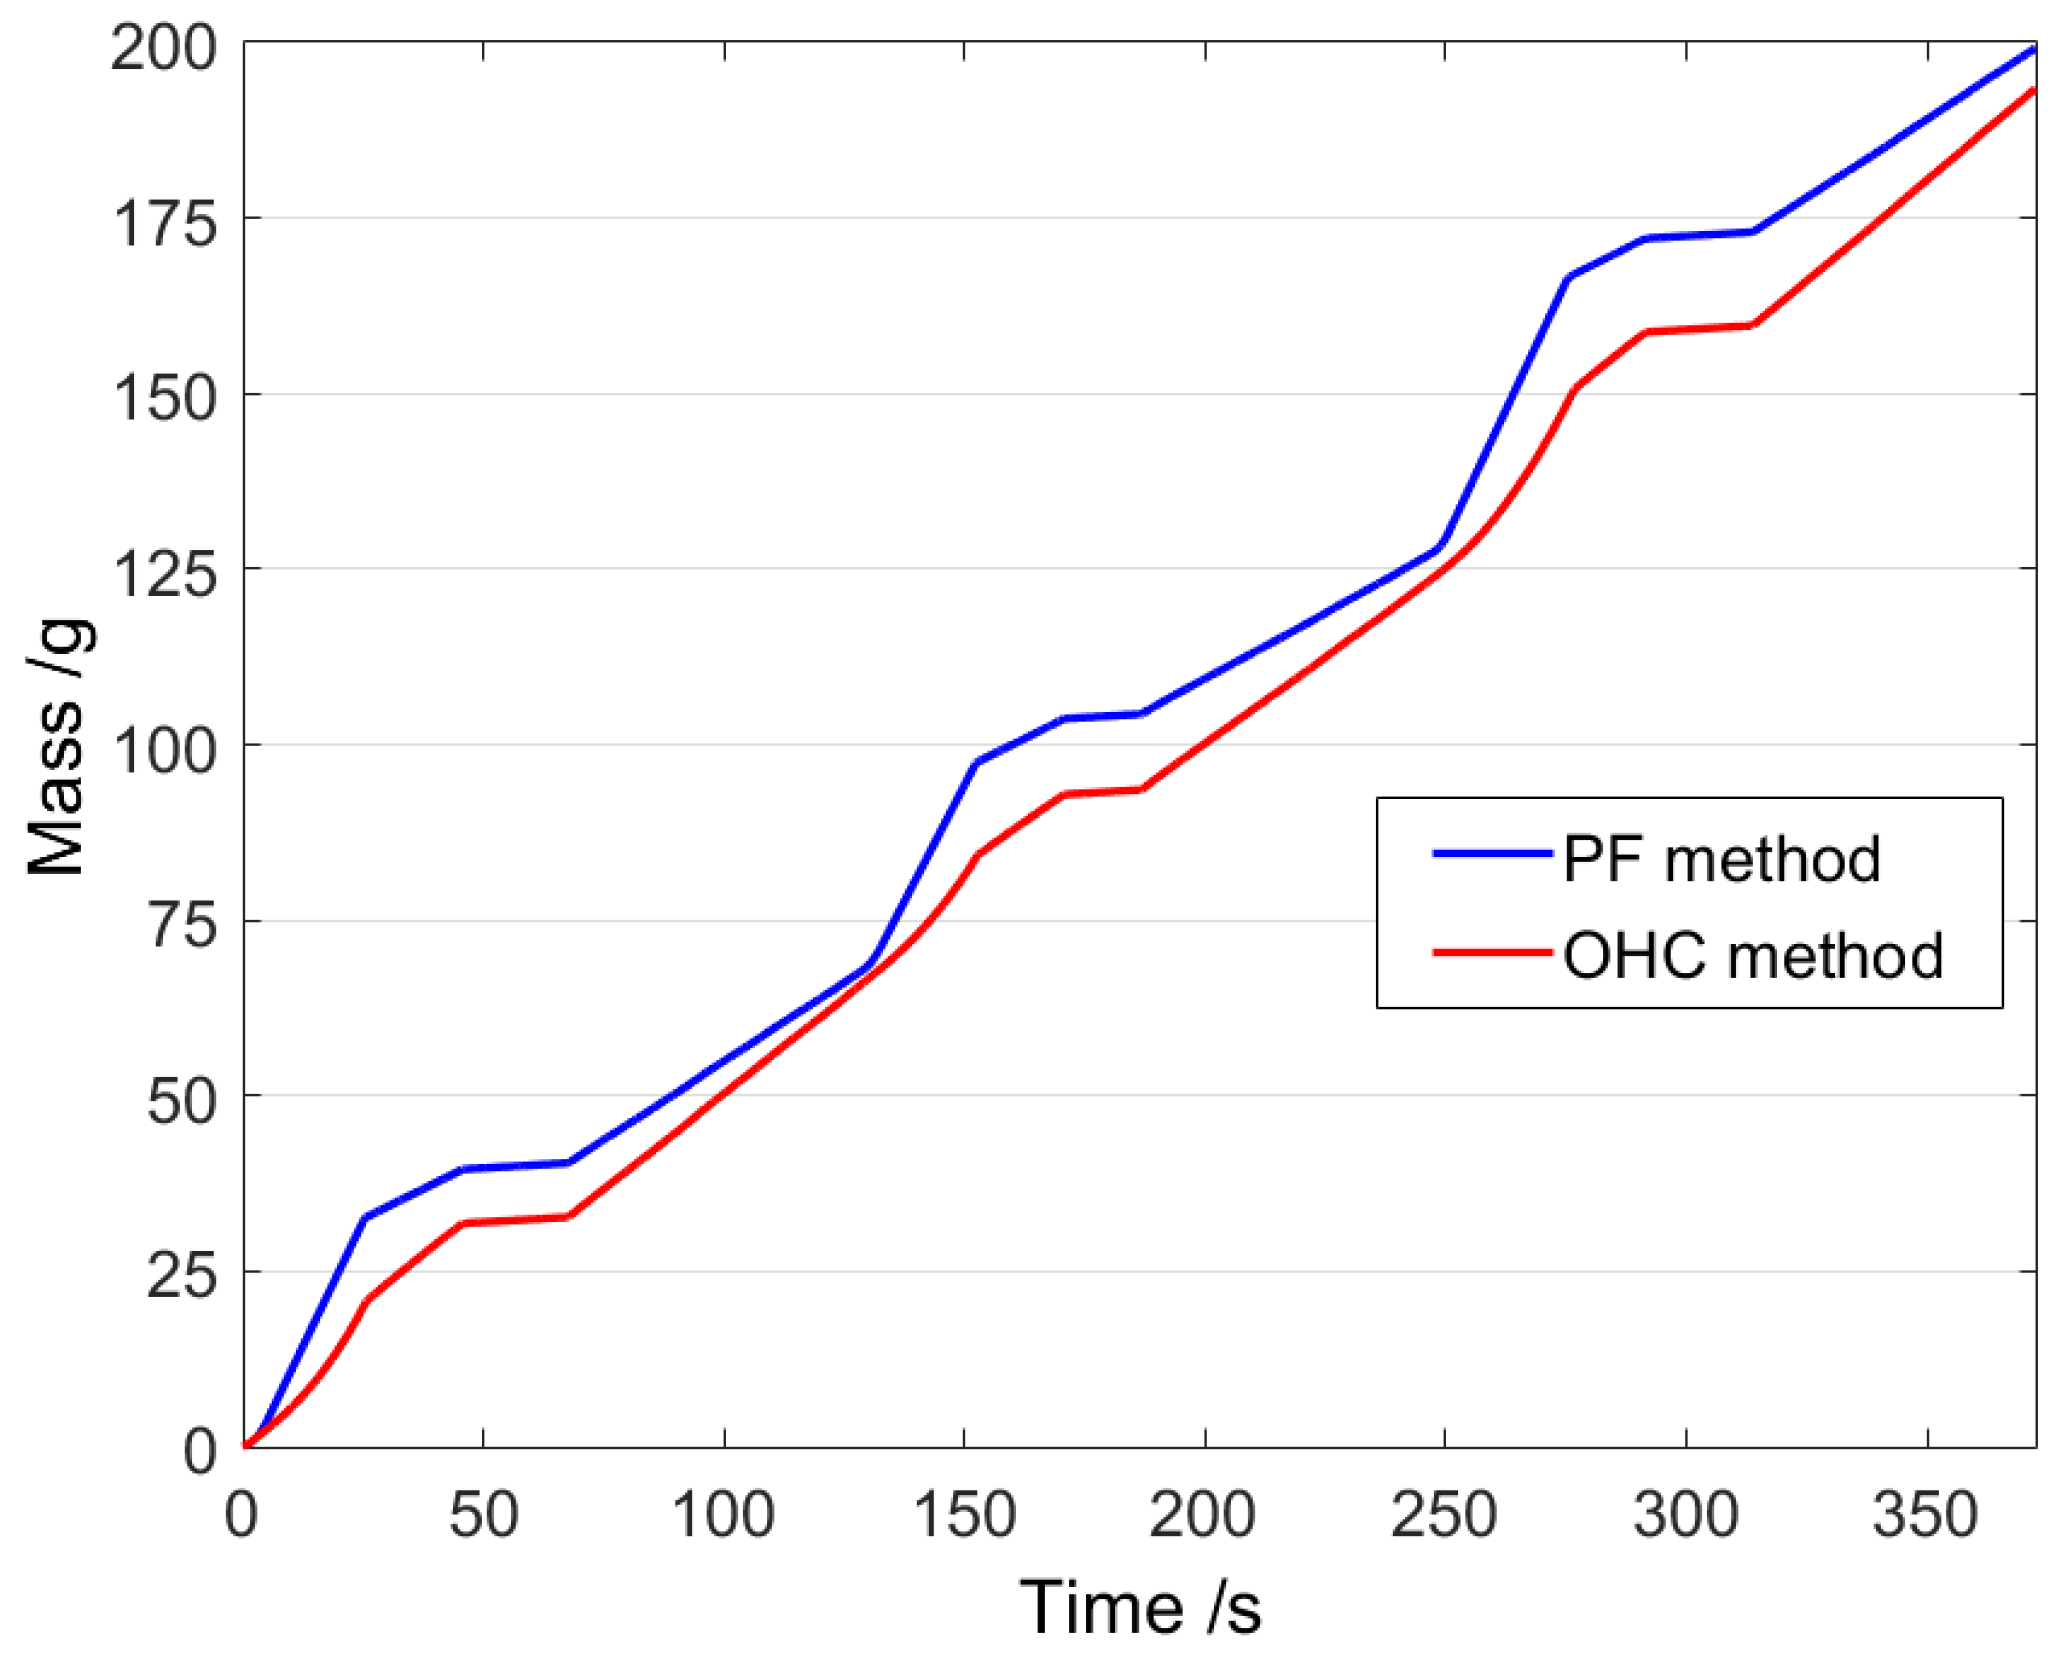
The Figure 14 shows the simulation results of hydrogen consumption under different methods. In terms of hydrogen consumption, the optimal hydrogen consumption method is better than the power-following method in each operating cycle. From the simulation results, the optimal hydrogen consumption method runs continuously over three cycles, with a total cumulative consumption of 193.404 g, while the power-following method consumes 199.162 g.

4.2. Experiment for Prototype Tram

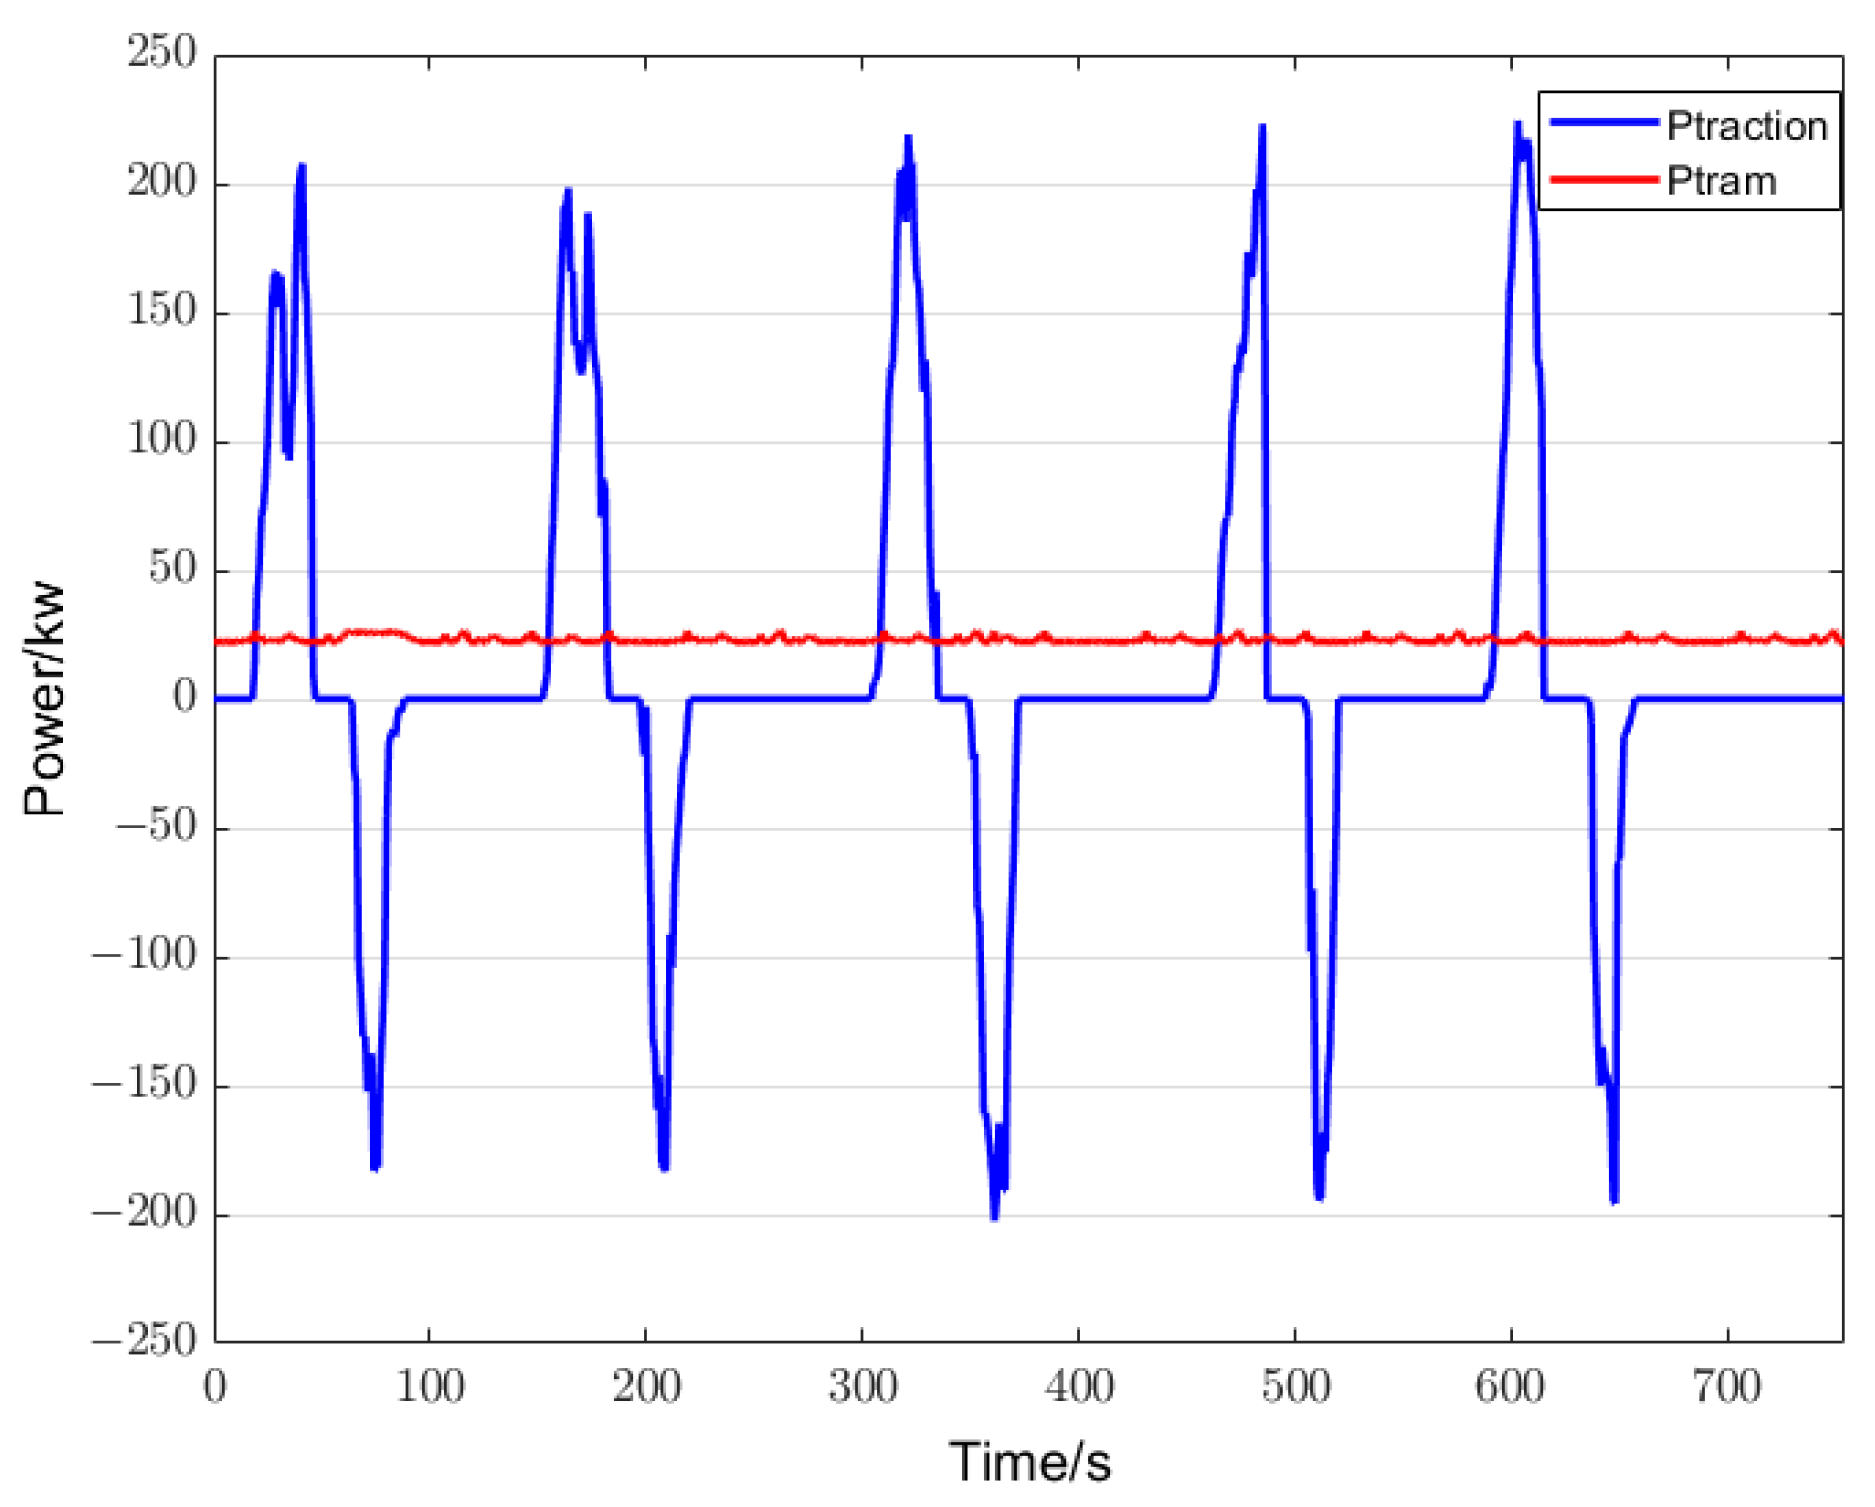
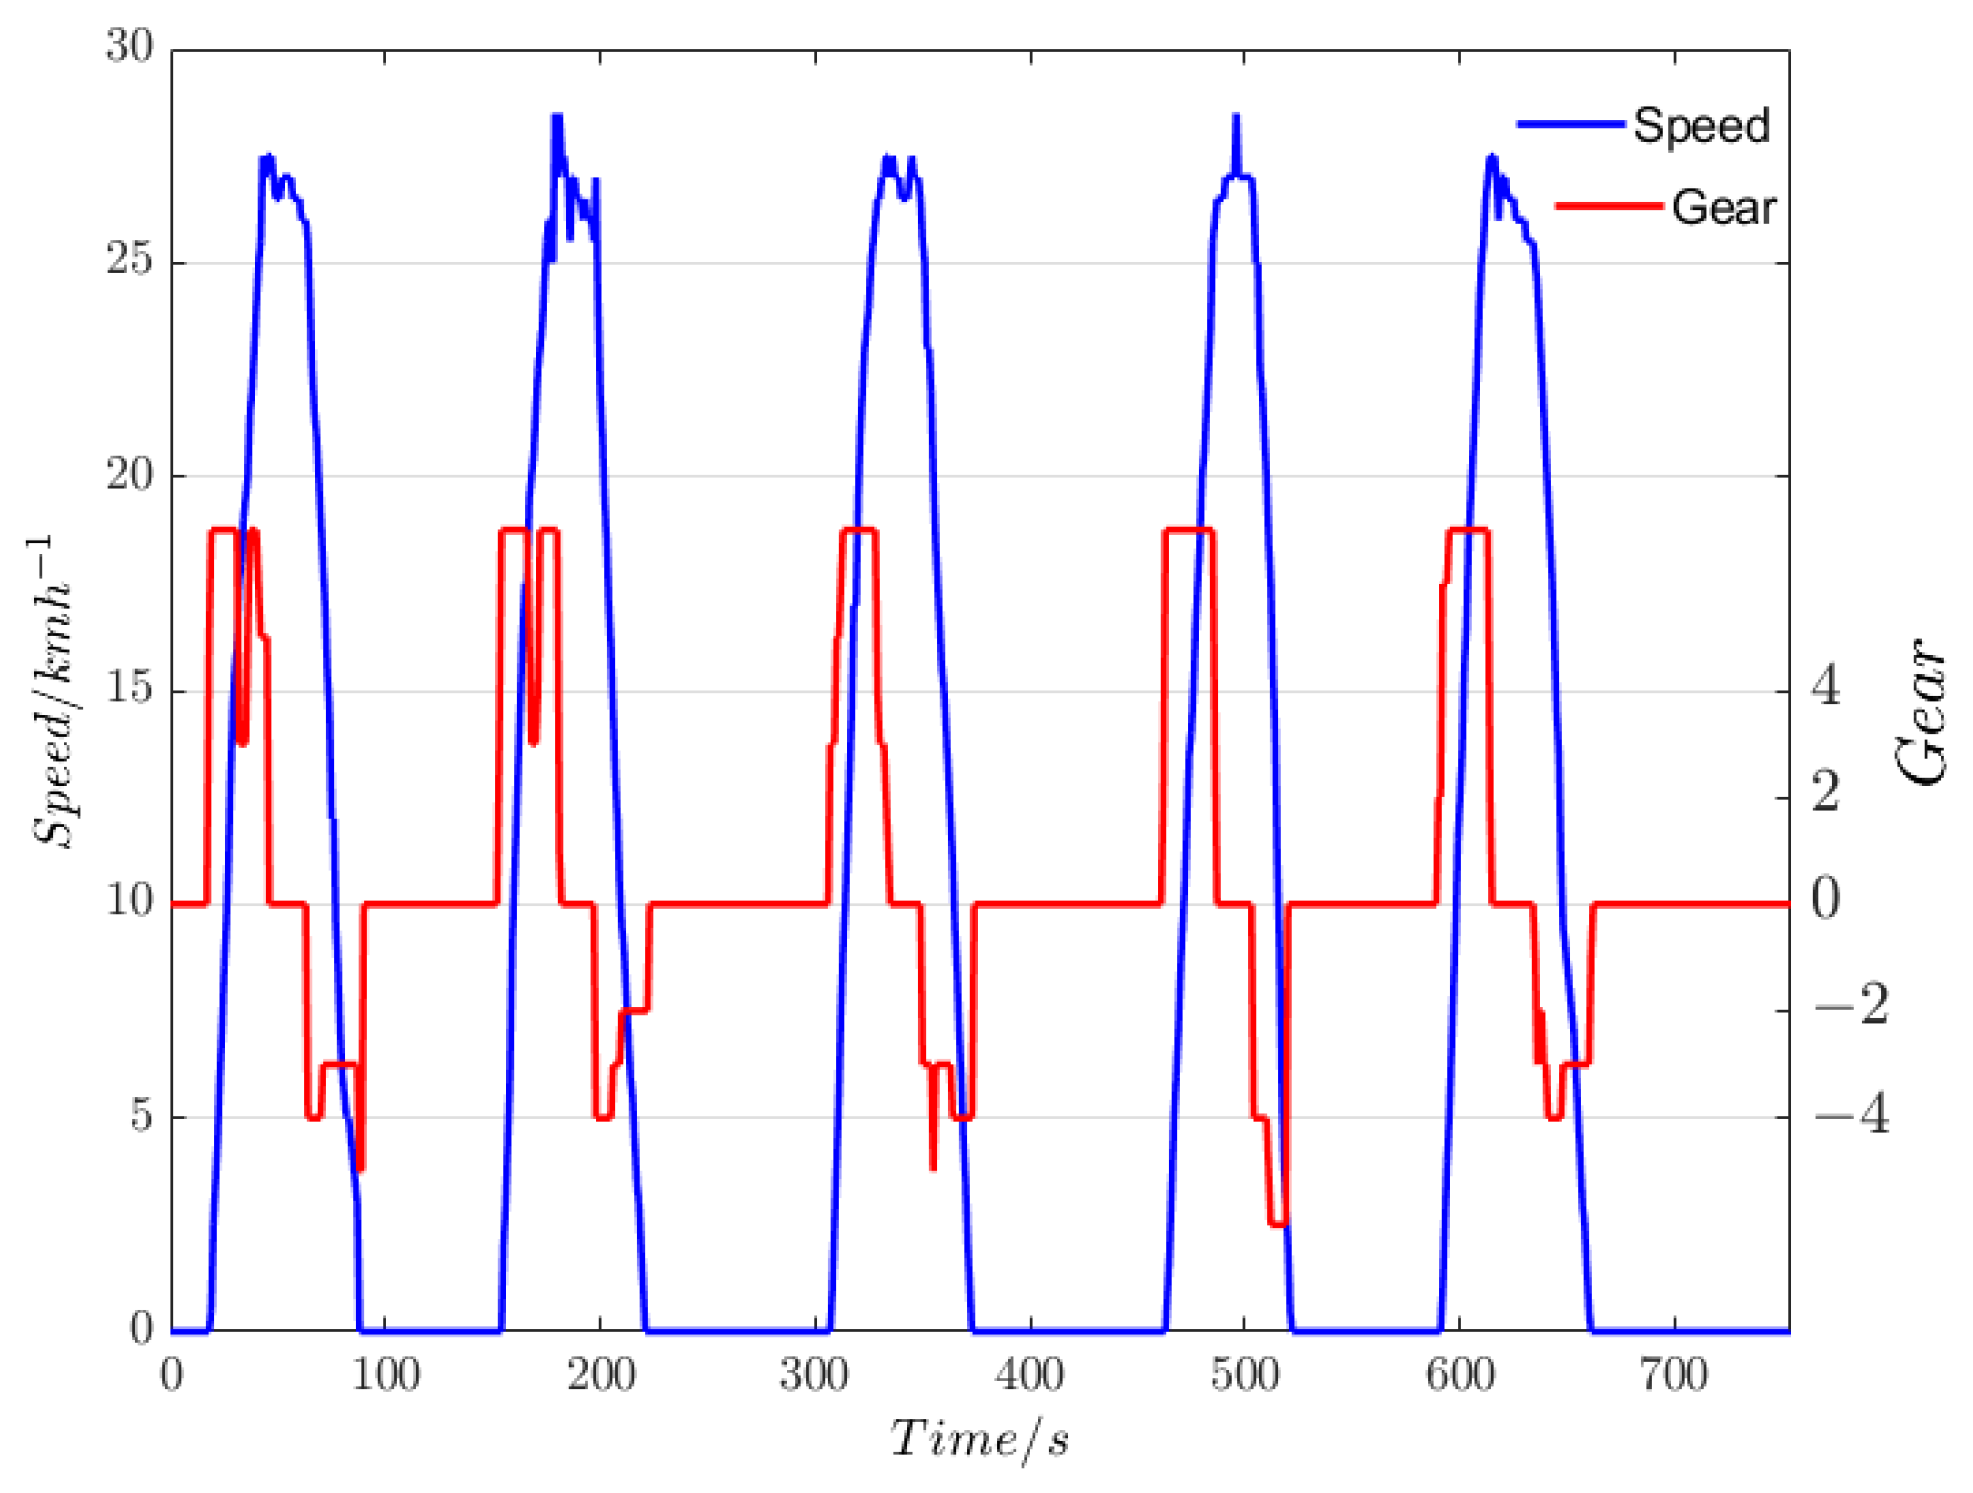
In order to verify the actual effect of the proposed method, this paper also finishes the experiment on the prototype tram. Figure 15 and Figure 16 show the demand power, speed, and gear signals in tram operating conditions. Figure 17 shows the actual tram test results of the optimal hydrogen consumption method.
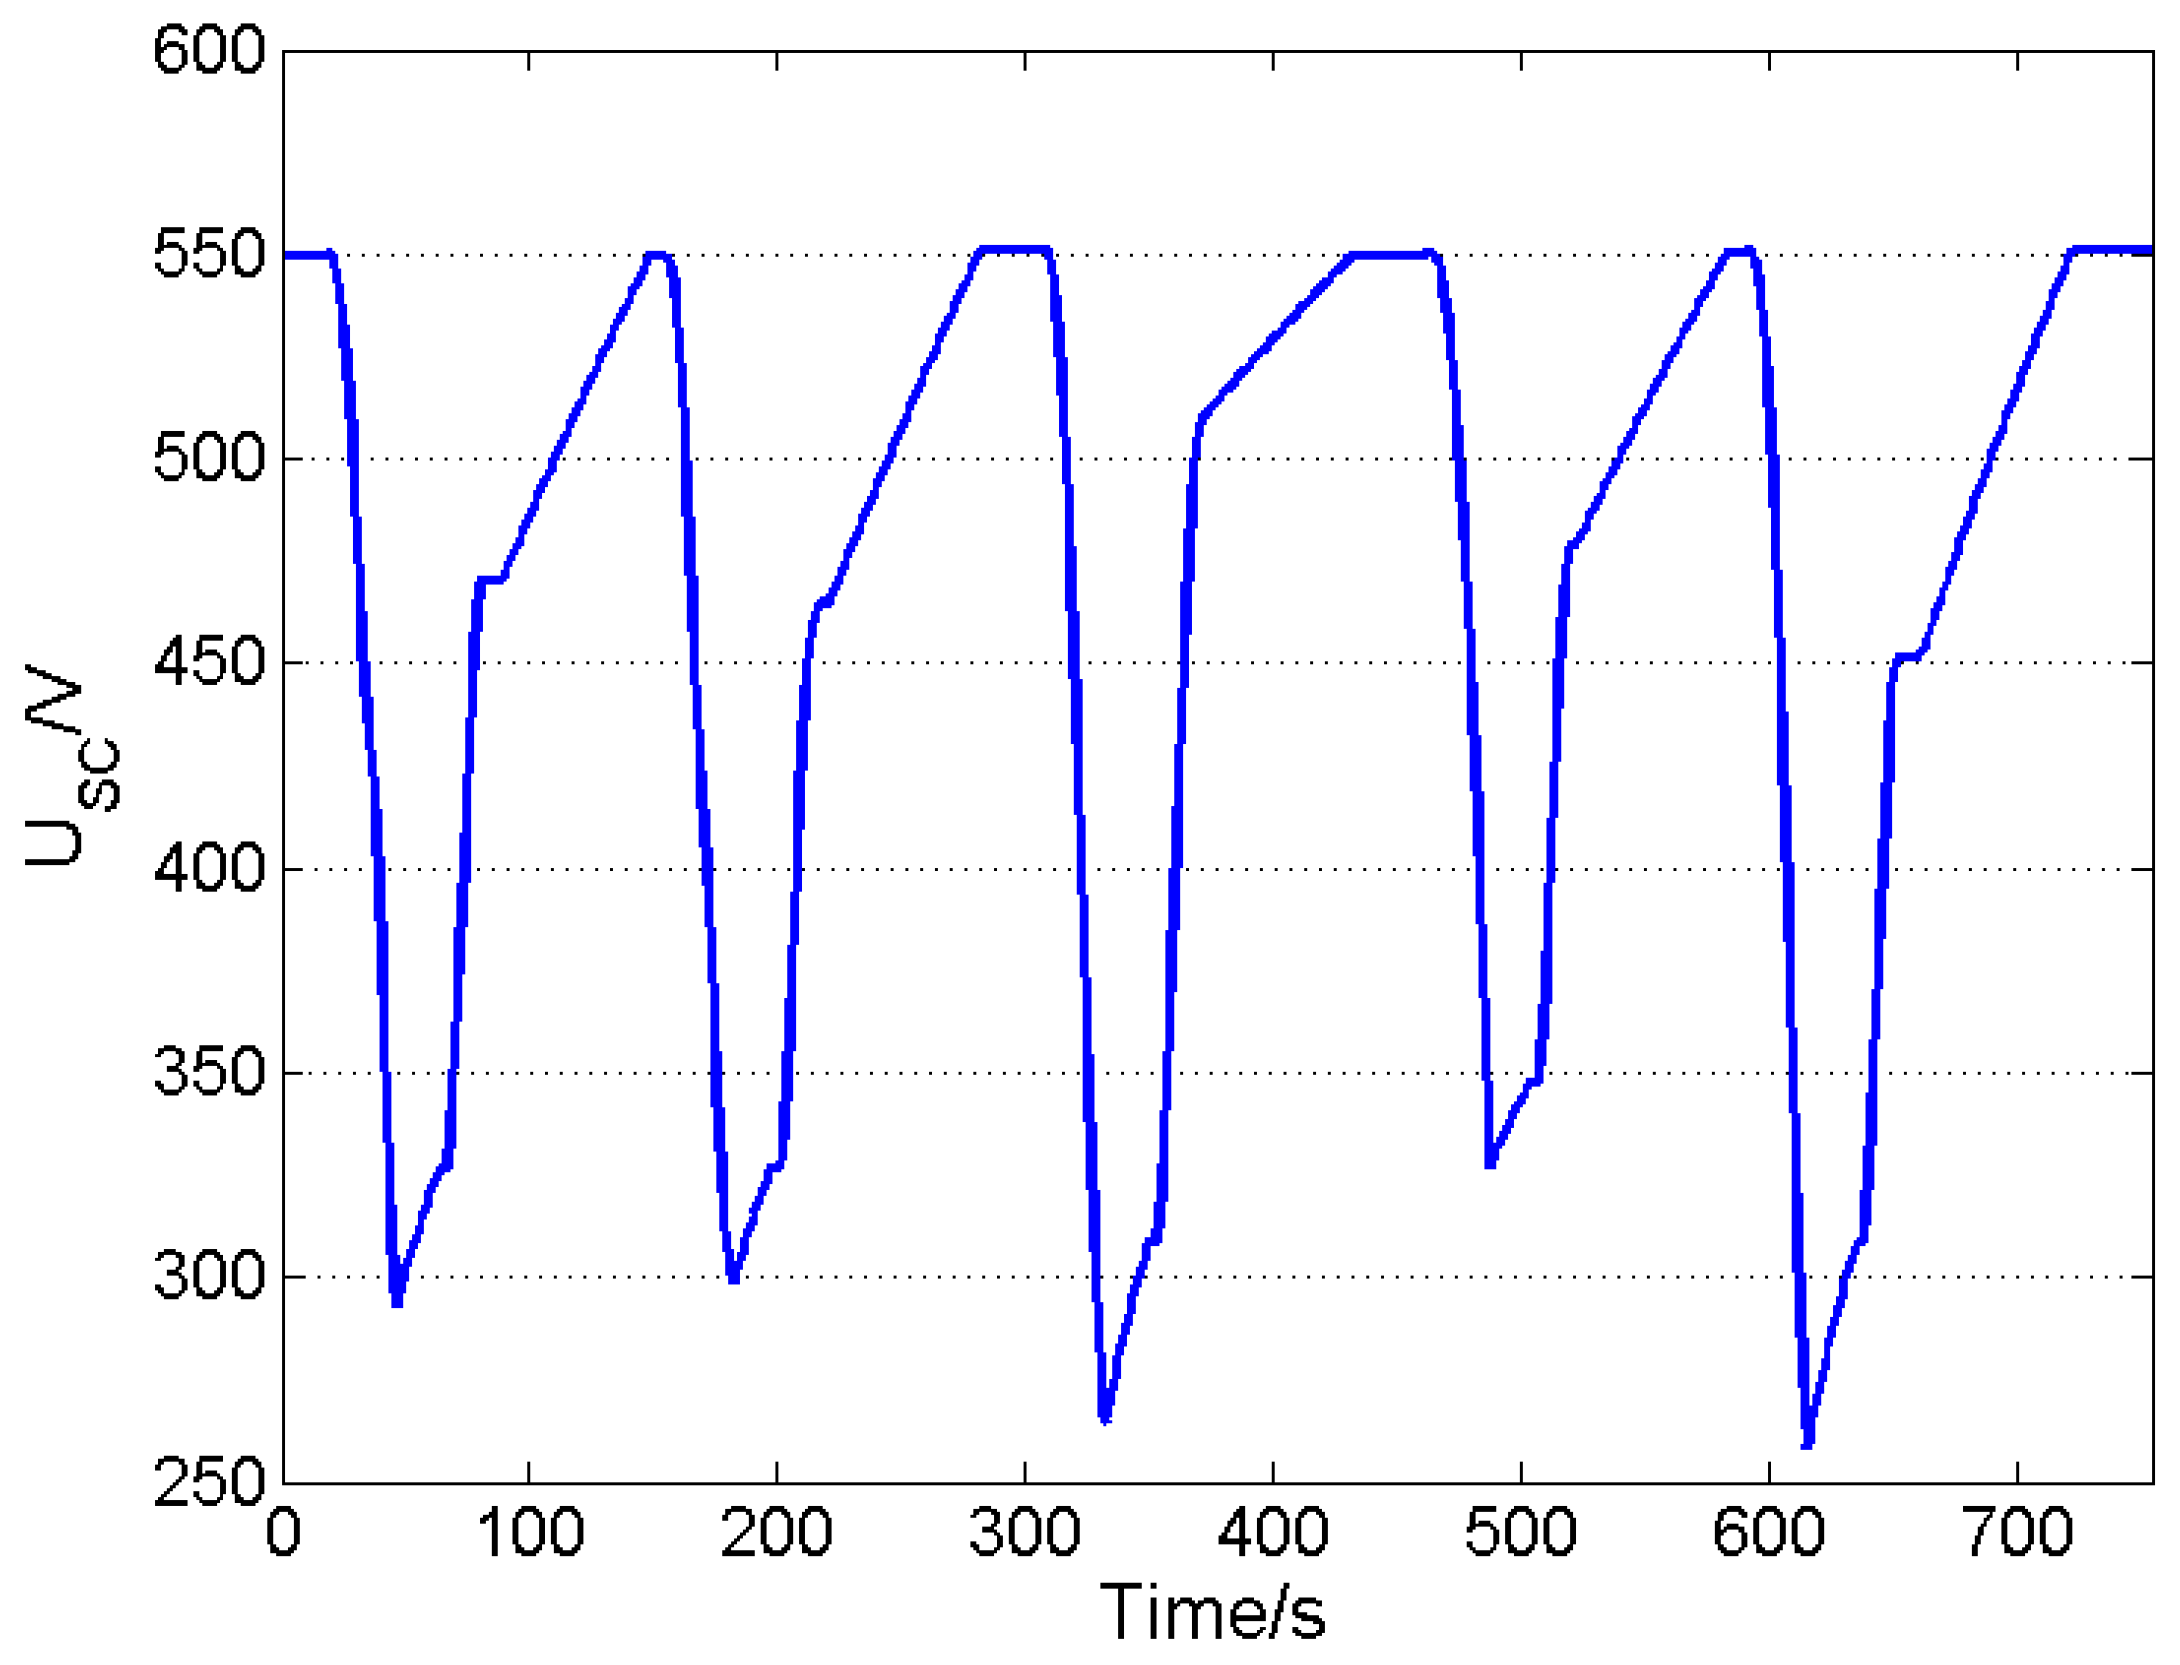
The voltage fluctuations in the supercapacitors and the hydrogen inlet flow ratio of the fuel cell system are shown in Figure 18 and Figure 19:
Compared with the RTLAB simulation results, the hydrogen consumption in the low power range is significantly higher than the simulation results. This is because after the fuel cell system has been continuously operated for a period of time, with the increase in the temperature of the fuel cell system, the consumption of the cooling system increases. Due to the randomness in the driving process, it is impossible for the tram to obtain two identical operating conditions during operation. Therefore, when testing the power-following method, only the road conditions and the maximum speed of the two tests can be ensured. After five entire operation cycles, the overall H2 consumption are given in Table 6.
In Table 6, compared with PF, the OHC method saves about 4.73% hydrogen. Therefore, the optimal hydrogen consumption method can effectively save the operating cost of trams.

5. Conclusions

This paper proposes an optimal hydrogen consumption method for fuel cell/supercapacitor hybrid trams based on the characteristics of full-cycle operation of trams. This method can save operating costs effectively in the entire operation cycle. In the traction state, the real-time loss function of the hybrid power system is constructed, and the off-line solution method is used to solve the optimal energy distribution method of the hybrid system under different demand powers and supercapacitor voltages. Furthermore, the real-time control effect of the off-line model of equivalent energy consumption is verified by the RTLAB hardware-in-the-loop simulation platform. The test results show that the off-line model obtained by fitting has a good control effect. In addition, with the actual experimental test on the prototype tram, compared with the PF method, the OHC method saves about 4.73% hydrogen, which indicates this method can reduce the operating costs of trams.
At present, the fuel cell/supercapacitor hybrid trams developed by the CRRC Puzhen Company (Nanjing, China) have passed all experimental verifications. Furthermore, the trams have also been put into operation in the Lingang New Area of Shanghai.

Author Contributions

Software, S.Z.; Validation, N.M.; Data curation, Q.L.; Writing—original draft, Q.B.; Funding acquisition, B.S. All authors have read and agreed to the published version of the manuscript.

Funding

This study was supported by the National Natural Science Foundation of China (Grant No.52206228) and Beijing Institute of Technology Research Fund Program for Young Scholars (22050205-XSQD-202103007).

Institutional Review Board Statement

Not applicable.

Informed Consent Statement

Not applicable.

Data Availability Statement

Not applicable.

Conflicts of Interest

The authors declare no conflict of interest.

References

  1. Erdinc, O.; Uzunoglu, M. Recent trends in PEM fuel cell-powered hybrid systems: Investigation of application areas, design architectures and energy management approaches. Renew. Sustain. Energy Rev. 2010, 14, 2874–2884. [Google Scholar]
  2. Xie, C.; Ogden, J.M.; Quan, S.; Chen, Q. Optimal power management for fuel cell-battery full hybrid powertrain on a test station. Int. J. Electr. Power Energy Syst. 2013, 53, 307–320. [Google Scholar] [CrossRef]
  3. Li, Q.; Chen, W.; Liu, Z.; Li, M.; Ma, L. Development of energy management system based on a power sharing strategy for a fuel cell-battery-supercapacitor hybrid tramway. J. Power Sources 2015, 279, 267–280. [Google Scholar] [CrossRef]
  4. Liu, J.; Gao, Y.; Su, X.; Wack, M.; Wu, L. Disturbance-Observer-Based Control for Air Management of PEM Fuel Cell Systems via Sliding Mode Technique. IEEE Trans. Control. Syst. Technol. 2018, 27, 1129–1138. [Google Scholar] [CrossRef]
  5. Li, X.; Deng, Z.-H.; Wei, D.; Xu, C.-S.; Cao, G.-Y. Parameter optimization of thermal-model-oriented control law for PEM fuel cell stack via novel genetic algorithm. Energy Convers. Manag. 2011, 52, 3290–3300. [Google Scholar]
  6. Zhou, D.; Al-Durra, A.; Gao, F.; Ravey, A.; Matraji, I.; Simões, M.G. Online energy management strategy of fuel cell hybrid electric vehicles based on data fusion approach. J. Power Sources 2017, 366, 278–291. [Google Scholar] [CrossRef]
  7. Gao, F.; Blunier, B.; Miraoui, A. PEM Fuel Cell Stack Modeling for Real-Time Emulation in Hardware-in-the-Loop Applications. IEEE Trans. Energy Convers. 2011, 26, 184–194. [Google Scholar]
  8. Hong, L.; Chen, J.; Liu, Z.; Huang, L.; Wu, Z. A nonlinear control strategy for fuel delivery in PEM fuel cells considering nitrogen permeation. Int. J. Hydrogen Energy 2016, 42, 1565–1576. [Google Scholar] [CrossRef]
  9. Liu, J.; Laghrouche, S.; Ahmed, F.-S.; Wack, M. PEM fuel cell air-feed system observer design for automotive applications: An adaptive numerical differentiation approach. Int. J. Hydrogen Energy 2014, 39, 17210–17221. [Google Scholar] [CrossRef]
  10. Li, Q.; Wang, T.; Dai, C.; Chen, W.; Ma, L. Power Management Strategy based on Adaptive Droop Control for a Fuel Cell-Battery-Supercapacitor Hybrid Tramway. IEEE Trans. Veh. Technol. 2017, 67, 5658–5670. [Google Scholar] [CrossRef]
  11. Eren, Y.; Erdinc, O.; Gorgun, H.; Uzunoglu, M.; Vural, B. A fuzzy logic based supervisory controller for an FC/UC hybrid vehicular power system. Int. J. Hydrogen Energy 2009, 34, 8681–8694. [Google Scholar] [CrossRef]
  12. Han, Y.; Li, Q.; Wang, T.; Chen, W.; Ma, L. Multi-source Coordination Energy Management Strategy based on SOC consensus for a PEMFC-Battery-Supercapacitor Hybrid Tramway. IEEE Trans. Veh. Technol. 2018, 67, 296–305. [Google Scholar] [CrossRef]
  13. Cao, L.; Loo, K.H.; Lai, Y.M. Systematic Derivation of a Family of Output-Impedance Shaping Methods for Power Converters—A Case Study Using Fuel Cell-Battery-Powered Single-Phase Inverter System. IEEE Trans. Power Electron. 2015, 30, 5854–5869. [Google Scholar] [CrossRef]
  14. Li, Q.; Yang, H.; Han, Y.; Li, M.; Chen, W. A state machine strategy based on droop control for an energy management system of PEMFC-battery-supercapacitor hybrid tramway. Int. J. Hydrogen Energy 2016, 41, 16148–16159. [Google Scholar] [CrossRef]
  15. Xie, C.; Xu, X.; Bujlo, P.; Shen, D.; Zhao, H.; Quan, S. Fuel cell and lithium iron phosphate battery hybrid powertrain with an ultracapacitor bank using direct parallel structure. J. Power Sources 2015, 279, 487–494. [Google Scholar]
  16. Fernandez, L.M.; Garcia, P.; Garcia, C.A.; Jurado, F. Hybrid electric system based on fuel cell and battery and integrating a single dc/dc converter for a tramway. Energy Convers. Manag. 2011, 52, 2183–2192. [Google Scholar] [CrossRef]
  17. Russo, A.; Cavallo, A. Supercapacitor stability and control for More Electric Aircraft application. In Proceedings of the 2020 European Control Conference (ECC), St. Petersburg, Russia, 12–15 May 2020; pp. 1909–1914. [Google Scholar]
  18. Pour, G.B.; Ashourifar, H.; Aval, L.F.; Solaymani, S. CNTs-Supercapacitors: A Review of Electrode Nanocomposites Based on CNTs, Graphene, Metals, and Polymers. Symmetry 2023, 15, 1179. [Google Scholar]
  19. Andari, W.; Samir, G.; Hatem, A.; Abdelkader, M. Design, Modeling and Energy Management of a PEM Fuel Cell/Supercapacitor Hybrid Vehicle. Int. J. Adv. Comput. Sci. Appl. 2017, 8, 273–278. [Google Scholar] [CrossRef] [Green Version]
  20. Feroldi, D.; Serra, M.; Riera, J. Energy Management Strategies based on efficiency map for Fuel Cell Hybrid Vehicles. J. Power Sources 2009, 190, 387–401. [Google Scholar] [CrossRef] [Green Version]
  21. Rodatz, P.; Paganelli, G.; Sciarretta, A.; Guzzella, L. Optimal power management of an experimental fuel cell/supercapacitor-powered hybrid vehicle. Control. Eng. Pract. 2005, 13, 41–53. [Google Scholar] [CrossRef]
  22. García, P.; Torreglosa, J.; Fernández, L.; Jurado, F. Viability study of a FC-battery-SC tramway controlled by equivalent consumption minimization strategy. Int. J. Hydrogen Energy 2012, 37, 9368–9382. [Google Scholar] [CrossRef]
  23. García, P.; Torreglosa, J.P.; Fernández, L.M.; Jurado, F. Control strategies for high-power electric vehicles powered by hydrogen fuel cell, battery and supercapacitor. Expert Syst. Appl. 2013, 40, 4791–4804. [Google Scholar]
  24. Zhang, W.; Li, J.; Xu, L.; Ouyang, M. Optimization for a fuel cell/battery/capacity tram with equivalent consumption minimization strategy. Energy Convers. Manag. 2017, 134, 59–69. [Google Scholar]
  25. Zheng, J.; Zhang, X.; Xu, P.; Gu, C.; Wu, B.; Hou, Y. Standardized equation for hydrogen gas compressibility factor for fuel consumption applications. Int. J. Hydrogen Energy 2016, 41, 6610–6617. [Google Scholar] [CrossRef]
  26. Thounthong, P.; Pierfederici, S.; Martin, J.-P.; Hinaje, M.; Davat, B. Modeling and Control of Fuel Cell/Supercapacitor Hybrid Source Based on Differential Flatness Control. IEEE Trans. Veh. Technol. 2010, 59, 2700–2710. [Google Scholar] [CrossRef]
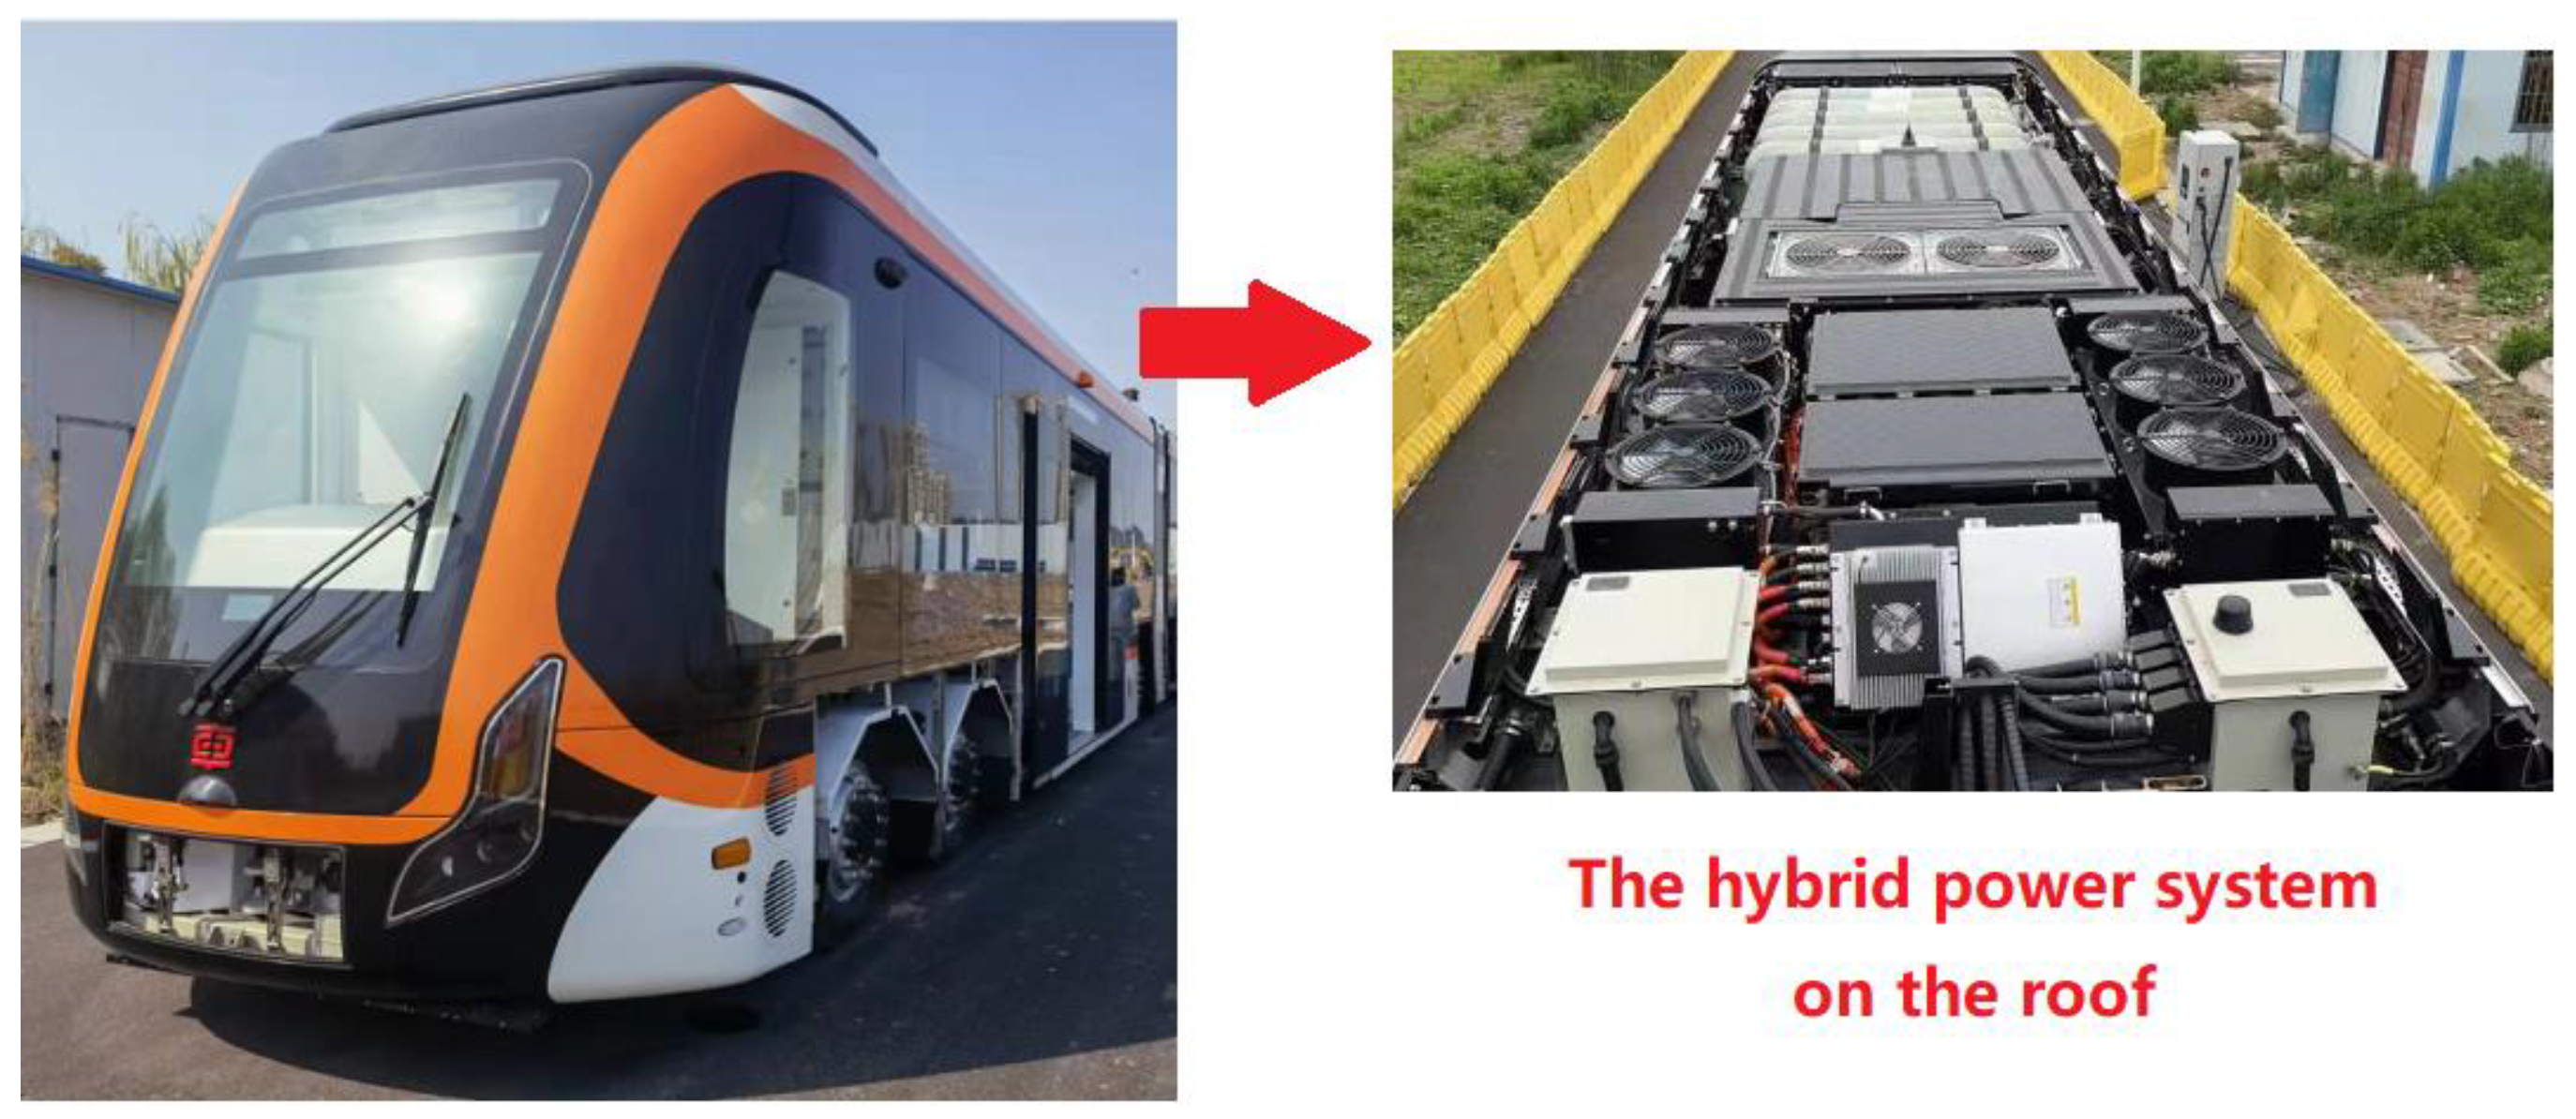
Figure 1. The tram and its hybrid power system.
Sustainability 15 11234 g001
Figure 2. The structure of the power system and fuel cell system.
Sustainability 15 11234 g002
Figure 3. Fuel cell efficiency curve.
Sustainability 15 11234 g003
Figure 4. Fuel cell system energy consumption and fitting curves.
Sustainability 15 11234 g004
Figure 5. Supercapacitor simplifies the equivalent circuit diagram.
Sustainability 15 11234 g005
Figure 6. Supercapacitor charge–discharge efficiency curve.
Sustainability 15 11234 g006
Figure 7. Operation state division diagram.
Sustainability 15 11234 g007
Figure 8. Q function curve when U0 = 400 V.
Sustainability 15 11234 g008
Figure 9. The control loop of the tram.
Sustainability 15 11234 g009
Figure 10. Fuel cell system output power during traction state.
Sustainability 15 11234 g010
Figure 11. The structure of RT-LAB platform.
Sustainability 15 11234 g011
Figure 12. The simulation results of PF and OHC methods.
Sustainability 15 11234 g012
Figure 13. The simulation results of SCS voltage under different methods.
Sustainability 15 11234 g013
Figure 14. The simulation results of hydrogen consumption under different methods.
Sustainability 15 11234 g014
Figure 15. The demand power curve of the tram.
Sustainability 15 11234 g015
Figure 16. The speed and gear signal curve of the tram.
Sustainability 15 11234 g016
Figure 17. The output power of two systems under the OHC method.
Sustainability 15 11234 g017
Figure 18. The voltage curves of SCS.
Sustainability 15 11234 g018
Figure 19. Hydrogen flow curves.
Sustainability 15 11234 g019
Table 1. The operating parameters of trams.
PerformanceParameter
Tram weight51.06 t
Maximum slope50‰
Tram size30.19 m × 2.65 m × 3.5 m
Traction system max power400 kw
Acceleration (0~30 km/h)1.2 m/s2
Table 2. The parameters of fuel cell system.
SystemParameterValue
Fuel cell stackModel nameFCveloCity-HDTRC
Net power100 kw
Idle power6 kw
Current15 A (min.), 288 A (max.)
Voltage400 V (min.), 588 V (max.)
Reactants and CoolantH2 supply pressure8 bar (nominal)
OxidantAir
Coolant50/50 pure ethylene glycol and deionized water
Table 3. The coefficients of the fitting curve.
Parameterd1d2d3
Value5.067 × 10−61.5064849
Table 4. The parameters of supercapacitor system.
SystemParameterValue
Supercapacitor SystemModel nameMaxwell BCAP3000
(15 in series 2 in parallel)
No. of modules17 in series
Capacity25.88 F
Internal resistance35 mΩ
Voltage250 V (min.), 688 V (max.), 675 V (normal)
Current−1200 A (min.), 1200 A (max.), 330 A (normal)
SC DC/DC
Converter
Bus Voltage500 V (min.), 900 V (max.)
SC-side current−1100 A (min.), 1100 A (max.)
Response timeAt most 5 ms
Switching timeAt most 20 ms
EfficiencyAt least 98%
Table 5. The fitting coefficients of k(U0) and b(U0).
Parameteri = 1i = 2i = 3i = 4
pi−1.071 × 10−81.502 × 10−5−0.0072972.252
qi0.001555−1.9781069−2.83 × 10⁵
Table 6. The results of two methods.
MethodPFOHC
H2 consumption479.63 g457.98 g
Disclaimer/Publisher’s Note: The statements, opinions and data contained in all publications are solely those of the individual author(s) and contributor(s) and not of MDPI and/or the editor(s). MDPI and/or the editor(s) disclaim responsibility for any injury to people or property resulting from any ideas, methods, instructions or products referred to in the content.