Article

Policy Recommendations for Reducing Food Waste: An Analysis Based on a Survey of Urban and Rural Household Food Waste in Harbin, China

1
School of Economics and Management, Northeast Forestry University, Harbin 150040, China
2
Sustainable Consumption and Production Area, Institute for Global Environmental Strategies, 2108-11 Kamiyamaguchi, Hayama 240-0115, Japan
3
School of Management, Bohai College of Hebei Agricultural University, Cangzhou 061108, China
*
Authors to whom correspondence should be addressed.
Sustainability 2023, 15(14), 11122; https://doi.org/10.3390/su151411122
Submission received: 15 May 2023 / Revised: 12 July 2023 / Accepted: 15 July 2023 / Published: 17 July 2023

Abstract

:
Food waste has become a pressing global issue in recent years. In China, the issue of food waste has become increasingly severe. As a provincial capital city, Harbin is also a major agricultural city in China with distinct urban and rural features. This paper uses Harbin as a case study to evaluate different strategies for preventing and reducing food waste based on these urban–rural differences. This research is based on official data on household food waste in urban and rural areas of Harbin, as well as data collected from 333 telephone surveys through stratified random sampling. Independent t-tests, one-way analysis of variance (ANOVA), and logistic regression analysis were used to analyze the survey data, followed by a review of existing food waste policies and strategies. Our findings show that Harbin has had a positive response in adhering to national anti-food waste policies. However, its implementation has not been effective. There is a continuous increase in food waste generation. Moreover, gender, level of education, and household annual income have a significant impact on residents’ food waste habits and there are significant differences between urban and rural areas in terms of “eating out” and “ordering food ingredients”. The average daily amount of food waste generated by urban households is 3216.31 g, which is 2.4 times that of rural households. There are also differences in the causes of food waste between urban and rural residents due to different diets and eating habits. As a result, feasible and effective policy recommendations have been proposed to reduce food waste in response to these urban–rural differences.

1. Introduction

On 15 November 2022, the United Nations officially announced that the global population had exceeded 8 billion. The scarcity of natural resources and the rapid growth of the world’s population have made sustainable food consumption (SCF) an urgent issue and food waste an increasingly prominent problem [1]. The number of people globally affected by hunger in 2021 reached 828 million, accounting for 29.3% of the global population, which is an increase of 350 million people compared with before the outbreak of the COVID-19 pandemic [2]. According to data from the United Nations Food and Agriculture Organization, the amount of food wasted globally each year is enough to feed 1.24 billion people [3]. Food waste not only threatens food security and causes significant social impacts but also results in greenhouse gas emissions, energy consumption, loss of biodiversity, and profound environmental impacts [4]. Food waste can lead to a significant amount of greenhouse gas emissions, including carbon dioxide, methane, and nitrous oxide; the greenhouse gases emitted because of food waste are equivalent to 8–10% of the total global emissions [5]. Globally, more than 930 million tons of food are wasted each year, accounting for 17% of the total amount of food available for consumption [6]. According to the United Nations Food and Agriculture Organization, more than half of the food lost or wasted globally every year comes from the consumption end [7]. About one-third of the food produced for human consumption worldwide is wasted, which amounts to approximately 1.3 billion tons per year [8]. Therefore, it is evident that food waste generated at the consumption level needs our attention and consideration. If everyone became aware of their food waste behavior and took measures to reduce it, this would positively impact the environment and resource conservation.
Research on food loss and waste began in the late 1980s; since 2005, research on this issue has become more widespread globally [9]. In recent years, research on food waste at the consumer end has mainly focused on five areas; anti-food waste policies and methods [10,11,12,13], quantity measurements of household food waste [14,15,16,17,18], analyses of the harms of food waste [18,19,20], analyses of the factors influencing household food waste [21,22,23,24,25,26], and methods and techniques to deal with food waste [27,28]. In the area of anti-food waste, a study on anti-food waste policies explored the influencing factors of policy implementation and found that the effective implementation of policies is closely related to the active participation of supermarket managers. The support of supermarket managers in decision making, resource allocation, and communication is one of the key factors driving policy implementation [10]. Another study summarized the practical experience of the European Union’s anti-food waste efforts and proposed that the key to solving the problem is to encourage and promote cooperation between the market entities corresponding to the food supply chain and to implement clearly defined social governance principles in relevant laws and regulations [13]. In terms of measuring the amount of household food waste, another study estimated the household food waste generation rate in the North District of Daegu, South Korea to be 0.88 ± 0.37 kg/household/day (0.26 ± 0.11 kg/person/day), which varied seasonally in the following order: summer, autumn, winter, and spring. In addition, the type of housing was found to be a key factor affecting food waste generation [15]. A survey of households in the city of London, Ontario, Canada, found that each household sent 2.81 kg of food waste to landfills every week, of which 52% was avoidable food waste. The amount of household food waste was strongly influenced by the size of the household and the number of children and, to some extent, it was influenced by socioeconomic factors and community food environment characteristics, including the availability, density, and proximity of retail food stores [16]. A survey on the quantity of food waste in Croatian households revealed that, on average, each household member discarded 2.57 portions of food per day, equivalent to 0.21 kg of food waste. In general, a typical Croatian household generated an average of 75 kg of food waste per person [17]. Food waste causes significant harm to society, the economy, and the environment, including wasted food, wasted resources, and emissions from greenhouse gases and other pollutants. A study conducted in the UK calculated the greenhouse gas emissions generated by different waste treatment methods for five core food types and assessed how much greenhouse gas emissions could be reduced by each treatment method related to food waste. The study found a strong correlation between net greenhouse gas emissions and the energy density of food [19]. A literature review on food waste in Bangladesh demonstrated that food waste was a critical issue affecting the environment. Bangladesh has a significant amount of food waste; much of it is directly dumped into the environment. Only by promoting circular economy practices can this developing country make progress toward a sustainable future [20]. Another study evaluated the total amount and cash losses caused by food waste in rural households in China, which were 3.1236 million tons and CNY 18.041 billion per year, respectively. The study also found that the carbon footprint and water footprint caused by food waste were 9.7517 million tons of CO2 and 6.108 billion cubic meters of water resources, respectively [21]. The analysis of factors influencing household food waste is a popular topic in the field of food waste. A survey examined the role of different sustainable household consumption behaviors in promoting a clean environment in Pakistan, as well as the factors influencing the adoption of these behaviors. The results showed significant relationships between gender, education, residential area, household size, income, and the adoption of sustainable household consumption practices [22]. A study found that households often hold conflicting attitudes toward waste prevention and face a conflict between their willingness to reduce food waste and their preferences for food safety, taste, and freshness [23]. A study found that food storage methods, leftover cooking skills, dining-out behaviors, grocery spending, and grocery-store-shopping frequency are important drivers of household food waste. To effectively reduce food waste, the focus should be on daily behaviors related to household food [24]. One study analyzed the factors contributing to food waste in Japanese households using categorizations based on large cities, small cities, and rural areas. The results revealed that individuals with “agricultural experience” had significantly lower rates of food waste in urban and rural areas [25]. Mobile application technology has the potential to reduce food waste. One study described the development process of MySusCof and examined its perceived quality. The mobile application is considered a promising tool for changing consumer behavior to ensure more sustainable food consumption [27]. A systematic review examined the effectiveness of mobile applications in reducing food waste in Canadian society. The study found that mobile applications can help households and individuals with sufficient technological, time, and financial resources to reduce food waste [28].
China, as one of the world’s most populous countries, cannot ignore the impact of its food waste problem on a global scale. Rough estimates indicate that China’s greenhouse gas emissions from food loss and waste are about 1.1 billion tons per year, which is higher than the total carbon emissions of each province in 2018 [29]. The amount of food waste in China’s catering industry is approximately 17–18 million tons per year, equivalent to the annual food supply for 30–50 million people [30]. As the main venues for food consumption, households also generate significant food waste. It is estimated that Chinese households waste around 10.56 million to 15.02 million tons of food every year [31]. Although many scholars have studied food waste in Chinese households, the cultural and geographical differences across different regions of China have resulted in regional differences in food consumption patterns [32], which in turn have led to regional differences in food waste in Chinese households. No scholars have conducted in-depth research on the urban–rural differences in food waste between Harbin residents. Harbin, located in the northeastern region of China and part of the Chinese black soil zone, is one of the country’s most important agricultural production areas. It is also the capital city of Heilongjiang Province; its residents have distinct urban and rural characteristics. Research on household food waste in Harbin has significant implications for sustainable production and consumption. Therefore, studying the difference in food waste between urban and rural areas can help the government better understand these differences and formulate targeted policies to encourage consumers to change unreasonable consumption behaviors and effectively reduce food waste, thus promoting the sustainable development of society.
In this research, we chose urban and rural residents in Harbin as the study population. The study encompasses four aspects of household food waste. Firstly, food waste is caused by improper or inadequate planning, resulting in excessive purchases and subsequent discarding. Secondly, food waste is discarded due to expiration or spoilage [33]. Thirdly, food waste is caused by improper storage or management within the household [34]. Fourthly, food waste or quality loss results from improper cooking methods [35]. To evaluate the differences in food waste between urban and rural residents in Harbin and to effectively prevent and reduce food waste, this study (1) assesses the current situation and food waste trends in Harbin based on official data; (2) based on data obtained from telephone surveys, it analyzes the situation and causes of food waste generation among urban and rural residents. The survey covers basic information about the households of the respondents: their daily schedules and dietary habits; the current status of food waste generation and management; their attitudes toward food waste reduction. These questions can reflect the ways in which consumers generate food waste. (3) Based on existing policies and the literature on reducing food waste, and in combination with the results of this study, reasonable policy suggestions are proposed for Harbin to reduce food waste that can serve as a reference for policy making and address practical problems. In sum, this study aims to provide specific and feasible policy recommendations for reducing food waste in urban and rural areas through a comprehensive survey and analysis of household food waste in Harbin, China. The findings of this study will contribute to the development of effective strategies and interventions for minimizing food waste, with the ultimate goal of promoting sustainable practices in Harbin and potentially serving as a reference for other cities in China and beyond.

2. Materials and Methods

2.1. Data and Information for Estimating FW Trends in Harbin

The main sources of garbage in Harbin City are: residents’ daily lives and consumption habits; municipal construction and maintenance; commercial activities and market trades; public places [36]. In the garbage of Harbin City, plant waste accounts for 71.55%, animal waste accounts for 4.90%, paper waste accounts for 9.02%, metal waste accounts for 1.16%, plastic waste accounts for 7.40%, glass waste accounts for 4.08%, cloth waste accounts for 1.31%, and wood waste accounts for 0.57%. Among these, organic waste accounts for 76.45% [37]. Food waste includes inevitable food waste (such as peels, stems, and bones) and avoidable food waste (such as leftovers) [38]. Given the imperfect garbage-sorting system in Harbin, it is difficult to accurately quantify the amount of food waste produced. Therefore, this study, classifies plant waste (such as leftover food, expired food, melon rinds and fruit cores, flower and plant waste, traditional Chinese medicine residues, etc.) and animal waste (such as meat, bones, animal viscera, etc.) in Harbin’s garbage as food waste. In addition, this study collected population data for Harbin from 2006 to 2021 to calculate its per capita food waste. The data on waste collection and transportation and the population in Harbin in this study are from the Harbin Statistical Yearbook (2007–2022), published by the Harbin Statistical Bureau.

2.2. Survey of Daily Lifestyles and FW Generation

2.2.1. Sampling Size and Analytical Approach

An extensive telephone questionnaire survey of residents in Harbin was conducted between October and December 2022; it presented a snapshot of changes in the respondents’ lifestyles. Based on the results of the seventh national census, the total household population of Harbin was 9.432 million, of which 5.265 million were urban residents; the urbanization rate of the household population was 55.8%. Considering the budget and manpower required for this survey, the sample size in this study was 333 individuals, including 183 urban respondents and 150 rural respondents. This exceeded the minimum sample size calculated using the relevant formula [39]. The formula for calculating the minimum sample size is as follows:
n = P 1 P E 2 Z 2 + P 1 P N
Z is the confidence coefficient and Z = 1.96 when the confidence level is 95%. E is the error value and E = 0.055 when the confidence interval is 5.5. P is the probability value and P = 0.5. N is the total amount and n is the minimum sample size. Therefore, by calculation, when the confidence level is 95% and the confidence interval is 5.5, the minimum sample size is 317. The sample size we selected was larger than the minimum sample size, so it was representative.
The sampling procedure for this survey included stratified random sampling, which involved using geographic regions as sampling strata and sampling according to the population size in each region to obtain more accurate and reliable estimates for the entire population. Specifically, the population was first divided into several strata based on geographical regions, with each region treated as a sampling unit. Secondly, the sample size for each region was determined based on its population size. Finally, within each unit, random sampling was conducted to ensure that each sampling unit had an equal opportunity to be selected for the sample [40]. The sample size of the public questionnaire survey totaled 333, of which the sample size of urban areas totaled 183 and the sample size of rural areas totaled 150, with specific regional distributions as follows (Table 1).

2.2.2. Content of Questionnaire

The survey was conducted through telephone interviews rather than self-administered questionnaires. A telephone survey can ensure the correctness and accuracy of the respondent’s understanding of questions and it can quickly cover a wide geographical area, reaching a larger population and more respondents and making the sample more representative [41,42]. The consumer questionnaire on food waste consisted of four main sections covering a range of daily activities. The first part included questions designed to elicit basic information about the respondents, such as gender, age, occupation, education level, household labor force size, household income, workdays in the office, and daily schedules. The second part was about the dietary habits and food consumption behavior of the respondents, including their food purchasing and cooking habits. The third part was about the current situation of food waste generation and management, including the quantity of food waste generated and the methods used for its disposal. The fourth section was about the respondents’ attitudes toward reducing food waste.

2.3. Methodology

2.3.1. Logistic Regression Model

The term “logistic” was proposed as early as 1838 by the Belgian mathematician Pierre François Verhulst. In 1845, he formally named the function “logistic” in an article he published [43]. This research employs logistic regression analysis to examine whether respondents’ attributes significantly impact food waste. Food waste is treated as the dependent variable. Food waste with high frequency is assigned a value of 1 (representing the response options “always” or “often” in the questionnaire), while food waste with low frequency is assigned a value of 0 (representing the response options “occasionally” or “never” in the questionnaire). The logistic regression probability function model is defined as follows:
LnPi/(1 − Pi) = Y = β0 + β1×1 + β2X2 + ⋯⋯ + βiXi + ε
where β0 represents the intercept, β1, β2,…, βi represent the regression coefficients, X represents the independent variable, Y represents the dependent variable, Pi represents the probability of the dependent variable taking the value 1 under the condition of the independent variable being Xi (i = 1, 2, ..., n), and ε represents the random error term.
This study selected five respondent attributes as explanatory variables, namely gender (X1), age (X2), region (X3), educational level (X4), and annual household income (X5). For specific statistical descriptions, please refer to Table 2.

2.3.2. t-Test

The t-test was invented by British statistician William Sealy Gosset to observe beer quality; it was published in 1908 in Biometrika [44]. The t-test is a statistical test method used to assess the difference in means between small samples [45]. This research used an independent t-test to compare the significant differences between urban and rural groups. The formula is as follows:
t = x 1 x 2 s q r t s 1 2 n 1 + s 2 2 n 2
where t is the t-value that represents the standardized measure of the difference between the means of two sample groups (urban groups and rural groups), x1 and x2 are the respective means of the two sample groups, s1 and s2 are the respective standard deviations of the two sample groups, and n1 and n2 are the respective sizes (number of observations) of the two sample groups.

2.3.3. Analysis of Variance (ANOVA)

The origins of analysis of variance (ANOVA) can be traced back to the work of British statistician Ronald A. Fisher during the 1920s and 1930s. Fisher developed the concept of analysis of variance as a statistical method for comparing means between multiple groups or treatments. He published his seminal work on ANOVA in his book Statistical Methods for Research Workers in 1925 [46]. This research used the one-way ANOVA method to assess the significance of differences between different age groups. This method is suitable for comparing categorical independent variables, such as age groups, with continuous dependent variables [47].
F = S S B e t w e e n / d f B e t w e e n S S W i t h i n / d f W i t h i n
SSBetween refers to the sum of squares between groups, which represents the variability among different groups. dfBetween represents the degrees of freedom between groups and is calculated as the number of groups minus 1. SSWithin refers to the sum of squares within groups, which represents the variability within each group based on the deviations of individual observations from their respective group means. dfWithin represents the degrees of freedom within groups and is calculated as the total sample size minus the number of groups.

3. Results

3.1. Trends in FW Generation in Harbin

Based on the data collected, we found the following. (1) Household food waste occurs in the final home or dining-out stages of consumption; its sources include four aspects. Firstly, food waste is caused by food expiration, improper storage, and a lack of reasonable meal planning. Secondly, food leftovers are caused by excessive cooking or improper cooking methods. Thirdly, food leftovers are caused by ordering too much food when dining out or at gatherings. Fourthly, food leftovers are caused by excessive ordering of takeout or poor taste in dishes (leftovers that are consumed at the next meal are not included in this category). Harbin’s urban areas pay more attention to the issue of food waste and there are more related policies and data compared with rural areas. (2) With the development of the economy and the improvement of people’s living standards, the issue of food waste among residents in Harbin is becoming increasingly prominent. Subsequently, official data on the municipal solid waste (MSW) collection in Harbin from 2006 to 2021 were collected to illustrate the temporal variation in food waste in the city. However, given the lack of a systematic FW management system and data collection plan, it was difficult to accurately characterize the FW material flow in Harbin. Therefore, we can only estimate the food waste situation in Harbin.
The changes in MSW and the population in Harbin from 2006 to 2021 are shown in Figure 1; FW generation and FW generation per capita from 2006 to 2021 in Harbin are shown in Figure 2. The overall trend in MSW collection and transportation volume showed an increase from 2006 to 2021, despite a slight decrease in 2019–2020. The average annual growth rate of MSW clearance from 2006 to 2021 was 3%. However, the population of Harbin has shown a downward trend overall. From 2006 to 2013, the population increased from 9.8035 million to 9.9521 million, but, since 2013, the population has decreased year by year. In 2021, the population decreased to 9.432 million, a decrease of 3.8% compared with 2016 (Figure 1). The changes in food waste generation and food waste generation per capita from 2006 to 2014 were almost the same. However, starting in 2014, although the trends of waste generation and food waste generation per capita were roughly the same, the growth rates of these two factors have gradually shown differences, with the growth rate of food waste generation per capita being higher than that of total food waste generation. From 2006 to 2021, the food waste generation increased by 45% and the food waste generation per capita increased by 50% (Figure 2). Although the population is decreasing, the quantity of MSW collected and transported and food waste generated is still increasing. The reasons for this phenomenon can be as follows: (1) With the development of the economy, people’s consumption levels have also been continuously improving, increasing household waste and food waste. (2) With the continuous development of the catering industry, more and more people choose to eat out, which has increased the amount of catering waste and food waste. (3) With the acceleration of urbanization, people’s lifestyles are gradually changing. The increase in convenient and fast-paced lifestyles, such as fast food and takeout, has led to an increase in waste and food waste. (4) Although people’s environmental awareness is increasing, their understanding and concern about food waste are still insufficient. (5) There are still some problems with the management and treatment of urban waste classification, which leads to an increase in waste collection and food waste.
About 120 tons of kitchen waste is processed daily in Daoli, Nangang, Xiangfang, Daowai, and Pingfang districts of Harbin, all from food waste generated by more than 3000 restaurants; the amount is increasing [48]. The continuous increase in kitchen waste represents the increasingly frequent phenomenon of food waste. This is just the number from catering institutions in these five districts, not including the kitchen waste generated by residential households. As a result, the amount of food waste generated by households in Harbin is extremely significant. In 2020, Harbin’s grain sales for the whole society was 19.76 million tons. The per capita consumption expenditure of urban residents in Harbin was CNY 27,202, of which food expenditure was CNY 6470, accounting for 23.8% of the total expenditure, and the per capita food service expenditure was CNY 1878, accounting for 6.9% of the total consumption. The per capita consumption expenditure of rural residents was CNY 12,047, of which food expenditure was CNY 3673, accounting for 30.5% of the total expenditure, and the per capita food service expenditure was CNY 243, accounting for 2% of total consumption [49]. Urban residents in Harbin eat out more frequently than rural residents and urban residents’ expenditures on food services are nearly eight times those of rural residents. In 2021, the total amount of MSW collected and transported in China was 24,869.2 thousand tons [50], with an average per capita MSW collection and transportation volume of 176 kg/person. The per capita MSW collection and transportation volume in Harbin was 200 kg/person, which was higher than the national average.
Given the serious issue of food waste in Harbin, the government and relevant departments have started to take measures to reduce the phenomenon of food waste. In 2023, the Harbin Market Supervision Administration will carry out a special campaign to prevent food waste throughout the city [51]; the Harbin Restaurant Association, the Municipal Bureau of Commerce, and the Municipal Environmental Protection Bureau have jointly issued a call to action to prevent food waste [52]. These policies all call for active participation from catering enterprises, industry personnel, and consumers in reducing food waste and curbing the phenomenon in the catering industry. The anti-food waste initiatives in Harbin have just started and there is still a lot of room for development and progress.

3.2. Results of the Survey

3.2.1. Attributes of the Respondents

Table 3 provides a detailed summary of the characteristics of the respondents, including gender, age, occupation, education level, and household income. In the sample, the proportion of urban males is 50.82% and the proportion of urban females is 49.18%. The proportion of rural males is 49.33% and the proportion of rural females is 50.67%. This is consistent with the male-to-female ratio of Harbin residents. For the age distribution, both urban and rural areas include people from 18 years old to over 60 years old; minors are not included in the survey. From the perspective of the surveyed population’s occupations, in rural areas, farmers make up the highest proportion, accounting for 50%, while workers and housewives make up the lowest proportion, both at 1.3%. In urban areas, employees make up the highest proportion, accounting for 22.4%, while housewives and freelancers make up the lowest proportion, both at 2.73%. The educational level of the sample varies, ranging from elementary school to a master’s degree or higher. Among urban respondents, 48.08% have a university or college degree and 19.13% have a master’s degree or higher, meaning that 67.21% of the population have higher education and there are no illiterates, semi-literates, or those with only an elementary school education. Among rural respondents, 32.66% had a university or college degree and only 2% had a master’s degree or above. The largest proportion had a high school education, accounting for 22%. From this, it appears that the education level of Harbin’s urban population is much higher than that of the rural population. The annual household income of the sample ranges from less than CNY 30,000 to more than CNY 1,000,000. More than half of the respondents’ annual household incomes are concentrated in the range of CNY 30,000 to 150,000. According to the income levels of households categorized by the Labor Contract Law of the People’s Republic of China [53], most households in Harbin are at the poverty or moderate level. In general, urban households have slightly higher incomes than rural households.
The characteristics of the respondents were analyzed using a logistic regression model; the results of the analysis are shown in Table 4. The results indicate that Prop = 0.0002 < 0.001, which means that the independent variables in the model have significant explanatory power for the dependent variable, as confirmed by the test of the significance level. If the value of P > |z| is less than 0.05, it indicates significance at the 95% confidence level. If it is less than 0.01, it indicates significance at the 99% confidence level. Additionally, the odds ratio is used to measure the ratio of probabilities of the dependent variable occurring at different levels of the independent variable. When the odds ratio is greater than 1, it indicates that the probability of the dependent variable occurring is relatively higher at that level of the independent variable. Conversely, when the odds ratio is less than 1, it indicates that the probability of the dependent variable occurring is relatively lower at that level of the independent variable. The results show that only area (X3) has an odds ratio of less than 1, while gender (X1), age (X2), education level (X4), and annual household income (X5) all have odds ratios greater than 1. This indicates that area (X3) has a relatively small influence on the probability of food waste occurrence. Combined with the significance, the odds ratio for age (X2) is 1.025, which is close to 1 but not significant. This suggests that age has a relatively small impact on the probability of food waste occurrence. The odds ratios for gender (X1), education level (X4), and annual household income (X5) are all significantly greater than 1. In addition, gender (X1), education level (X4), and annual household income (X5) have a significant impact on food waste among residents and they are positively correlated. Specifically, males have a higher frequency of food waste compared with females. Individuals with higher levels of education tend to have a higher frequency of food waste compared with those with lower levels of education. Similarly, as the annual household income increases, the frequency of food waste also increases.
In conclusion, gender, level of education, and annual household income have been found to be significant factors influencing food waste, while age and region may have a relatively smaller impact on food waste occurrence.

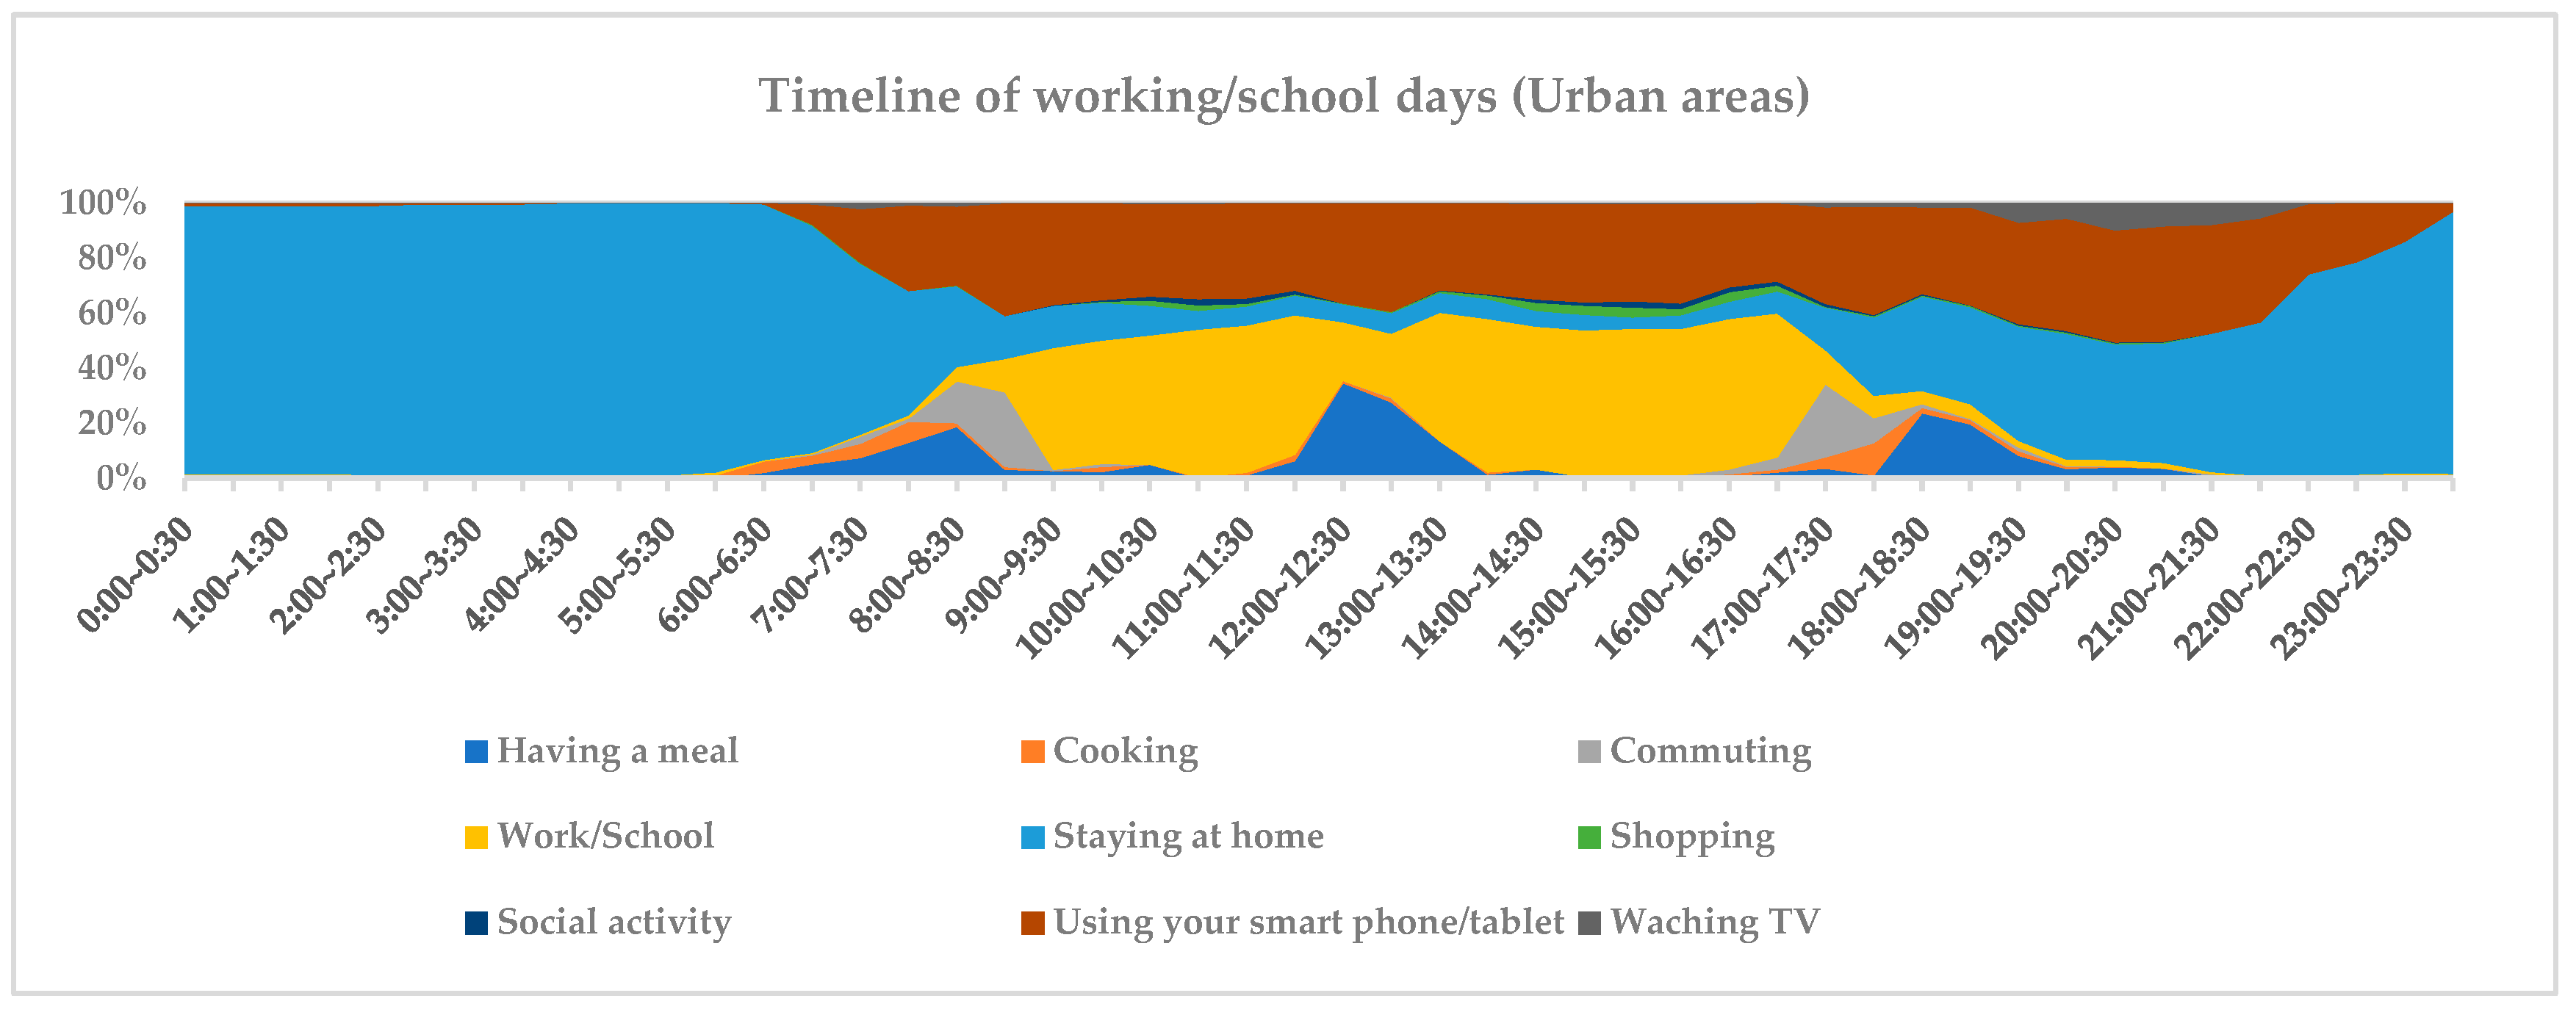
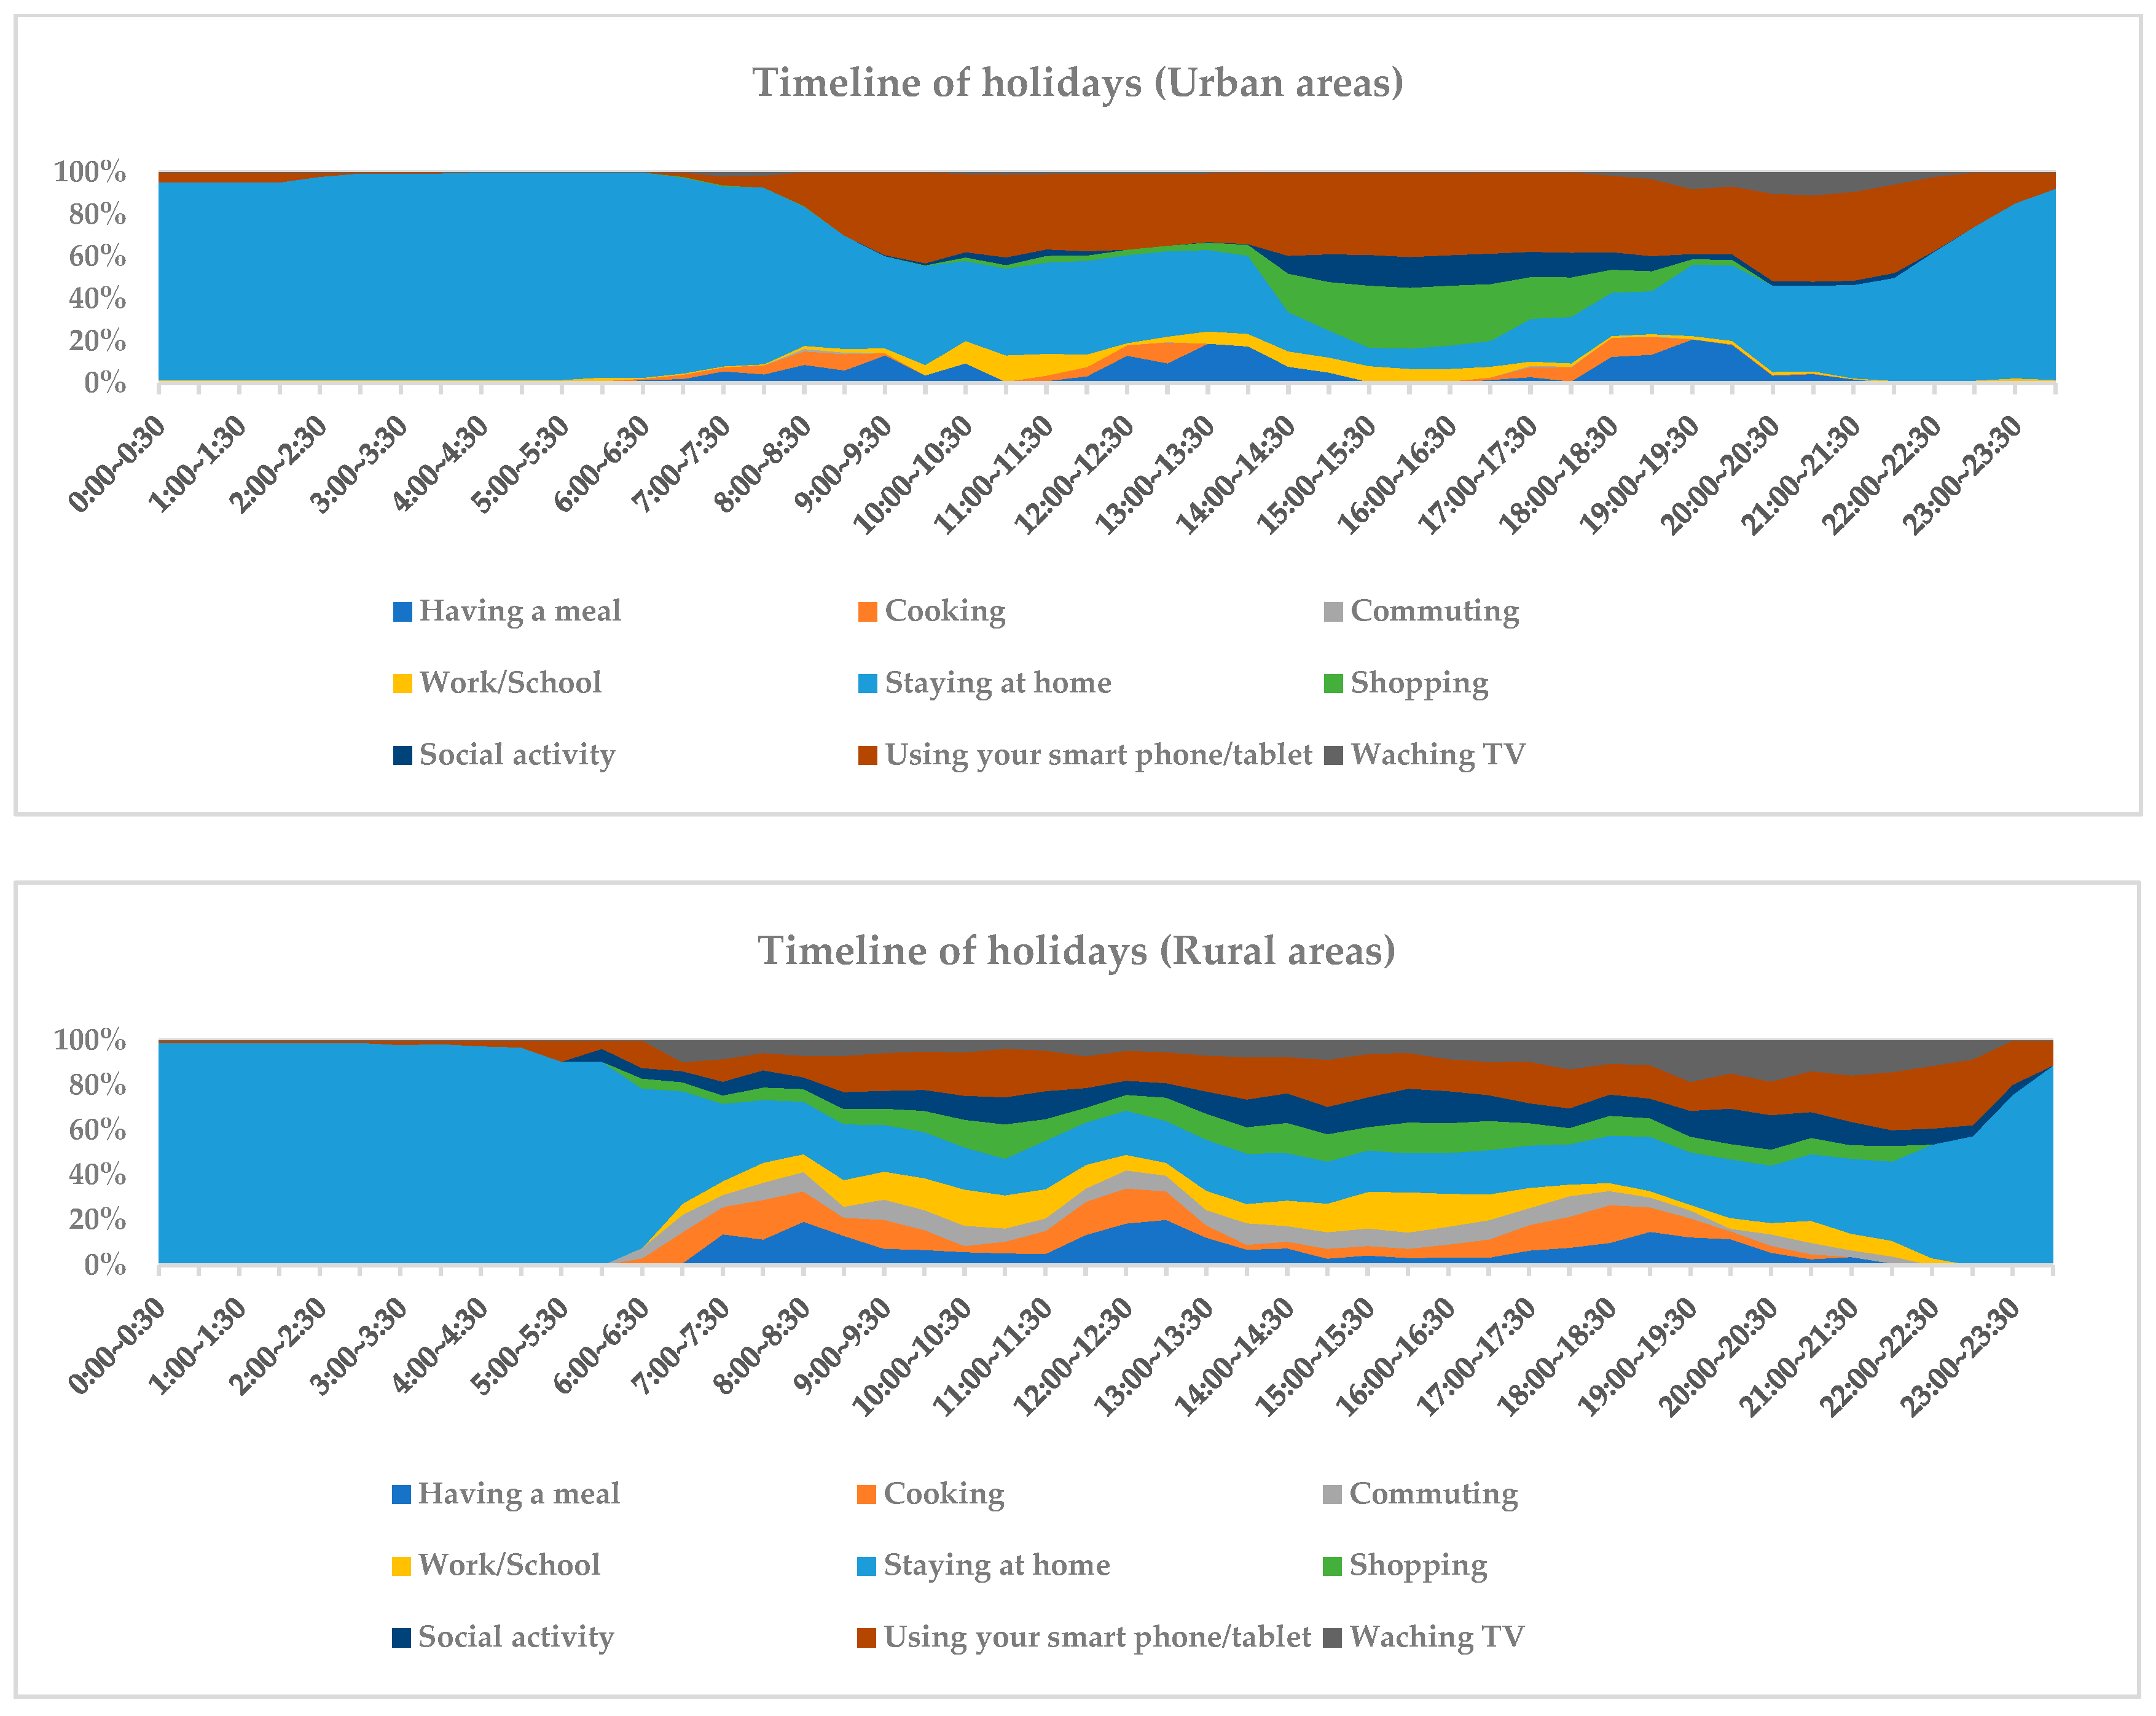
3.2.2. Lifestyle and Dietary Habits of Urban and Rural Residents

The comparison of daily timelines between urban and rural residents in Harbin City shows significant differences. (1) Urban residents have more regular work schedules and a faster pace of life than rural residents, while rural residents have more flexible schedules. (2) Urban residents have larger variations in their daily schedules between working/school days and holidays, while rural residents have more consistent daily schedules. (3) Rural residents spend more time cooking at home compared with urban residents. (4) Urban residents spend more time on smartphones/tablets than rural residents, while rural residents watch TV significantly more than urban residents. All of these indicate the existence of significant lifestyle differences between urban and rural residents in Harbin City (Figure 3 and Figure 4).
On workdays, the number of urban residents who eat Chinese food for lunch is the highest, but very few of them cook at noon. However, rural residents place more importance on breakfast; the frequency of cooking three meals is almost the same as that of eating. This shows that there are significant differences in the lifestyles of urban and rural residents in Harbin. The reason for this difference may be that more urban residents go to work and they have canteen or take-out food for lunch because it is inconvenient to go home and cook. On the other hand, most rural residents are farmers, so they have more control over their mealtimes and cooking. On holidays, both urban and rural residents have more even meal patterns throughout the day. However, urban residents tend to have a later overall schedule compared with rural residents and rural residents cook more meals at home. Urban residents’ commuting time on working days is concentrated between 7:30 to 9:30 and 16:30 to 18:30. There is almost no commuting on holidays; working hours are also concentrated on weekdays. In contrast, rural residents’ commuting and working hours are spread throughout the day on both working days and holidays. This indicates that rural residents have more flexible working hours than urban residents, but many people need to work during holidays. Urban residents tend to stay at home more during holidays, while rural residents do not experience much difference in the amount of time they spend at home during weekdays or holidays. The trends for shopping and social activities for urban and rural residents are generally the same. Urban residents have less shopping and social activity time on workdays and more on holidays, which is concentrated in the afternoon. In contrast, rural residents have more dispersed shopping and social activity times and more time for these activities on holidays compared with workdays. Regarding the use of smartphones/tablets and watching TV, it is clear that urban residents spend more time using smartphones/tablets and that their TV viewing time is minimal and concentrated in the evening. Rural residents, on the other hand, spend less time using smartphones/tablets than urban residents but they spend more time watching TV. This indicates that there is a difference in the media through which urban and rural residents receive information.
Regarding eating frequency, rural residents cook at home (including ingredient delivery) at a frequency of 8.05 times/week, much higher than the frequency of 6.91 times/week for urban residents. However, urban residents have a higher frequency of eating out, ready-made meals, and takeaway orders of ready-made meals than rural residents (Table 5). Combining the results of the t-test, there is a significant difference between urban and rural areas in terms of “eating out” and “takeaway order of ingredients”; both show significance at a 99% confidence level (Table 6).
These five types of eating habits are the same in respondents of all age groups, all of whom eat in most frequently. When comparing different age groups, there are obvious differences between urban and rural areas, as well as between different age groups (Figure 5). For people under the age of 30, urban residents order takeaway ready-made meals more frequently than rural residents; the frequency is also the highest compared with other urban and rural age groups. For the 31–40 age group, rural residents have a higher frequency of eating in compared with urban residents; this frequency is also the highest among rural residents in other age groups. In the 41–50 age group, urban residents eat out more frequently than rural residents, while rural residents order takeaway food more often than urban residents. In the 51–60 age group, urban residents have a higher frequency of eating in than rural residents, while rural residents have a slightly higher frequency of having ready-made meals and ordering takeaway of ready-made meals than urban residents. The urban–rural difference in dietary habits for people aged 60 and above is the greatest of all the age groups, with urban residents having the highest frequency of eating at home, reaching 79%; however, rural residents have relatively balanced eating habits.
Combined with the analysis of variance, there are significant differences in “eating out”, “ready-made meals”, “takeaway order of ingredients”, and “takeaway order ready-made meals” between different age groups in urban residents, while in rural residents, only “ready-made meals” show significant differences between the different age groups (Table 7).
Harbin is a major agricultural city, with about 51.7% of the total population engaged in agricultural-related work [54]. With the progress of urbanization, the living standards of rural residents are also continuously improving. By analyzing the differences in dietary habits between urban and rural residents, we are able to construct scenarios where food waste occurs among urban and rural residents in Harbin. Compared with rural residents, urban residents may generate more food waste from eating out and ordering takeaway ready-made meals.
Figure 6 shows the intended future eating habits of urban and rural residents in Harbin. Although urban residents are more concerned about changes in future dietary habits compared with rural residents, their change trends are roughly the same. More people will increase their frequency of eating out in the future, while the frequency of the other four dietary habits will decrease. Under the new normal of COVID-19, the catering industry has begun to recover and both urban and rural residents plan to increase their frequency of dining out in the future. Therefore, food waste in dining places such as restaurants and night markets may increase; this requires attention.

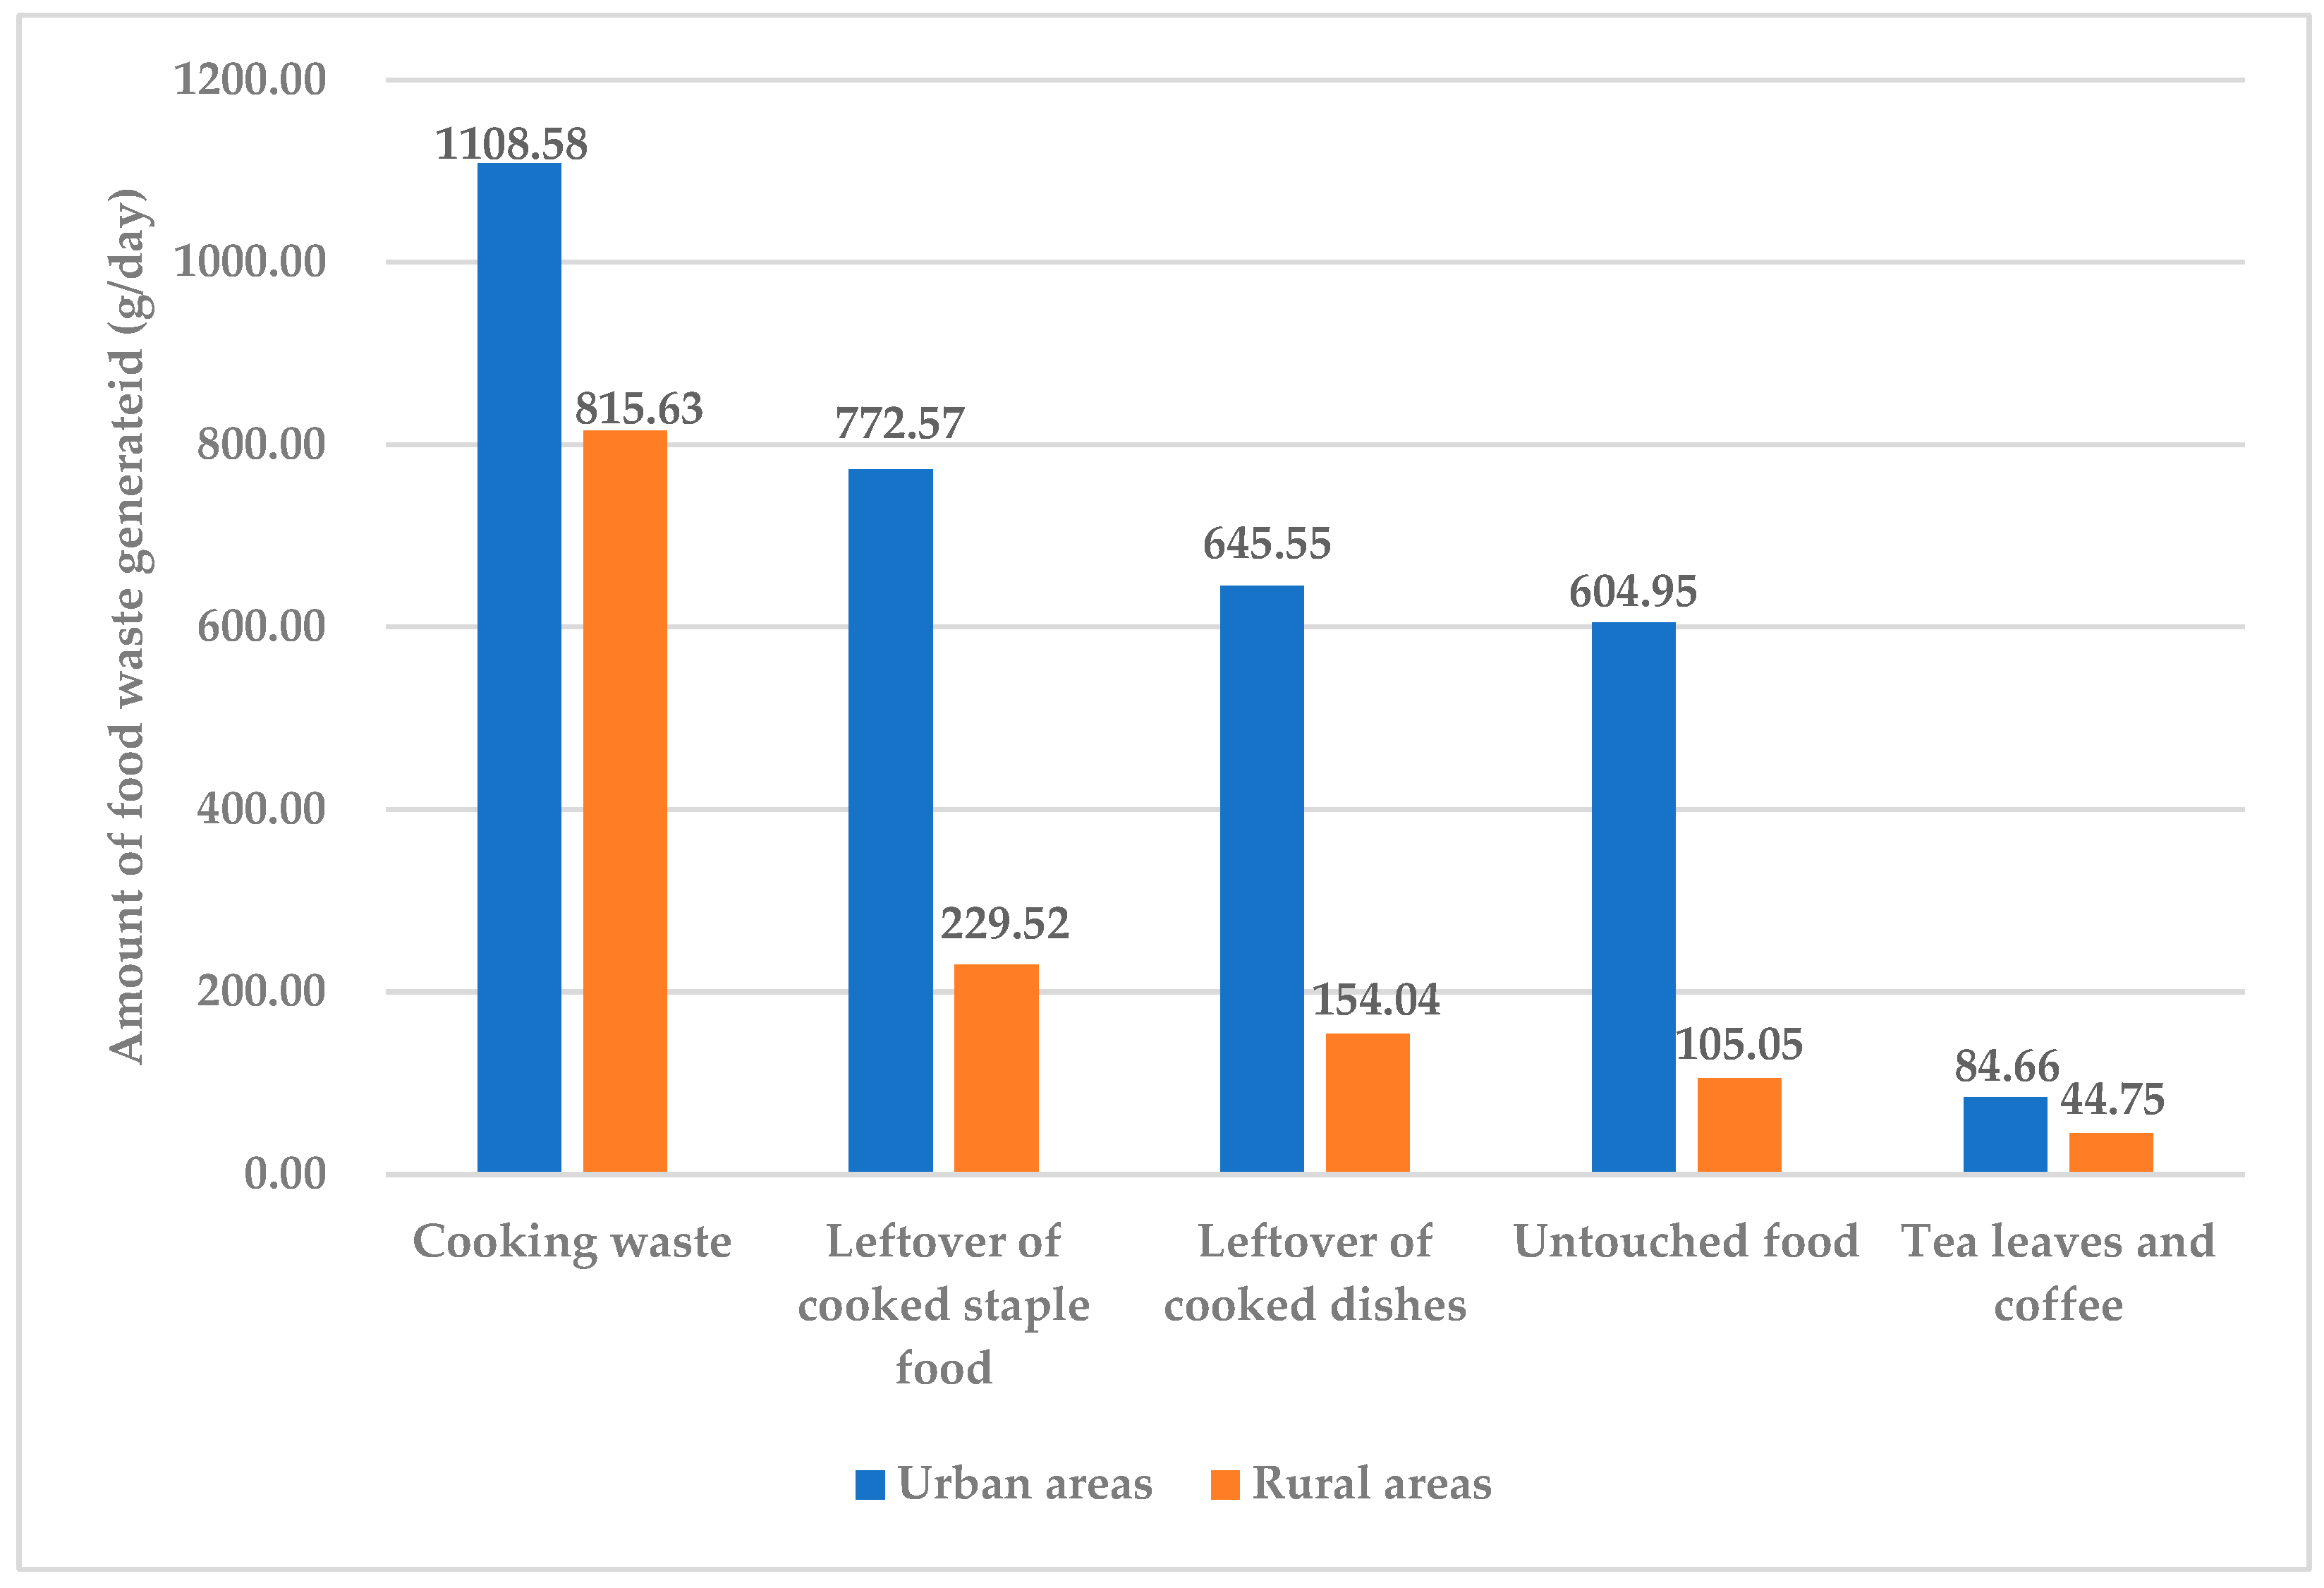
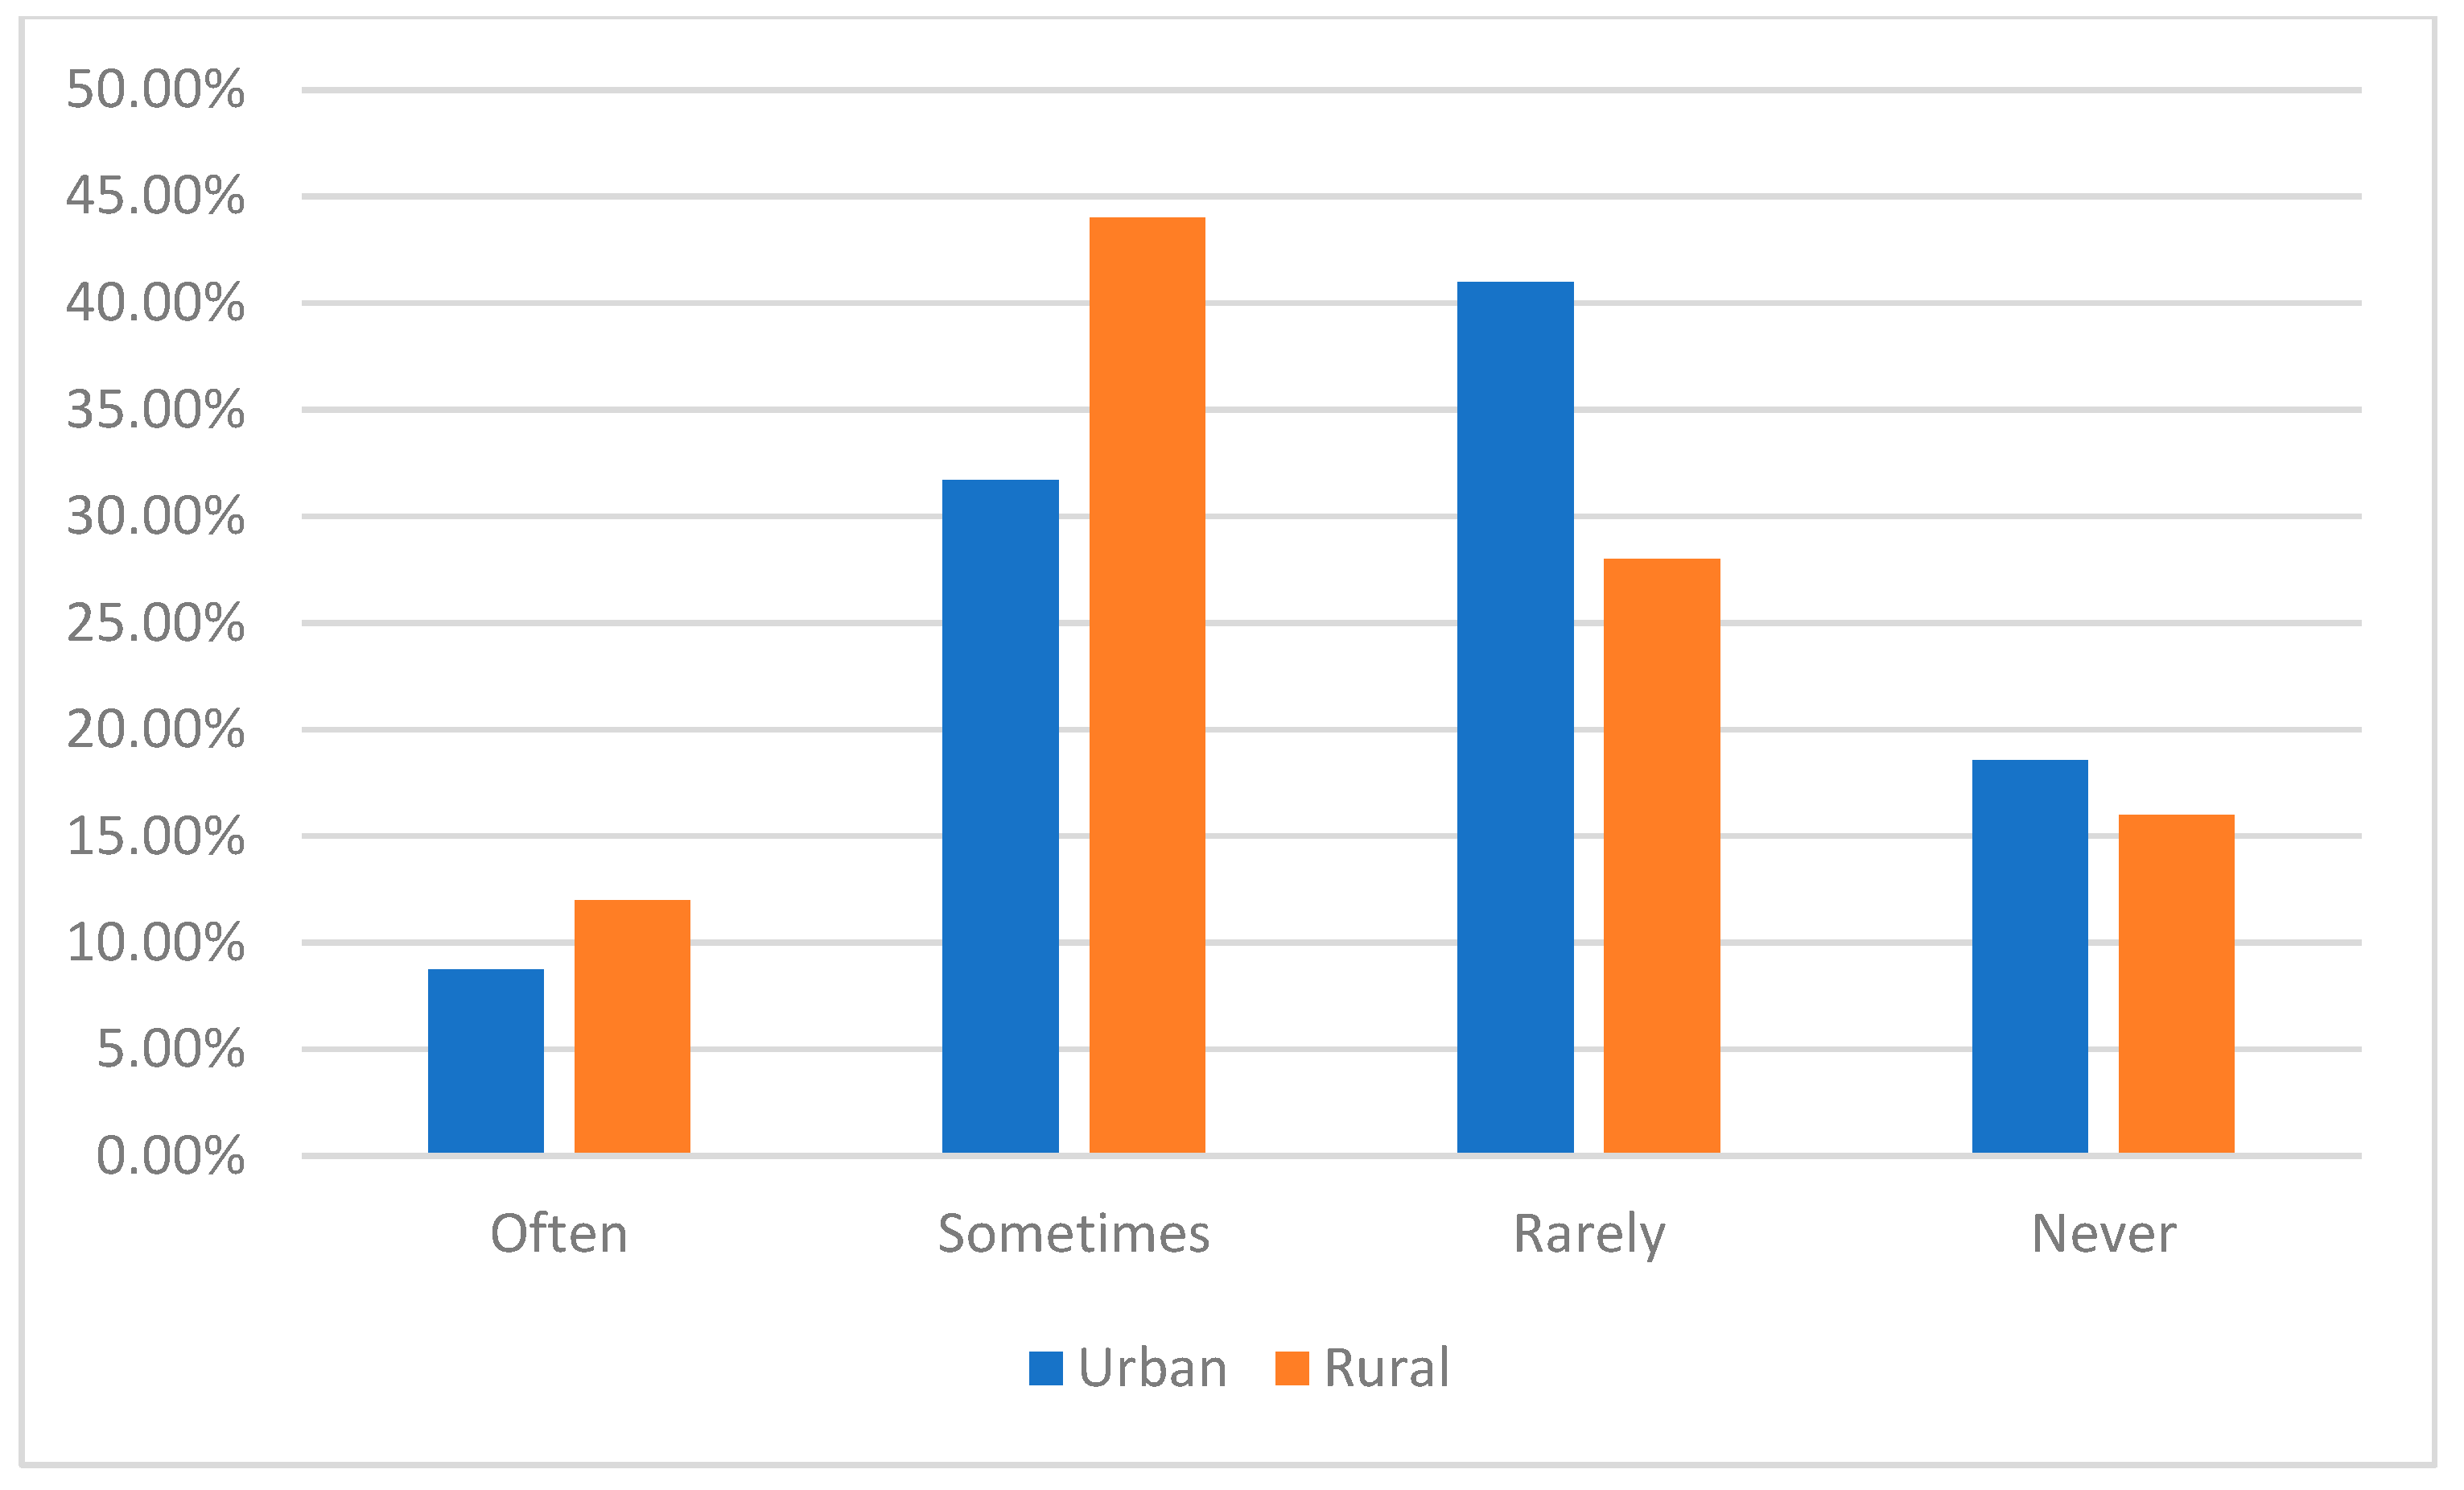
3.2.3. Food Waste Situations and Reasons

During the survey, we asked the respondents about the amount of food waste generated by their households on average per day in the past week. The specific results are shown in Figure 7. As shown in Figure 7, the issue of food waste is much more severe in urban areas than in rural areas. The average daily amount of food waste generated by urban households is 3216.31 g, which is 2.4 times that of rural households. However, regardless of whether it takes place in urban or rural areas, the main source of food waste is cooking waste, followed by leftovers of cooked staple food, leftovers of cooked dishes, unprocessed food, and tealeaves and coffee. The amount of food waste generated from cooking in urban households is 1.36 times that of rural households, while the number of leftovers (cooked staple food and dishes) is 3.7 times that of rural households. Thus, if the same amount of food is considered, urban households will have more food waste. This shows that food waste is more severe in urban households than in rural areas.
In terms of managing/disposing of food waste, over 80% of urban residents dispose of it without separating food waste (Figure 8). Although most rural residents choose to dispose of it without separating food waste, there are still those who choose to separate and then dispose of it or separate it and then reuse/recycle it. Especially for cooking waste and leftovers of cooked staple food, the number of people who choose not to dispose without separation and those who choose to separate and then dispose or separate and then reuse/recycle is almost the same (Figure 8). The survey revealed that food waste that is separated and then reused/recycled is almost always used for composting and animal feeding.
The COVID-19 pandemic has had a significant impact on people’s dietary habits [55]. With the implementation of stay-at-home orders and lockdown measures, many people have had to change their dietary and lifestyle habits. Figure 9 illustrates the change in household food waste for urban and rural families in Harbin from before COVID-19 to the present. Compared with before COVID-19, urban households have significantly reduced food waste generated by eating out, increased food waste generated by cooking in, and slightly increased food waste generated by food delivery. Similar to urban households, rural households have also seen a slight increase in food waste generated by food delivery. However, unlike urban households, food waste from eating out and eating in has decreased in rural households. Research has found that the impact of COVID-19 on the dietary habits of urban residents is greater than that of rural residents. Urban residents are more likely to eat out and the strict restrictions on eating out due to COVID-19 have made it difficult for urban residents to eat out normally as they did before COVID-19. After the normalization of COVID-19, the urban and rural residents may return to the dietary habits they had before COVID-19 or they may be accustomed to their current dietary habits.
“Food waste at home” refers to food waste that occurs in households when cooking at home, buying ready-to-eat foods to bring home, or ordering takeout food at home. The frequency of food waste among urban and rural residents in Harbin is highest for those who occasionally waste food at home. Overall, urban residents waste more food at home than rural residents (Figure 10). We conducted a survey of residents who always or often waste food and learned the reasons behind their food waste. The main reasons for food waste generation are different between urban and rural residents (Figure 11). The main reason for urban residents to waste food is poor quality; passing the “use-by date” and excessive amounts of food are also relatively major reasons. The main reason for food waste among rural residents is an overabundance of food. Compared with urban residents, rural residents tend to waste more food because of having no plan to consume it in the near future, while food waste due to boredom and dissatisfaction with food is far more frequent than with urban residents (Figure 11). This study found that urban residents are more concerned about food safety issues than rural residents. They pay more attention to food quality and expiration dates. Meanwhile, rural residents have fewer complete food procurement plans than urban residents and they may have problems with food overconsumption.
Food waste from eating out typically occurs at restaurants, cafes, fast food chains, canteens, buffets, night markets, and other similar venues. Overall, the frequency of food waste generated by urban and rural residents when eating out is not high (Figure 12). However, there are significant differences in the reasons for food waste generated by urban and rural residents when eating out. For urban residents, the main reason for food waste generated by eating out is that the volume of each dish is too big to finish; the other five reasons are also significant (Figure 13). For rural residents, the main reason for food waste when eating out is that they want to try a variety of dishes; few people choose not to eat a dish because of the taste or dissatisfaction with the dish (Figure 13). When eating out, customers can usually communicate with waiters and order an appropriate amount of food to avoid waste.
More and more people of all ages and professions are using food delivery services, so the food waste generated by food delivery cannot be ignored. The places where people can use food delivery services include their homes, workplaces, schools, and other locations. In terms of food waste generated by ordering food delivery services, the frequency of rural residents is slightly higher than that of urban residents. In total, 40% of urban residents and 56% of rural residents often or sometimes generate food waste when ordering takeaway services (Figure 14). The reasons for food waste when ordering from takeaway services are not significant for either urban or rural residents when it comes to reasons such as having religious beliefs or food allergies, as only around 10% of people have these reasons (Figure 15). The number of people who choose other reasons for food waste is quite high, especially among rural residents, with more than 90% of them choosing these reasons. Urban residents tend to select too many food varieties for the sake of balance, while rural residents tend to order more food than they can eat when they are hungry (Figure 15). The survey showed that rural residents are not as proficient in using food delivery services and they may order too much or not estimate the amount of food properly, resulting in food waste. In addition, their food purchase plans are not as well-established as those of urban residents. They tend to store more food to prevent hunger. Therefore, when they order food delivery services, they often order more food than they need so that they can eat it anytime they want. This results in more food waste.

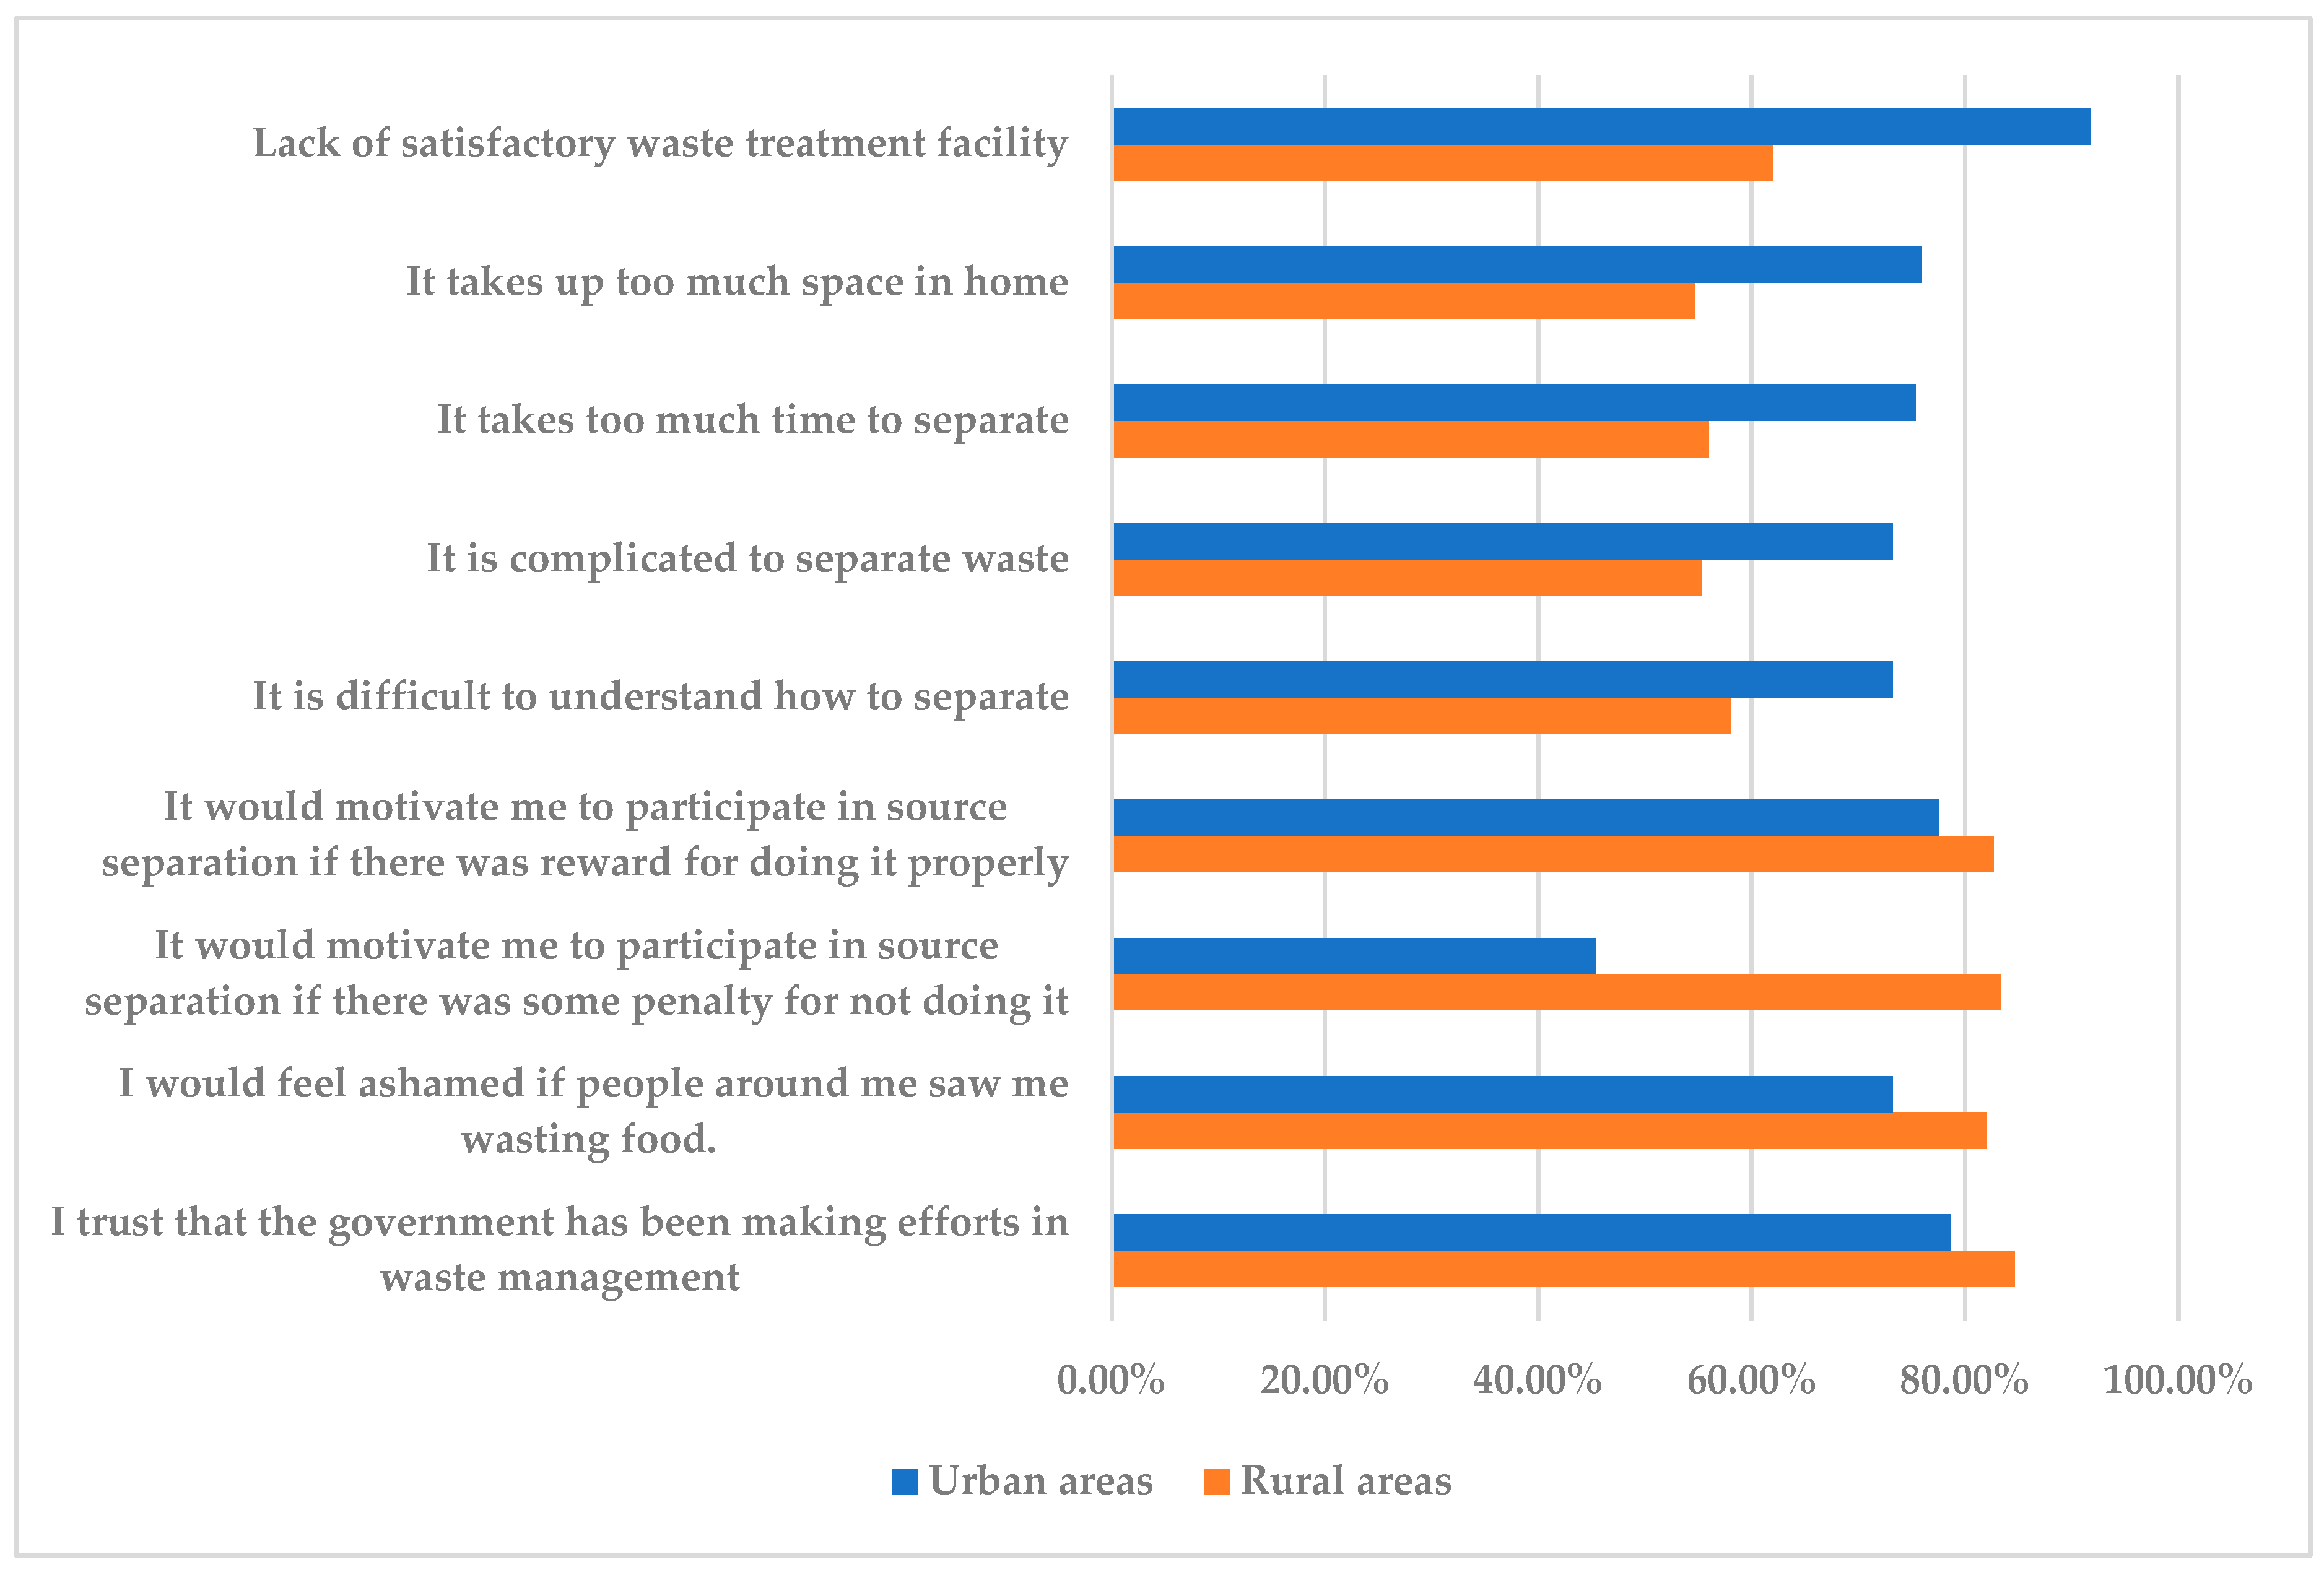
3.2.4. Respondents’ Attitudes toward Food Waste Reduction

The data on household kitchen waste sorting in urban and rural areas (Figure 16) show that 80.87% of urban residents dispose of their kitchen waste without separation, while only 39.33% of rural residents dispose of their kitchen waste without separation. In addition, 13.33% of rural residents recycle or reuse kitchen waste after sorting it. Rural residents are better at sorting kitchen waste than urban residents. Subsequent research found that, in most areas of both urban and rural areas of Harbin, there are no waste classification programs and no trash cans specifically for separating “dry” and “wet” waste. Most of the residents who reuse/recycle kitchen waste after separation usually choose to use it for feeding animals or composting.
There is a significant difference between the attitudes of urban and rural residents toward garbage sorting (Figure 17). Among urban residents, only 45% of individuals chose “It would motivate me to participate in source separation if there was some penalty for not doing it”, while over 77% of people chose “It would motivate me to participate in source separation if there was a reward for doing it properly”. Therefore, for urban residents, rewards are more effective than penalties in promoting waste separation behavior. However, among rural residents, the number of individuals choosing both options exceeds 80%. Therefore, for rural residents, both rewards and penalties are equally important in promoting waste separation behavior. In total, 91.8% of urban residents believe that there is a lack of satisfactory waste disposal facilities. More than 80% of rural residents believe that the government is trying to manage waste, keeping in mind the opinions about food waste of the people around them. Compared with rural residents, urban residents are more likely to find garbage sorting difficult to understand, complex, time-consuming, and space-consuming.
Figure 18 displays the different attitudes of urban and rural residents toward reducing food waste. The biggest difference between urban and rural residents in reducing food waste is that 77% of urban residents choose to buy fewer items at the same price, while only 39% of rural residents choose this option. The second greatest difference between urban and rural residents is that COVID-19 has made food more valuable and reduced food waste, with 78% of urban residents choosing this option and only 53% of rural residents choosing it. Rural residents believe that food delivery services are more likely to generate food waste when it comes to addressing the issue of ordering food delivery. Other options were also chosen by over 40% of urban and rural residents.

3.3. National and Local Policies Related to Food Waste

The timeline of major national and local policies related to food waste is shown in Figure 19. It can be seen that there is a certain lag in the local response of Harbin City to the national policy of reducing food waste. This study conducted a policy search using keywords on the Peking University Legal Information Platform, with the search set to find titles or full texts containing “food waste” or “food conservation”. The search results indicate that there are not many policies in China related to food waste. The earliest formal policy on combating food waste was the notice “Opinions on Strengthening the Thrift Practice and Combating Food Waste” issued by the General Office of the Communist Party of China Central Committee and the General Office of the State Council in 2014 [56]. Starting in 2020, China has launched a wave of anti-food waste campaigns. On April 29, 2021, China promulgated the first law on food waste, the “People’s Republic of China Anti-Food Waste Law” [57].
In response to the national policy in 2014, Heilongjiang Province promulgated the “Implementation Plan for Practicing Thrift and Opposing Food Waste in Heilongjiang Province” [58]. On August 9, 2019, the Harbin Municipal People’s Government issued the “Harbin Urban Kitchen Waste Management Measures” [59]. The latest policy in Harbin to reduce food waste was announced in March 2023, when the Harbin Municipal Market Supervision Bureau deployed a comprehensive campaign to stop food waste in the catering industry [60]. In addition to that, there are many other actions to reduce food waste, among which the most well-known is “Operation Clean Plate” [61]. Since its launch in 2013, “Operation Clean Plate” has received widespread attention and participation across the country [62].

4. Discussion and Recommendations

4.1. Differences in Characteristics between Urban and Rural Residents

The study results show that differences in characteristics between urban and rural residents in Harbin are quite obvious. Among the factors influencing household food waste, the differences in these characteristics have been studied by many scholars. Some studies have found that the higher the education level, the less food waste is produced. People with higher education levels have better discernment abilities and are less likely to be influenced by impulse purchases [31,63,64]. Some scholars hold the opposite view. They believe that there is a positive correlation between their level of education and the amount of food waste they produce [65,66]. It is quite clear that the food waste situation among urban and rural residents in Harbin belongs to the latter case. The level of education of urban residents in Harbin is higher than that of rural residents and the amount of food waste is much higher than that of rural residents. This indicates that, although urban residents have a higher level of education, their awareness of reducing food waste is still insufficient and they have not developed the habit of saving food. Therefore, enhancing the awareness of urban residents regarding food waste reduction can help solve this problem in cities.
Income level is also an important factor that influences food waste. Almost all existing research has found a positive correlation between income and food waste [67,68]. Different households with different income levels have different attitudes toward saving food [69,70]. Some scholars believe that household income is not related to food waste [71]. With the vigorous promotion of urbanization in Harbin, the gap between urban and rural areas in terms of wealth has been narrowing. The research found that, although urban households in Harbin have higher incomes than rural households, the living standards of rural households are also constantly improving. More and more rural residents are becoming used to ordering food delivery services; even the proportion of elderly rural residents ordering food delivery services is higher than that of urban areas.

4.2. Differences in Dietary Habits between Urban and Rural Residents

Different dietary habits can result in different amounts of food waste. Some scholars believe that more food waste is generated when eating at home, as people often cook too much food, making portions that exceed the actual number of diners, resulting in uneaten food being thrown away [72,73]. Poor cooking skills can reduce people’s appetites, leading to food waste [74]. Improper storage methods and excessive food purchasing can both lead to food spoilage and thus result in food waste [74,75,76]. Additionally, many scholars believe that eating out can generate significant food waste. According to Wang et al. (2017), a survey of 195 restaurants in China showed that the average amount of food wasted per person per meal was approximately 93 g [77]. Some scholars have found that the two main reasons for food waste generated from dining out are that people do not like the taste of the dishes they ordered and that the portion size of each dish is too large [38]. One study suggests that the amount of food waste generated by the restaurant industry from dinners is significantly higher than that of lunches [78,79]. Finally, some scholars have found that, compared with other food consumption channels, the food supply system for takeaway food has a relatively large impact on food waste [80]. Studies have found that promotional activities can cause consumers to purchase products beyond their purchasing power or needs, leading to food waste [81]. However, existing research on food waste generated from ordering food delivery services has mostly focused on college students [82,83,84]; there is almost no research on food waste generated from ordering food delivery services in households. In addition, COVID-19 has also had a significant impact on dietary habits [55,85].
Research has found that COVID-19 has a great impact on the dietary habits of urban residents, especially in terms of eating out. Therefore, after the normalization of COVID-19, the food waste generated by dining out is likely to increase significantly. In terms of different dietary habits, both urban and rural residents generate the most food waste when ordering takeaway services and rural residents generate more food waste by ordering takeaway services than urban residents. Urban residents and rural residents do not waste much food when eating out, but urban residents waste more food at home compared with rural residents. When it comes to food waste caused by eating at home, urban residents are more concerned about food safety issues than rural residents, who may have incomplete food purchasing plans and may have problems with excessive food consumption. Urban residents are more concerned about food quality and shelf life. For urban residents, the main reason for food waste generated by eating out is that the portion sizes of each dish are too large to finish, while, for rural residents, the main reason for food waste generated by eating out is the desire to try different dishes. Rural residents have relatively balanced dietary habits across different age groups, while urban residents have significant differences in dietary habits between different age groups. The older the urban residents are, the more they tend to eat at home, while the younger they are, the more they prefer to use food delivery services. Overall, the situation and reasons for food waste generated by urban residents are more complex and diverse.

4.3. Differences in Food Waste between Urban and Rural Residents

In recent years, many scholars have conducted research on household food waste. Jiang et al. (2018) found that, by analyzing the time trend of household food waste, the amount of food waste in urban and rural households showed a significant downward trend [31]. Some scholars believe that the problem of food waste in cities is more serious than in rural areas [86,87]. However, some studies have indicated that the waste rate in rural areas is higher than in urban areas [88]. This study found that the amount of food waste in Harbin has not decreased but is instead growing and that the amount of food waste generated by urban residents is much higher than that of rural residents. Therefore, more attention should be paid to reducing food waste in urban areas.

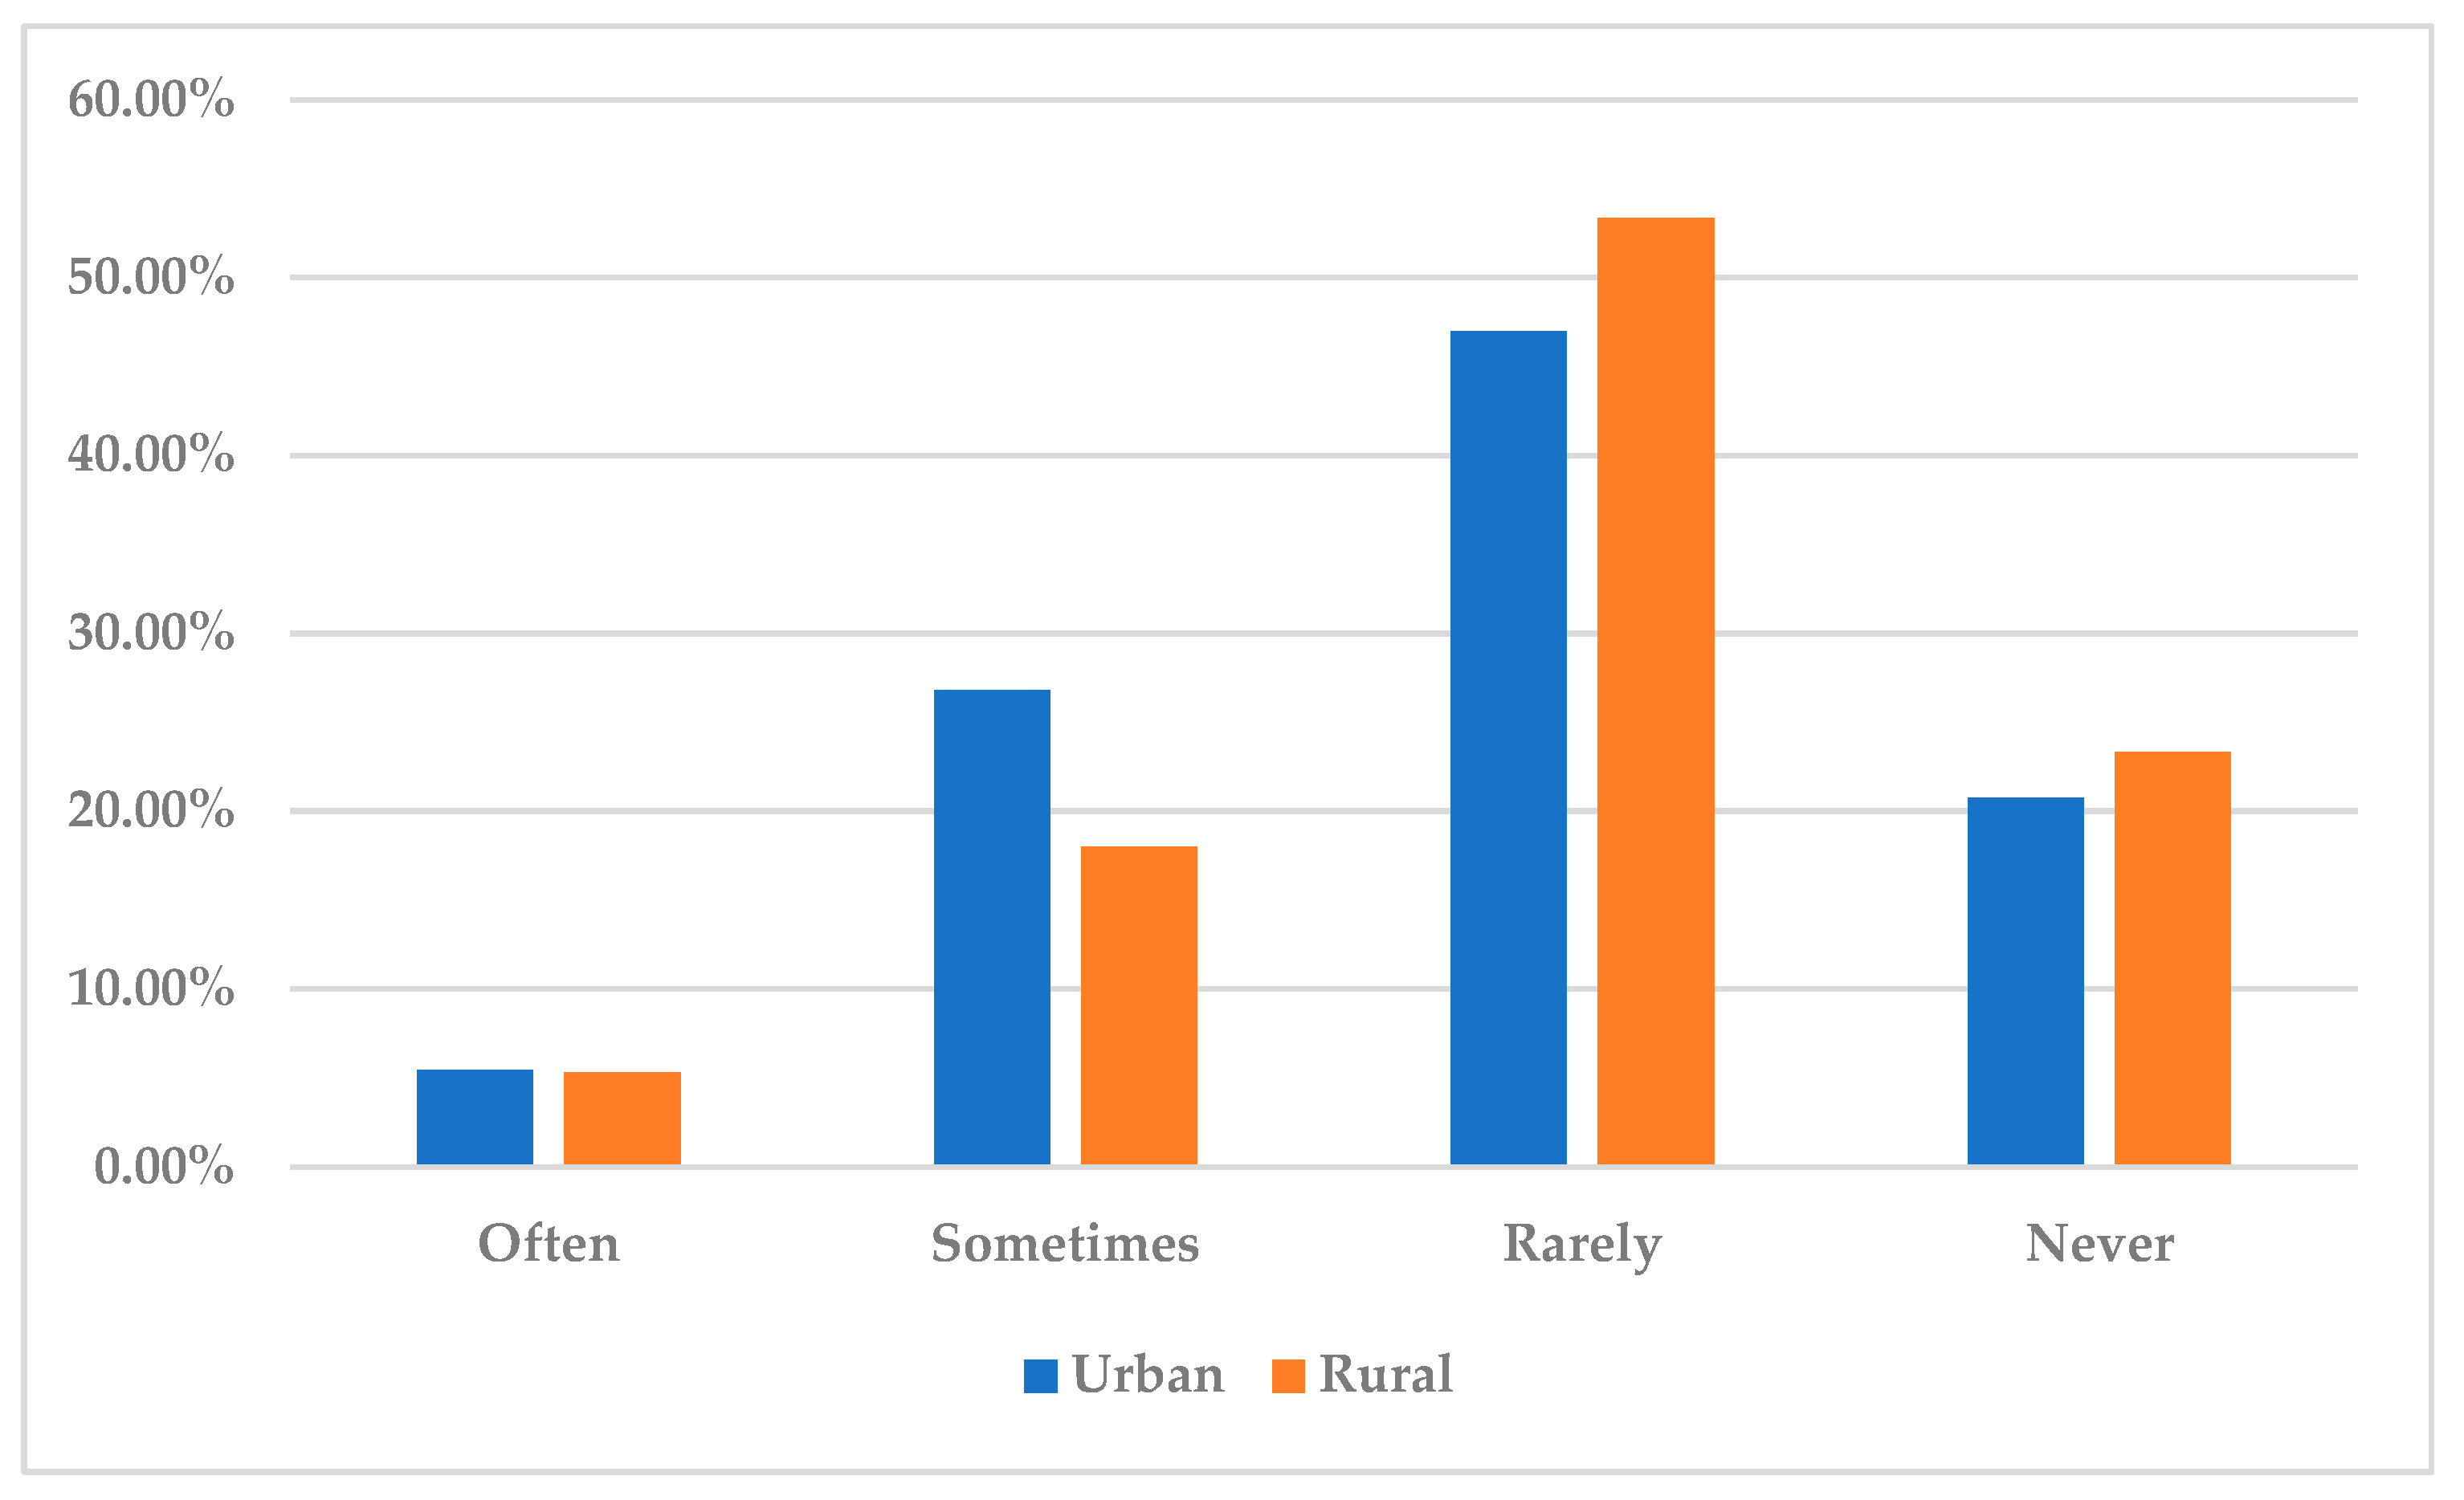
4.4. Differences in Attitudes toward Reducing Food Waste and Sorting Kitchen Waste between Urban and Rural Residents

Attitude has a significant impact on people’s behavior and can either facilitate or hinder their actions; a higher awareness of food conservation and a sense of guilt or wrongdoing when wasting food can prompt consumers to actively reduce food waste [81]. Some studies have shown that, unlike factors that contribute to food losses in the front end of the food supply chain, food waste is mainly influenced by human consciousness [89]. Consumers’ attitudes and willingness regarding food waste are likely to intervene in food waste behavior [38]. Other studies suggest that attitudes toward reducing food waste do not have a significant impact on actual behavioral changes [90,91]. The results of this study show that both urban and rural residents in Harbin have a very positive attitude towards reducing food waste and sorting kitchen waste. Interventions at the consumer level are promising in reducing food waste.
In general, the education level of urban residents in Harbin is higher than that of rural residents, but the problem of food waste is more severe in urban areas. The reasons for this situation are as follows. (1) Urban residents usually have higher living standards and consumption power and are accustomed to buying more food and eating out more frequently, thus making them more prone to food waste. (2) Urban residents pay more attention to food safety issues. They attach more importance to the quality and shelf life of food. If the quality of the food is poor or it has exceeded the shelf life, they are more likely to choose to discard it rather than consume it. (3) By observing the daily timeline of urban and rural residents, it can be seen that the pace of life for urban residents is usually faster and time is tight, which may lead to the improper preservation and storage of some food, resulting in waste.

4.5. Recommendations

Harbin’s urban and rural populations have significant differences in lifestyles, consumption habits, and socioeconomic development, so different policies need to be formulated to reduce food waste. Here are some key suggestions with significant policy implications:
Common recommendations:
(1) Encourage restaurants/takeout restaurants to offer different portion sizes to meet people’s varying appetite needs. In urban households, given the small family size, it is easy to encounter the problem of inappropriate food portions when dining out. Rural residents have diverse preferences for flavors and restaurants can meet their needs by offering small portions of food. Restaurants offering food in different portion sizes can meet the varying needs of different appetites, which can effectively reduce food waste when eating out.
(2) Encourage taking away leftovers. This behavior can avoid food waste and extend the shelf life of food for later consumption. The government can encourage consumers to take away leftovers by offering rewards. For example, consumers who dine out without wasting food could receive point rewards, which could then be redeemed for environmentally friendly gifts such as shopping bags, utensils, water bottles, and other eco-friendly items. This not only reduces food waste but also promotes environmental awareness.
(3) Establishment of a food waste management institution is suggested, which should be included in the work scope of the government’s functional department. This food waste management institution should be established at different levels and be responsible for formulating and improving specialized action plans and programs to combat food waste in households. In addition, supporting equipment for garbage sorting should be introduced and a garbage classification system should be implemented in both urban and rural areas.
(4) Strengthen policy implementations. In accordance with the national policy on food waste reduction, specific implementation plans should be developed with clear responsibilities assigned to units and individuals and an assessment mechanism established to ensure effective policy implementation. In addition, funding and resources should be increased to provide support for policy implementation and ensure its success.
To urban residents:
(1) Raise awareness among residents to reduce food waste. Urban residents have a higher level of education and income, which leads to a higher amount of food waste. Therefore, raising the awareness of urban residents can significantly reduce food waste with less effort. First, food waste awareness campaigns can be launched through various media outlets, with the Internet being the primary platform for urban residents. Second, relevant educational activities can be carried out in communities, such as organizing practical activities for food waste reduction and kitchen waste sorting and encouraging residents to actively participate. In addition, the government can formulate relevant policies and measures, such as recognizing and rewarding individuals and organizations that save food and reduce waste, to widely promote the dissemination and food waste reduction in society.
(2) Develop new technologies for food preservation and quality assurance. Generally speaking, food transportation time in cities is longer than in rural areas. To improve the quality of household food procurement and reduce food waste, it is not only necessary to improve the efficiency of food transportation in cities and ensure the freshness of food but also to develop new technologies to ensure the freshness of food or extend its shelf life.
(3) Encourage various units to establish canteens and manage food in a unified way. Most urban residents are office workers with fast-paced lifestyles and cannot manage food promptly. Units establishing canteens and providing three meals a day can save residents’ time buying and cooking food, reducing the amount of food stored at home and thus food waste caused by expired or spoiled food. In addition, food management by units can also help reduce food waste.
To rural residents:
(1) Guide residents in developing reasonable food purchase plans or organizing group purchases. Community or village committees regularly provide training for rural residents on how to make reasonable food purchase plans and how to allocate food purchases according to factors such as family size, dietary habits, and seasonal changes. Therefore, this can reduce food waste caused by rural residents buying too much food.
(2) Train rural residents on how to order takeaway food services. The trend of ordering takeaway food services in rural areas has not been popular for long and many rural residents are not proficient in using takeaway food apps. They may order too much or not estimate the amount of food correctly, resulting in food waste. Training rural residents on how to use takeaway food services can help them better understand the usage methods and precautions of takeaway food and avoid waste caused by unfamiliarity. Training could include how to place orders correctly, how to choose appropriate quantities of food, how to store leftover food, and so on. This could also be an opportunity to promote anti-food waste knowledge, raising the awareness and vigilance of residents toward food waste.

5. Conclusions

This research took Harbin as a case study to illustrate the current situation and trends of food waste in the city; to compare and analyze the generation of food waste among urban and rural residents and the differences between them; to review national and local anti-food waste policies and strategies; to propose recommendations for preventing and reducing food waste among urban and rural residents. By formulating policies that take into account urban–rural differences, we can target the specific needs of each region and effectively reduce food waste, promoting sustainable development in Harbin. The findings of this research can serve as a reference for other areas as well. This research found that: (1) the population of Harbin is decreasing, but the total amount of food waste is still increasing; (2) although Harbin City has shown a positive response to the national anti-food waste policy, its implementation effect is not significant; (3) the impact of COVID-19 on the dietary habits of urban residents is greater than that of rural residents, especially in terms of eating out; (4) the food waste amount of urban residents in Harbin is significantly higher than that of rural residents; (5) urban residents generate food waste because of factors such as food quality considerations, balanced nutrition, and large portion sizes; (6) rural residents generate food waste because of factors such as excessive food consumption and the desire to try various dishes; (7) the waste sorting facilities and regulations in Harbin are not sufficiently complete. Based on these results, this research proposes some recommendations: (1) encourage restaurants/takeout restaurants to offer different portion sizes to meet people’s varying appetite needs; (2) encourage taking away leftovers; (3) establish a food waste management institution that should be included in the government’s functional department’s work scope; (4) strengthen the implementation of policies; (5) raise awareness among urban residents to reduce food waste; (6) develop new technologies for food preservation and quality assurance; (7) encourage various units to establish canteens and manage food in a unified way; (8) guide rural residents in developing reasonable food-purchasing plans or organizing group purchases; (9) train rural residents on how to order takeaway food services.
The data used in this study are genuine and reliable. However, given the limited sample size, the representativeness of the data may be restricted, requiring more data support and further analysis. In addition, external environmental factors such as the research season may also have some impact on the results, so more data from different seasons are needed to verify the stability and reliability of the results. Finally, COVID-19 has had a huge impact on the dietary habits of residents; after COVID-19 becomes normalized, further research is needed to determine whether urban and rural residents’ dietary habits will return to those experienced before COVID-19 or will continue to maintain current patterns.

Author Contributions

Conceptualization by C.L. (Chang Liu), J.S. and C.L. (Chen Liu); methodology, data analysis, and writing by C.L. (Chang Liu) and C.L. (Chen Liu); questionnaire design by C.L. (Chen Liu); phone survey implementation and data collection by C.L. (Chang Liu), H.W. and S.W.; writing—review and editing by J.S. and C.L. (Chen Liu). All authors have read and agreed to the published version of the manuscript.

Funding

This research was funded by the program of China Scholarships Council (202206600025) and supported by the Institute for Global Environmental Strategies (IGES) under the Strategic Research Fund 2021–2023 and ERIA-IGES Fund 2022 and the Environment Research and Technology Development Fund (S-21) of the Environmental Restoration and Conservation Agency of Japan, Development of an Integrated Assessment Model linking Biodiversity and Socio-Economic Drivers, and its Social Application (IAM-B) (2023–2027).

Institutional Review Board Statement

Not applicable.

Informed Consent Statement

Not applicable.

Data Availability Statement

Not applicable.

Acknowledgments

The authors would like to thank the urban and rural residents of Harbin who participated in the study and would also like to express gratitude to the referees for their useful comments.

Conflicts of Interest

The authors declare no conflict of interest.

References

  1. Ozkaya, F.T.; Durak, M.G.; Dogan, O.; Bulut, Z.A.; Haas, R. Sustainable consumption of food: Framing the concept through Turkish expert opinions. Sustainability 2021, 13, 3946. [Google Scholar] [CrossRef]
  2. FAO. The State of Food Security and Nutrition in the World 2022: Repurposing Food and Agricultural Policies to Make Healthy Diets More Affordable; Food and Agriculture Organization: Rome, Italy, 2022; Available online: https://reliefweb.int/report/world/state-food-security-and-nutrition-world-2022-repurposing-food-and-agricultural-policies-make-healthy-diets-more-affordable-enarruzh?gclid=Cj0KCQjwxYOiBhC9ARIsANiEIfays924V7bFGt3J5fwRzfFPQhB2Ef_oVpkONfSvSlWz3LxUi1N7Ff8aAuHuEALw_wcB (accessed on 20 April 2023).
  3. FAO. The State of Food Security and Nutrition in the World 2019; Food and Agriculture Organization: Rome, Italy, 2019; Available online: https://www.wfp.org/publications/2019-state-food-security-and-nutrition-world-sofi-safeguarding-against-economic (accessed on 20 April 2023).
  4. Zhang, M.; Chen, S.; Li, S. Life Cycle-Based Case Study of Greenhouse Gas Emissions and Emission Reduction from Food Consumption in Beijing Flavor Restaurants. Adv. Clim. Chang. Res. 2021, 17, 140–150. [Google Scholar]
  5. UNEP Food Waste Index Report 2021. United Nations Environment Programme. 2021. Available online: https://www.unep.org/resources/report/unep-food-waste-index-report-2021 (accessed on 4 April 2023).
  6. Ritchie, H.; Food Waste Is Responsible for 6% of Global Greenhouse Gas Emissions. Our Wold in Data 2020. Available online: https://ourworldindata.org/food-waste-emissions (accessed on 3 April 2023).
  7. FAO. The State of Food and Agriculture 2019; Food and Agriculture Organization: Rome, Italy, 2019; Available online: https://www.fao.org/3/ca6030en/ca6030en.pdf (accessed on 21 April 2023).
  8. FAO. Food Wastage Footprint: Impacts on Natural Resources; Food and Agriculture Organization: Rome, Italy, 2013; Available online: http://www.fao.org/3/a-i2697e.pdf (accessed on 21 April 2023).
  9. Schneider, F. Review of food waste prevention on an international level. Waste Resour. Manag. 2013, 166, 187–203. [Google Scholar] [CrossRef]
  10. Lipinski, B. Reducing Food Loss and Waste. World Resources Institute. 2013. Available online: https://www.wri.org/publication/reducing-food-loss-and-waste (accessed on 21 April 2023).
  11. Feng, Y.; Marek, C.; Tosun, J. Fighting Food Waste by Law: Making Sense of the Chinese Approach. J. Consum. Policy 2022, 45, 457–479. [Google Scholar] [CrossRef]
  12. Chen, C. EU Anti-Food Waste Practice Experience and Insights. World Agric. 2022, 12, 24–33. [Google Scholar]
  13. Shen, Y.Z.; Niu, K.Y.; Song, R.; Liu, J.; Zhu, T.; Weng, L.P. Anti-food waste policies on the ground: International experience and local practice. Agric. Resour. Zoning China 2023, 44, 119–129. [Google Scholar]
  14. Werf, P.; Seabrook, J.A.; Gilliland, J.A. The quantity of food waste in the garbage stream of southern Ontario, Canada households. PLoS ONE 2018, 13, e0198470. [Google Scholar]
  15. Adelodun, B.; Kim, S.H.; Choi, K.S. Assessment of food waste generation and composition among Korean households using novel sampling and statistical approaches. Waste Manag. 2021, 12, 72–80. [Google Scholar] [CrossRef]
  16. Everitt, H.; Werf, P.; Seabrook, J.A.; Wray, A.; Gilliland, J.A. The quantity and composition of household food waste during the COVID-19 pandemic: A direct measurement study in Canada. Socio-Econ. Plan. Sci. 2022, 82, 101110. [Google Scholar] [CrossRef]
  17. Ilakovac, B.; Voca, N.; Pezo, L.; Cerjak, M. Quantification and determination of household food waste and its relation to sociodemographic characteristics in Croatia. Waste Manag. 2020, 102, 231–240. [Google Scholar] [CrossRef]
  18. Withanage, S.V.; Dias, G.M.; Habib, K. Review of household food waste quantification methods: Focus on composition analysis. J. Clean. Prod. 2021, 279, 123722. [Google Scholar] [CrossRef]
  19. Moult, J.A.; Allan, S.R.; Hewitt, C.N.; Berners-Lee, M. Greenhouse gas emissions of food waste disposal options for UK retailers. Food Policy 2018, 77, 50–58. [Google Scholar] [CrossRef] [Green Version]
  20. Sarker, A.; Ghosh, M.K.; Islam, T.; Bilal, M.; Nandi, R.; Raihan, M.L.; Hossain, M.N.; Rana, J.; Barman, S.K.; Kim, J.E. Sustainable Food Waste Recycling for the Circular Economy in Developing Countries, with Special Reference to Bangladesh. Sustainability 2022, 14, 12035. [Google Scholar] [CrossRef]
  21. Zhu, M.X.; Luo, Y.; Huang, H.Q.; Huang, D.; Wu, L.P. Characteristics, environmental impacts and countermeasures of food waste in Chinese rural households. Agric. Mod. Res. 2022, 43, 948–956. [Google Scholar]
  22. Shahbaz, P.; Ul Haq, S.; Abbas, A.; Samie, A.; Boz, I.; Bagadeem, S.; Yu, Z.; Li, Z. Food, Energy, and Water Nexus at Household Level: Do Sustainable Household Consumption Practices Promote Cleaner Environment? Int. J. Environ. Res. Public Health 2022, 9, 12945. [Google Scholar] [CrossRef] [PubMed]
  23. Schanes, K.; Dobernig, K.; Gözet, B. Food waste matters-A systematic review of household food waste practices and their policy implications. J. Clean. Prod. 2018, 182, 978–991. [Google Scholar] [CrossRef]
  24. Ananda, J.; Karunasena, G.G.; Mitsis, A.; Kansal, M.; Pearson, D. Analysing behavioural and socio-demographic factors and practices influencing Australian household food waste. J. Clean. Prod. 2021, 306, 127280. [Google Scholar] [CrossRef]
  25. Nakamura, K.; Kojima, D.; Ando, M. What reduces household food waste in Japan? Nation-Wide and region-specific contributing factors in urban and rural areas. Sustainability 2022, 14, 3174. [Google Scholar] [CrossRef]
  26. Li, Y.; Wang, L.E.; Liu, G.; Cheng, S. Rural household food waste characteristics and driving factors in China. Resour. Conserv. Recycl. 2021, 164, 105209. [Google Scholar] [CrossRef]
  27. Haas, R.; Aşan, H.; Doğan, O.; Michalek, C.R.; Karaca Akkan, Ö.; Bulut, Z.A. Designing and Implementing the MySusCof App—A Mobile App to Support Food Waste Reduction. Foods 2022, 11, 2222. [Google Scholar] [CrossRef]
  28. Hanson, V.; Ahmadi, L. Mobile applications to reduce food waste within Canada: A review. Can. Geogr. Le Géographe Can. 2022, 66, 402–411. [Google Scholar] [CrossRef]
  29. GP. A Review of Low-Carbon Management for the Whole Life Cycle of Kitchen Waste. Greenpeace International 2021. Available online: https://www.greenpeace.org.cn/2021/07/19/kitchen-waste-life-cycle-management-report-pr-20210716/ (accessed on 22 April 2023).
  30. WWF Report on Food Waste in Urban Catering in China. World Wide Fund for Nature 2018. Available online: https://www.wwfchina.org/news-detail?id=1810&type=3 (accessed on 22 April 2023).
  31. Jiang, J.Q.; Yu, T.E.; Huang, W.Z.; Wang, Z. Size estimation and determinants analysis of household food waste in China. Agric. Technol. Econ. 2018, 9, 88–99. [Google Scholar]
  32. Qian, L.; Rao, Q.L.; Li, F. Food waste of rural residents and its influencing factors—Taking staple food waste as an example. J. Jiangnan Univ. 2021, 20, 47–57. [Google Scholar]
  33. HLPE Food Losses and Waste in the Context of Sustainable Food Systems; Food and Agriculture Organization: Rome, Italy, 2014. Available online: http://iufost.org/iufostftp/FLW-%20FAO.pdf (accessed on 23 April 2023).
  34. Luo, Y.; Wang, H.R.; Miao, H.M.; Huang, D.; Han, Y.; Zhu, J.F. Obesity and food waste in Chinese rural households: An empirical analysis based on survey data from 1562 farm households. J. Nat. Resour. 2022, 37, 2559–2571. [Google Scholar]
  35. WRAP Household Food and Drink Waste in the United Kingdom 2012. Waste and Resources Action Programme 2012. Available online: https://wrap.org.uk/resources/report/household-food-and-drink-waste-united-kingdom-2012 (accessed on 24 April 2023).
  36. Sun, G.H. Harbin City waste treatment and disposal status and management. Heilongjiang Sci. Technol. Inf. 2016, 10, 298. [Google Scholar]
  37. Xuan, L.L.; Ma, D.Y. The problem of urban domestic waste and its management: Harbin City as an example. J. Harbin Univ. Commer. 2014, 1, 89. [Google Scholar]
  38. Liu, C.; Cai, X.M.; Bunditsakulchaib, P.; Sasakic, S.; Hotta, Y. Food waste in Bangkok: Current situation, trends and key challenges. Resour. Conserv. Recycl. 2020, 157, 104779. [Google Scholar] [CrossRef]
  39. Kish, L. Survey Sampling. Biom. J. 1965, 10, 88–89. [Google Scholar]
  40. Li, L.M. Study on the method of sample size allocation under stratified sampling. Stat. Decis. Mak. 2015, 19, 18–20. [Google Scholar]
  41. Jackson, J.; Murphy, P. Clusters in Regional Tourism an Australian case. Ann. Tour. Res. 2006, 33, 1018–1035. [Google Scholar] [CrossRef]
  42. Li, M.L.; Qiu, H.L.; Xu, H.Q.; Shu, B.Y. Comparison of the impact of online sample base surveys and telephone surveys on research results. Stat. Decis. Mak. 2019, 35, 14–19. [Google Scholar]
  43. Verhulst, P.F. Mathematical Researches into the Law of Population Growth Increase. New Mem. R. Acad. Sci. Fine Lett. Bruss. 1945, 18, 1–42. [Google Scholar]
  44. Fisher Box, J. Guinness, Gosset, Fisher, and Small Samples. Stat. Sci. 1987, 2, 45–52. [Google Scholar]
  45. Liu, H.Y. Applied Psychostatistics; Beijing Normal University Press: Beijing, China, 2015; pp. 172–173. [Google Scholar]
  46. Edwards, A.W.F. RA Fisher, Statistical Methods for Research Workers, 1925. In Landmark Writings in Western Mathematics: Case Studies; Elsevier Science: Amsterdam, The Netherlands, 2005; pp. 1640–1940. [Google Scholar]
  47. Liu, J. Application of Single factor Analysis of Variance. Prose Hundred 2016, 6, 150. [Google Scholar]
  48. Heilongjiang Daily News. 120 Tons of Kitchen Waste, How Much Food Is Wasted Every Day in Harbin. Available online: https://hlj.sina.cn/news/haerbin/2020-08-17/detail-iivhuipn9033818.d.html?pos=347 (accessed on 29 April 2023).
  49. Harbin Bureau of Statistics. Harbin Statistical Yearbook 2021. Available online: http://www.harbin.gov.cn/art/2023/4/4/art_39_1372063.html (accessed on 29 April 2023).
  50. National Bureau of Statistics. Statistical Yearbook 2022. Available online: http://www.stats.gov.cn/sj/ndsj/2022/indexch.htm (accessed on 30 April 2023).
  51. Harbin Municipal People’s Government Website. Announcement of Harbin Municipal Administration for Market Regulation on Collecting Clues of Violations in “Anti-Food Waste Special Action”. Available online: http://www.harbin.gov.cn/art/2023/4/25/art_4955_1377762.html (accessed on 30 April 2023).
  52. People’s Government of Heilongjiang Province Website. Three Departments in Harbin City Issued a Call to Action to Reduce Food Waste in the Catering Industry. Available online: https://www.hlj.gov.cn/hlj/c107858/202304/c00_31574949.shtml (accessed on 30 April 2023).
  53. The Labor Contract Law of the People’s Republic of China. Household Annual Income Level Classification. Available online: https://lvlin.baidu.com/question/992867107635866379.html (accessed on 3 May 2023).
  54. Zhu, L.L. Classified Citizenship of Agricultural Transferred Population in the Urbanization Process of Harbin City. Shanxi Agric. Econ. 2017, 12, 15. [Google Scholar]
  55. Shimpo, M.; Akamatsu, R.; Kojima, Y.; Yokoyama, T.; Okuhara, T.; Chiba, T. Factors Associated with Dietary Change since the Outbreak of COVID-19 in Japan. Nutrients 2021, 13, 2039. [Google Scholar] [CrossRef]
  56. Peking University Legal Information Platform. The General Office of the Communist Party of China Central Committee and the General Office of the State Council Issued the “Opinions on Practicing Frugality and Opposing Food Waste”. Available online: https://www.pkulaw.com/chl/93e666fb03f5e10bbdfb.html (accessed on 5 May 2023).
  57. Peking University Legal Information Platform. People′s Republic of China Anti-Food Waste Law. Available online: https://www.pkulaw.com/chl/97d7d0ae995676c1bdfb.html (accessed on 5 May 2023).
  58. Northeast Network. Implementation Plan for Practicing Thrift and Opposing Food Waste in Heilongjiang Province. Available online: https://heilongjiang.dbw.cn/system/2014/07/15/055855012.shtml (accessed on 5 May 2023).
  59. Harbin Municipal People’s Government Website. Harbin Urban Kitchen Waste Management Measures. Available online: http://www.harbin.gov.cn/art/2019/8/21/art_727_775632.html (accessed on 5 May 2023).
  60. Harbin Municipal People’s Government Website. The Harbin Market Supervision Bureau Has Fully Deployed a Special Campaign to Curb Food Waste in the Catering Industry. Available online: http://xxgk.harbin.gov.cn/art/2023/3/27/art_13135_1372168.html (accessed on 5 May 2023).
  61. Li, L.L.; Qiao, D.; Cheng, H. “Operation CD-ROM”, continuous promotion. People′s Dly. 2022, 1. [Google Scholar] [CrossRef]
  62. People’s Network. In Response to the Central Government’s Call, a New Wave of “Operation Clean Plate” Has Been Launched Everywhere. Available online: https://baike.baidu.com/reference/4306554/363dvp6Ak1dJdFBwYvq2fnCo-4ut1KiFWHzaAF6fYbdiCylOo90xyeD-0CN4WxZOk89Dd0cYS0RaTdWBsBjbvareSWcWvKUByS4427LsqqBRNp46YdmvX9Rtmw (accessed on 7 May 2023).
  63. Liao, F. A study of the factors influencing food waste behavior based on an extended MOA mode. J. Shanxi Agric. Univ. 2022, 21, 99–108. [Google Scholar]
  64. Wu, Y.; Tian, X.; Li, X.; Yuan, H.; Liu, G. Characteristics, influencing factors, and environmental effects of plate waste at university canteens in Beijing, China. Resources Conserv. Recycl. 2019, 149, 151–159. [Google Scholar] [CrossRef]
  65. Schneider, F. Wasting Food—An Insistent Behavior. Research Gate 2008. Available online: https://www.researchgate.net/publication/237566848_Wasting_food-An_insistent_behaviour (accessed on 7 May 2023).
  66. Zhang, H.; Duan, H.; Andric, J.M.; Song, M.; Yang, B. Characterization of household food waste and strategies for its reduction: A Shenzhen City case study. Waste Manag. 2018, 78, 426–433. [Google Scholar] [CrossRef]
  67. Ganglbauer, E.; Fitzpatrick, G.; Comber, R. Negotiating food waste: Using a practice lens to inform design. Negot. Food Waste 2013, 20, 11. [Google Scholar] [CrossRef]
  68. Stancu, V.; Haugaard, P.; Lhteenmki, L. Determinants of consumer food waste behaviour: Two routes to food waste. Appetite 2016, 96, 7–17. [Google Scholar] [CrossRef] [PubMed]
  69. Abdelradi, F. Food waste behaviour at the household level:A conceptual framework. Waste Manag. 2018, 71, 485–493. [Google Scholar] [CrossRef]
  70. Aschemann-Witzel, J.; Giménez, A.; Ares, G. Household food waste in an emerging country and the reasons why: Consumer’ s own accounts and how it differs for target groups. Resour. Conserv. Recycl. 2019, 145, 332–338. [Google Scholar] [CrossRef]
  71. Van, S.J.G.; Woodburn, M.J. Food discard practices of householders. J. Am. Diet. Assoc. 1987, 87, 322–329. [Google Scholar]
  72. Quested, T.E.; Marsh, E.; Stunell, D.; Parry, A.D. Spaghetti soup: The complex world of food waste behaviors. Resour. Conserv. Recycl. 2013, 79, 43–51. [Google Scholar] [CrossRef]
  73. Porpino, G.; Wansink, B.; Parente, J. Wasted Positive Intentions: The Role of Affection and Abundance on Household Food Waste. J. Food Prod. Mark. 2015, 22, 733–751. [Google Scholar] [CrossRef] [Green Version]
  74. Richter, B.; Bokelmann, W. Explorative study about the analysis of storing, purchasing and wasting food by using household diaries. Resour. Conserv. Recycl. 2017, 125, 181–187. [Google Scholar] [CrossRef]
  75. Zepeda, L.; Balaine, L. Consumers′ perceptions of food waste: A pilot study of U.S. students. Int. J. Consum. Stud. 2017, 41, 627–637. [Google Scholar] [CrossRef]
  76. Carmo, S.; Dutra, D. Drivers and barriers to food waste reduction. Br. Food J. 2018, 120, 2364–2387. [Google Scholar]
  77. Wang, L.E.; Liu, G.; Liu, X.; Liu, Y.; Gao, J.; Zhou, B.; Gao, S.; Cheng, S. The weight of unfinished plate: A survey-based-characterization of restaurant food waste in Chinese cities. Waste Manag. 2017, 66, 3–12. [Google Scholar] [CrossRef] [PubMed]
  78. Zhang, P.P.; Wang, L.; Bai, J.; Liu, X.; Cheng, S.; Fu, S. A study on food waste behavior of restaurant consumers in tourist cities. Resour. Sci. 2018, 40, 1186–1195. [Google Scholar]
  79. Ludovica, P. Towards Zero Waste: An Exploratory Study on Restaurant managers. Int. J. Hosp. Manag. 2018, 74, 130–137. [Google Scholar]
  80. Song, L.; Yang, J.X.; Tong, D.J.; Wen, J.W. A study on the level of food waste and its influencing factors in catering takeaway—Taking school students in Anhui Province as an example. Arid Zone Resour. Environ. 2022, 36, 113–119. [Google Scholar]
  81. Mattar, L.; Abiad, M.G.; Chalak, A.; Diab, M.; Hassan, H. Attitudes and behaviors shaping household food waste generation: Lessons from Lebanon. J. Clean. Prod. 2018, 198, 1219–1223. [Google Scholar] [CrossRef]
  82. Zhu, Q.; Li, F.; Qian, Z. A study on the waste profile of canteen food and its takeaway carbon footprint in Chinese universities and colleges: A survey based on 9660 questionnaires from 30 universities and colleges in 30 provinces (cities). Arid Zone Resour. Environ. 2020, 34, 49–55. [Google Scholar]
  83. Qiu, Z.Q.; Meng, B.W.; Lin, Y.X.; Chen, S. A study on the current situation of separating and disposing of take-out leftover food waste by university students. Mod. Food 2019, 5, 187–191. [Google Scholar]
  84. Chen, S. Analysis of the current situation of take-out food waste and the influencing factors of college students in higher education. Food Saf. Guide 2018, 33, 50. [Google Scholar]
  85. Lian, T.; Haq, S.U.; Shahbaz, P.; Zhao, L.; Nadeem, M.; Aziz, B. Changing Food Patterns during the Pandemic: Exploring the Role of Household Dynamics and Income Stabilization Strategies. Sustainability 2023, 15, 123. [Google Scholar] [CrossRef]
  86. Secondi, L.; Principato, L.; Laureti, T. Household food waste behaviour in EU-27 countries: A multilevel analysis. Food Policy 2015, 56, 25–40. [Google Scholar] [CrossRef]
  87. Cecere, G.; Mancinelli, S.; Mazzazti, M. Waste Prevention and Social Preferences: The Role of Intrinsic and Extrinsic Motivations. Ecol. Econ. 2014, 10, 163–176. [Google Scholar] [CrossRef] [Green Version]
  88. Qi, D.; Lai, W.; Roe, B.E. Food waste declined more in rural Chinese households with livestock. Food Policy 2020, 98, 101893. [Google Scholar] [CrossRef]
  89. Luo, Y.; Huang, D.; Wu, L.P. Household food waste in rural China: A noteworthy reality and a systematic analysis. Waste Manag. Res. 2021, 39, 1389–1395. [Google Scholar] [CrossRef] [PubMed]
  90. Barr, S.; Gilg, A.W.; Ford, N.J. Difference between household waste reduction, reuse and recycling behaviour: A study of reported behaviors, intentions and explanatory variables. Environment. Waste Manag. 2001, 4, 69–82. [Google Scholar]
  91. Lober, D.J. Municipal solid waste policy and public participation in household source reduction. Waste Manag. 1996, 14, 125–143. [Google Scholar] [CrossRef]
Figure 1. MSW collected and transported and population from 2006 to 2021 in Harbin.
Sustainability 15 11122 g001
Figure 2. FW generation and FW generation per capita from 2006 to 2021 in Harbin.
Sustainability 15 11122 g002
Figure 3. Timeline of working/school days for urban and rural residents in Harbin.
Sustainability 15 11122 g003aSustainability 15 11122 g003b
Figure 4. Timeline of holidays for urban and rural residents in Harbin.
Sustainability 15 11122 g004
Figure 5. Eating habits across different age groups.
Sustainability 15 11122 g005
Figure 6. Trends in the eating habits of urban and rural residents in the coming years.
Sustainability 15 11122 g006
Figure 7. The average amount of food waste generated per day by households in urban and rural areas.
Sustainability 15 11122 g007
Figure 8. Methods of managing/disposing the generated food waste by urban and rural residents.
Sustainability 15 11122 g008
Figure 9. Changes in household food waste before COVID-19 to now by urban and rural households.
Sustainability 15 11122 g009
Figure 10. Frequency of food waste at home among urban and rural residents.
Sustainability 15 11122 g010
Figure 11. Reasons for food waste at home by urban and rural residents.
Sustainability 15 11122 g011
Figure 12. Frequency of food waste among urban and rural residents when eating out.
Sustainability 15 11122 g012
Figure 13. Frequency of food waste among urban and rural residents when eating out.
Sustainability 15 11122 g013
Figure 14. Frequency of food waste among urban and rural residents when ordering food delivery services.
Sustainability 15 11122 g014
Figure 15. Reasons for food waste by urban and rural residents when ordering food delivery services.
Sustainability 15 11122 g015
Figure 16. Household separation of kitchen waste.
Sustainability 15 11122 g016
Figure 17. The respondents’ attitudes on garbage sorting.
Sustainability 15 11122 g017
Figure 18. The respondents’ attitudes towards reducing food waste.
Sustainability 15 11122 g018
Figure 19. The timeline of major national and local policies related to food waste.
Sustainability 15 11122 g019
Table 1. The sample size of the public questionnaire.
NumberRegionNumber of People
1Daoli District30
2Daowai District21
3Nangang District36
4Xiangfang District29
5Pingfang District6
6Songbei District11
7Hulan District20
8Acheng District13
9Shuangcheng District17
10Bayan Country20
11Bin Country22
12Wuchang Country35
13Mulan Country9
14Tonghe Country11
15Yilan Country13
16Fangzheng Country9
17Yanshou Country9
18Shangzhi Country22
Total333
Table 2. Selection and handling of model variables.
Variable NameVariable Definition and AssignmentMeanStandard Deviation
Food waste
(Y)
High frequency = 1,
Low frequency = 0
0.260.44
Gender
(X1)
Male = 1,
Female = 0
0.490.50
Age
(X2)
<=30 = 1, 31–40 = 2, 41–50 = 3, 51–60 = 4, >60 = 52.392.44
Area
(X3)
Urban areas = 1, Rural areas = 00.550.50
Education level
(X4)
No schooling = 1, Primary school = 2,
Middle school = 3, Technical school = 4,
High school = 5, Vocational or technical university = 6,
University = 7, Master’s degree or higher = 8
5.551.58
Annual household income (X5)CNY 30,000 and below = 1, CNY 30,001–80,000 = 2, CNY 80,001–150,000 = 3, CNY 150,001–300,000 = 4, CNY 300,001–1 million = 5,
More than CNY 1 million = 6
3.231.14
Table 3. Attributes of respondents.
CharacteristicsUrban AreasRural AreasTotal
Number of RespondentsPercentageNumber of RespondentsPercentageNumber of RespondentsPercentage
Gender:
  • Male
9350.82%7449.33%16750.15%
  • Female
9049.18%7650.67%16649.85%
Age:
  • 30 years old and below
4222.95%5436.00%9628.83%
  • 31–40 years old
5530.05%5939.33%11434.23%
  • 41–50 years old
5228.42%1711.33%6920.72%
  • 51–60 years old
2915.85%149.33%4312.91%
  • Over 60 years old
52.73%64.00%113.3%
Occupation
  • Leaders of government departments, enterprises and institutions, party and government organizations, and public organizations at all levels
158.20%117.33%267.81%
  • Professionals and technicians (teachers, doctors, engineers, writers, and other professionals)
3619.67%1510.00%5115.32%
  • Employees (those engaged in general affairs)
4122.40%74.67%4814.41%
  • Tertiary industry service workers (drivers, hotel caterers, and other service industry workers)
2413.11%117.33%3510.51%
  • Individual operators
2513.66%85.33%339.9%
  • Workers
168.74%21.33%185.41%
  • Farmers
00.00%7550.00%7522.52%
  • Housewives
52.73%21.33%72.1%
  • Students (universities, colleges, etc.)
84.37%74.67%154.5%
  • Freelance
52.73%96.00%144.2%
  • Unemployed (including retirees)
84.37%32.00%113.3%
Education
  • Illiterate or semi-literate
000000
  • Elementary school
0053.33%51.50%
  • Junior high school
73.83%2818.67%3510.51%
  • Junior college
2513.66%3221.33%5717.12%
  • High school
2815.30%3322.00%6118.32%
  • College
4725.68%2919.33%7622.82%
  • Undergraduate
4122.40%2013.33%6118.32%
  • Master’s and above
3519.13%32.00%3811.41%
Annual household income
  • CNY 30,000 and below
21.09%96.00%113.30%
  • CNY 30,001–80,000
5932.24%5536.67%11434.23%
  • CNY 80,001–150,000
5731.15%4429.33%10130.33%
  • CNY 150,001–300,000
2915.85%2214.67%5115.32%
  • CNY 300,001–1 million
3016.39%1510%4513.51%
  • More than CNY 1 million
63.28%53.33%113.30%
Table 4. Logistic regression model results.
Odds RatioStandard ErrorzP > |z|(95% Conf. Interval)
X11.8910.4982.420.016 *1.1283.170
X21.0250.0550.460.6450.9221.139
X30.8660.246−0.510.6130.5001.513
X41.2330.1132.270.023 *1.0291.477
X51.3700.1562.770.006 **1.0961.712
* shows significance at the 95% confidence level. ** shows significance at the 99% confidence level.
Table 5. The average number of times eating out, ready-made meals, eating in, takeaway order of ingredients, and takeaway order of ready-made meals a week.
Eating Preference (Times/Week)Urban AreasRural AreasTotal
Eating out1.831.271.58
Ready-made meals1.851.671.77
Eating in5.235.585.39
Takeaway order of ingredients1.682.472.04
Takeaway order of ready-made meals2.411.251.89
Table 6. The average number of times eating out, ready-made meals, eating in, takeaway order of ingredients, and takeaway order of ready-made meals a week.
Eating PreferencePr(|T| > |t|)
Eating out0.0007 **
Ready-made meals0.2833
Eating in0.1372
Takeaway order of ingredients0.0002 **
Takeaway order of ready-made meals0.2084
** shows significance at the 99% confidence level.
Table 7. Prob > F value in the analysis of ANOVA results.
Eating PreferenceUrban Areas (Prob > F)Rural Areas (Prob > F)
Eating out0.0002 **0.2834
Ready-made meals0.0002 **0.0067 **
Eating in0.20370.0772
Takeaway order of ingredients0.0009 **0.4244
Takeaway order of ready-made meals0.0000 **0.2607
** shows significance at the 99% confidence level.
Disclaimer/Publisher’s Note: The statements, opinions and data contained in all publications are solely those of the individual author(s) and contributor(s) and not of MDPI and/or the editor(s). MDPI and/or the editor(s) disclaim responsibility for any injury to people or property resulting from any ideas, methods, instructions or products referred to in the content.

