Article

Optimization of Pressure Management in Water Distribution Systems Based on Pressure-Reducing Valve Control: Evaluation and Case Study

1
School of Astronautics, Harbin Institute of Technology, Harbin 150090, China
2
State Key Laboratory of Urban Water Resource and Environment, School of Environment, Harbin Institute of Technology, Harbin 150090, China
*
Authors to whom correspondence should be addressed.
Sustainability 2023, 15(14), 11086; https://doi.org/10.3390/su151411086
Submission received: 25 March 2023 / Revised: 11 July 2023 / Accepted: 14 July 2023 / Published: 16 July 2023

Abstract

:
Leakage in water distribution systems (WDS) is a major problem that results in substantial resource wastage. Pressure management, which is based on optimized control strategies using pressure-reducing valve installation, is considered one of the most effective methods for controlling network leakage and can be broadly classified into varied types, depending on the different control strategies. When facing diverse operational conditions in actual engineering, selecting the most suitable optimization strategy for the specific water supply network can greatly control leakage and efficiently utilize water resources. This article employs a greedy algorithm to iteratively determine the control sequence for pressure-reducing valves (PRVs), with the objective of minimizing surplus pressure. Subsequently, it proposed five evaluation indicators, namely, daily flow, daily leakage, pressure imbalance indicator, median daily pressure at nodes, and water age, which are used to evaluate and compare pressure management strategies in two sample networks. Finally, a suitable control strategy was successfully developed and implemented for an actual WDS of Y city in southern China, resulting in significant achievements. In conclusion, this paper embodies our attempt and contemplation in formulating pressure management strategies under diverse operating conditions in WDS, with the objective of providing guidance for practical engineering applications.

1. Introduction

A water distribution system (WDS), which serves as a crucial infrastructure for both livelihood and industrial production, possess a complex and extensive topological structure and constantly exhibit varying pressure state [1]. This presents a persistent challenge for water utilities, as they strive to ensure the crucial infrastructure is reliable [2].This is against a background of conflicting objectives relating to water network management: minimizing failure or minimizing the possibility of failure [3,4]. Furthermore, water utilities are deeply concerned about the economic advantages derived from operating WDS, in particular those relating to the reduction of water losses regarding the Economic Leakage Level [5,6,7,8]. Effective leakage control not only enhance the efficiency of water utilities, but also safeguards the water quality and infrastructure within the leakage-prone areas [9].
As cities grow, the amount of water leakage in their pipe networks increases. This is because water utility systems design their networks to maintain a minimum water pressure at all times, even during peak hours of consumption. However, this can lead to excessive pressure buildup during off-peak hours, which can cause pipes to crack or burst. Leakage is directly related to pressure, so high-pressure states in the network can significantly increase the frequency of leaks [10,11,12,13]. Although the leakage rate in the public water supply network has decreased from 2018 to 2021 in China, the leakage volume remained virtually constant at 80 billion m3, resulting in a significant waste of resources [14].
The International Water Association (IWA) has recommended a range of measures for leakage control methods that are widely recognized in the industry [15,16]. These measures focus on minimizing the economic level of leakage [6,17]. According to the methods proposed by the IWA, water utilities are actively engaged in developing new technologies to enhance the implementation of leakage reduction methods in WDSs [18]. Although expensive, pipe replacement is the most effective long-term solution among these methods for eliminating leakage at their source and reducing the amount of leakage while improving indicators such as water quality [19]. However, due to the high cost of this method, water suppliers prefer pipe rehabilitation when the damage to the pipe is minor, which has encouraged research into pipe rehabilitation materials and methods. The implementation of leak detection relies on the continuous monitoring of supervisory control and data acquisition (SCADA) systems, which determine the occurrence of pipe bursts based on flow and pressure information and provide timely location judgments in an effort to reduce the huge amount of leakage caused by bursts [20,21]. In addition to monitoring the occurrence of burst pipe incidents, leak detection also includes the monitoring of concealed leaks. Several researchers have worked on algorithms for the prediction of leaks and their locations, and have proposed many feasible optimisation algorithms [22,23]. Pressure management (PM) reduces leakage by lowering regional pressure levels within acceptable bounds to smooth out pressure variations by changing the pressure profile network [24]. Compared to pipe replacement, leak detection, and improved speed and quality of repairs, pressure management is more cost-effective and flexible [25,26,27]. Furthermore, pressure-managed networks can be adapted and updated to minimise leakage over a longer period [26,28,29].
PM is the process of adjusting the water pressure in a water distribution network to ensure that it is neither too high nor too low. This is important for a number of reasons: The prevention of leaks and bursts in pipes and ensuring that water is available at a sufficient pressure for all users [30]. The installation of pressure-reducing valves (PRVs) in over-pressured networks has proven to be an effective way of controlling leakage, and the application of pressure management techniques has reduced water supply costs by 20–55% [31]. There are four recognized PM methods for PRVs, which are based on the critical point states [32], namely fixed-outlet (FO), pressure-modulated, time-modulated (TM) and flow-modulated (FM) methods [24,33,34,35,36]. These techniques have been extensively studied by academics, and there are several case studies of their practical implementation, making them effective means of reducing pressure and leakage [37,38,39,40,41]. Previous research has revealed fixed-outlet pressure control does not achieve the goals for water loss [27,42]. Creaco et al., 2023 used a pressure-drop method in controlling PRVs for both remote and local modulation. The study revealed the ease of implementation and potential for modelling of flow-control valves in WDSs [43]. However, the majority of the studies focused on the isolated working of the instruments, and there are very limited studies involving the simultaneous simulation of multiple scenarios for the same pipe network [44,45]. And, there are few existing studies that combine the application and provide a detailed implementation process for all four methods simultaneously. This article provides a comprehensive description of the simulation process for the sample networks. The work also involves proposing a novel evaluation metric that differs completely from existing literature [4,13,24,46,47], along with deriving an expression for pressure imbalance.
In 2021, a target was set to lower the leakage rate of China’s urban public water supply network to less than 9% by 2025, which is undoubtedly a great challenge considering that the leakage rate in 2021 was 12.75%. This study intends to guide the development of PM in China’s water supply network and effectively reduce the excess pressure in the network, thereby reducing leakage and burst rates. This paper aims to guide and inspire pressure management in various complex pipeline network conditions, aiming for the efficient utilization of urban water resources, through the comparison of PRV control strategies using numerical schemes and practical engineering cases.

2. Methods

2.1. Construction of WDS Model

The Water Network Tool for Resilience (WNTR) toolbox, an EPANET Multi-Species Extension Software-compatible Python package, was used in this study to model and analyze the resilience of water supply networks, and, thus, for constructing and simulating pipe network models. The WNTR-PDD kernel was used for the simulations.
These simulations based on the ZJ Network and KL Network were provided by the University of Kentucky’s Water Distribution Systems Toolkit [48,49]. Both the ZJ Network and KL Network are a single-water-source WDS. The water pressure in these networks was regulated by installing a pressure-reducing valve (PRV) downstream of the water source. The ZJ Network consists of 115 nodes and 165 pipes, with a total pipe length of 126.4 km. The KL Network comprises 480 nodes and 733 pipes, with a total pipe length of 206.5 km. Figure 1 presents the topology diagram of the two sample networks.
In the ZJ Network, the maximum base demand among all nodes is 0.246 m3/s, with 2.6% of the total number of nodes having a demand of 0 m3/s. In the KL Network, the respective values are 0.008 m3/s and 29.4%. The elevation ranges of all nodes in the ZJ Network and KL Network are [3.91 m, 10.42 m] and [349.91 m, 366.37 m], respectively. The respective reservoir heads are 60.0 m and 413.3 m. Three customer water usage patterns were added to the sample network to simulate the changes in the network water usage over the course of a day: residential, small commercial, and large commercial. The main initial state of the two networks is as follows:
ZJ Network:
  • Initial daily flow rate: 128.448 × 10³ m3/d;
  • Daily leakage rate: 33.048 × 10³ m3/d;
  • Median daily pressure at nodes: 36.70 m.
KL Network:
  • Initial daily flow rate: 63.324 × 10³ m3/d;
  • Daily leakage rate: 19.872 × 10³ m3/d;
  • Median daily pressure at nodes: 51.48 m.
Table 1 presents the composition of their pipes.
In the ZJ Network, the maximum base demand among all nodes is 0.246 m3/s, with 2.6% of the total number of nodes having a demand of 0 m3/s. In the KL Network, the respective values are 0.008 m3/s and 29.4%. The elevation ranges of all nodes in the ZJ Network and KL Network are [3.91 m, 10.42 m] and [349.91 m, 366.37 m], respectively. The respective reservoir heads are 60.0 m and 413.3 m. Three customer water usage patterns were added to the sample network to simulate the changes in the network water usage over the course of a day: residential, small commercial, and large commercial. The main initial state of the two networks are as follows:
ZJ Network:
  • Initial daily flow rate: 128.448 × 10³ m3/d;
  • Daily leakage rate: 33.048 × 10³ m3/d;
  • Median daily pressure at nodes: 36.70 m.
KL Network:
  • Initial daily flow rate: 63.324 × 10³ m3/d;
  • Daily leakage rate: 19.872 × 10³ m3/d;
  • Median daily pressure at nodes: 51.48 m.
For each of the two sample networks, the leakage coefficient, a pseudo-random number obtained using the Mason rotation technique, was multiplied by the sum of the pipe diameters connected to the nodes to produce approximately 50 leakage points. The WNTR-PDD kernel model parameters were used, as shown in Table 2.
The relationship between pressure and nodal water demand was described using a segmentation function in an equation [50]. This paper utilized an exponential leakage model ( Q = C p γ , in which Q, C, p, and γ represent leakage rate (m3/s), discharge coefficient, pressure (m), and the pressure exponent, respectively) for the pressure–leakage relationship, and determined the approximate range of its pressure exponent based on relevant FAVAD theories [51,52].

2.2. PRV Control Strategy Based on Greedy Algorithm

To effectively utilize the function of PRV control in urban water supply networks, the control mode of PRVs should be optimized according to the operation of the network to achieve a better pressure and leakage reduction effect. In urban water supply networks, if the set value of the PRV is taken as the decision variable (independent variable) and the pressure at the most unfavorable point as the dependent variable (target quantity), it is difficult to find a clear functional relationship between the two variables when the network is in operation, which is similar to many optimization problems.
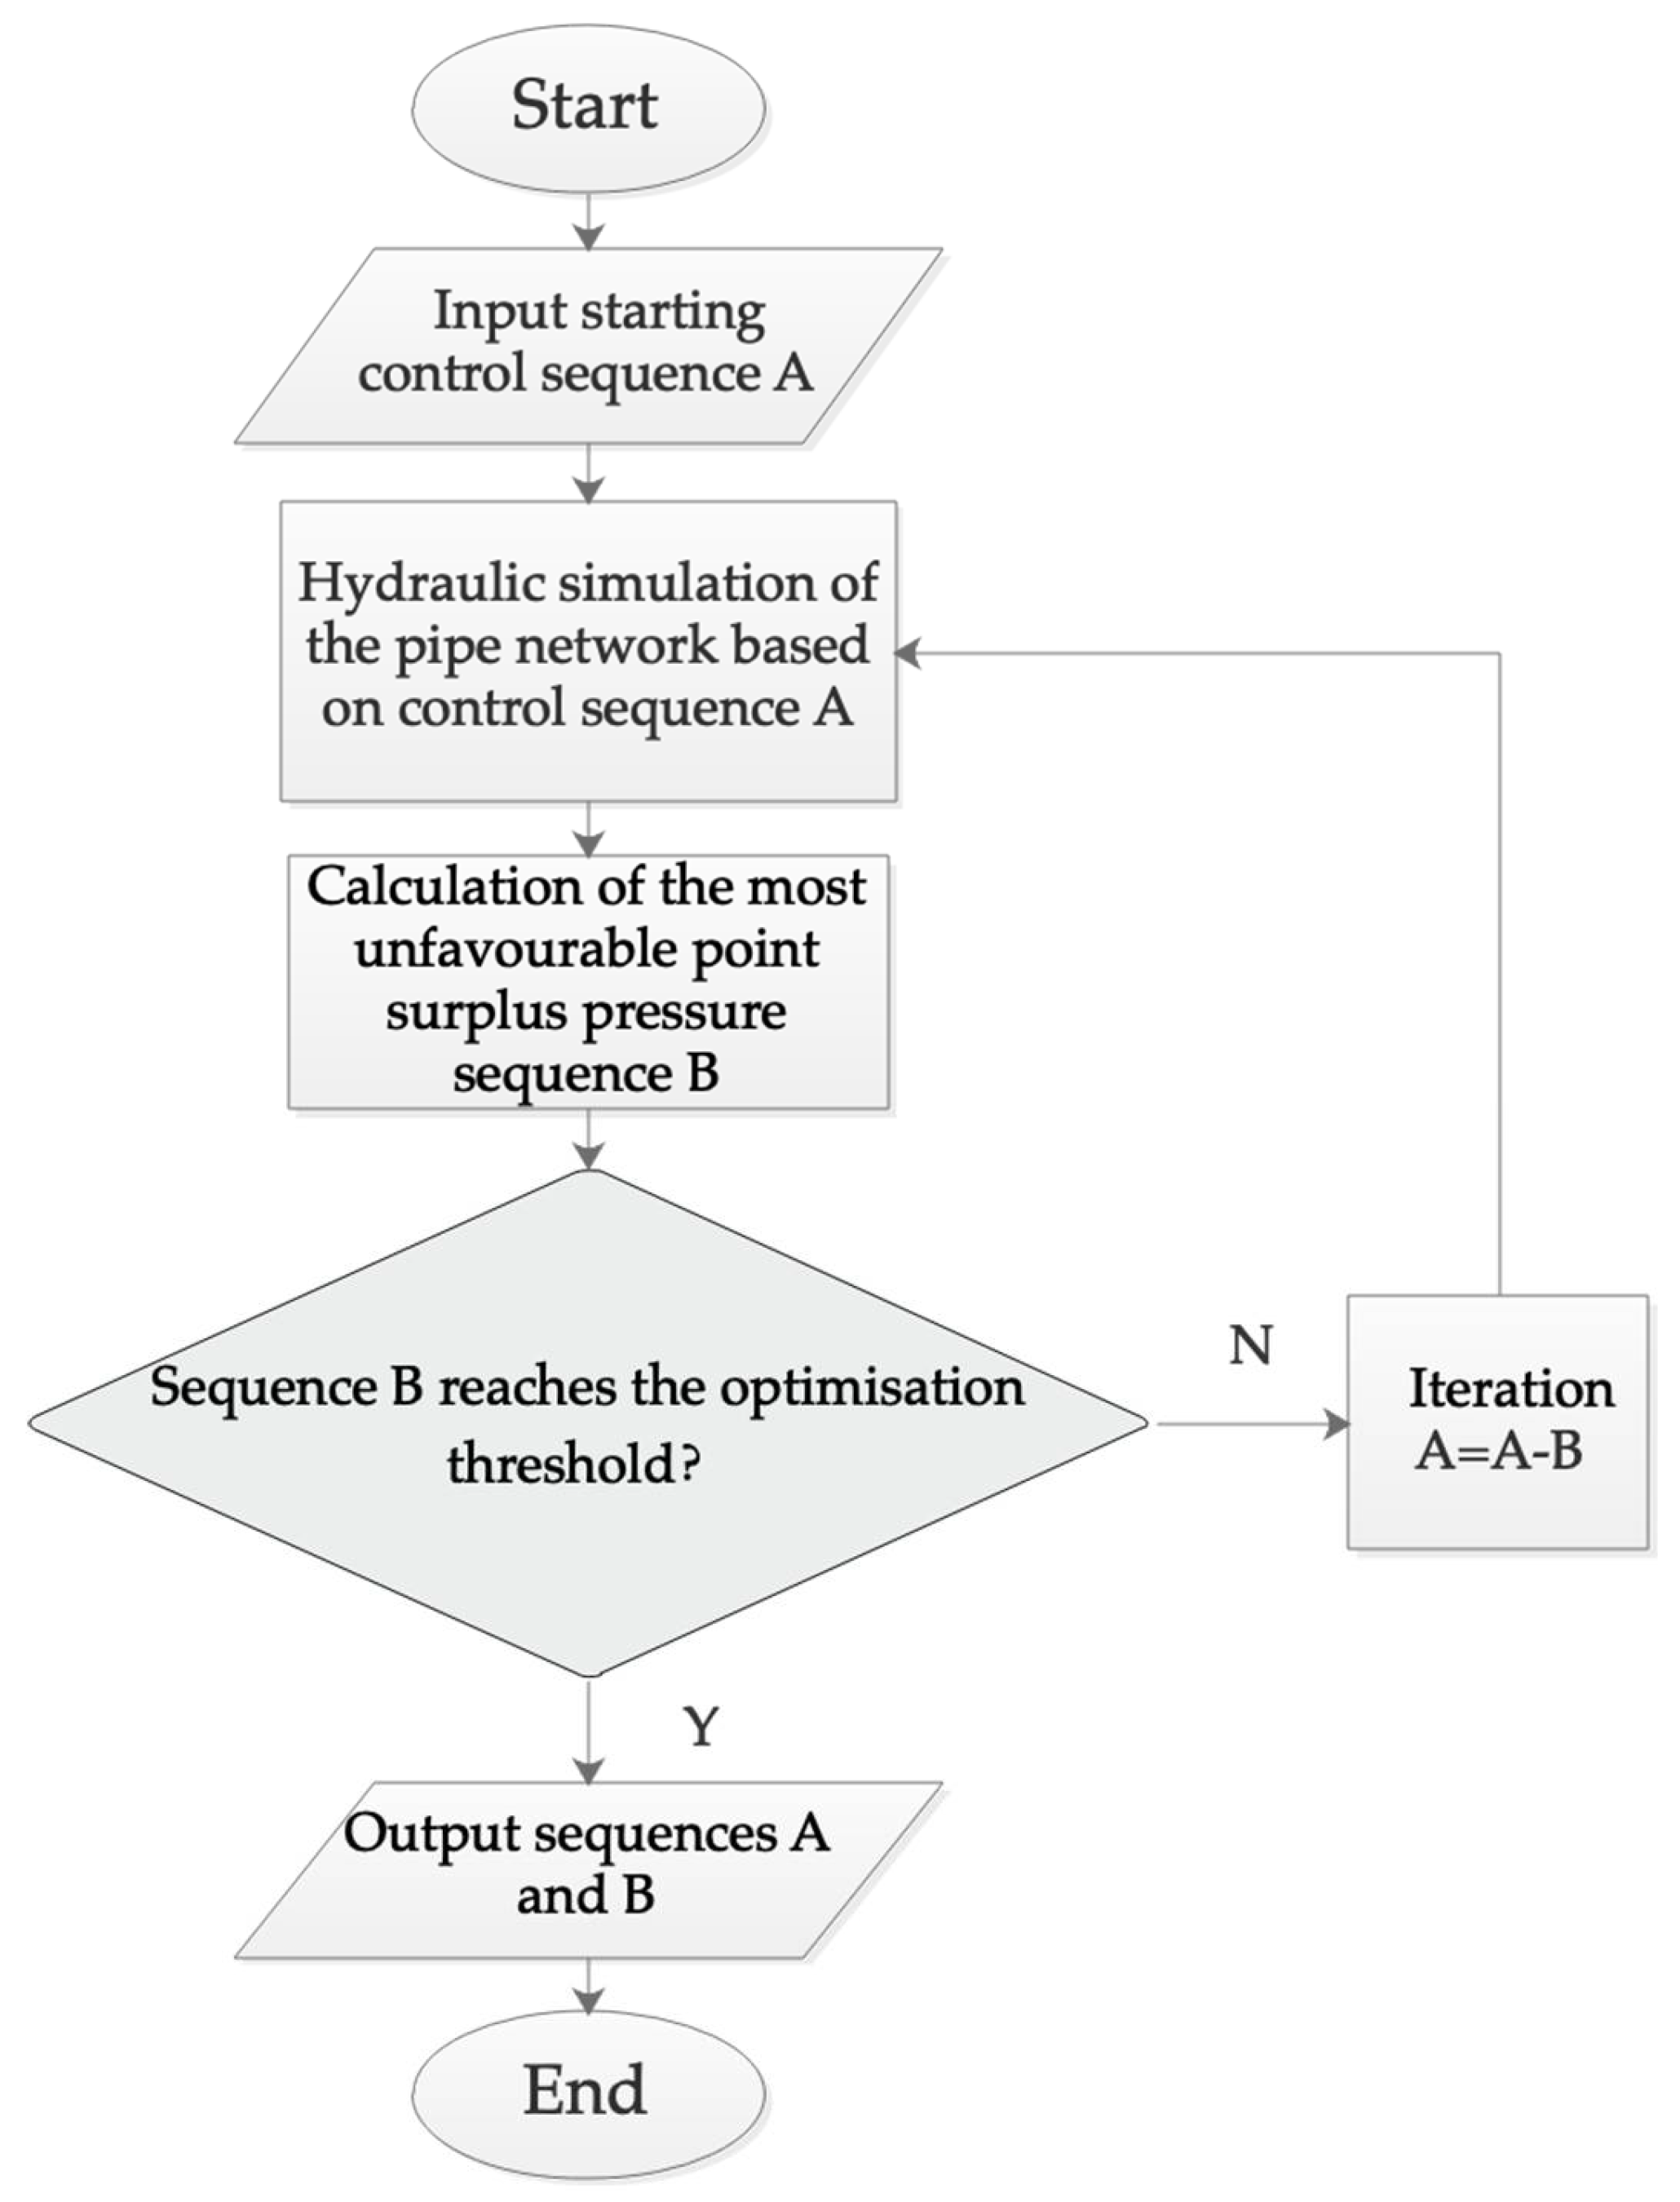
The laws of operation of the pipe network conform to the law of conservation of energy and the principle of entropy increase. If the pressure at the inlet of the pipe network decreases, the pressure at the nodes in the network cannot rise without the action of external forces. In other words, the direction of pressure change at the nodes should be the same as the direction of change in the set value of the PRV. In a stable model, the PRV setting, that is, the pressure at the most unfavorable point, should be monotonically increased as a function of time. To simulate this characteristic relationship, the concept of a greedy algorithm can be used to determine the optimal control sequence for the PRV in the model. Thus, a stepwise iterative method based on the greedy algorithm was developed to find the optimal solution to the PRV control sequence optimization problem. Figure 2 shows the algorithm flowchart.
A starting PRV control sequence A was entered as the input to initiate the model and iteration. Simulation was carried out to obtain the surplus water pressure sequence B for the most unfavorable point. Following a continuous step iteration that concluded when sequence B was within the tolerance range, the optimal sequence A was obtained, and the iteration was terminated.
According to the abovementioned approach, simulations were performed for the ZJ urban pipe network model under the following simulation conditions:
  • The length of the PRV control sequence should be the same as the length of the daily water usage variation factor sequence, which is 24.
  • The sequence of post-valve pressure values at the initial operating conditions of the model shall be used as the initial sequence A, as shown in Table 3 (pressure in the table indicates pressures after PRV).
  • The endpoint tolerance should be set to 1, i.e., the iteration ends when all the rich pressure values fall within the set [0, 1).
The control sequence A in the ZJ urban pipe network model went through five iterations under the simulation conditions before reaching the tolerance condition at the sixth solution. Figure 3 shows the variation of the control sequence and the sequence of residual pressure values between the two simulations during the iterative process. The lower red line represents the sequence of the most unfavorable point of surplus pressure values and the upper red line represents the sequence of PRV settings. The figure shows that during the iterative process, the surplus pressure values initially dropped rapidly, almost touching the tolerance line (green line), then gradually dropped close to the tolerance line, and, finally, all values fell below the calibrated 1 m tolerance line. At this point, the surplus pressure values were all positive. The sequence of PRV settings ended up in the upper blue part of the graph, representing the optimal PRV control sequence.

2.3. Methods for Evaluating the Effectiveness of Pressure Management Controls

In order to compare the differences, strengths, and weaknesses of different strategies, a series of evaluation metrics was developed. The indicator values were used as a basis to evaluate the results of the operation of the strategy in the model. There are two factions in a water supply network: supply and demand. The consumer expects the network to provide sufficient water pressure and the pressure to be as stable as possible. On the other hand, the water supplier wants to optimize the operation of the network and reduce water supply costs as much as possible while still meeting the requirements of the consumer. From these two perspectives, the following indicators were developed to evaluate the network:
  • Daily flow Q day
Q day = i = 1 24 q res - i
where:
  • Q day : Total daily flow rate of the pipe network, indicating the total amount of water flowing into the pipe network in a day (m3);
  • q res - i : Pipe network inlet flow for time i (m3/h).
2.
Daily leakage Q day - leak
Q day - leak = j J q j - leak = j J i = 1 24 q ij - leak
where:
  • Q day - leak : Daily leakage of the pipe network, indicating the total leakage of the network in a day (m3);
  • J: Collection of pipe network nodes;
  • q j - leak : Daily leakage at node j (m3);
  • q ij - leak : Leakage at time i for node j (m3/h).
3.
Pressure imbalance indicator P equ
P equ is a novel evaluation index introduced in this study to assess the overall pressure balance in a WDN. It mainly consists of the following three components.
  • i.
    Nodal daily overpressure factor fj
In the theoretical framework of the pressure-driven model, each node is assigned a nominal pressure [50]. In accordance with this theoretical framework, when the pressure at a node surpasses or equals the nominal pressure, the flow rate at that node becomes a constant value. The first component, f j , represents the average proportion of node pressures exceeding the nominal pressure within a day. A smaller positive value indicates preferable performance. The excess pressure beyond the nominal value does not affect the flow rate at the node and increases the overall pressure load in the WDNs.
f j = 1 24 i = 1 24 H ij H j nom H j nom
where:
  • f j : The average value of the ratio of the surplus nodal pressure to the nominal pressure during a day. When the value is positive, the smaller the value, the better;
  • H ij : Pressure of node j at time i (m);
  • H j nom : Nominal pressure at node j (m).
  • ii.
    Standard deviation of nodal day pressure σ j  
The standard deviation of nodal day pressure is used to characterize the fluctuation of water pressure that users experience within a day. A smaller value indicates greater stability at the node, which is desirable.
σ j = i = 1 24 H ij - H j ¯ 2 24
where:
  • σ j : The volatility of the water pressure received by the user during the day. The smaller the value the more stable the node;
  • H ij : Pressure value of node j at time i (m);
  • H j ¯ : Average daily pressure at node j (m).
  • iii.
    Nodal day water demand q j :
The Nodal day water demand varies among different nodes in the piping network. Nodes with higher Nodal day water demand serve a larger proportion of the overall user population in the network, signifying their greater significance. Therefore, this study employs Nodal day water demand as the weight of each node in the formula. The higher the water demand at a node, the higher its weight. Specifically, if the Nodal day water demand is zero, indicating a transfer node, its weight is also zero, contributing nothing to the P equ indicator.
  q j = i = 1 24 q ij
where:
q j : Nodal day water demand for node j (m3);
q i j : Actual water demand at time i for node j (m3/h).
In summary, by defining pressure imbalance as the sum of the products of the three indicators, a smaller value is desirable. This indicates that the WDN maintains a more balanced pressure throughout the day, enabling it to operate under a lower load.
The expression for pressure imbalance becomes
P equ = j J f j σ j q j = 1 48 6 j J i = 1 24 H ij - H j nom H j nom · q ij · i = 1 24 H ij H j ¯ 2
where:
  • P equ : pressure imbalance indicator.
4.
Median daily pressure at nodes P mid
P mid = median ( p j ¯ )
where:
  • P mid : Median daily value of nodal pressure (m). This indicator can characterize the median level of water pressure received by all consumers during the day;
  • p j ¯ : Average daily pressure at node j (m).
5.
Water age
The residence time of water in the pipe network directly affects the quality of the effluent at the consumer’s end. Thus, the change in water age under different operating strategies is also one of the indicators for evaluating the effectiveness of the control strategy.

2.4. Model Implementation of the Four Control Methods

The control strategy described in the previous sections generated an optimal PRV control sequence, wherein the set value of the PRV was changed hourly while maintaining synchronization with the change in the water usage pattern. However, in actual network operation, this time interval is not commonly used for control throughout the day, and, therefore, it needs to be discussed in relation to different network conditions. Currently, there are four widely recognized control modes for PRV, which are as follows: FOPM, pressure-modulated PM (PMPM), TMPM, and FMPM, which have been already introduced.

2.4.1. FOPM

The key to this control method was to maintain the pressure at the critical point above the minimum service pressure throughout the day. When the valve operation was stable, the post-valve pressure fluctuated around the set value. To obtain a precise solution, the optimal control sequence A can be determined via the methodology outlined in Section 2.2. The resulting maximum pressure value can be utilized as a constant post-pressure value for the valve throughout the day.

2.4.2. TMPM

In the present study, a control period was defined as a day (24 h) split into several successive periods, each with a corresponding PRV setpoint. The time periods were combined with the corresponding control values to form control segments, each with a fixed valve back pressure control, and all control segments were combined in sequence to form a control mode. The number of segments in an actual pipe network does not normally exceed 8.
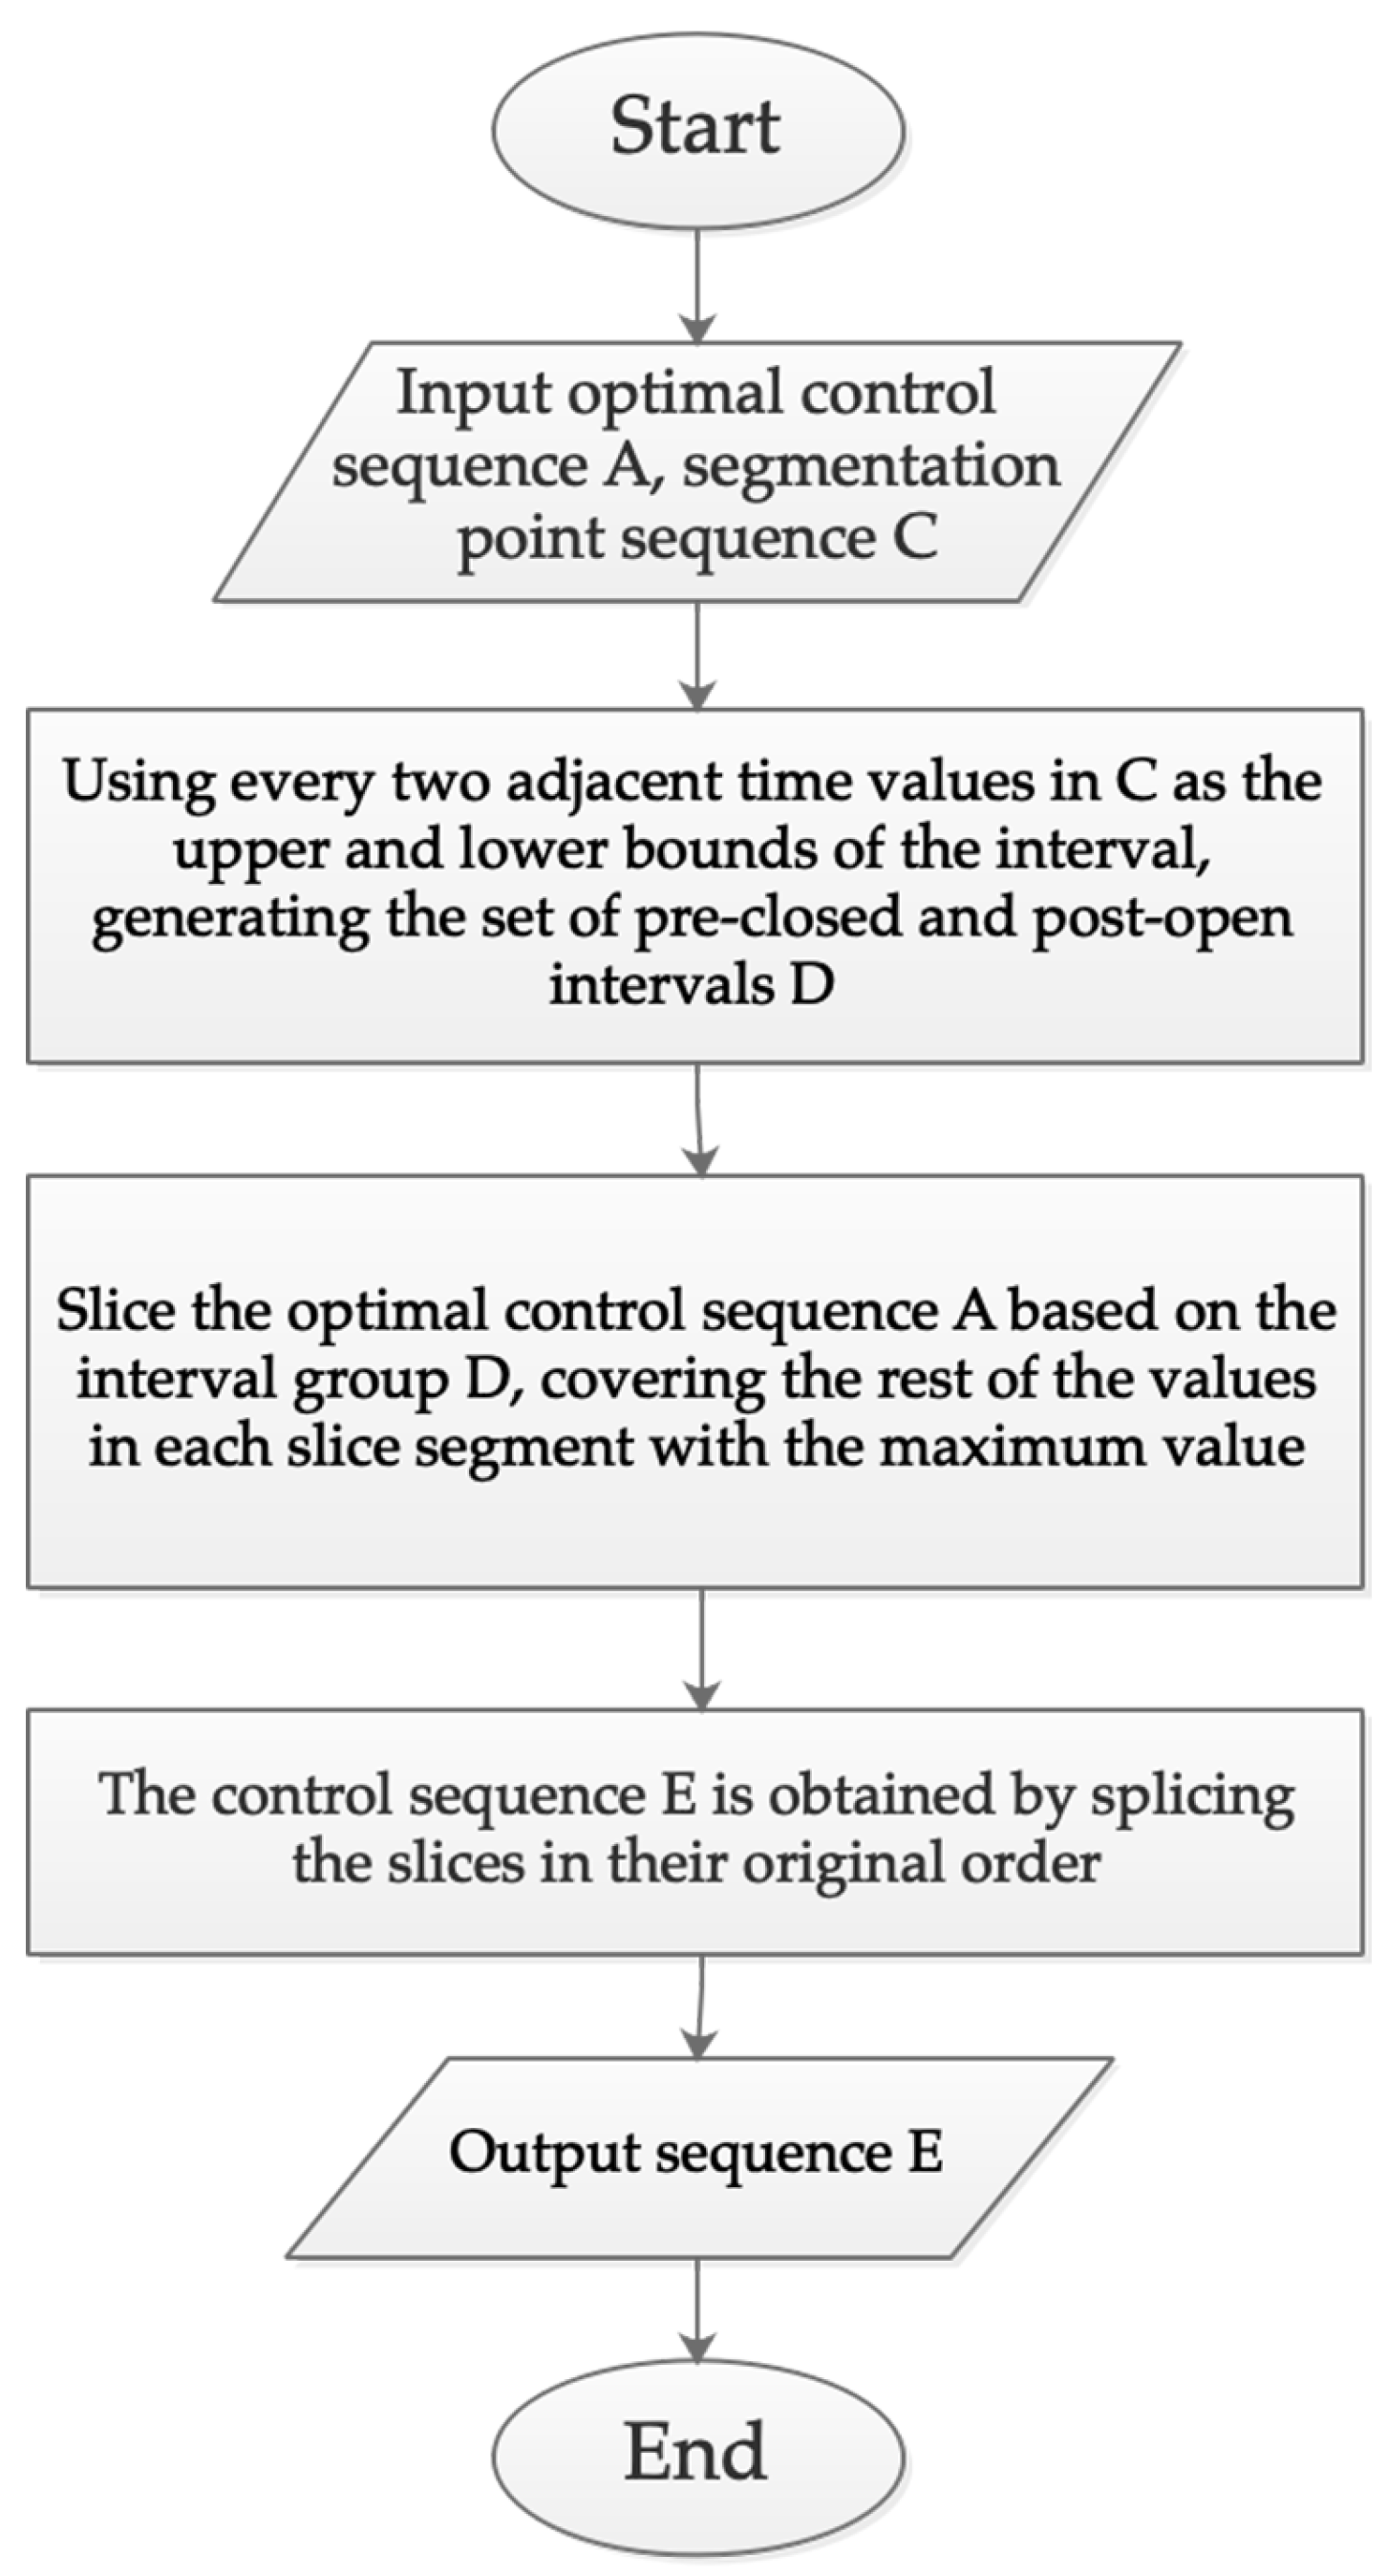
TMPM consists of a time segment and a segment pressure. In this study, the control model was based on the optimal control sequence discussed in the previous section and the segment pressure was solved using the time segments to form the final control model. Figure 4 shows the solution flowchart for the segmental pressure sequence.
The segment point control sequence C was a sequence of integers with each value representing the start time of the next interval (included) and the end time of the previous interval (not included). For example, if the sequence was 3, then the corresponding segments were {[3, 10), [10, 20), [20, 3)}.

2.4.3. FMPM

A series of operational data were recorded during the optimization process by applying the PRV control strategy based on the greedy algorithm to the sample pipe network. This helped in generating a series of ΔP-Q values (post-valve flow and PRV-critical-point pressure drop), from which a complete fitted curve y containing the most data points was obtained, with the data points fluctuating in the vicinity of y. This y curve was used to solve for the flow–pressure curve in the control. The equation is obtained as follows:
f q q = y q + H min
where:
  • fq: Flow–pressure control curves;
  • H min : Minimum service pressure at the critical point (10 m);
  • y : Total fitted curve of the post-valve flow PRV to the least favorable pressure drop value in the sample pipe network.
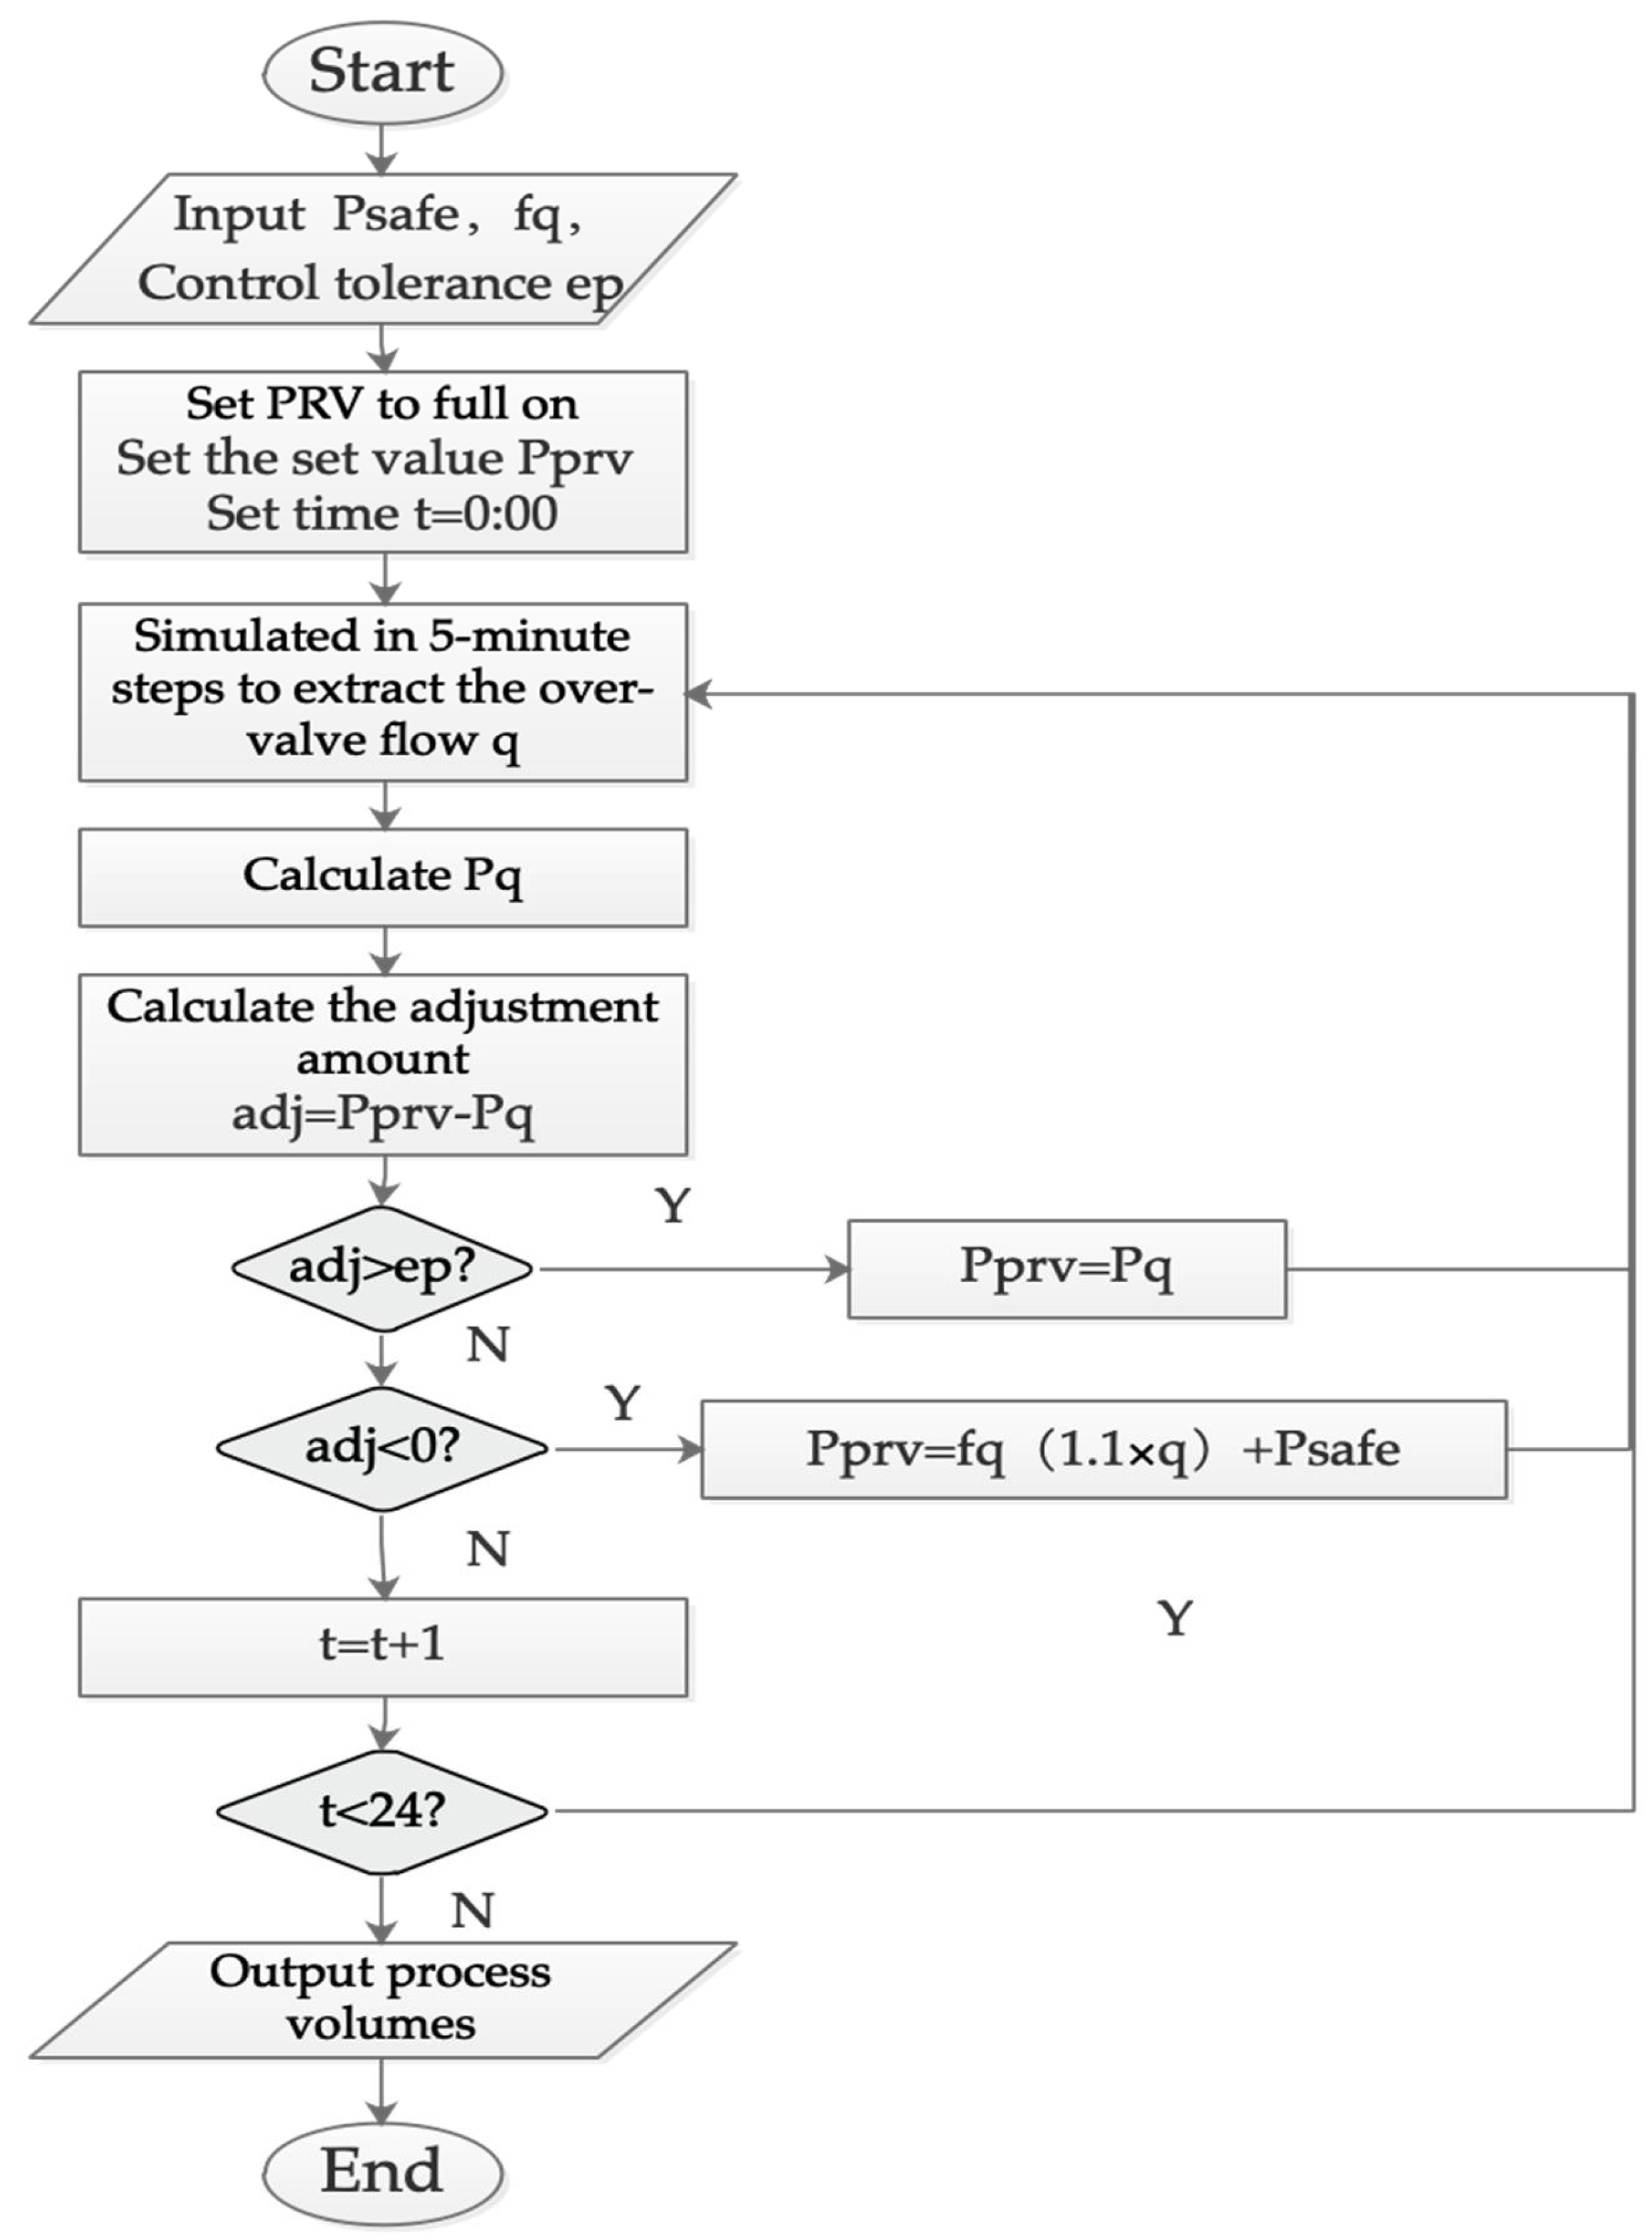
To avoid pressure shortfalls, a control safety margin was set in the flow-based control Psafe, considering the pressure fluctuations, and added to fq. Therefore, the post-valve pressure setting at a given moment of flow q becomes:
P q = f q q + P safe  
where:
  • Pq: Target PRV control value (m);
  • f q : Flow–pressure control curves;
  • Psafe: Control of safety margins (m).
Figure 5 shows the flow of FMPM employed in the model.

2.4.4. PMPM

PMPM requires the establishment of one or more pressure-monitoring points within the network, usually at the potential critical point. The PRV controller receives real-time pressure feedback and modulates the network pressure changes by increasing the outlet pressure of the PRV when the pressure is low and decreasing it when the pressure is high. This method of control is very flexible as it does not rely on pre-set curves or values. However, the method is heavily dependent on real-time communication, and if reliable information on the critical point pressure is not available, pressure adjustment will be difficult to continue.
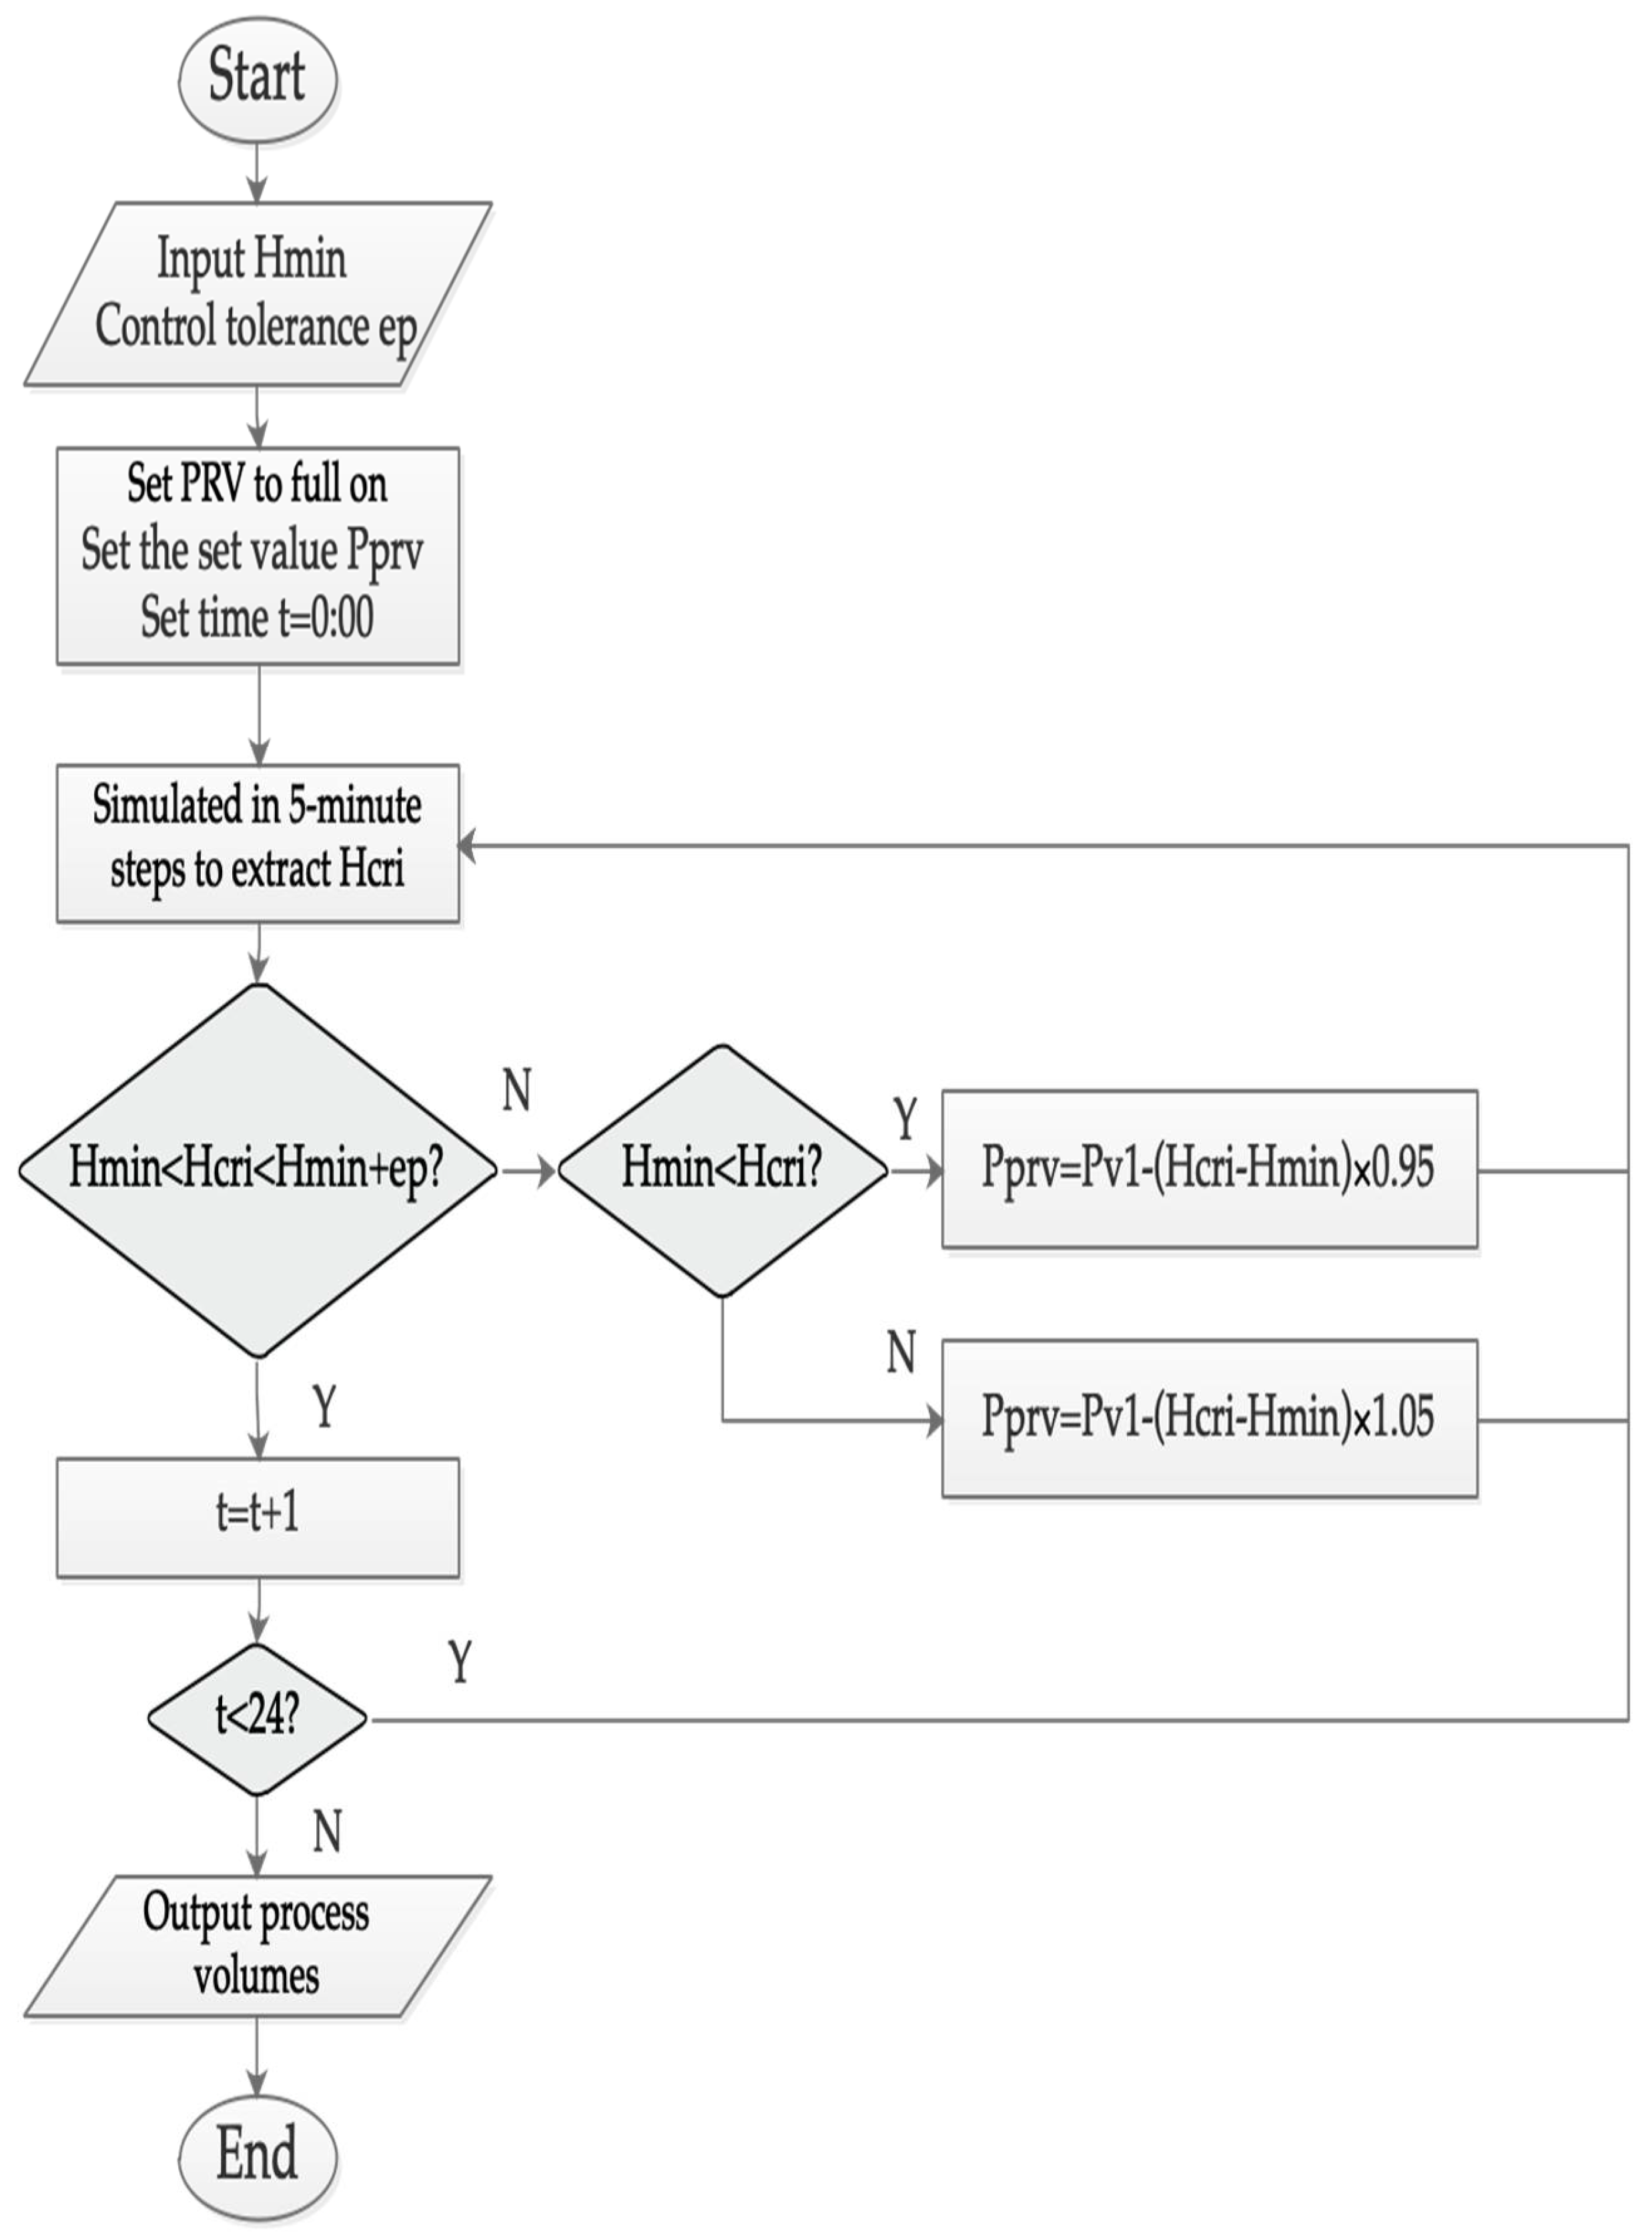
In this study, the PRV setpoint in the pipe network model was adjusted every 5 min depending on the pressure at the critical point, as modelled in actual operation. The setpoint was determined using the following formula:
P v 2 = P v 1 -   ( H cri - H min )
where:
  • P v 2 : Target PRV control value (m);
  • P v 1 : Previous PRV control value (m);
  • H cri : Pressure at the critical point (m);
  • H min : Minimum service pressure at the critical point (m).
Figure 6 shows the process for PMPM used in the model.

3. Results and Case Study

3.1. ZJ Network

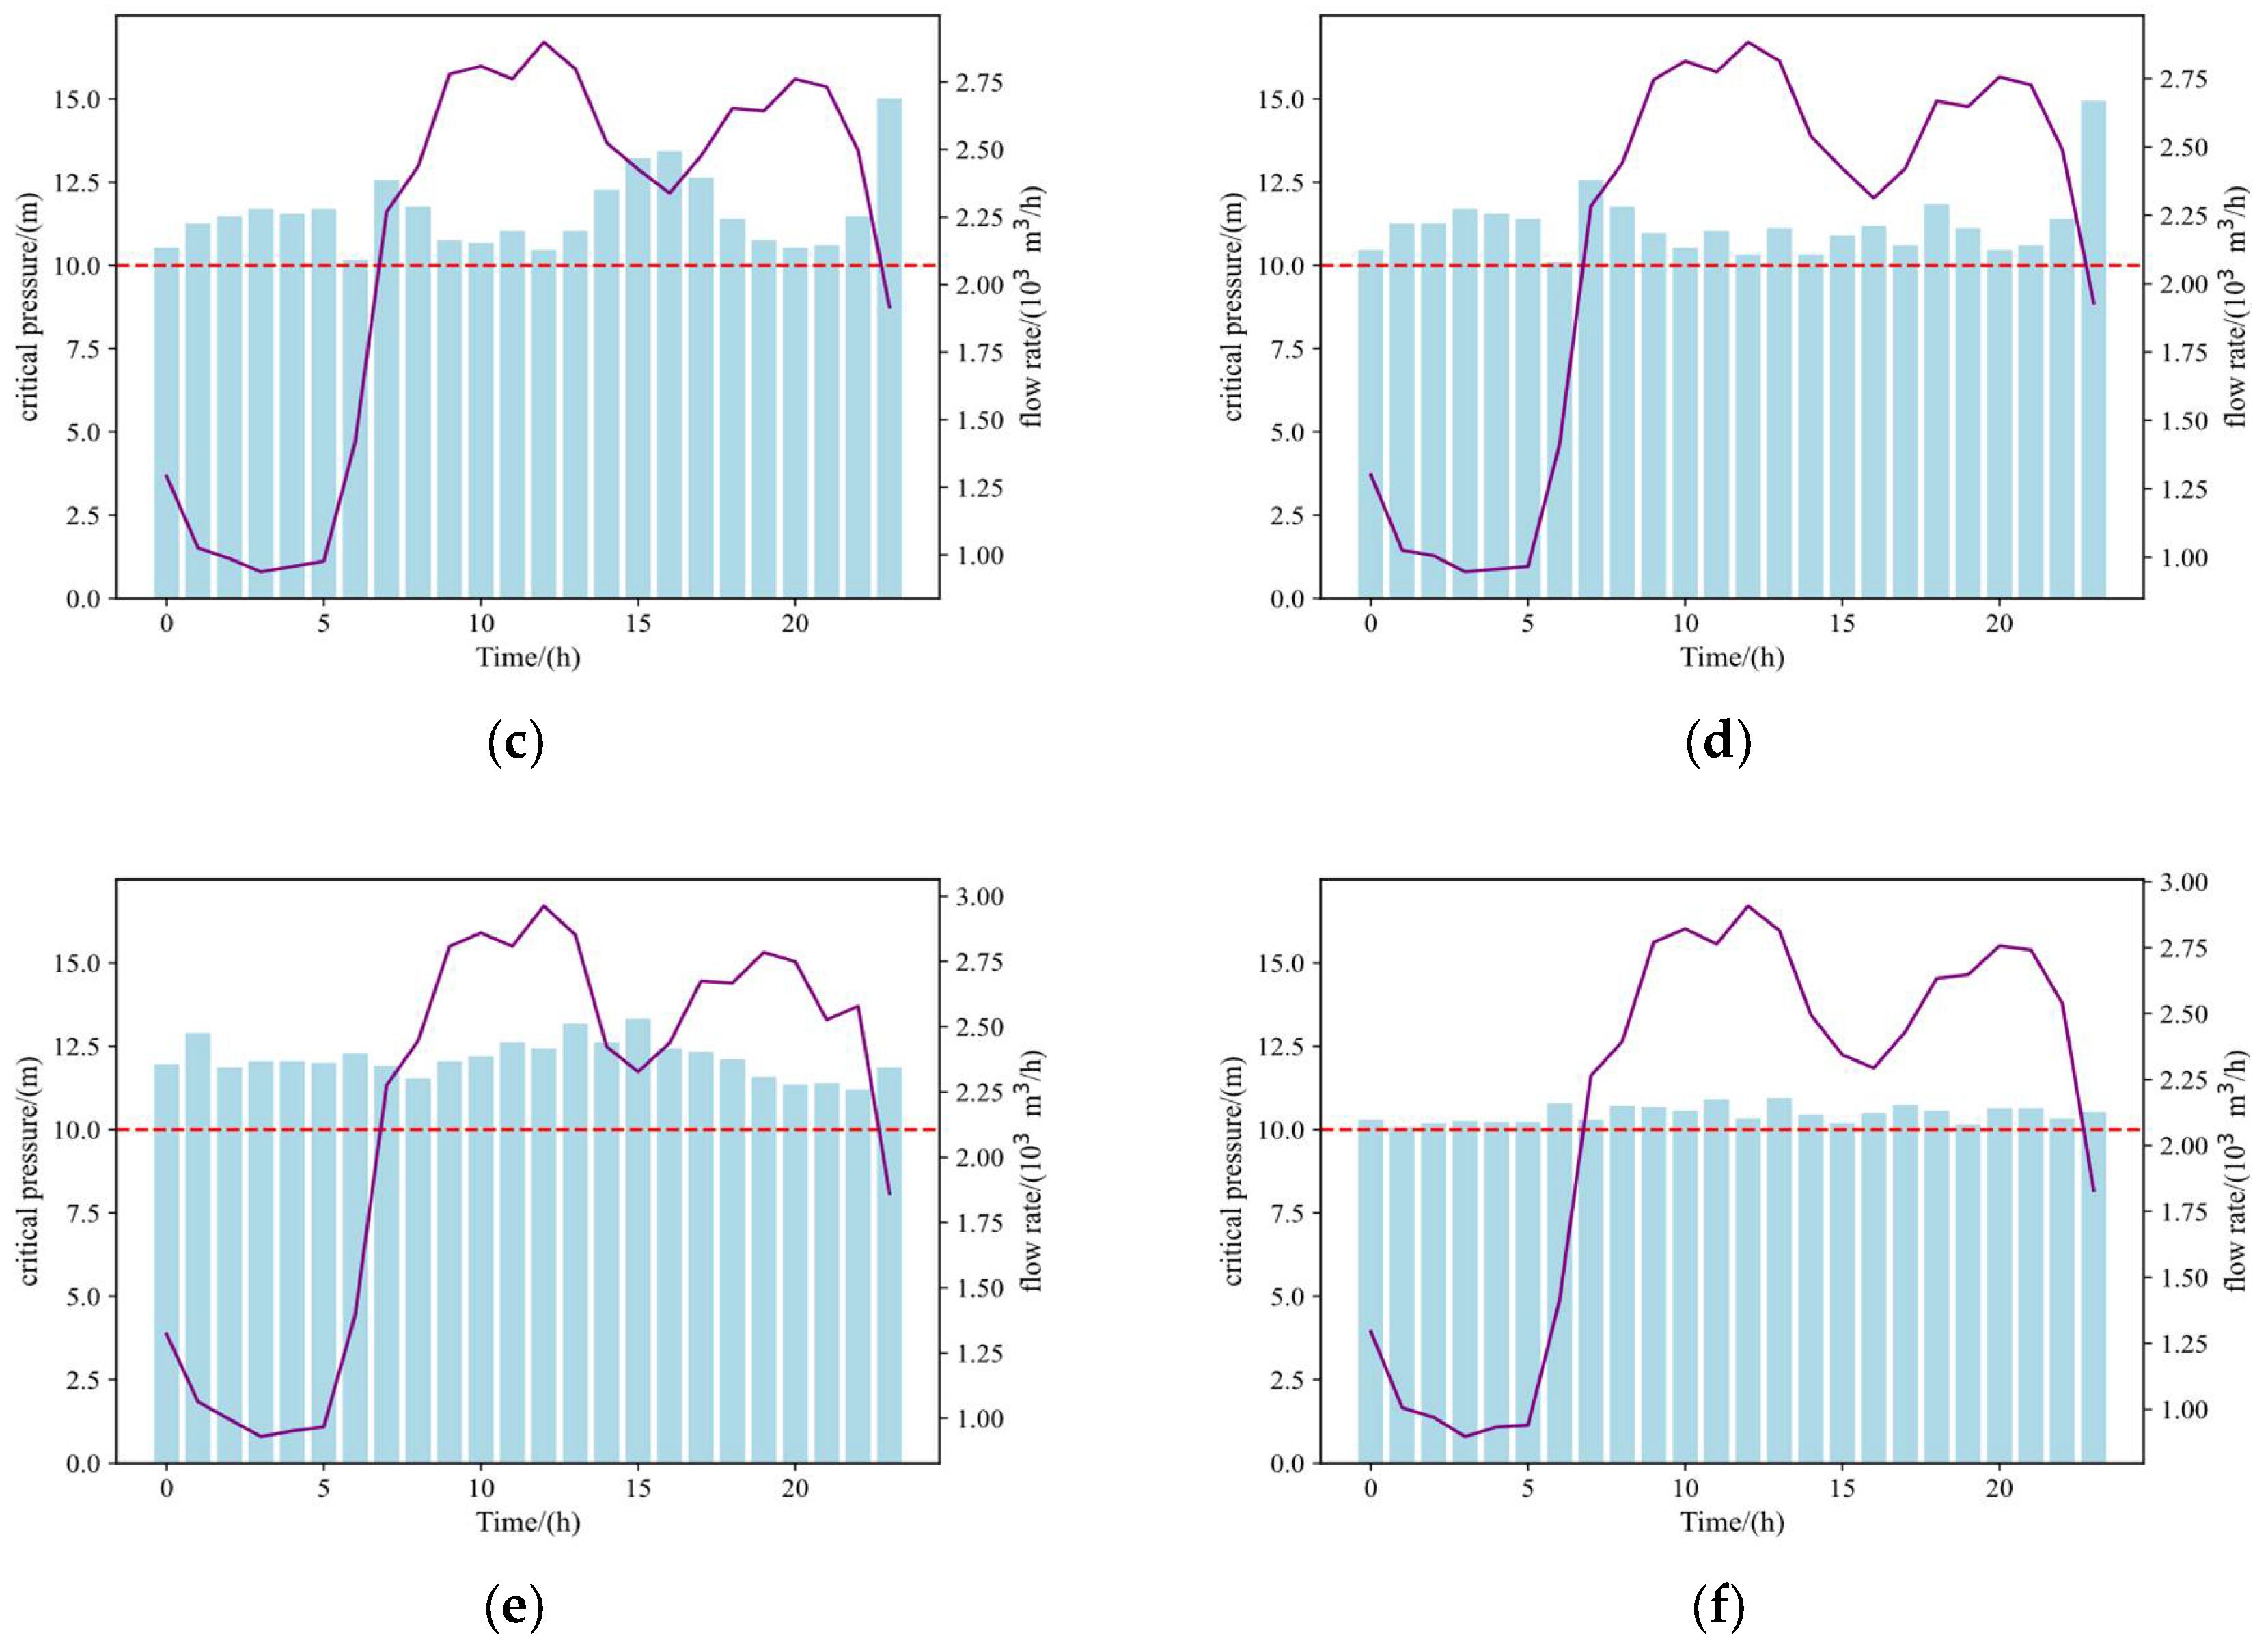
A total of six schemes were proposed for the four control methods to model the ZJ Network. Among them, the control of different segmentation methods in the TMPM was selected to participate in the evaluation and comparison of their optimal solutions, with a total of three solutions. Herein, the segmentation method with the smallest sum of surplus pressures was selected for each period, similar to that for the KL Network. The segmentation points are as follows:
  • Two time segments: 7, 23;
  • Three time segments: 7, 14, 23;
  • Four time segments: 7, 9, 14, 23.
The simulation results for the remaining three control methods were unique. Figure 7 and Table 4 show the evaluation indicators for all scenarios.
Using the four approaches for the ZJ Network, the following six options were found:
  • FOPM was the least effective, with Q day , Q day - leak , P equ , and P mid being the highest of the six options.
  • According to the TMPM, Q day , Q day - leak , P equ , and P mid decreased sequentially with the increase in the time segments.
  • The flow performance according to the FMPM was superior than the average of time controls of the 2 and 3 segments, and its performance in terms of P equ , which was close to the 4 segments time control.
  • The performance of PMPM was the best among all four methods, with the lowest values for all indicators.

3.2. KL Network

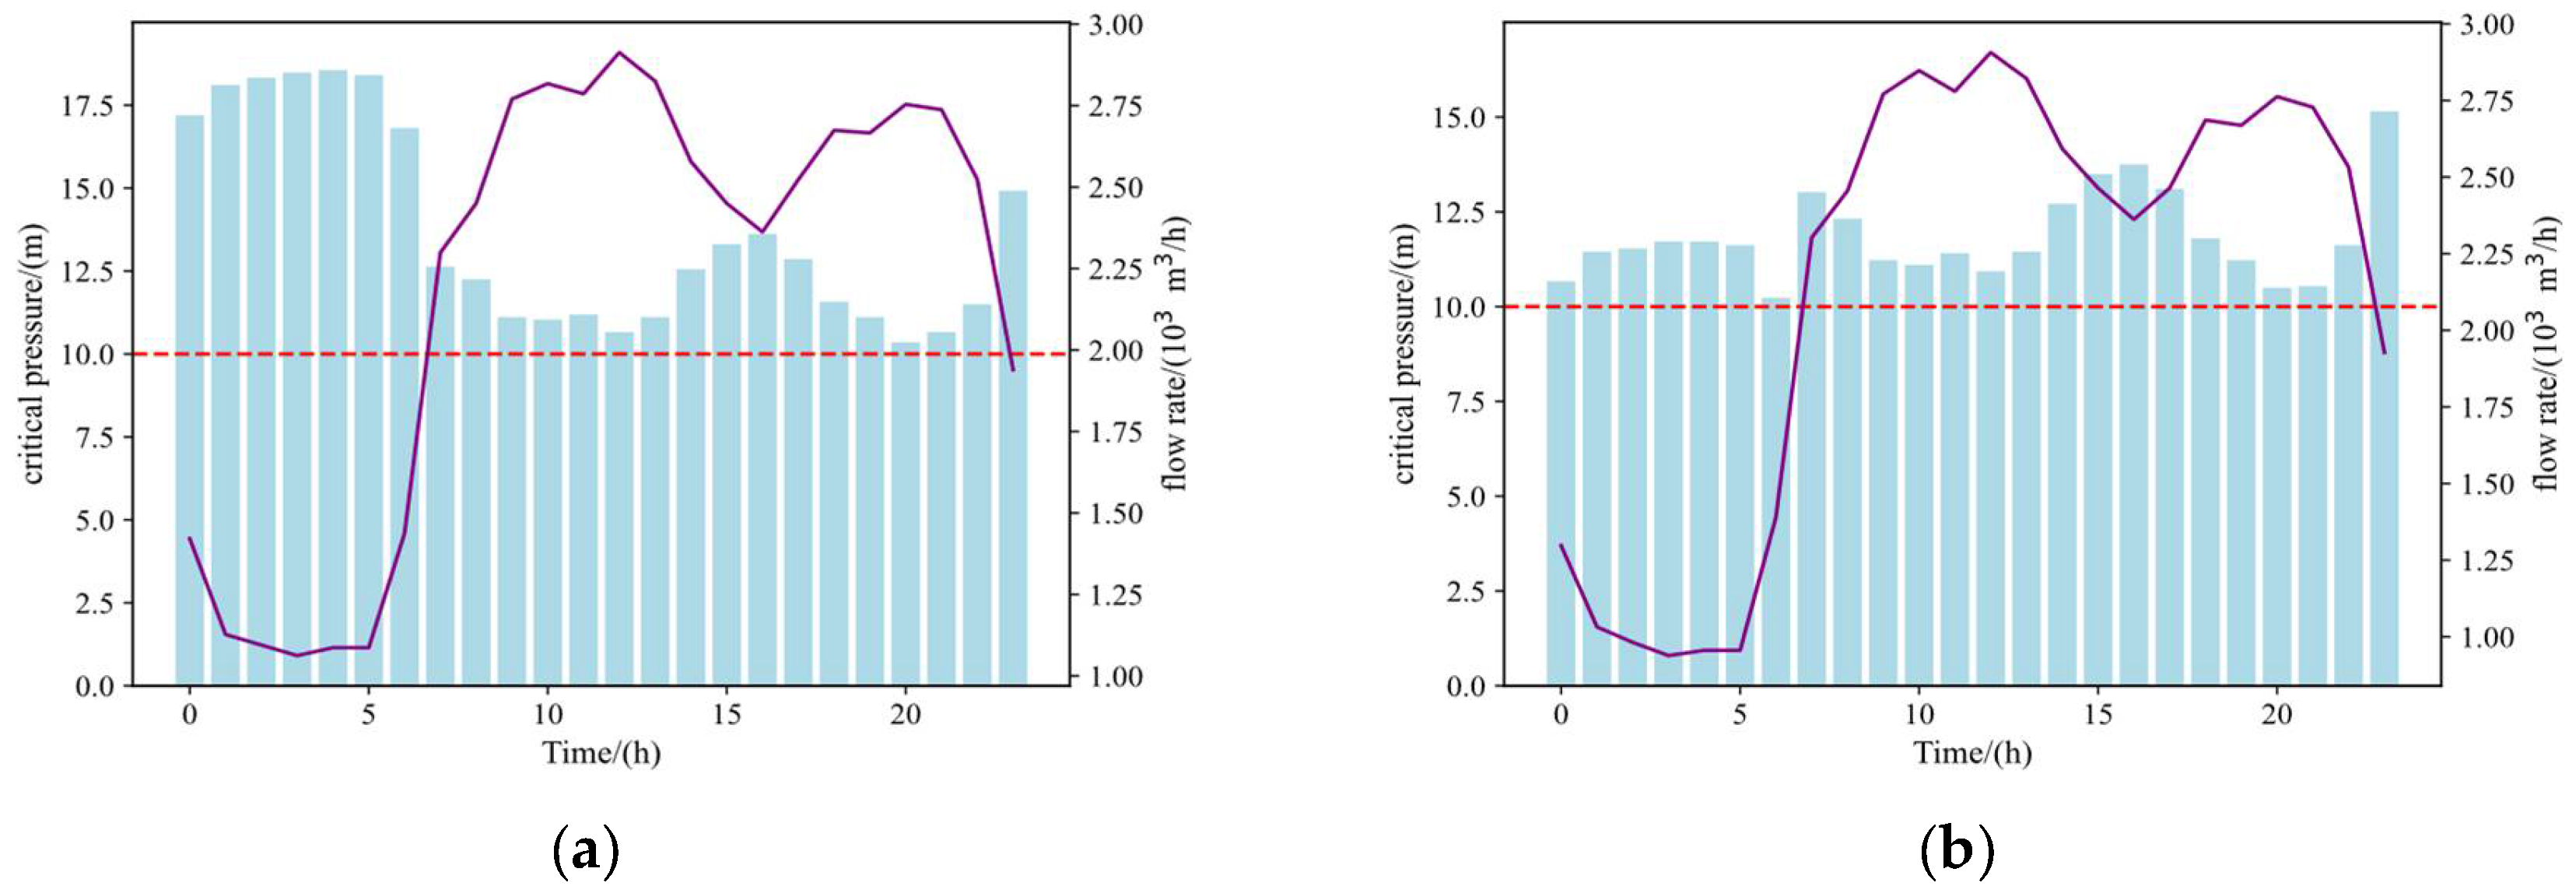
The control method used for this sample pipe network was the same as that used for the KL Network. The segmentation points in the time-based segmentation control are as follows:
  • Two time segments: 7, 0;
  • Three time segments: 7, 20, 0;
  • Four time segments: 7, 14, 18, 0.
The simulation results for the remaining three control methods were unique. Figure 8 and Table 5 show the evaluation indicators for all scenarios Table 5.
Using the four approaches for the KL Network, a total of six options were found:
  • FOPM delivered the worst leakage reduction effect, with the highest Q day and Q day - leak . In particular, its P mid was the highest among the six options, while its P equ performance was close to that of all five options except for the performance of PMPM, which gave a lower value.
  • According to the time-based control method, Q day , Q day - leak , P equ , and P mid decreased sequentially as the time segments increased; however, the difference was not significant and the performance of the three solutions was relatively similar. In comparison to TMPM, FOPM did not exhibit a significant difference, as observed in the ZJ network state.
  • FMPM was slightly less effective than the TMPM, but its performance in terms of P equ was close to the average of the TMPM.
  • PMPM was the best among all options, with the lowest values for all indicators.
Comparing the results of the two sample networks, it can be concluded that the performance of the different control methods for the pipe network was closely related to the characteristics of the network itself.

3.3. Sensitivity Analysis

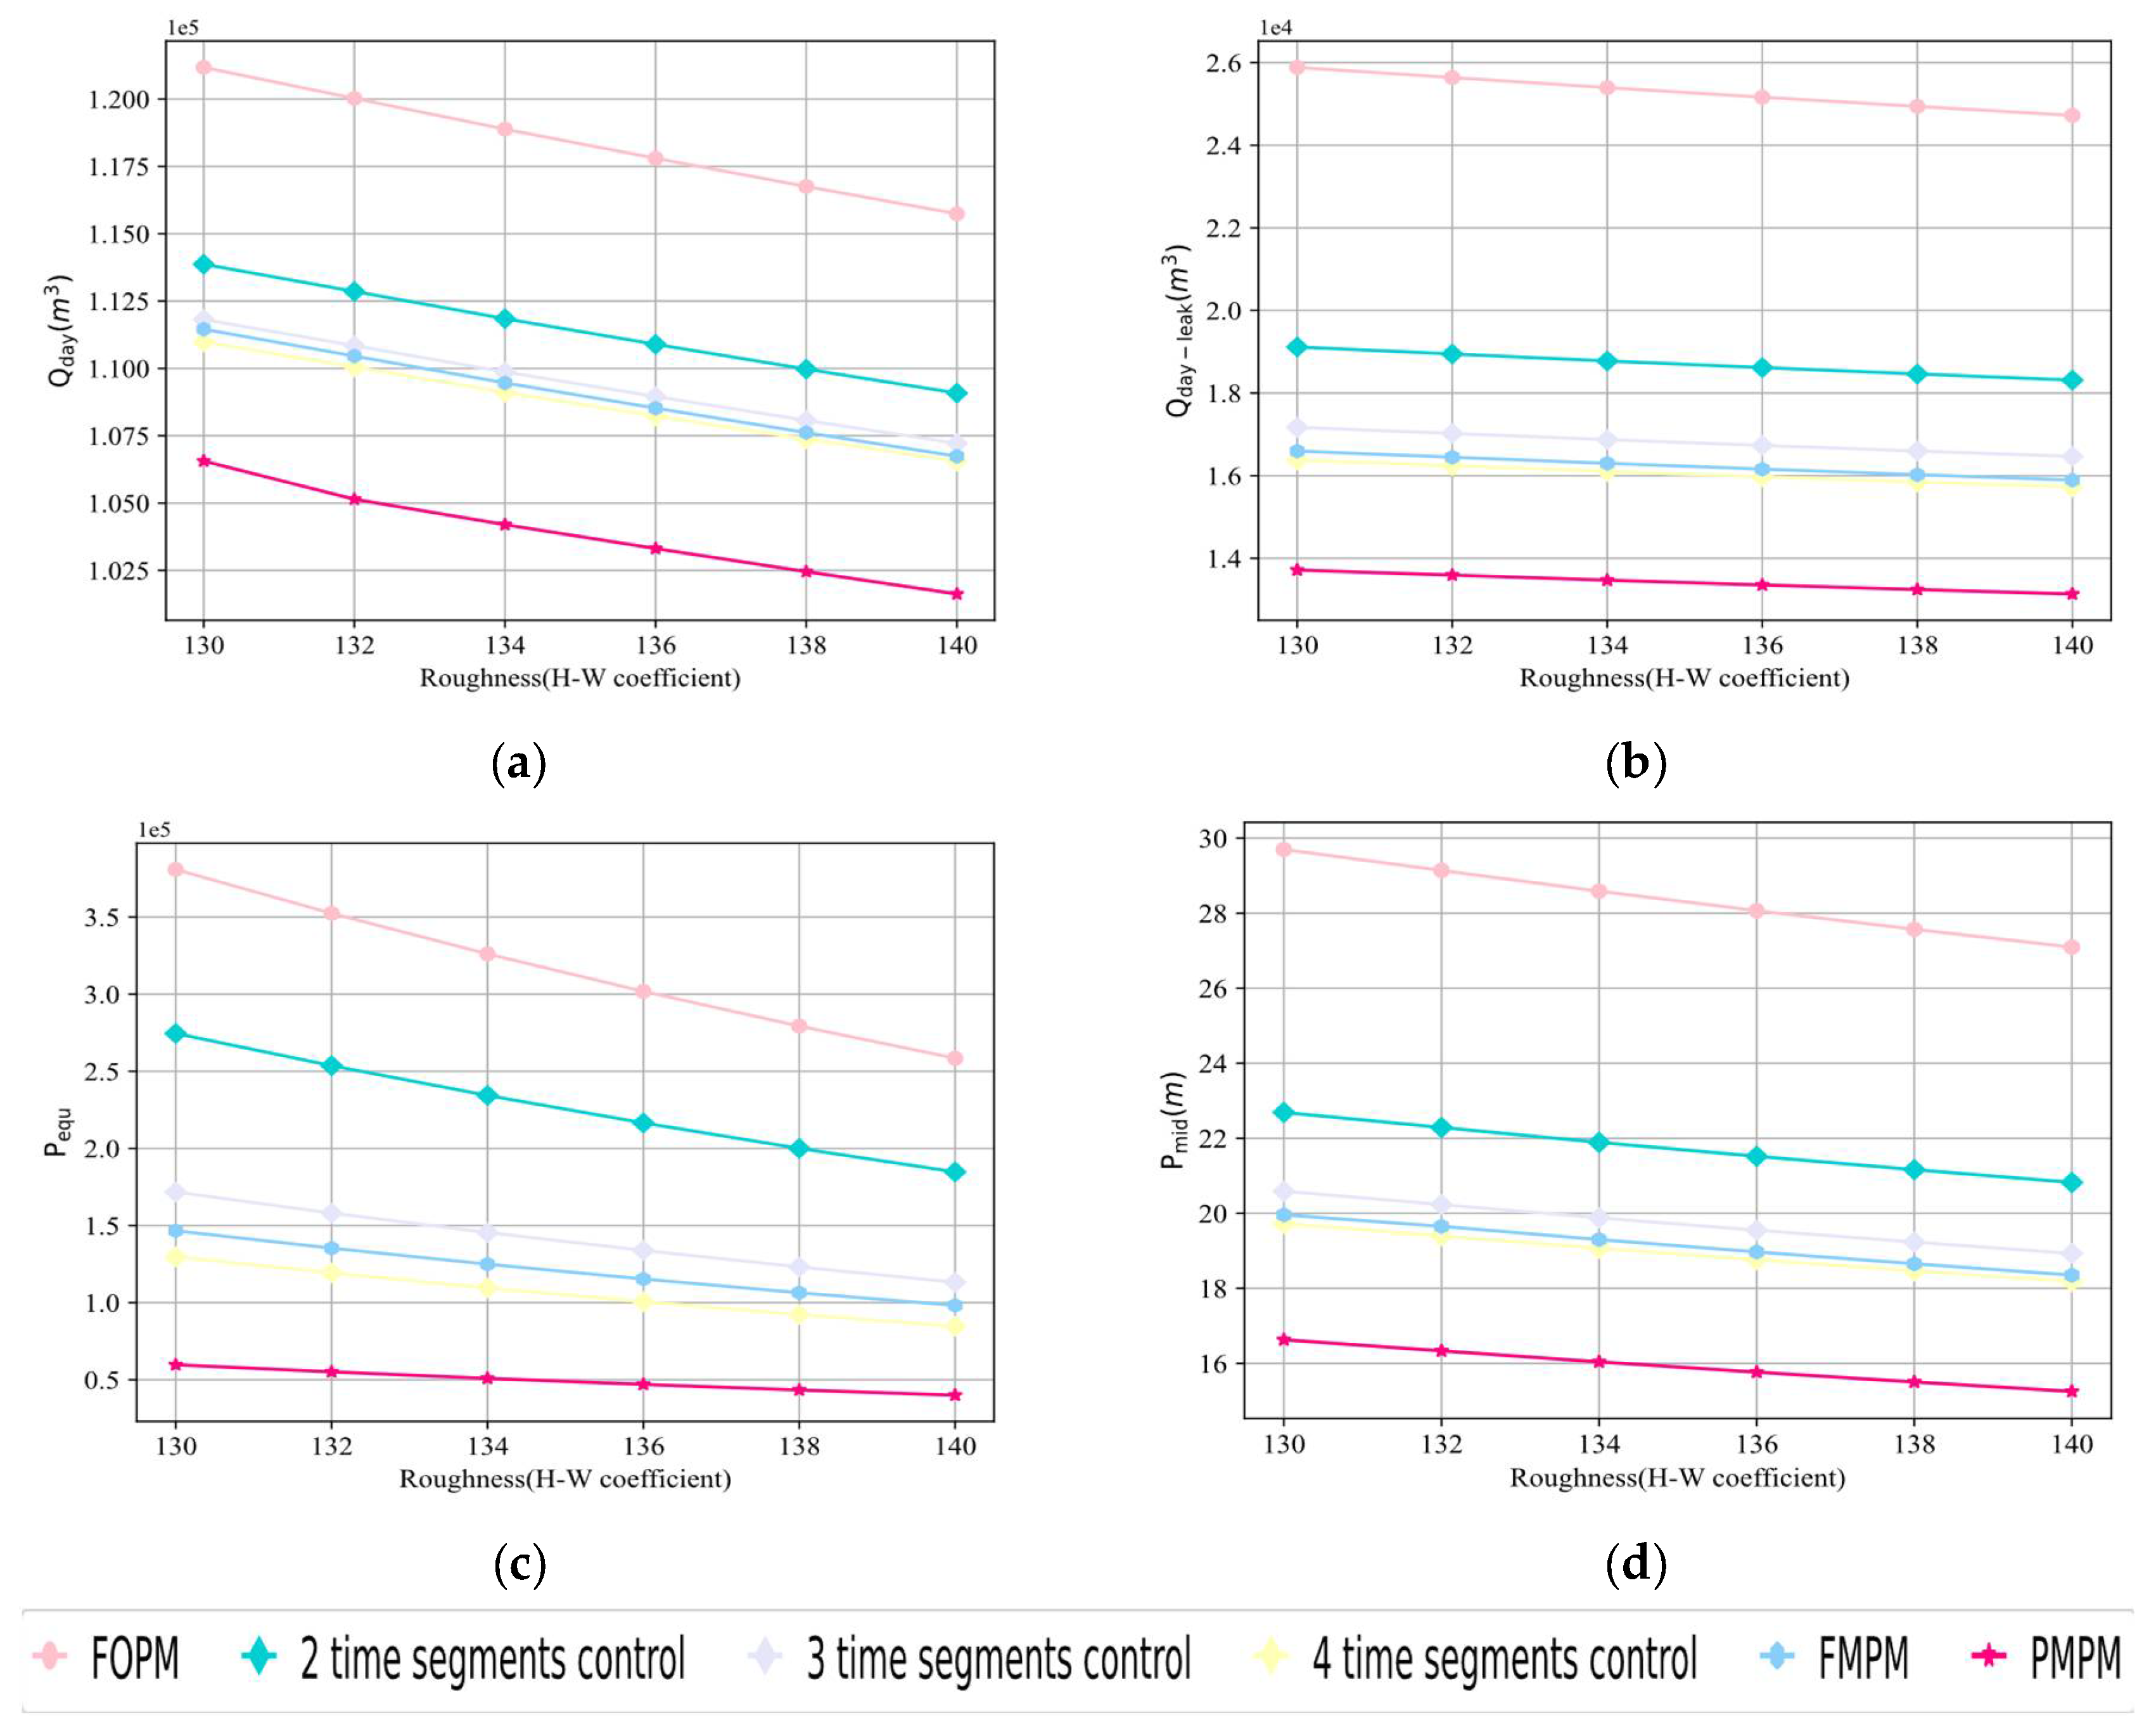
In the previous simulation study, the effectiveness of different control strategies was evaluated in two sample networks, and the metrics mentioned earlier were used to assess their performance. To validate the sensitivity of these PM methods to different equivalent roughness values, this article investigated the variation in roughness (H-W coefficient) of the ZJ Network from 130 to 140 [53] (within the reference range of cast-iron pipes according to the Epanet official documentation), with a step size of 2. All other conditions remained consistent with the previous study mentioned. Figure 9 displays the sensitivity analysis results for four metrics.
The results indicate that as the H-W coefficient increases, indicating a decrease in pipeline roughness, there is a consistent downward trend for the same metric across all scenarios. Despite the variation in pipeline roughness, the PMPM consistently maintains the best performance among all control strategies. The performance ranking of the other control strategies remains largely consistent with the original setting (roughness = 130) in terms of performance.

3.4. Comparison of Water Age

It has been observed that after the pressure management of the network, the drop in pressure and flow rate can result in an increase in water age at some nodes [54]. In studies conducted by Patelis et al. (2020), it was discovered that the age of the water was growing as the pressure decreases and the water age was declining as the water pressure was increased downstream, a finding corroborated by earlier findings of Kravvari et al. (2018) in investigating the variations in residual chlorine and water age as the network is sectorized and the water pressure is managed using PRVs [30,54,55]. Thus, the ability to keep the water age within a reasonable and safe range is also a factor to be considered when choosing a control strategy [30,54,56]. It should be noted that increased water age is often caused by changes in demand, system operation, and system design—an example being unreasonable network topology. Conclusively, if pressure control can be carried out in conjunction with network rehabilitation, it can maximize the management of pressure which can lower leakage rates and improve water quality for the consumer.
Table 6 lists the water age for the different control methods. The data for the two models in the table correspond to the initial state, FOPM, two-time-segment control, three-time-segment control, four-time-segment control, FMPM and PMPM, from top to bottom.
It has been observed that after the pressure management of the network, the drop in the pressure and flow rate can result in an increase in water age at some nodes. Thus, the ability to keep the water age within a reasonable and safe range is also a factor to be considered when choosing a control strategy. It should be noted that excessive water age is often caused by unreasonable network topology. Conclusively, if pressure control can be carried out in conjunction with network rehabilitation, it can maximize the management of pressure which can lower leakage rates and improve water quality for the consumer.

3.5. Case Study

This study conducted numerical experiments for field validation in an area with low terrain and high pressure at the network inlet in Y city. Figure 10 is a topological diagram of the selected area.
According to historical data, the inlet pressure at the network’s total metering point should not fall below 0.4644 MPa. By maintaining a pressure of at least 0.35 MPa at the inlet, normal water usage can be ensured for all users in the area. This results in a minimum surplus pressure value of 11.44 m, indicating a potential pressure drop of at least 11.44 m.
In consideration of the patterns of water usage, a comprehensive control methodology is suggested to formulate corresponding pressure regulation strategies, delineated on a time-of-day basis and encompassing multiple control modes, as follows:
  • During the period of 0:00–5:00, since the accumulated water usage by users is relatively low and the head loss in the pipeline network is also limited, FOPM was proposed. Based on the recorded data, the maximum head loss was determined to be 2.58 m, and maintaining a pressure of 0.27 MPa at the network inlet would suffice to meet the water demand.
  • During the period of 5:00–14:00, water usage by customers varies greatly, resulting in significant fluctuations in maximum head loss at the critical point during different time periods. Our data analysis found no clear correlation between flow rate and pressure. As a result, we recommend using PMPM.
  • During the period of 14:00–18:00, the instantaneous flow rate at the inlet exhibits a relatively smooth variation, and the fluctuation of the head loss in the pipeline network is minor. Therefore, it is advisable to adopt FOPM. Furthermore, the maximum head loss recorded during the observation period is 8.86 m, and maintaining the pressure at the inlet of the pipeline network at 0.33 MPa would suffice to meet the water demand.
  • The period of 18:00–24:00, was considered as the peak water usage period, as the results calculated for each period were relatively close. Considering the complexity and stability of control implementation, employing FOPM is a potentially superior option. Thus, the ultimate decision was to regulate the system by fixing the inlet pressure value at 0.315 MPa.
To summarize the pressure regulation strategies, Table 7 shows the final pressure control scheme. Based on the exponential leakage model mentioned in Section 2.1, this article utilized historical engineering measurement data to fit the corresponding parameters. The values obtained were C = 0.007 and γ = 1.5. In accordance with the established PM strategy and in conjunction with the exponential leakage model, the total leakage volume of the pipeline network within a 30-day period was determined to be 851.21 m3. When normalized by historical water consumption, the resulting reduction in non-revenue water amounted to 1217.97 m3, thereby yielding a decrease in the apparent loss rate from 22.75% to 10.28%. Assuming a water tariff of 4 CNY per unit, this region stands to reduce its monthly water supply losses by 4871.87 CNY.
Comparing the simulated scenarios in the sample work, in the case study, we need to consider more complex real-life situations, such as the following:
  • PMPM relies on stable, real-time pressure feedback and requires reliable real-time communication with the target pressure measurement point or data center, which increases the cost of the equipment. It may require the establishment of a municipal power supply to maintain the long-term operation of the pressure-reducing station.
  • In addition to requiring support from the relevant electrical power infrastructure, the implementation of FMPM poses significant challenges due to the reliance on reliable flow–pressure curves. Consequently, the adoption of FMPM was not feasible in the case study due to these hurdles.
  • It was observed that the underperforming FOPM, which initially showed unfavorable results in simulations, ended up being the preferred option in the majority of instances. This can be attributed to various objective factors, such as the water consumption habits of users and the level of infrastructure development in the water distribution network.
It is worth mentioning that during the peak demand period (18:00–24:00), the pressure setpoint for the PRV at the critical point was lower compared to the non-peak period (14:00–18:00). Based on the investigation conducted in actual engineering scenarios, it was observed that during the peak demand period, the demand of high-rise users at the critical point was minimal. Additionally, after implementing the proposed pressure control schemes, no user complaints regarding water supply experience were received. This suggests that the phenomenon of having lower pressure setpoints during the peak demand period compared to the non-peak period is reasonable.

4. Conclusions

After suggesting the use of a greedy algorithm to obtain an optimized control sequence for PRV, this paper presented the implementation steps of the four existing PRV control strategies in detail. This paper proposed the use of five evaluation metrics, including a novel evaluation metric called Pequ, to assess the effectiveness of PM in WDS. Through the evaluation of two sample networks, significant differences were observed between them, which effectively reflect the state of WDS under different PRV control strategies. This contribution enhances the scientific and comprehensive evaluation of PM, having positive impacts on systems’ sustainability. Furthermore, it is observed, in the case study in Section 3.5, that practical engineering has more flexibility in selecting strategies when faced with complex situations compared to numerical simulations.
By examining indicators related to flow and pressure, the paper finds that among all the control strategies, PMPM exhibits the most prominent performance, despite variations in the characteristics of the WDS. Meanwhile, it is observed that the effectiveness of other control strategies varies between the two sample networks. For example, the performance of FOPM in the KL Network differs less from the other control strategies compared to its significant difference in the ZJ Network. Considering that the KL Network consistently exhibited higher surplus pressure throughout the day and had a smaller range compared to the ZJ Network, it is suggested that the pressure distribution of the network itself should be taken into account when selecting control strategies. This study also observes that in PM, a trade-off consideration is required when evaluating water quality indicators such as water age, as well as indicators related to flow and pressure.
Future research should aim to evaluate the benefits of PM beyond what we studied. This includes asset life extension and the reduction of carbon dioxide (CO2) emissions. Researchers can use a multi-objective optimization approach to evaluate these benefits.

Author Contributions

Conceptualization, Y.T. and J.G.; Methodology, Y.T., J.G. and J.C.; Software, Y.T.; Validation, J.X.; Resources, J.G.; Data curation, J.G. and J.C.; Writing—original draft, J.X. and Q.Q.; Writing—review & editing, Q.Q. and R.M.M.; Supervision, J.G.; Project administration, T.Z.; Funding acquisition, J.G. and T.Z. All authors have read and agreed to the published version of the manuscript.

Funding

This investigation was funded by the National Key Research and Development Program of China (No. 2022YFC3203800), National Natural Science Foundation of China (No. 51978203), Key Research and Development Program of Heilongjiang Province (No. 2022ZX01A06) and Unveiling Scientific Research Program (No. CE602022000203).

Data Availability Statement

Please contact the authors for the data and software used in this study.

Conflicts of Interest

The authors declare no conflict of interest.

References

  1. Hu, S.Y.; Gao, J.L.; Zhong, D.; Wu, R.; Liu, L.M. Real-Time Scheduling of Pumps in Water Distribution Systems Based on Exploration-Enhanced Deep Reinforcement Learning. Systems 2023, 11, 56. [Google Scholar] [CrossRef]
  2. Kanakoudis, V.; Tolikas, D. Managing water resources and supply systems: Fail-safe vs. safe-fail. In Proceedings of the EWRA 5th International Conference ‘Water Resources Management in the Era of Transition, Athens, Greece, 4–8 September 2002; pp. 194–204. [Google Scholar]
  3. Bross, L.; Krause, S.J.S. Will there be enough water? A system dynamics model to investigate the effective use of limited resources for emergency water supply. Systems 2021, 9, 2. [Google Scholar] [CrossRef]
  4. Jun, H.; Gim, A.; Jung, D.; Lee, S. Strategy to Enhance Emergency Interconnected Operation of Water Distribution System. Sustainability 2022, 14, 5804. [Google Scholar] [CrossRef]
  5. Gomes, R.; Sá Marques, A.; Sousa, J. Estimation of the benefits yielded by pressure management in water distribution systems. Urban Water J. 2011, 8, 65–77. [Google Scholar] [CrossRef]
  6. Kanakoudis, V.; Gonelas, K. The joint effect of water price changes and pressure management, at the economic annual real losses level, on the system input volume of a water distribution system. Water Sci. Technol. Water Supply 2015, 15, 1069–1078. [Google Scholar] [CrossRef]
  7. Kanakoudis, V.; Gonelas, K. Analysis and calculation of the short and long run economic leakage level in a water distribution system. Water Util. J. 2016, 12, 57–66. [Google Scholar]
  8. Gonelas, K.; Kanakoudis, V. Reaching economic leakage level through pressure management. Water Sci. Technol. Water Supply 2016, 16, 756–765. [Google Scholar] [CrossRef]
  9. Havlik, V. Vulnerability of water distribution systems to leakage. In Proceedings of the NATO Advanced Research Workshop on Security of Water Supply Systems, Murter, Croatia, 27–31 May 2005; pp. 51–63. [Google Scholar]
  10. Mathye, R.P.; Scholz, M.; Nyende-Byakika, S. Optimal Pressure Management in Water Distribution Systems: Efficiency Indexes for Volumetric Cost Performance, Consumption and Linear Leakage Measurements. Water 2022, 14, 805. [Google Scholar] [CrossRef]
  11. Jones, F.T.; Barkdoll, B.D. Viability of Pressure-Reducing Valves for Leak Reduction in Water Distribution Systems. Water Conserv. Sci. Eng. 2022, 7, 657–670. [Google Scholar] [CrossRef]
  12. Kanakoudis, V.K.; Tolikas, D.K. The role of leaks and breaks in water networks: Technical and economical solutions. J. Water Supply Res. Technol.—AQUA 2001, 50, 301–311. [Google Scholar] [CrossRef]
  13. Kanakoudis, V.K. Vulnerability based management of water resources systems. J. Hydroinform. 2004, 6, 133–156. [Google Scholar] [CrossRef]
  14. China Urban Water Association. China City Statistical Yearbook of Urban Water Supply; China Urban Water Association: Beijing, China, 2021. [Google Scholar]
  15. Almandoz, J.; Cabrera, E.; Arregui, F.; Cabrera, E.; Cobacho, R. Leakage assessment through water distribution network simulation. J. Water Resour. Plan. Manag.—ASCE 2005, 131, 458–466. [Google Scholar] [CrossRef]
  16. Kanakoudis, V.; Gonelas, K. Non-revenue water reduction through pressure management in Kozani’s water distribution network: From theory to practice. Desalination Water Treat. 2016, 57, 11436–11446. [Google Scholar] [CrossRef]
  17. Swindon, W. Future Approaches to Leakage Target Setting for Water Companies in England and Wales Including the Two Reports: ‘Best Practice Principles in the Economic Level of Leakage Calculation’ and ‘Leakage Performance Indicators’; Water Research Centre: Helsby, UK, 2001. [Google Scholar]
  18. Li, W.; Ling, W.; Liu, S.; Zhao, J.; Liu, R.; Chen, Q.; Qiang, Z.; Qui, J. Development of systems for detection, early warning, and control of pipeline leakage in drinking water distribution: A case study. J. Environ. Sci. 2011, 23, 1816–1822. [Google Scholar] [CrossRef]
  19. Clark, R.M.; Sivaganesan, M.; Selvakumar, A.; Sethi, V. Cost models for water supply distribution systems. J. Water Resour. Plan. Manag.—ASCE 2002, 128, 312–321. [Google Scholar] [CrossRef]
  20. Aksela, K.; Aksela, M.; Vahala, R. Leakage detection in a real distribution network using a SOM. Urban Water J. 2009, 6, 279–289. [Google Scholar] [CrossRef]
  21. Engelhardt, M.O.; Skipworth, P.J.; Savic, D.A.; Saul, A.J.; Walters, G.A. Rehabilitation strategies for water distribution networks: A literature review with a UK perspective. Urban Water 2000, 2, 153–170. [Google Scholar] [CrossRef]
  22. Wu, Z.Y.; Sage, P. Water Loss Detection via Genetic Algorithm Optimization-based Model Calibration. In Proceedings of the Water Distribution Systems Analysis Symposium 2006, Cincinnati, OH, USA, 27–30 August 2006; pp. 1–11. [Google Scholar]
  23. Oyedokun, O.; Oke, S.; Ighravwe, D. A mathematical model for leak location and leak area determination in pipeline networks. Acta Period. Technol. 2013, 133–149. [Google Scholar] [CrossRef]
  24. Vicente, D.J.; Garrote, L.; Sanchez, R.; Santillan, D. Pressure Management in Water Distribution Systems: Current Status, Proposals, and Future Trends. J. Water Resour. Plan. Manag.—ASCE 2016, 142, 13. [Google Scholar] [CrossRef]
  25. Fantozzi, M.L.A. Recent Developments in Pressure Management. 2010. Available online: https://www.miya-water.com/fotos/artigos/recent_developments_in_pressure_management_8927420825a30024be9bb9.pdf (accessed on 15 April 2023).
  26. Adedeji, K.B.; Hamam, Y.; Abe, B.T.; Abu-Mahfouz, A.M. Pressure Management Strategies for Water Loss Reduction in Large-Scale Water Piping Networks: A Review. In Advances in Hydroinformatics; Springer: Singapore, 2018; pp. 465–480. [Google Scholar]
  27. Campisano, A.; Modica, C.; Reitano, S.; Ugarelli, R.; Bagherian, S. Field-oriented methodology for real-time pressure control to reduce leakage in water distribution networks. J. Water Resour. Plan. Manag. 2016, 142, 04016057. [Google Scholar] [CrossRef]
  28. Rogers, D. Reducing leakage in Jakarta, Indonesia. In Proceedings of the IWA Specialized Conference Leakage, Halifax, NS, Canada, 12–14 September 2005. [Google Scholar]
  29. Yates, C.D.; Graham, D. Advanced pressure management via flow modulation; the Dartmouth Central PMA. In Proceedings of the IWA Specialist Conference on Water Loss, Brno, Czech Republic, 16–18 May 2007; pp. 23–26. [Google Scholar]
  30. Kravvari, A.; Kanakoudis, V.; Patelis, M. The Impact of pressure management techniques on the water age in an urban pipe network—The case of Kos city network. Proceedings 2018, 2, 699. [Google Scholar]
  31. Burn, L.S.; De Silva, D.; Shipton, R.J. Effect of demand management and system operation on potable water infrastructure costs. Urban Water 2002, 4, 229–236. [Google Scholar] [CrossRef]
  32. Creaco, E.; Walski, T. Economic analysis of pressure control for leakage and pipe burst reduction. J. Water Resour. Plan. Manag. 2017, 143, 04017074. [Google Scholar] [CrossRef]
  33. Awad, H.; Kapelan, Z.; Savic, D.; Emerson, A. Optimal setting of time-modulated pressure reducing valves in water distribution networks using genetic algorithms. In Integrating Water Systems; Taylor & Francis Group: London, UK, 2009; pp. 31–37. [Google Scholar]
  34. Moslehi, I.; Ghazizadeh, M.J.; Yousefi-Khoshqalb, E. An economic valuation model for alternative pressure management schemes in water distribution networks. Util. Policy 2020, 67, 101129. [Google Scholar] [CrossRef]
  35. Rajakumar, A.G.; Cornelio, A.A.; Mohan Kumar, M.S. Leak management in district metered areas with internal-pressure reducing valves. Urban Water J. 2020, 17, 714–722. [Google Scholar] [CrossRef]
  36. Koşucu, M.M.; Demirel, M.C. Smart pressure management extension for EPANET: Source code enhancement with a dynamic pressure reducing valve model. J. Hydroinform. 2022, 24, 642–658. [Google Scholar] [CrossRef]
  37. Mosetlhe, T.C.; Hamam, Y.; Du, S.; Monacelli, E. A survey of pressure control approaches in water supply systems. Water 2020, 12, 1732. [Google Scholar] [CrossRef]
  38. Darvini, G.; Soldini, L. Pressure control for WDS management. A case study. In Proceedings of the Computing and Control for the Water Industry (CCWI2015)—Sharing the Best Practice in Water Management, Univ Exeter, Leicester, UK, 2–4 September 2015; pp. 984–993. [Google Scholar]
  39. Garcia-Todoli, S.; Iglesias-Rey, P.L.; Martinez-Solano, F.J. Experimental Analysis of Proportional Pressure Reducing Valves for Water Distribution Systems. In Proceedings of the 17th Annual World Environmental and Water Resources Congress, Sacramento, CA, USA, 21–25 May 2017; pp. 637–647. [Google Scholar]
  40. Ferrarese, G.; Malavasi, S. Performances of Pressure Reducing Valves in Variable Demand Conditions: Experimental Analysis and New Performance Parameters. Water Resour. Manag. 2022, 36, 2639–2652. [Google Scholar] [CrossRef]
  41. Liu, X.; Tian, Y.; Zheng, Y.; Liu, Z.; Wang, H. A hydraulic simulation-optimization model of the joint operation of multiple devices in long-distance water diversion systems under the pumps shutdown process using a parallel NSGA-II approach. Water Supply 2022, 22, 7387–7404. [Google Scholar] [CrossRef]
  42. Fontana, N.; Giugni, M.; Glielmo, L.; Marini, G.; Verrilli, F. Real-time control of a PRV in water distribution networks for pressure regulation: Theoretical framework and laboratory experiments. J. Water Resour. Plan. Manag. 2018, 144, 04017075. [Google Scholar] [CrossRef]
  43. Creaco, E.; Di Nardo, A.; Iervolino, M.; Santonastaso, G. Head-Drop Method for the Modeling of Pressure Reducing Valves and Variable Speed Pumps in Water Distribution Networks. J. Hydraul. Eng. 2023, 149, 06023001. [Google Scholar] [CrossRef]
  44. Mosetlhe, T.C.; Hamam, Y.; Du, S.; Monacelli, E. Appraising the impact of pressure control on leakage flow in water distribution networks. Water 2021, 13, 2617. [Google Scholar] [CrossRef]
  45. Dai, P.D. Optimal pressure management in water distribution systems using an accurate pressure reducing valve model based complementarity constraints. Water 2021, 13, 825. [Google Scholar] [CrossRef]
  46. Ávila, C.A.M.; Sánchez-Romero, F.-J.; López-Jiménez, P.A.; Pérez-Sánchez, M. Leakage Management and Pipe System Efficiency. Its Influence in the Improvement of the Efficiency Indexes. Water 2021, 13, 1909. [Google Scholar] [CrossRef]
  47. Ortega-Ballesteros, A.; Iturriaga-Bustos, F.; Perea-Moreno, A.-J.; Muñoz-Rodríguez, D. Advanced Pressure Management for Sustainable Leakage Reduction and Service Optimization: A Case Study in Central Chile. Sustainability 2022, 14, 12463. [Google Scholar] [CrossRef]
  48. Water Distribution Systems Toolkit of the University of Kentucky (System Name: ZJ Network). Available online: http://www.uky.edu/WDST/SystemPages/43System_Page_ZJNetwork.html (accessed on 4 January 2023).
  49. Water Distribution Systems Toolkit of the University of Kentucky (System Name: KL Network). Available online: http://www.uky.edu/WDST/SystemPages/45System_Page_KilNetw.html (accessed on 15 April 2023).
  50. Wagner, J.M.; Shamir, U.; Marks, D.H. Water Distribution Reliability: Simulation Methods. J. Water Resour. Plan. Manag. 1988, 114, 276–294. [Google Scholar] [CrossRef] [Green Version]
  51. Cassa, A.; Van Zyl, J.; Laubscher, R. A numerical investigation into the behaviour of leak openings in uPVC pipes under pressure. In Proceedings of the WISA2006 the Water Institute of Southern Africa Biennial Conference and Exhibition, Durban, South Africa, 21–25 May 2006. [Google Scholar]
  52. van Zyl, J.E.; Cassa, A.M. Modeling elastically deforming leaks in water distribution pipes. J. Hydraul. Eng. 2014, 140, 182–189. [Google Scholar] [CrossRef]
  53. Rossman, L.A.; Woo, H.; Tryby, M.; Shang, F.; Janke, R.; Haxton, T. EPANET 2.2 User Manual; U.S. Environmental Protection Agency: Washington, DC, USA, 2020.
  54. Patelis, M.; Kanakoudis, V.; Kravvari, A. Pressure regulation vs. Water aging in water distribution networks. Water 2020, 12, 1323. [Google Scholar] [CrossRef]
  55. Kourbasis, N.; Patelis, M.; Tsitsifli, S.; Kanakoudis, V. Optimizing Water Age and Pressure in Drinking Water Distribution Networks. Environ. Sci. Proc. 2020, 2, 51. [Google Scholar]
  56. Chondronasios, A.; Gonelas, K.; Kanakoudis, V.; Patelis, M.; Korkana, P. Optimizing DMAs’ formation in a water pipe network: The water aging and the operating pressure factors. J. Hydroinform. 2017, 19, 890–899. [Google Scholar] [CrossRef] [Green Version]
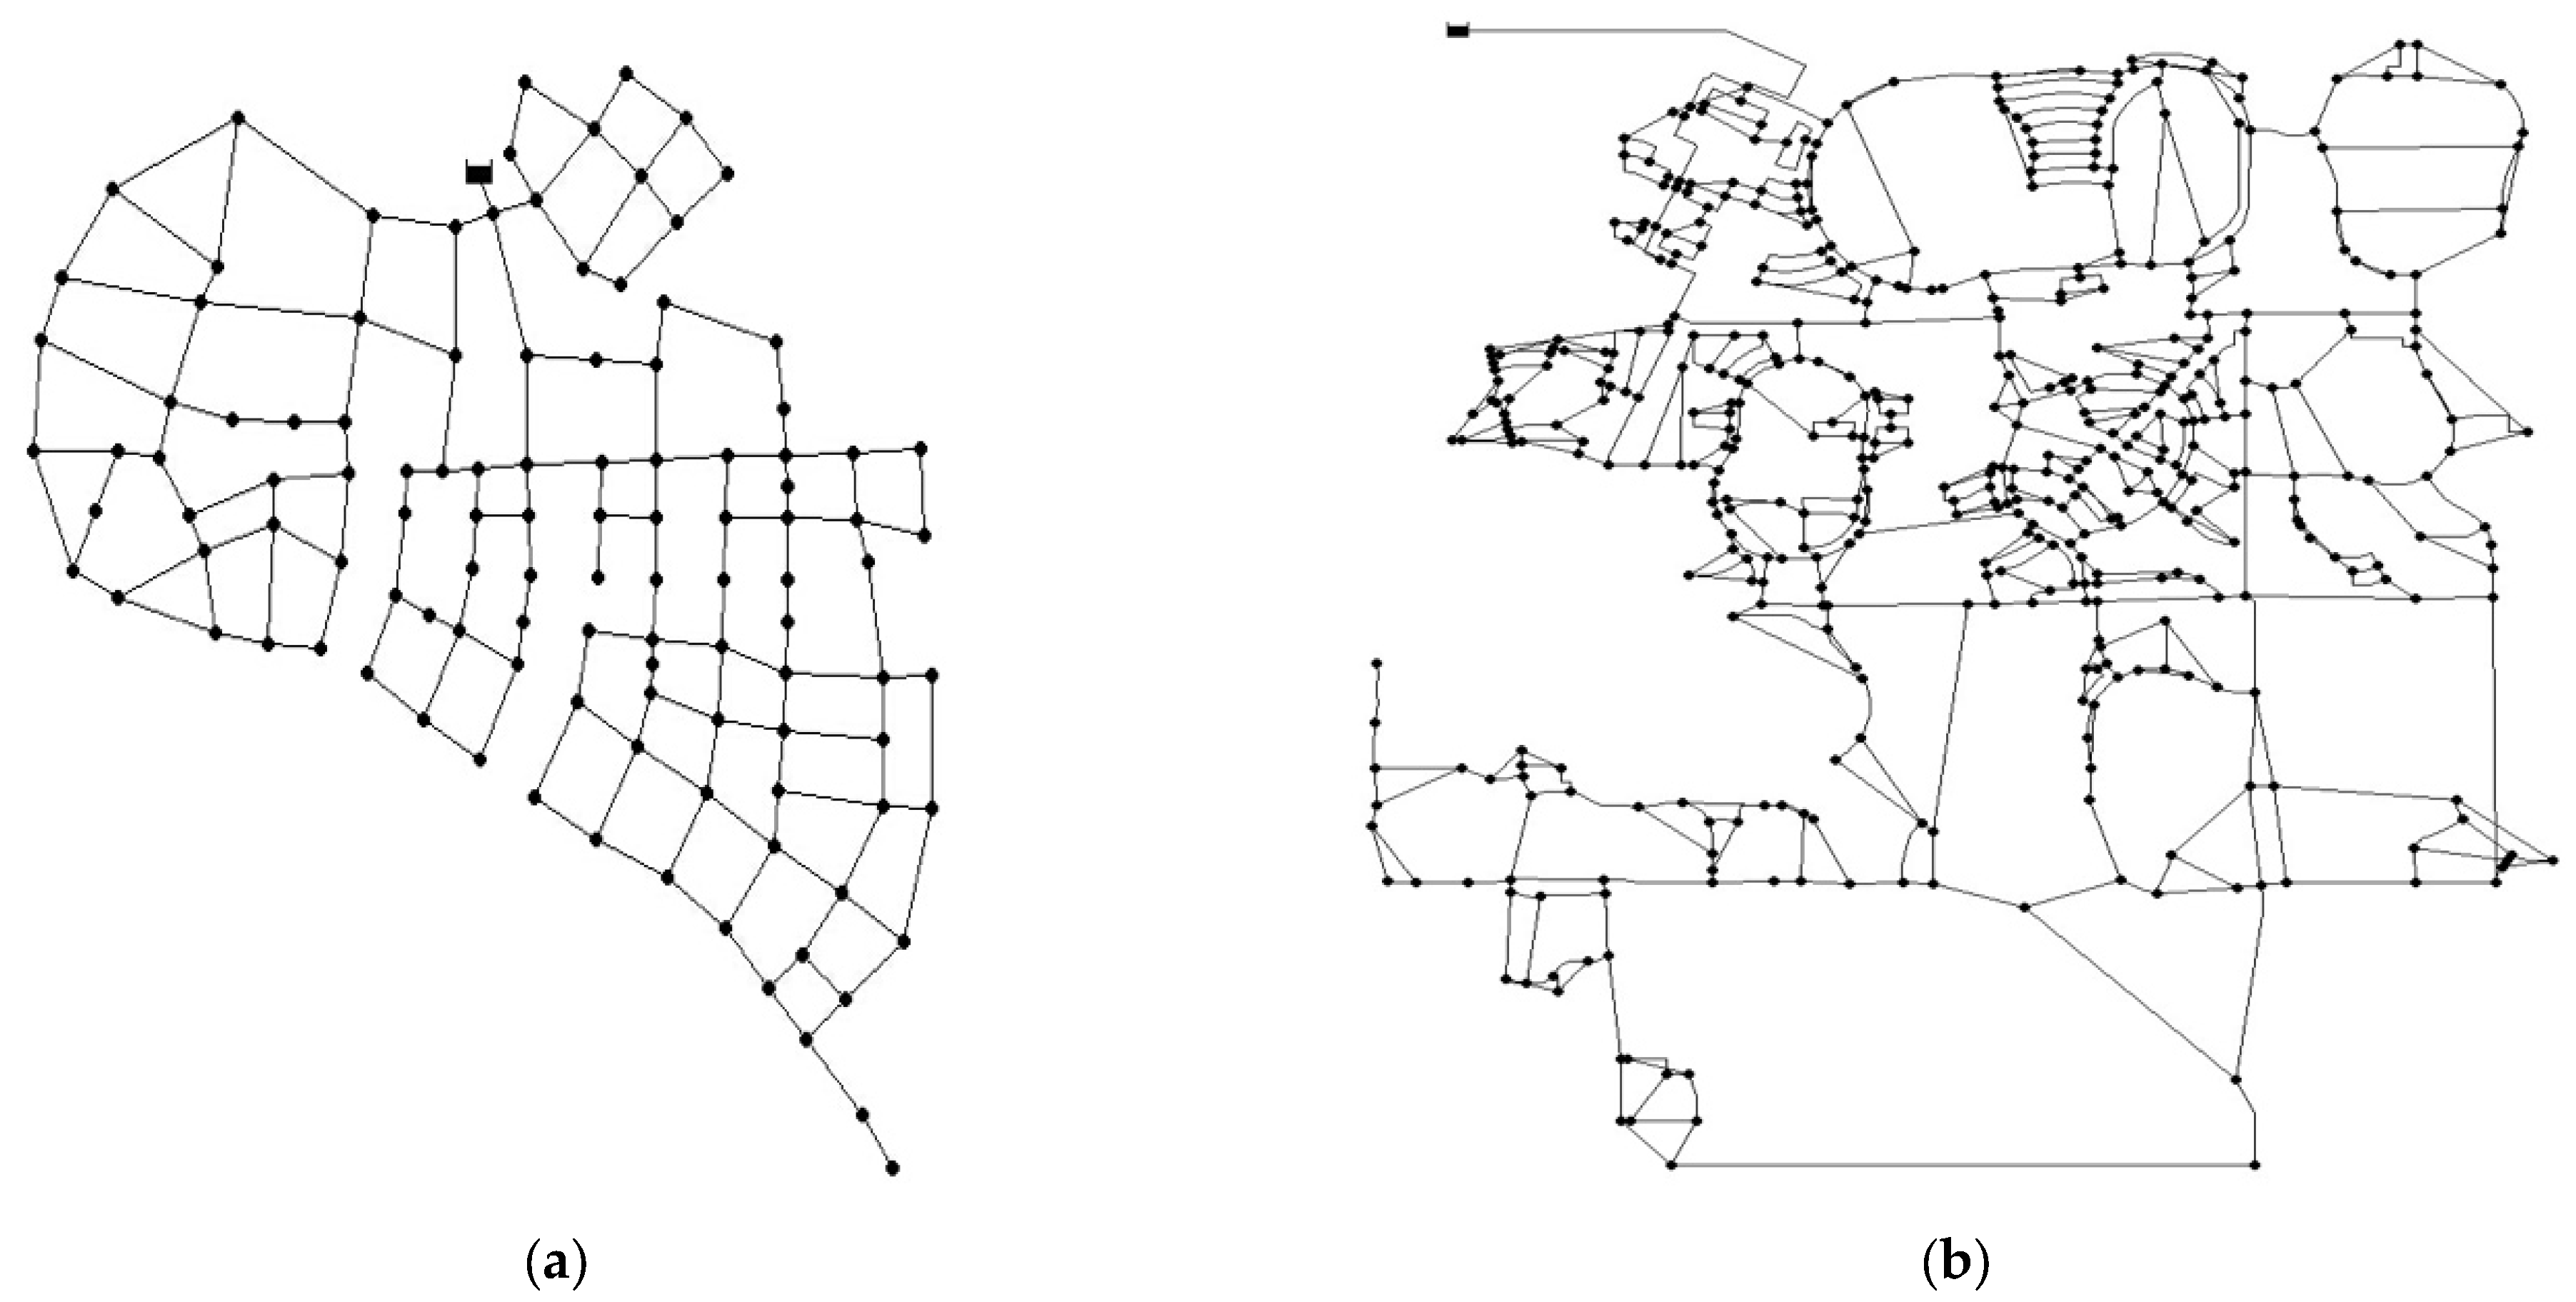
Figure 1. The topology of sample networks: (a) ZJ Network; (b) KL Network.
Sustainability 15 11086 g001
Figure 2. Flowchart of the step iteration method algorithm.
Sustainability 15 11086 g002
Figure 3. Iterative process control value sequences and surplus pressure value sequences.
Sustainability 15 11086 g003
Figure 4. Flow chart for time-segmented control sequences.
Sustainability 15 11086 g004
Figure 5. Flowchart of FMPM model simulation.
Sustainability 15 11086 g005
Figure 6. Flowchart of the model simulation based on PMPM.
Sustainability 15 11086 g006
Figure 7. ZJ Network control working conditions: (a) FOPM; (b) two-time-segment control; (c) three-time-segment control; (d) four-time-segment control; (e) FMPM; (f) PMPM.
Sustainability 15 11086 g007
Figure 8. KL Network control working conditions: (a) FOPM; (b) two-time-segment control; (c) three-time-segment control; (d) four-time-segment control; (e) FMPM; (f) PMPM.
Sustainability 15 11086 g008aSustainability 15 11086 g008b
Figure 9. A sensitivity analysis based on the equivalent roughness values of ZJ Network. (a) Q day ; (b) Q day - leak ; (c) P equ ; (d) P mid .
Sustainability 15 11086 g009
Figure 10. Field validation WDS topological diagram.
Sustainability 15 11086 g010
Table 1. The composition of sample networks: (a) ZJ Network; (b) KL Network.
Diameter (mm)Number of PipesTotal Length (km)
(a)(b)(a)(b)
5003160128.9
6504905.8
8005109.4
100342027.62.7
1508705.69.1
200255819.415.9
250232716.76.9
300222315.84.7
3509237.94.6
40011225.63.9
450205016.59.9
500301.90
5504134.01.6
600251.51.0
6500401.4
750100.40
800101.40
9000200.6
1100202.00
Table 2. WNTR-PDD kernel model parameters.
Model ParametersValue
Accuracy0.01
Maximum iterations40
Nominal pressure16 m
Minimum pressure0 m
Minimum service pressure10 m
Table 3. Post-valve pressure value for the initial working condition of the ZJ urban pipe network.
TimePressure (m)TimePressure (m)TimePressure (m)
050.511848.5061648.289
150.933947.2741748.013
250.9741047.1441847.618
351.0421147.1811948.101
451.0241246.662047.846
551.021346.972148.069
650.3441447.6532248.57
749.0221547.9542349.67
Table 4. ZJ Network control working conditions: (a) FOPM; (b) two-time-segment control; (c) three-time-segment control; (d) four-time-segment control; (e) FMPM; (f) PMPM. Qday (m3).
Evaluation MetricsQday (m3)Qday-leak (m3) P equ P mid ( m )
a121,17625,884380,84429.70
b113,86819,116274,53622.69
c111,81617,172171,72020.59
d110,98816,380129,74419.73
e111,45616,596146,59219.96
f106,56013,71659,72416.63
Table 5. KL Network control working conditions: (a) FOPM; (b) two-time-segment control; (c) three-time-segment control; (d) four-time-segment control; (e) FMPM; (f) PMPM.
Evaluation MetricsQday (m3)Qday-leak (m3) P equ P mid ( m )
a52,632932440,53627.15
b51,768853247,23225.11
c52,308842443,92024.91
d51,480828040,71624.56
e51,984864041,86825.47
f51,012792035,78423.66
Table 6. Results of water age simulations.
ModelMaximum Water Age NodeTime of OccurrenceWater Age/h
ZJ urban pipe network167:008.56
167:008.88
928:009.77
928:009.79
928:009.85
928:009.85
129:0010.3
KL urban pipe network119111:0013.88
119111:0014.69
119111:0014.78
119111:0014.81
119111:0014.81
119111:0014.71
119111:0014.99
Table 7. Pressure regulation strategies of case study.
TimeWDS Inlet
Pressure (MPa)
TimeWDS Inlet
Pressure (MPa)
0:00–5:000.2710:00–11:000.317
5:00–6:000.26511:00–12:000.297
6:00–7:000.27912:00–13:000.307
7:00–8:000.3313:00–14:000.307
8:00–9:000.3314:00–18:000.33
9:00–10:000.3318:00–24:000.315
Disclaimer/Publisher’s Note: The statements, opinions and data contained in all publications are solely those of the individual author(s) and contributor(s) and not of MDPI and/or the editor(s). MDPI and/or the editor(s) disclaim responsibility for any injury to people or property resulting from any ideas, methods, instructions or products referred to in the content.