Article

Assessing Impacts of Mining-Induced Land Use Changes on Groundwater and Surface Water Quality Using Isotopic and Hydrogeochemical Signatures

1
Department of Civil and Environmental Engineering, Birla Institute of Technology, Mesra, Ranchi 835215, India
2
Central Mine Planning and Design Institute Limited, Bilaspur 495006, India
3
Geological Survey of India, Eastern Region, DK-6, Salt Lake, Kolkata 700091, India
4
Hydrological Investigations Division, National Institute of Hydrology, Roorkee 247667, India
5
Department of Production and Industrial Engineering, Birla Institute of Technology, Mesra, Ranchi 835215, India
6
Department of Industrial Engineering, College of Engineering, King Saud University, P.O. Box 800, Riyadh 11421, Saudi Arabia
7
Department of Structural Engineering and Construction Management, Future University, New Cairo City 11835, Egypt
*
Authors to whom correspondence should be addressed.
Sustainability 2023, 15(14), 11041; https://doi.org/10.3390/su151411041
Submission received: 15 June 2023 / Revised: 5 July 2023 / Accepted: 8 July 2023 / Published: 14 July 2023
(This article belongs to the Special Issue Groundwater, Soil and Sustainability)

Abstract

:
The current investigation aimed to assess the impact of land use changes on groundwater quality because of the extensive mining activities in the coal mining province of the Mahan River catchment area, which is located in the Surguja district of Chhattisgarh, India. The water quality index (WQI), Collin’s ratio, stable isotope ratios of water molecules (δ18O and δD), and various physicochemical parameters were measured to determine the suitability of water for domestic purposes. Water samples collected from dug wells, tube wells, river water, and mine water were analyzed, and the results revealed that 28% of the samples were classified as excellent and 44%were classified as good during the pre-monsoon period. In the post-monsoon period, 50% of the samples were categorized as good, while 35% were classified as poor, whereas in mining areas, 54% of samples were found to be unsuitable during the pre-monsoon period, and this increased to 77% in the post-monsoon period. Stable isotope analysis was also conducted: samples were plotted to the right of the Local Meteoric Water Line (LMWL) in the isotope bivariate plot, and the observed slopes for all samples were smaller than that of the LMWL. The enrichment of the δ18O ratio and negative d-excess values at certain locations suggest the occurrence of non-equilibrium processes and mixing mechanisms.

1. Introduction

Coal mining plays a significant role in India’s economic development as one of the core industries. However, it also leads to the degradation of environmental and hydrogeological conditions. The extraction of coal involves both opencast and underground mining methods, which have harmful effects on the environment, particularly water resources, due to the discharge of large volumes of mine water [1]. These mining activities not only disrupt the nature of interactions between groundwater and surface water but also contribute to significant air pollution and bring about drastic changes in the landscape [2].
In addition to these detrimental effects, such as landscape damage, soil erosion, loss of forest ecosystems, and the destruction of wildlife habitats, mining activities also give rise to significant issues related to mining waste disposal, metal contamination, and accelerated sedimentation resulting from the presence of unconsolidated materials. Moreover, land degradation caused by open-pit or underground mining activities, including excavation and the disposal of overburden, along with other associated activities, represents a major factor contributing to these concerns [3]. Since most open-cut operations intersect the natural water table, they invariably produce significant catchments for rainfall and runoff, which in turn causes an influx of surface water or subsurface water into the active mine workings [4]. In active mining areas, the constant flow of water in the mine front creates sludgy conditions. Surface runoff and leachate water produced by these materials will also contaminate adjacent water bodies.
It is further obvious that the environment created by coal mining operations favors the mobilization of metals into aquatic environments. Therefore, contaminated water resources containing high salt concentrations, sediments, metals, or other pollutants can pose exposure risks when utilized for various applications, such as domestic, agricultural, industrial, and irrigational purposes. According to a number of technical assessments, the consumption of contaminated water poses significant health hazards, like cholera, dysentery, polio, diarrhea, typhoid, and skin infections [5,6,7]. Identifying the source, origin, and flow pathways of mine seepage water is crucial for ensuring good-quality water, which is a necessity for a healthy nation. Although there are many statistical methods for an undisturbed groundwater regime, it is still difficult to investigate the hydrological regime of an active coal mining province; therefore, assessing the quality of water resources is a vital step toward achieving a sustainable environment [8]. Water quality, its movement, and distribution pattern can be studied using various methods, like the WQI (water quality index), factor analysis, stable isotope studies, principal component analysis, fuzzy logic, hierarchical cluster analysis, and multivariate and spatial analysis [9,10].
Conducting hydrogeochemical studies, coupled with the systematic analysis of stable isotopes, in coal mining areas is essential for comprehending the origin, mechanisms, distribution patterns, and processes involved. These studies are particularly crucial due to the various activities associated with coal mining, such as overburden removal, the generation of coal mine waste or mine drainage, resource exploitation, and the establishment of a balance within local and regional aquatic systems [11]. In mining areas, the isotopic signature of groundwater can also provide insights into the impact of mining activities on the local hydrological cycle. The discharge of mine water with a distinct isotopic composition can be identified and traced back to its source. This information can help to assess the potential risks associated with mine water discharge, such as the contamination of surface water or the degradation of downstream water quality [12]. Studies have indicated that groundwater recharge in the area primarily occurs through precipitation, while mining activities have a limited impact on the recharge process [13]. These studies have also revealed that the groundwater in the region exhibits long residence times and is influenced by processes such as evaporation and interactions with the surrounding rocks [14].
In recent years, the assessment of groundwater quality and its spatial analysis have become crucial for the effective management of groundwater resources. The integration of Geographic Information Systems (GISs) and methodologies like the water quality index (WQI) has emerged as a significant approach for combining groundwater quality assessment and spatial analysis, providing valuable spatial information. This integrated approach enables a better understanding and management of groundwater resources. The WQI is an excellent tool for determining the quality of the water and drinking suitability. It was originally developed by Horton and Brown [15,16], and it has been extensively employed in several studies to evaluate water quality. Stable isotopes, such as deuterium (δD) and oxygen-18 (δ18O), are inherent components of water and exhibit similar movement patterns to water itself [17,18]. These isotopes are widely utilized as environmental tracers to assess groundwater quality, track geochemical evolution, investigate rock–water interactions, analyze low-temperature geochemical parameters, understand recharge processes, and identify contamination mechanisms [19]. Moreover, stable isotopes are valuable for characterizing, interpreting, and modeling the hydrological cycle at different scales, including local, regional, and global, as they are not subject to radioactive decay or easily altered by other processes in closed systems [20].
To assess the effects of mining on water resources, a long-term database on water quality and systematic observations of water quality parameters, their origin, distribution, and dynamics are necessary. While studies have investigated groundwater quality and coal mines in various Indian coalfields, like Penchand, Singrauli, West Bokaro, Neyveli, and Raniganj [4,21], the Mahan River coal mining region has not been explored in terms of groundwater quality and stable isotope systematics. The main objectives of this study are to:
  • Assess the drinking water suitability of different sources of water in the mining province by using the water quality index method;
  • Map the spatial distribution of the WQI for the pre- and post-monsoon seasons;
  • Determine recharge sources, flow patterns, and pathways of both mine water and groundwater dynamics using stable isotopes (δ18O and δD) in the Mahan River catchment area.

2. Materials and Methods

2.1. Study Area

The study was conducted in the Bishrampur coalfield region of the Surguja district, located in Chhattisgarh, India. The study area spans approximately 717 square kilometers, with latitudes 23°00′ N–23°30′ N and longitudes 83°00′ E–83°45′ E encompassing it. The region includes several mines, namely, Bhatgaon UG, Mahan OC, Dugga UG, Mahamaya UG, Kalyani UG, Nawpara UG, Mahan-II OC, and Shivani UG. Figure 1 illustrates the location of the study area. The climate is tropical monsoon with a temperature range from 17.8 °C in winter to 30.1 °C in summer. However, due to hot winds in the summer, maximum temperatures can rise to 42.7 °C, and lowest temperatures can drop to 4.4 °C in the winter. Table 1 depicts the monthly fluctuations in precipitation and average temperature, with the most rainfall occurring in the month of July. The yearly rainfall ranges from 1100 to 1270 mm. The southwest monsoon, which lasts from mid-June to mid-October, brings significant amounts of rain. Around 80% of the annual rainfall is concentrated within this time of year, while the remaining 20% occurs between October and May, outside the monsoon season. The Mahan River and its tributaries encircle the region, and they are principally responsible for controlling the coalfield’s drainage. The geography of the area is undulating, and its elevation ranges from 446 m to 672 m above mean sea level (MSL). The Bishrampur coalfield is located in the northeastern corner of the Hasdeo Arand sub-basin, and it has a rectangular shape. It extends approximately 36 km from east to west and 35 km from north to south. In the eastern part of the Son Valley, the coalfields of Lakhanpur and Bishrampur are situated close to each other, forming twin basins. These basins are connected by a short section of the Talchir Formation.
According to the hydrogeology of the study area, the Barakar formation covers the majority of it and is made up of sandstone with varying grain sizes, shale layers, and coal seams in addition to soil cover. The below strata are made up primarily of compact sandstone with secondary porosity.

2.2. Water Sampling and Analysis

To obtain a preliminary understanding of the water quality in the Mahan River command area, a sample survey was conducted. The survey aimed to represent the hadrochemical conditions of the study area. A total of 50 water samples were collected during the pre-monsoon season, while 48 samples were collected during the post-monsoon season from various locations within the study area (Supplementary Materials). Using a portable GPS, the wells’ locations were marked with latitudes and longitudes. Prior to taking water samples, stagnant water was removed by pumping water from bore wells for around 30 min. After the collection of samples, digital meters were used to measure onsite characteristics, including pH and electrical conductivity (EC). Water was collected in 1 L polyethene bottles for the rest of the analysis. To ensure the removal of contaminants, both the bottles and caps underwent a thorough cleaning process, which involved rinsing them three times with the sample water. Additionally, the samples were filtered using 0.45 m Millipore filter paper prior to being added to the container. In order to prevent ion precipitation, nitric acid was used to acidify the samples intended for cation analysis. Titrimetry was used to measure Ca2+ and Mg2+ using regular EDTA. Utilizing a Flame Photometer (Jenway clinical flame photometer—PFP7 model), Na+ and K+ were measured. Titration was used to measure the concentrations of CO32− and HCO3. Sulfate was determined using a spectrophotometer (Optima 2100 DV ICP-OES spectrophotometer from PerkinElmer) and Cl- by using the common AgNO3 titration method. The colorimetric approach was used to measure nitrate. All of the results were compared to the drinking water quality standards set by the World Health Organization (WHO) and the Bureau of Indian Standards (BIS). The accuracy of the chemical analysis of each underground water sample was tested by computing the ionic balance error between the total concentration of cations (Ca2+, Mg2+, Na+, and K+) and the total concentration of anions (CO32−, HCO3, Cl, NO3, and SO42−) before the interpretation of the chemical data was started. The ionic-balance-error value was found to be below the desired threshold of 5% [22].
For stable isotope data, field campaigns were conducted in the pre-monsoon season to gather a total of 50 samples. Thorough sampling was performed to include all potential sources, and it included 13 samples from dug wells, 12 samples from tube wells, 13 samples from rivers, and 12 samples from mines. A Dual-Inlet Isotope Ratio Mass Spectrometer was used to analyze the δ18O and δD isotope ratios of water samples (GV Instruments, U.K). The CO2-H2O equilibration method was utilized for the δ18O analyses [23]. In contrast, for H2-H2O, equilibration was conducted in the presence of a platinum catalyst (marketed as Hokko beads). Each analysis employed 400µL water samples for the measurements of δ18O and δD. Using a triple-point calibration equation, the analyses were calibrated using the international standards Vienna-standard mean ocean water (V-SMOW), Greenland Ice Sheet Project (GISP), and Standard Light Antarctic Precipitation (SLAP). The analytical accuracy is within 0.1 and 1 for δ18O and δD measurements, respectively, based on 10-point repeated measurements of each sample to determine the overall precision. The isotopic ratios of the water samples, such as 18O/16O or D/H, were computed in relation to V-SMOW and are represented in terms of parts per million (‰).
R sample and RV-SMOW are the isotopic ratios of the sample and of the V-SMOW, respectively. The detailed methodology is shown in the flowchart in Figure 2.

2.3. Drinking Water Quality Index (WQI)

The WQI is an essential tool for interpreting the overall state of water quality in a straightforward and comprehensible way. The potability of the various water sources was analyzed using the weighted arithmetic quality method (WQI) [24]. The WQI for each of the water samples that were taken was evaluated. The twelve most important water quality indicators—pH, TDS, EC, Ca2+, Mg2+, Na+, K+, NO3, Cl, SO42−, HCO3, and F—that are typically used in groundwater analysis were chosen. For each of the groundwater’s physicochemical properties, a weight (wi) between 1 and 5 was assigned in this procedure [25]. The selection was based on its relative importance to the overall quality of drinking water [24]. After assigning the relative weight (Wi) (Table 2) for each parameter and computing the corresponding quality rating scale(qi), the WQI can be examined:
W i = w i i = 1 n w i
where n is the number of parameters. Using the following equation, the quality rating (qi) scale was calculated:
qi = (Ci/Si) ×100
where Si represents the standard value recommended by the World Health Organization (WHO) in 2022 for that specific parameter. Ci denotes the concentration of each parameter in the respective water sample, while SIi represents the sub-index:
SIi = Wi × qi
assessed for each parameter.
WQI = ΣSIi
Based on calculated WQI values, the water samples in the study area were divided into five different status groups: a WQI value of 0–25 is considered “excellent”, 26–50 is considered “good”, 51–75 is considered “poor”, 76–100 is considered “very poor”, and a WQI value above 100 is considered “unfit”.

3. Results

3.1. Drinking Water Quality Index (WQI)

A water quality index (WQI) analysis offers reliable information on the suitability of drinking water and is widely utilized as a fast yet efficient method. The pre-monsoon and post-monsoon WQI values were found to range from 13.18 to 251.69 and 26.13 to 156.65, respectively. This suggests that the mining activities in the area have a significant impact on the water quality. Also, these findings indicate that 28% of the samples were excellent and 44% were good for the pre-monsoon season, while 50% were good and 35% were poor samples for the post-monsoon season. Water from 53.85% and 76.92%of the mine-affected area was found “unsuitable” during the pre- and post-monsoon seasons, respectively. As per WQI values (Supplementary Materials), sample no. 47 from the pre-monsoon season and 14 and 46 from the post-monsoon season are very poor in respect of drinking purposes because of the presence of mine water discharge points in these particular locations. The presence of discharge points in certain locations has led to the contamination of water and has resulted in poor water quality. The spatial distribution of WQI was drawn using the IDW feature of Arc Map 10.3 (Figure 3), which indicates that the western part has poor water quality, which can be attributed to coal mining activities in the region. Coal mining involves the extraction of coal from underground mines, which requires the pumping of large volumes of groundwater to facilitate mining operations. This leads to the discharge of large volumes of mine water into the environment, which can contain a range of contaminants, including heavy metals and other chemicals.
These contaminants can have adverse effects on water quality, leading to a decline in WQI values. The comparison of pre- and post-monsoon water quality index (WQI) values reveals a substantial disparity in water quality between the mining and non-mining areas. The western portion of the study area exhibits poor water quality, primarily attributed to the discharge of mine water originating from the coal mines located in that region.
On the other hand, the northeastern and southeastern parts of the study area have better water quality, which may be due to the absence of significant mining activities in those regions. The spatial distribution of WQI highlights the importance of the proper management of mining activities to minimize the impact on water quality in the region.

3.2. Collin’s Ratio

Collin’s ratio (CR) is estimated by applying the following formula (Equation (5)), where ions are in meq/L:
CR = Cl/CO32−+HCO3
If the CR value is less than or equal to 1, it indicates that the water is suitable for drinking. However, if the CR value falls between 1 and 3, it suggests that the water is contaminated with saline water. Water with a CR value above 6 is considered harmful to health [26]. The concentration of Collin’s ratio in water varied from 0.001 to 4.490 meq/L and 0.038 to 2.336 meq/L for the pre- and post-monsoon seasons, respectively. The study shows that a significant proportion of water samples in the Mahan River catchment area meet the safe limit for drinking purposes. Specifically, 56% of the samples from the pre-monsoon season and 40% of the samples from the post-monsoon season were categorized as safe for drinking (Supplementary Materials). However, the study also identified one sample from the mining area during the pre-monsoon season that was found to be injurious to health. This highlights the potential risks associated with mining activities for water quality (Figure 4).
Furthermore, the study also shows that some parts of the mining areas, during both the pre- and post-monsoon seasons, have good-quality water. This is due to several factors, including the proper management of mining activities, the effective treatment of mine water before discharge, or the absence of mining activities in some parts of the region. However, these areas may be limited in extent, and the overall impact of mining activities on water quality remains a significant concern.

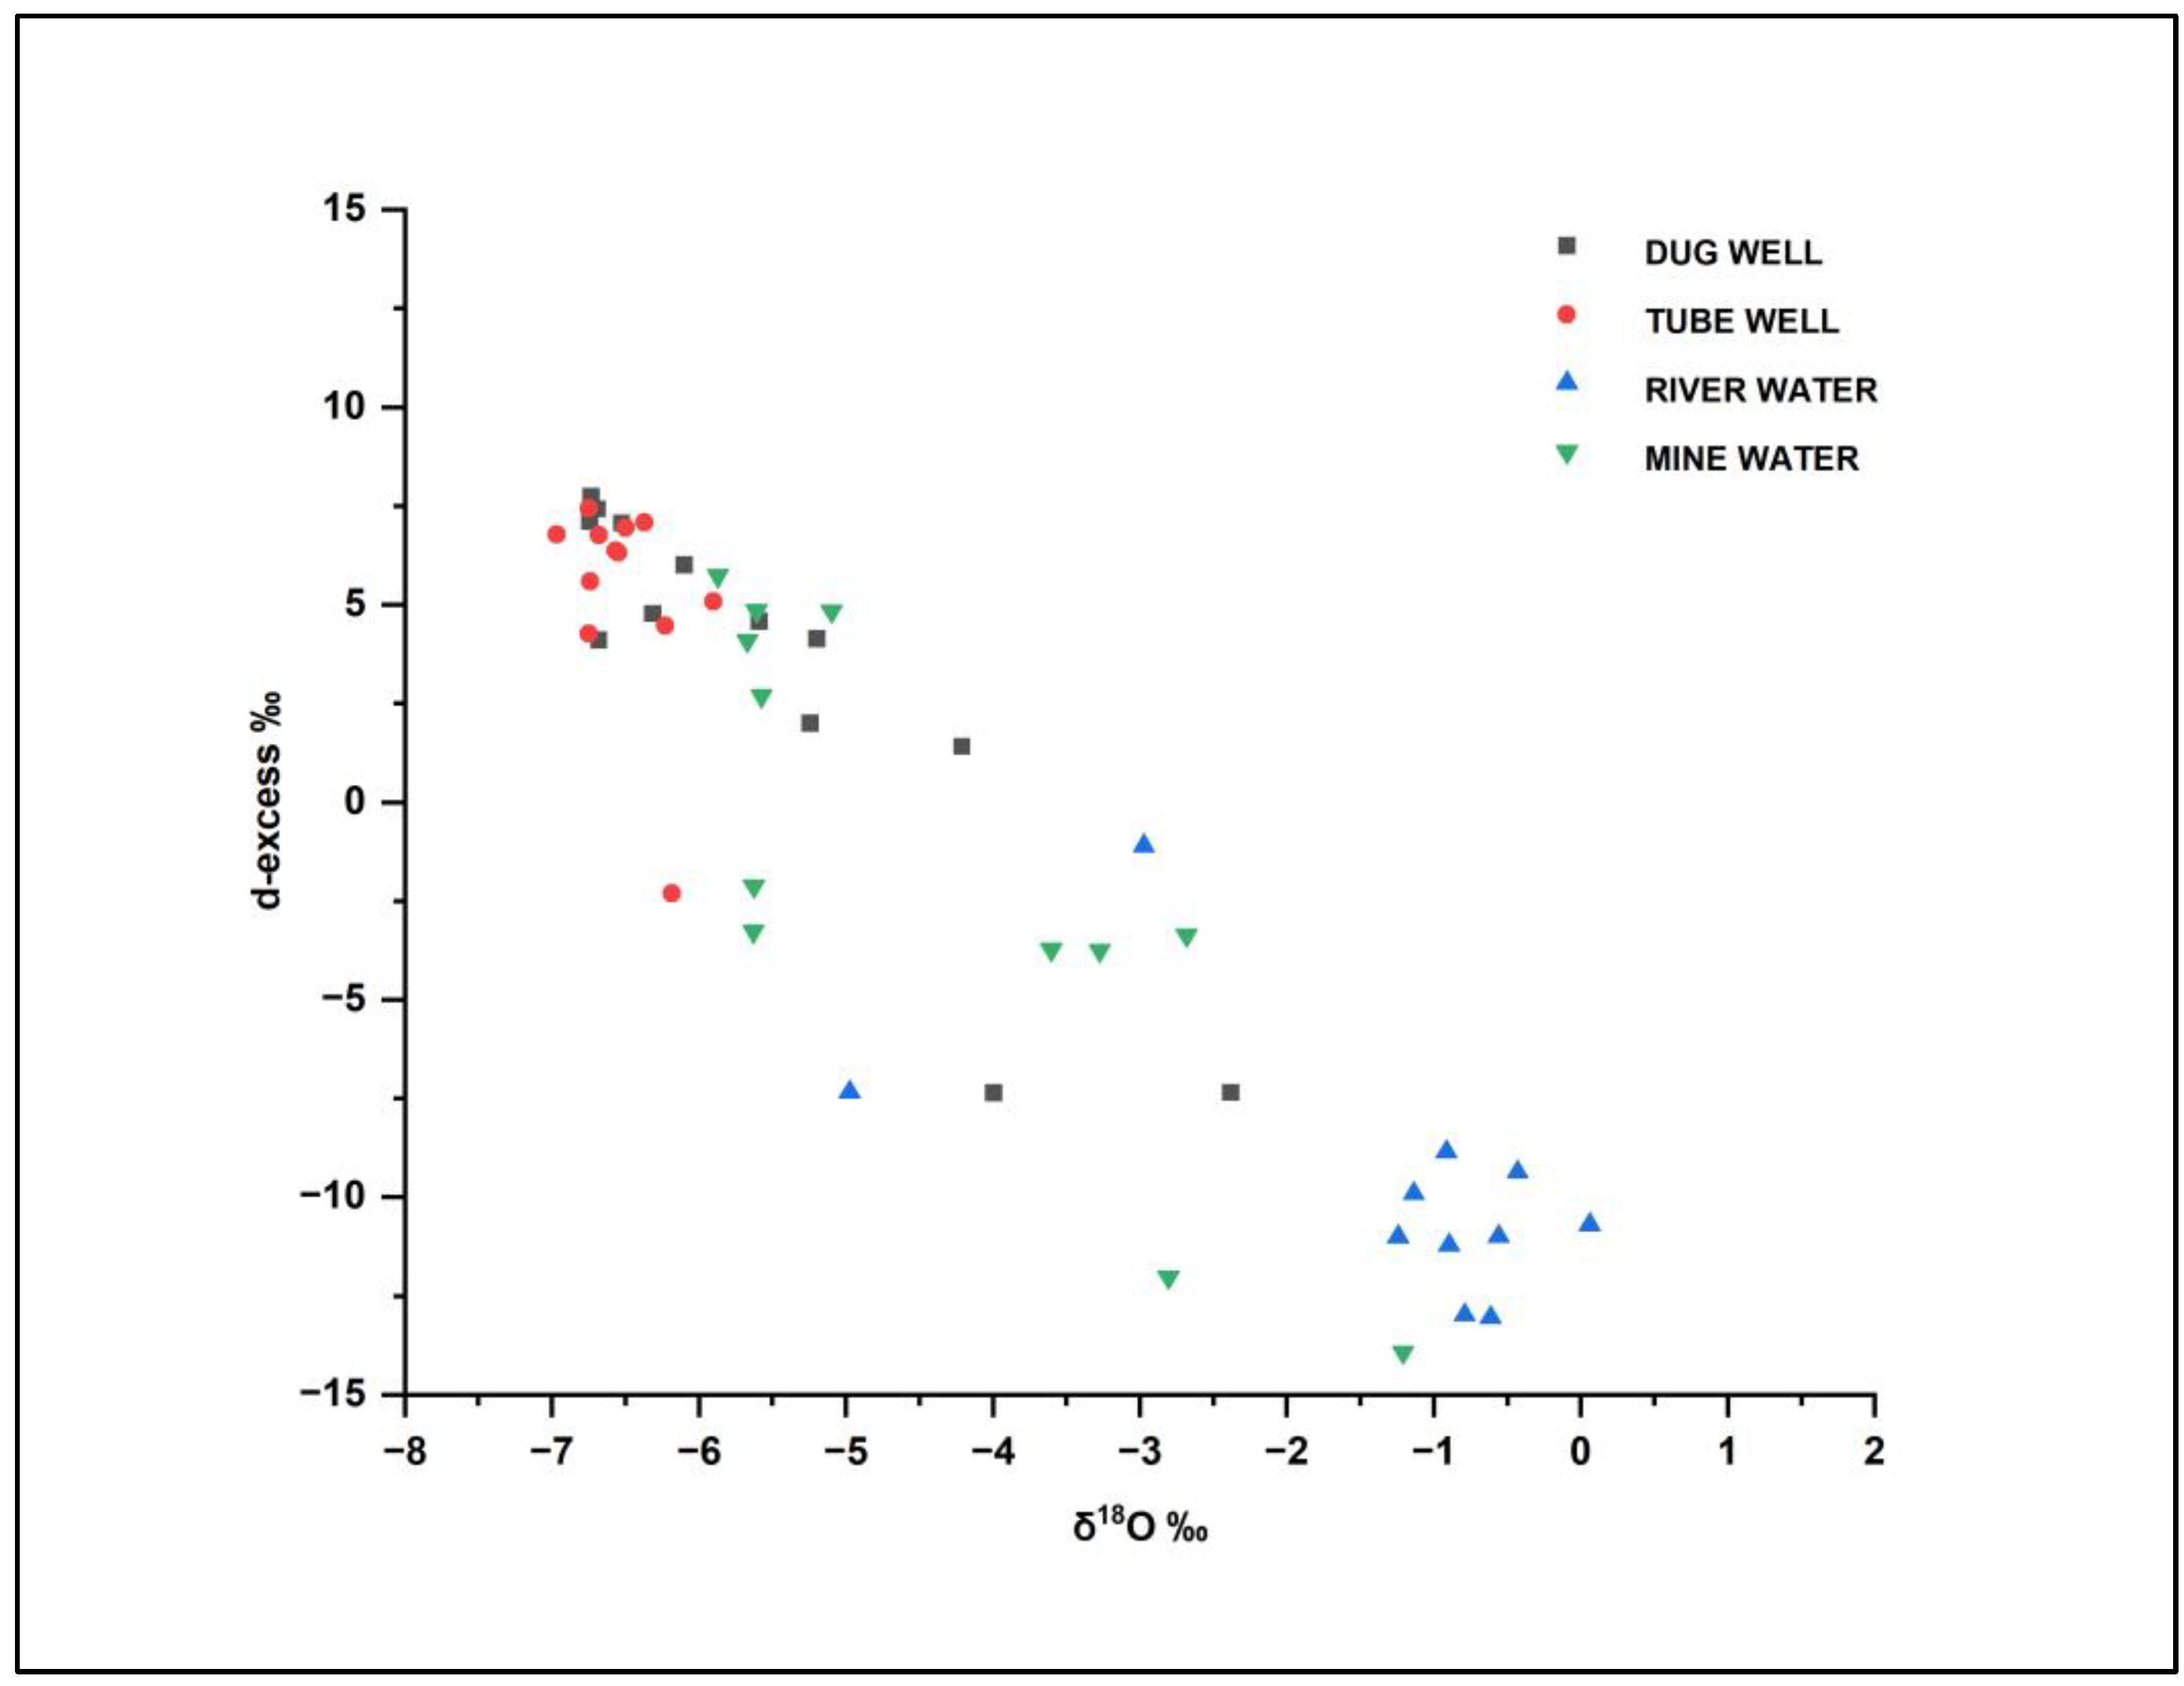
3.3. Stable Isotope Systematics

The isotopic compositions of various water sources, like tube well, dug well, river water, and mine water samples, are listed in Table 3 (Supplementary Materials). The δ18O values of dug well samples range from (−6.73‰) to (−2.38‰), and δD values range from (−49.34‰) to (−32.27‰). The average values of δ18O and δD in dug well water samples are (−5.57‰) and (−41.35‰), respectively. The δ18O and δD compositions for tube well samples range from (−6.97‰) to (−5.90‰), with a mean of (−6.51‰), and from (−51.79‰) to (−43.89‰), with a mean of (−46.72‰), respectively. The δ18O and δD values for river water vary between (−4.98‰) and (5.13‰), with an average of −0.81‰, and from −47.15 ‰ to −10.21‰, with an average of −16.88, respectively. In the case of the mine water samples, δ18O and δD ratios range from −5.87‰ to −1.21‰ and −47.13‰ to −23.60‰, with mean values of −4.39‰ and −36.76‰, respectively. A statistical summary of stable isotope ratios δD and δ18O, along with a d-excess, is shown in the box plot (Figure 5). The Local Meteoric Water Line (LMWL) (δD=7.95×δ18O+9) [27] and the Global Meteoric Water Line (GMWL) (δD=8×δ18O+10) [28] are plotted in Figure 6.
The GMWL plots parallel to the LMWL in the current study; however, the LMWL is used as a reference to reflect local precipitation, which is offset slightly below the GMWL, as shown in Figure 6. Local factors, such as the moisture sources and evaporation modes, which result from changes in the climate and geographic features, caused the LMWL to differ slightly from the GMWL [29].
The majority of the water samples, as seen in Figure 6, do not plot on the LMWL trend line but rather deviate to the right side. The deviation of some of the water samples to the right of the LMWL suggests the influence of evaporation. This is in line with the findings showing that evaporation can cause the isotopic composition of water to shift to the right of the LMWL [30,31]. This is because the lighter isotopes preferentially evaporate, leaving the remaining water enriched in the heavier isotopes. Furthermore, a study on the stable isotopes of groundwater in a coal mining area in China showed that the systematic enrichment of heavy isotopes in mine water was due to mixing and evaporation [32]. The authors explained that seepages from various aquifers, both confined and unconfined, were collected in a sump, and water with low isotopic ratios was subjected to evaporation. This led to the enrichment of the remaining water with heavier isotopes due to non-equilibrium isotopic fractionation or kinetic evaporation at low humidity.
The findings suggest that meteoric water is the main source of groundwater in the study area. Some water samples located near the Local Meteoric Water Line (LMWL) exhibit minimal to no isotopic alterations. The systematic enrichment of heavy isotopes observed in the mine water samples is likely attributed to mixing processes and evaporation. As water seepages from different aquifers, including both confined and unconfined aquifers, and accumulate in a sump, water with lower isotopic ratios undergoes a transformation into the vapor phase through evaporation. Subsequently, a non-equilibrium isotopic fractionation or kinetic evaporation process occurs at low humidity, resulting in the enrichment of the remaining water with heavier isotopes. The enrichment of heavy isotopes in river water may be caused by analogous mechanisms, mostly as a result of the river’s greater surface area being subjected to evaporation. The analysis reveals a significant correlation between the river water and the mine water samples, providing evidence of a connection between the river water and the coal-bearing aquifer formations, specifically the Barakar sandstone. The deviation of tube well water samples from the other group of water samples is due to a number of reasons. Tube wells are generally located in areas where the geology and hydrology are different from those of other water sources, such as dug wells, river water, and mine water. The tube wells in the study area may be tapping into a different aquifer or groundwater system, resulting in a different isotopic composition compared to the other water sources.
Also, wells in the study area are influenced by anthropogenic activities such as irrigation or contamination from nearby sources, which affects the isotopic composition of the water. Studies have shown that agricultural practices, such as irrigation, can alter the isotopic composition of groundwater due to changes in the hydrological cycle and evapotranspiration [33]. Similarly, anthropogenic contamination can result in significant isotopic shifts in groundwater due to the addition of isotopically distinct contaminants (e.g., fertilizers, pesticides, or wastewater) [34].
In addition, the tube well water is influenced by local meteorological factors, such as the amount and timing of precipitation, temperature, and humidity. These factors have the potential to influence the isotopic composition of precipitation, which in turn can impact the isotopic composition of groundwater. For example, seasonal changes in precipitation patterns can lead to variations in the isotopic composition of groundwater [35]. Temperature and humidity can also affect the degree of evaporation and isotopic fractionation, leading to changes in the isotopic composition of groundwater [36].
Deuterium excess (d-excess) is the difference between the isotopes of 18O and D and is computed as d-excess = δD−8×δ18O [37]. It relies on an area’s relative humidity and the rate at which precipitation evaporates [29,37]. The d-excess parameter serves as an index of the evaporation rate and has been used as a diagnostic tool for assessing evaporation. High evaporation is typically indicated by extremely negative d-excess values. Due to the high-evaporation conditions present in the pre-monsoon season, the d-excess values are also considerably more negative in the case of river waters in the study area (Figure 7). The d-excess values of the study range from +9.37‰ to −19.20‰. In the case of river water, the minimum isotopic composition (average −10.44‰) suggests a considerable influence of evaporation during the pre-monsoon season. This can be attributed to the subtropical climatic conditions prevalent in the study area, characterized by hot and dry summers (Figure 8). Tube well, dug well, and mine water samples have higher d-excess (average: +5.40 ‰, +3.21 ‰, −1.67 ‰, respectively) values compared to the river water, which is an indication that the samples have lower evaporation than the river water samples.
The results show that the tube well and dug well samples plot near the LMWL in the bivariate plot, indicating a meteoric origin with weak evaporation. However, in Figure 6, the tube well samples are found to deviate from the LMWL line. The reason for this discrepancy is that the tube well samples may be affected by mixing with groundwater from a different aquifer or system with a different isotopic composition. This could result in a different overall isotopic composition for the tube well water compared to the other sources, even though it still falls within the general meteoric water range on the bivariate plot. Also, the tube well samples have been affected by localized evaporation or other processes that altered their isotopic composition.

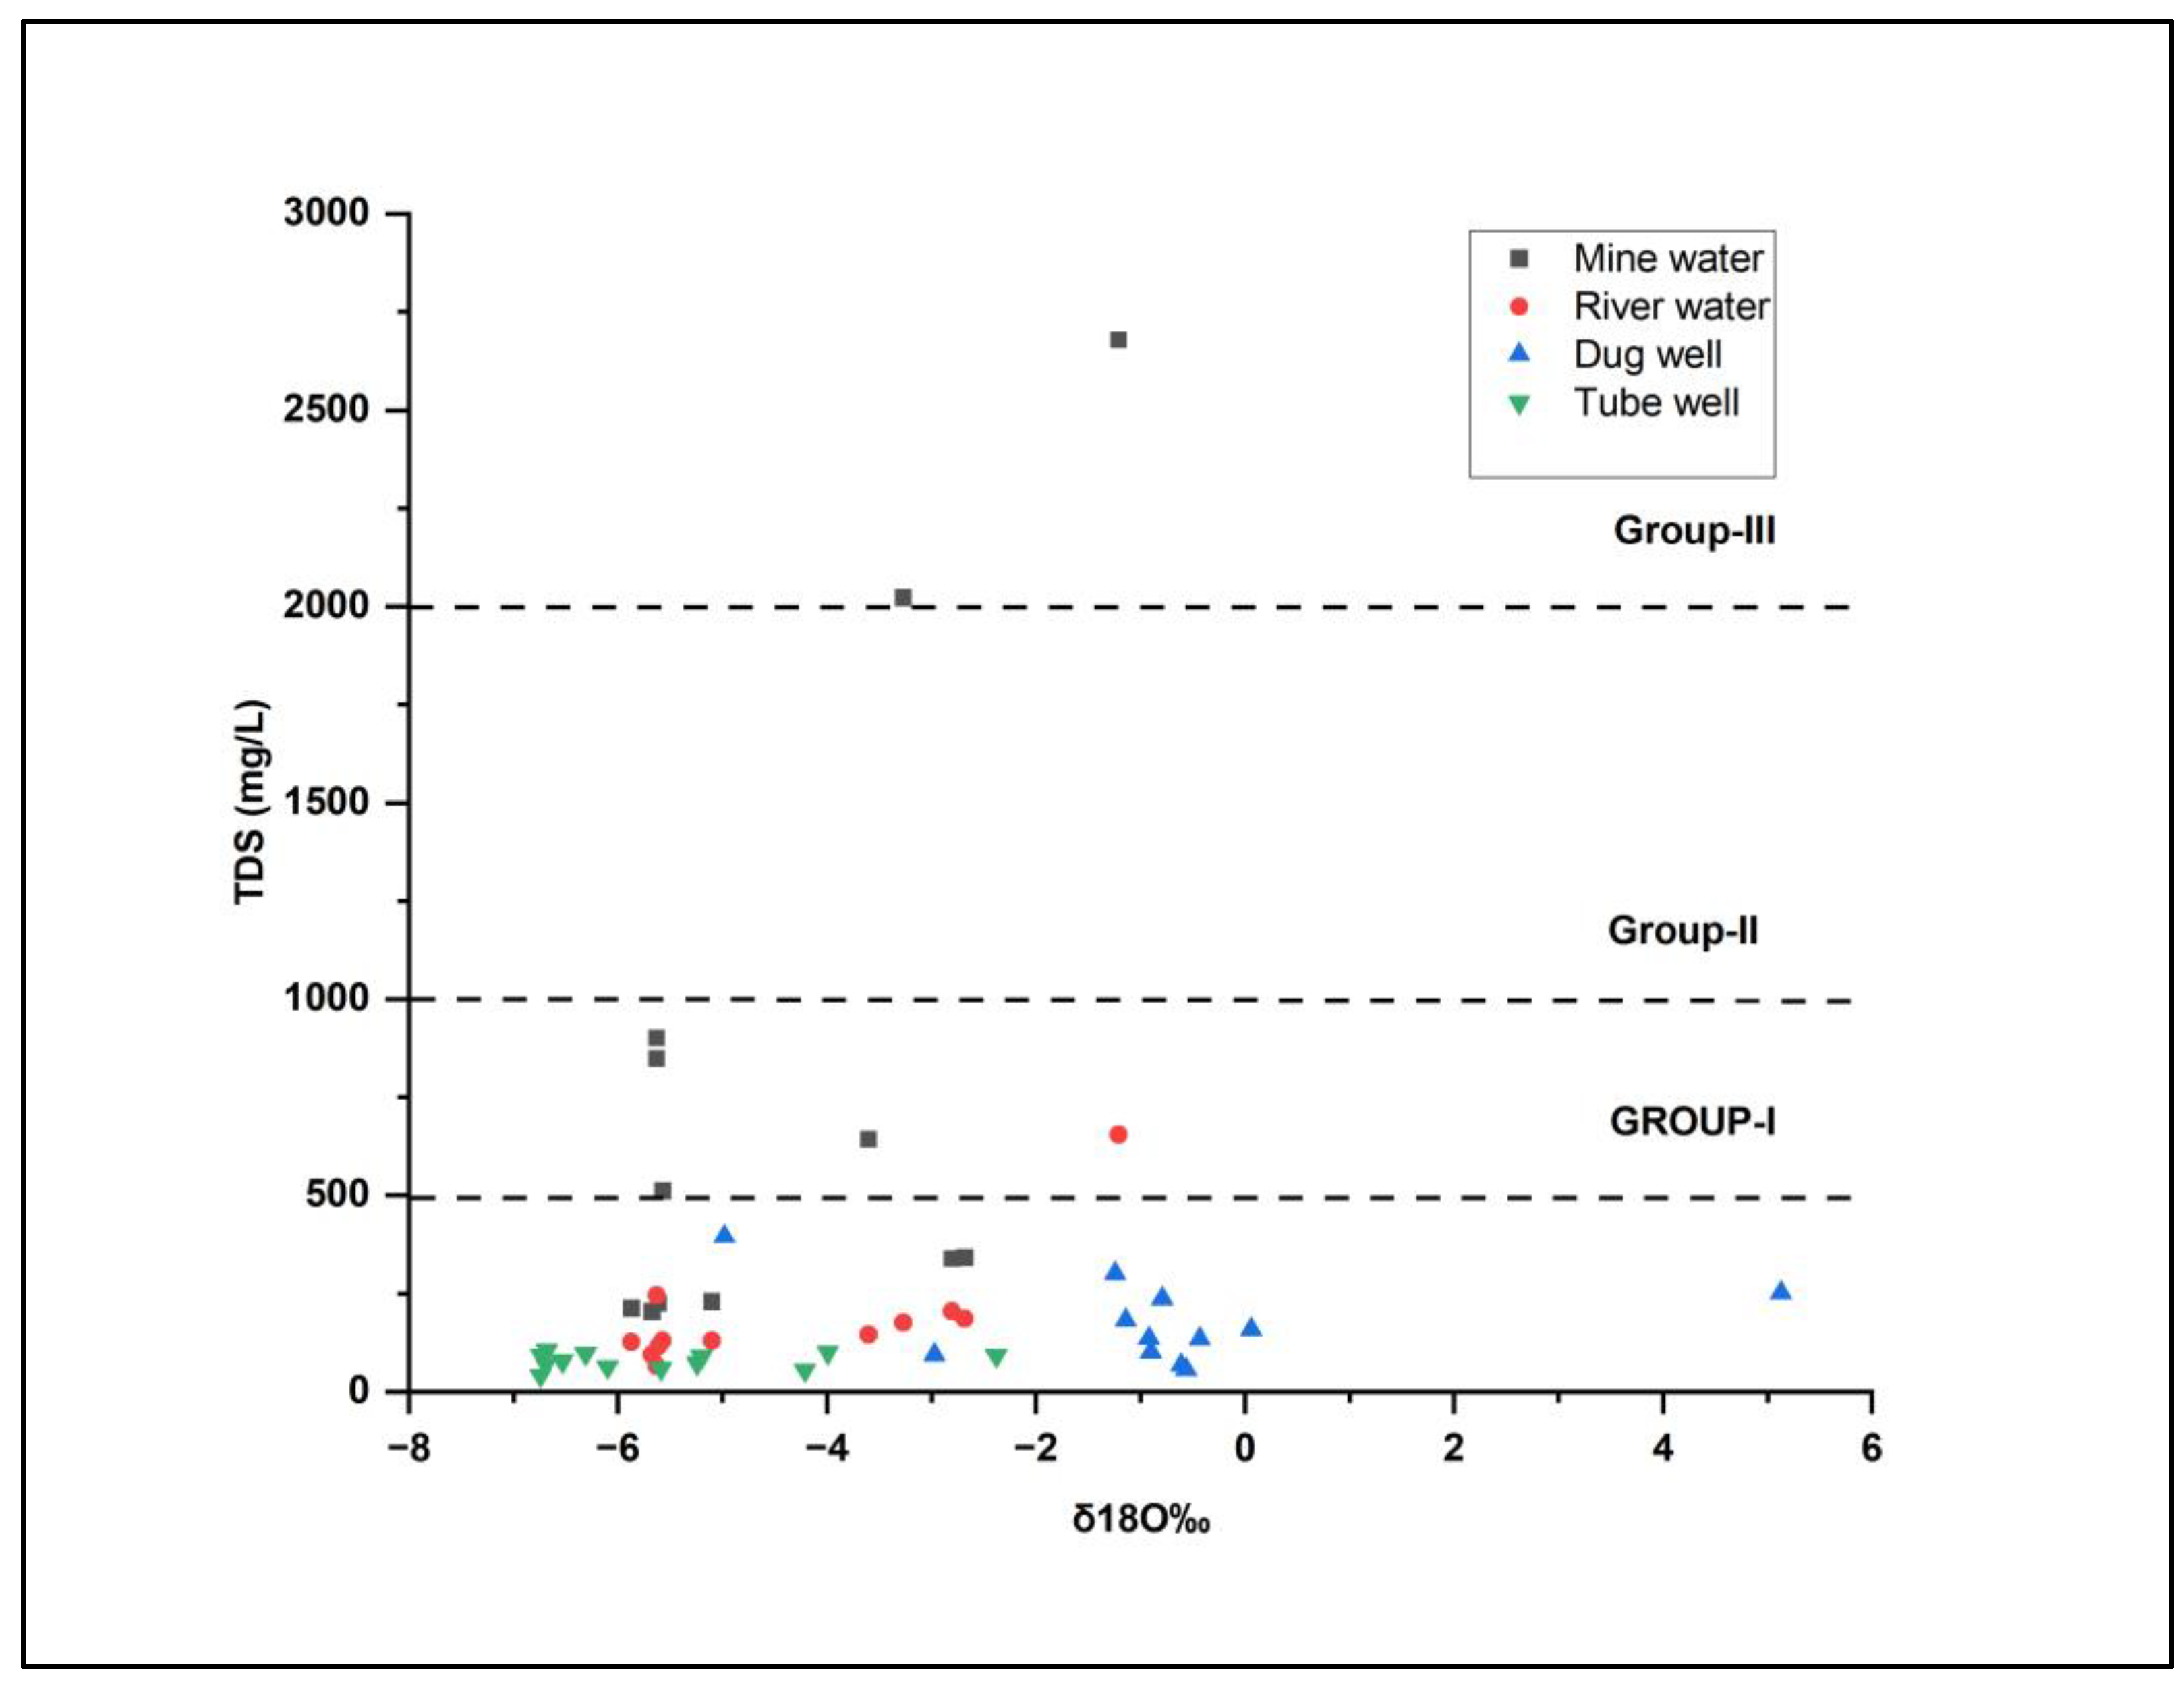
3.4. Relationship between TDS and Stable Isotopes (δ18O)

The relationship between the concentration of Total Dissolved Solids (TDS) and stable environmental isotope ratios may not exhibit a direct correlation. However, a comprehensive analysis considering both parameters can yield valuable insights regarding the origin of water and the primary processes governing its chemical composition. The TDS concentration serves as a reliable indicator of aquifer dissolution, while the δ18O isotope ratio provides information about the source and genesis of the water. Figure 9 illustrates a moderate correlation (R2=0.441) between δ18O and the TDS concentration. Moreover, it also enables the identification of three distinct groups within the water samples. Group 1 comprises dug well, tube well, river water, and a few mine water samples exhibiting TDS values below 500 mg/L and δ18O ranging from −7 to 0‰. These samples show minimal mineralization, indicating the negligible presence of dissolved solids. Group 2 encompasses water samples with TDS values ranging from 500 to 1000 mg/L and δ18O isotope ratios between −6‰ and 0‰. This suggests that these samples have likely undergone mixing, moderate mineralization, and partial evaporation. Finally, Group 3 consists solely of a few mine water samples characterized by TDS values equal to or exceeding 2000 mg/L, signifying a substantial degree of mineralization, likely influenced by evaporation.

4. Discussion

Differences in water quality between pre-monsoon and post-monsoon seasons can be attributed to various factors, including changes in precipitation patterns and the associated hydrological processes. During the pre-monsoon season, the Mahan River catchment area receives a lower amount of rainfall, leading to the reduced dilution of pollutants and contaminants in the groundwater. As a result, the water quality index (WQI) values in the pre-monsoon season ranged from 13 to 252, indicating a wider range of water quality. In contrast, the post-monsoon season experiences a higher volume of rainfall, which contributes to increased surface runoff and infiltration into the aquifer. This enhanced recharge helps in diluting the pollutants and improving the overall water quality. The WQI values during the post-monsoon season ranged from 26 to 157, showing a narrower range compared to the pre-monsoon season. The correlation between the data on water quality and precipitation further supports this understanding. Higher levels of rainfall during the post-monsoon season result in greater dilution and the flushing of pollutants, leading to improved water quality. Conversely, the lower precipitation in the pre-monsoon season allows for less dilution and a greater accumulation of pollutants, leading to a wider range of water quality values.
It is important to note that other factors, such as human activities, mining operations, and the discharge of mine effluents, also contribute to the differences in water quality observed between the two seasons. These factors can introduce additional contaminants and pollutants into the groundwater, exacerbating the existing water quality issues in the core mining areas.
Understanding the variations in water quality between pre-monsoon and post-monsoon seasons is crucial for effective water resources management and implementing preventive measures to mitigate groundwater contamination in coal mining areas. By considering precipitation data and its influence on dilution and recharge processes, appropriate strategies can be developed to safeguard water resources and ensure sustainable access to safe drinking water.

5. Conclusions

Groundwater analysis in the coal mining region of the Mahan River catchment involves the application of various methods and techniques to evaluate the suitability of groundwater for drinking purposes and determine the sources of aquifer recharge. The water quality index, Collin’s ratio, and isotopic stability (δ18O, δD) were used to demonstrate whether water samples from the Mahan River catchment area are suitable for human use. The WQI values were found to be between 13.18 and 251.69 pre-monsoon and between 26.13 and 156.65 post-monsoon, respectively. Based on these values, 28% of the samples were classified as excellent drinking water and 44% were good water for the pre-monsoon season, while 50% of samples were classified as good and 35% were poor in the post-monsoon season. Water from 53.85% and 76.92% of mine-affected areas was found to be “unsuitable” during pre- and post-monsoon seasons, respectively. Two sampling stations from both seasons exhibited “unfit”-quality water for domestic purposes. The poor and unfit groundwater quality was especially found in the core mining areas of the study area due to several factors, such as the extensive water usage in ore processing, water pollution resulting from the discharge of mine effluent, and seepage from tailings and waste rock impoundments. Furthermore, it is important to note that using groundwater from these areas as a drinking water source may pose hazards to human health. As a result, it is essential to explore alternative drinking water resources in these regions to ensure the provision of safe and suitable drinking water for the local population. Dugwell, tube well, river water, and mine water samples from the catchment area were also analyzed for stable isotope studies. The samples in the isotope bivariate plot fall to the right of the LMWL, and the observed slopes for all the samples are smaller than that of the LMWL, indicating that the water mainly originated from precipitation that underwent weak evaporation. The presence of enrichment in the δ18O ratio and negative d-excess values at certain locations indicates the occurrence of non-equilibrium processes and mixing mechanisms. These findings have practical implications for water resources management and groundwater inrush prevention in coalfields and other coal mines.

Supplementary Materials

The following supporting information can be downloaded at: https://www.mdpi.com/article/10.3390/su151411041/s1, Table S1: WQI of different water sources for the pre and post-monsoon seasons. Table S2: Collin’s ratio of different water sources in pre and post-monsoon seasons. Table S3: δD, δ18O and d-excess values for the water samples of the study area. Table S4: Physico-chemical parameters of various water sources during Pre-monsoon season. Table S5: Physico-chemical parameters of various water sources during Post-monsoon season.

Author Contributions

Conceptualization, R.K., R.S., A.K.S., S.N.S., S.K. and S.P.; methodology, R.K., R.S., A.K.S., S.N.S., S.K. and S.P.; software, R.K. and S.P.; validation, R.K., R.S., A.K.S., S.N.S., S.K. and S.P.; formal analysis, R.K., R.S., A.K.S., S.N.S. and S.P.; investigation, R.K., R.S., A.K.S., S.N.S. and S.K.; resources, R.K., R.S. and A.K.S.; data curation, R.K., R.S. and A.K.S.; writing—original draft preparation, R.K., R.S., A.K.S., S.N.S., S.K. and S.P.; writing—review and editing, R.K., R.S., A.K.S., S.N.S., S.K. and S.P.; visualization, R.K., R.S., A.K.S., S.N.S. and S.K.; supervision, R.S., A.K.S., A.E.R. and A.M.; project administration, R.S., A.K.S., A.E.R. and A.M.; funding acquisition, A.M. All authors have read and agreed to the published version of the manuscript.

Funding

This research received no external funding.

Institutional Review Board Statement

Not applicable.

Informed Consent Statement

Not applicable as this study didn’t involve human beings.

Data Availability Statement

All the data used to support the findings of this study are included within the article.

Acknowledgments

We gratefully acknowledge the support and resources provided by the Birla Institute of Technology, Mesra, and National Institute of Hydrology, Roorkee. Their contributions were invaluable in completing this research. We extend our thanks to the faculty and staff for their assistance and guidance throughout the study.

Conflicts of Interest

The authors declare no conflict of interest.

References

  1. Dvořáček, J.; Slivka, V. A note on the last stages of an underground coal mine life cycle in the Czech Republic. Miner. Energy -Raw Mater. Rep. 2004, 19, 32–35. [Google Scholar] [CrossRef]
  2. Choubey, V.D.; Rawat, R.K. Hydrogeologic and environmental impact of amjhore pyrite mines, India. Environ. Geol. 1991, 17, 51–60. [Google Scholar] [CrossRef]
  3. Tiwary, R.K.; Dhakate, R.; Rao, V.A.; Singh, V.S. Assessment and prediction of contaminant migration in ground water from chromite waste dump. Environ. Geol. 2005, 48, 420–429. [Google Scholar] [CrossRef]
  4. Surinaidu, L.; Rao, V.G.; Rao, N.S.; Srinu, S. Hydrogeological and groundwater modeling studies to estimate the groundwater inflows into the coal Mines at different mine development stages using MODFLOW, Andhra Pradesh, India. Water Resour. Ind. 2014, 7–8, 49–65. [Google Scholar] [CrossRef] [Green Version]
  5. Liang, M.C.; Ning, Z.G.; Li, Y.K.; Song, P.; Wu, N.; Yang, P. Dynamic biofilm component in reclaimed water during rapid growth period. Environ. Earth Sci. 2015, 73, 4325–4338. [Google Scholar] [CrossRef]
  6. World Health Organization. Guidelines for Drinking-Water Quality: Fourth Edition Incorporating the First Addendum; World Health Organization: Geneva, Switzerland, 2017. [Google Scholar]
  7. Egbueri, J.C.; Enyigwe, M.T. Pollution and Ecological Risk Assessment of Potentially Toxic Elements in Natural Waters from the Ameka Metallogenic District in Southeastern Nigeria. Anal. Lett. 2020, 53, 2812–2839. [Google Scholar] [CrossRef]
  8. Wu, Q.; Fan, S.; Zhou, W.; Liu, S. Application of the Analytic Hierarchy Process to Assessment of Water Inrush: A Case Study for the No. 17 Coal Seam in the Sanhejian Coal Mine, China. Mine Water Environ. 2013, 32, 229–238. [Google Scholar] [CrossRef]
  9. Awaleh, M.O.; Boschetti, T.; Adaneh, A.E.; Chirdon, M.A.; Ahmed, M.M.; Dabar, O.A.; Soubaneh, Y.D.; Egueh, N.M.; Kawalieh, A.D.; Kadieh, I.H.; et al. Origin of nitrate and sulfate sources in volcano-sedimentary aquifers of the East Africa Rift System: An example of the Ali-Sabieh groundwater (Republic of Djibouti). Sci. Total Environ. 2022, 804, 150072. [Google Scholar] [CrossRef]
  10. Parizi, H.S.; Samani, N. Environmental Isotope Investigation of Groundwater in the Sarcheshmeh Copper Mine Area, Iran. Mine Water Environ. 2014, 33, 97–109. [Google Scholar] [CrossRef]
  11. Kumar, N.; Tiwari, M.K.; Singh, R.; Singh, A.K. Chemometrics in Ascertaining Hydrogeochemical Characteristics of Coal Mine Discharge vis-à-vis Behaviour of Surface and Groundwater Resources of the Mahan River Catchment Area, Central India. Mine Water Environ. 2022, 41, 518–532. [Google Scholar] [CrossRef]
  12. Akudinobi, B.E.B. Qualitative Characterization of Groundwater Sources around Nigeria National Petroleum Cooperation Oil Depot Aba, Using Multiple Linear Regressions Modelling. 2018. Available online: https://sciencepubco.com/index.php/IJAG/article/view/8789 (accessed on 16 January 2018).
  13. Singh, R.; Venkatesh, A.S.; Syed, T.H.; Surinaidu, L.; Pasupuleti, S.; Rai, S.P.; Kumar, M. Stable isotope systematics and geochemical signatures constraining groundwater hydraulics in the mining environment of the Korba Coalfield, Central India. Environ. Earth Sci. 2018, 77, 548. [Google Scholar] [CrossRef]
  14. Drever, J.I.; Stillings, L.L. The role of organic acids in mineral weathering. Colloids Surf. A Physicochem. Eng. Asp. 1997, 120, 167–181. [Google Scholar] [CrossRef]
  15. Horton, J.H.; Hawkins, R.H. Flow path of rain from the soil surface to the water table. Soil Sci. 1965, 100, 377–383. [Google Scholar] [CrossRef]
  16. Brown, R.M.; McClelland, N.I.; Deininger, R.A.; Tozer, R.G. A Water Quality Index—Do We Dare. Water Sew. Work. 1970, 117, 339–343. [Google Scholar]
  17. Zhan, L.; Chen, J.; Zhang, S.; Li, L.; Huang, D.; Wang, T. Isotopic signatures of precipitation, surface water, and groundwater interactions, Poyang Lake Basin, China. Environ. Earth Sci. 2016, 75, 1–14. [Google Scholar] [CrossRef]
  18. Kumar, S.; Venkatesh, A.S.; Singh, R.; Udayabhanu, G.; Saha, D. Geochemical signatures and isotopic systematics constraining dynamics of fluoride contamination in groundwater across Jamui district, Indo-Gangetic alluvial plains, India. Chemosphere 2018, 205, 493–505. [Google Scholar] [CrossRef]
  19. Hassen, I.; Hamzaoui-Azaza, F.; Bouhlila, R. Application of multivariate statistical analysis and hydro-chemical and isotopic investigations for evaluation of groundwater quality and its suitability for drinking and agriculture purposes: Case of Oum Ali-Thelepte aquifer, central Tunisia. Environ. Monit. Assess. 2016, 188, 1–20. [Google Scholar] [CrossRef]
  20. Prada, S.; Figueira, C.; Aguiar, N.; Cruz, J.V. Stable isotopes in rain and cloud water in Madeira: Contribution for the hydrogeologic framework of a volcanic island. Environ. Earth Sci. 2015, 73, 2733–2747. [Google Scholar] [CrossRef]
  21. Gupta, S.K.; Deshpande, R.D.; Bhattacharya, S.K.; Jani, R.A. Groundwater δ18O and δD from central Indian Peninsula: Influence of the Arabian Sea and the Bay of Bengal branches of the summer monsoon. J. Hydrol. 2005, 303, 38–55. [Google Scholar] [CrossRef]
  22. Domenico, P.A.; Schwartz, F.W. Physical and Chemical Hydrogeology, 2nd ed.; John Wiley & Sons: New York, NY, USA, 1990. [Google Scholar]
  23. Epstein, S.A.; Mayeda, T.K. Variation of O18 content of waters from natural sources. Geochim. Cosmochim. Acta 1953, 4, 213–224. [Google Scholar] [CrossRef]
  24. Egbueri, J.C.; Mgbenu, C.N.; Chukwu, C.N. Investigating the hydrogeochemical processes and quality of water resources in Ojoto and environs using integrated classical methods. Model. Earth Syst. Environ. 2019, 5, 1443–1461. [Google Scholar] [CrossRef]
  25. Singh, P.; Khan, I.A. Groundwater quality assessment of Dhankawadi ward of Pune by using GIS. Int. J. Geomat. Geosci. 2011, 2, 688–703. [Google Scholar]
  26. Joji, V.S. Hydrochemistry of Ground Water; Archers and Elevators Publishing House: Karnataka, India, 2018; ISBN 978-93-86501-745. [Google Scholar]
  27. Ray, R.K.; Syed, T.H.; Saha, D.; Sarkar, B.C.; Reddy, D.V. Recharge mechanism and processes controlling groundwater chemistry in a Precambrian sedimentary terrain: A case study from Central India. Environ. Earth Sci. 2017, 76, 1–15. [Google Scholar] [CrossRef]
  28. Craig, H. Isotopic Variations in Meteoric Waters. Science 1961, 133, 1702–1703. [Google Scholar] [CrossRef]
  29. Clark, I.D.; Fritz, P. Environmental Isotopes; Hydrology Lewis Publishers: Boca Raton, NY, USA, 1997. [Google Scholar]
  30. Asmael, N.M.; Huneau, F.; Garel, E.; Celle-Jeanton, H.; Le Coustumer, P.; Dupuy, A.; Hamid, S. Origin and Recharge Mechanisms of Groundwater in the Upper Part of the Awaj River (Syria) Based on Hydrochemistry and Environmental Isotope Techniques. Arab. J. Geosci. 2015, 8, 10521–10542. [Google Scholar] [CrossRef]
  31. Gattacceca, J.C.; Vallet-Coulomb, C.; Mayer, A.; Claude, C.; Radakovitch, O.; Conchetto, E.; Hamelin, B. Isotopic and geochemical characterization of salinization in the shallow aquifers of a reclaimed subsiding zone: The southern Venice Lagoon coastland. J. Hydrol. 2009, 378, 46–61. [Google Scholar] [CrossRef]
  32. Duan, D.; Liu, Y.; Tian, F.; Li, D.; Huang, X.; Zhao, Z.; Yu, H.; Liu, B.; Tian, W.; Cui, T. Pressure-induced metallization of dense (H2S)2H2 with high-Tc superconductivity. Sci. Rep. 2014, 4, 6968. [Google Scholar] [CrossRef] [Green Version]
  33. Dhakate, R.; Singh, V.; Hodlur, G. Impact assessment of chromite mining on groundwater through simulation modeling study in Sukinda chromite mining area, Orissa, India. J. Hazard. Mater. 2008, 160, 535–547. [Google Scholar] [CrossRef]
  34. Koeniger, P.; Margane, A.; Abi-Rizk, J.; Himmelsbach, T. Stable isotope-based mean catchment altitudes of springs in the Lebanon Mountains. Hydrol. Process. 2017, 31, 3708–3718. [Google Scholar] [CrossRef]
  35. Liu, Z.; Yuan, D.; Shen, Z. Effect of coal mine waters of variable pH on springwater quality: A case study. Environ. Geol. 1991, 17, 219–225. [Google Scholar] [CrossRef]
  36. Yeh, H.-F.; Lee, C.-H.; Hsu, K.-C. Oxygen and hydrogen isotopes for the characteristics of groundwater recharge: A case study from the Chih-Pen Creek basin, Taiwan. Environ. Earth Sci. 2010, 62, 393–402. [Google Scholar] [CrossRef]
  37. Dansgaard, W. Stable isotopes in precipitation. Tellus 1964, 16, 436–468. [Google Scholar] [CrossRef]
Figure 1. Study area location map.
Sustainability 15 11041 g001
Figure 2. Flowchart depicting the methodology.
Sustainability 15 11041 g002
Figure 3. WQI status map of study area for the pre- and post-monsoon seasons.
Sustainability 15 11041 g003
Figure 4. Spatial distribution of Collin’s ratio for the pre- and post-monsoon seasons.
Sustainability 15 11041 g004
Figure 5. Box plot showing variations in isotope ratios for different water samples.
Sustainability 15 11041 g005
Figure 6. Isotopic co-variation analysis of δ18O and δD for water sources in the study area.
Sustainability 15 11041 g006
Figure 7. Spatial distribution map of d-excess in the study area.
Sustainability 15 11041 g007
Figure 8. δ18O isotope and d-excess bivariate plots for dug well, tube well, river water, and mine water samples from the Mahan catchment.
Sustainability 15 11041 g008
Figure 9. Scatter plot of δ18O vs. TDS showing correlations for different water samples.
Sustainability 15 11041 g009
Table 1. Monthly rainfall, temperature, and relative humidity.
MonthsRainfall (mm)Average Temperature (°C)Relative Humidity
January23.3618.6051.77
February8.2220.3650.72
March7.4224.6833.52
April1.6029.1728.73
May2.0332.9223.78
June188.6931.5155.20
July455.5127.4273.48
August449.4827.2481.34
September208.7526.5571.94
October64.8424.8982.31
November13.2421.3665.04
December6.0118.7563.17
Table 2. Statistics for the physicochemical properties of the water samples and their impacts on health and taste.
S. No.ParametersDesirable LimitAssigned Weight (wi)Relative Weight (Wi)Impact
BISWHO
1.pH6.5–8.56.5–9.240.083Health/taste concern
2.EC1400200050.104Health concern
3.TDS50060050.104Health/taste concern
4.Ca2+7510030.0625Health concern
5.Mg2+305030.0625Health concern
6.Na+20020050.104Health/taste concern
7.K+10-20.0417Health concern
8.HCO320020010.0208Health concern
9.F1.21.550.104Health concern
10.Cl25025050.104Health/taste concern
11.NO3455050.104Health concern
12.SO42−40050050.104Health/taste concern
Note: All values in mg/L except pH and EC(µS/cm).
Table 3. Summary statistics for δD, δ18O, and d-excess values for the various water samples of the study area.
Dug WellTube WellRiver WaterMine Water
δ18O (‰)δD (‰)d-Excessδ18O (‰)δD (‰)d-Excess (‰)δ18O (‰)δD (‰)d-Excess (‰)δ18O (‰)δD (‰)d-Excess (‰)
Min.−6.73−49.34−7.36−6.97−51.79−2.32−4.98−47.15−19.20−5.87−47.13−13.93
Max.−2.38−32.277.74−5.90−43.897.080.06−10.21−1.11−1.21−23.605.73
Average−5.57−41.353.21−6.51−46.725.40−0.81−16.88−10.44−4.39−36.76−1.67
Disclaimer/Publisher’s Note: The statements, opinions and data contained in all publications are solely those of the individual author(s) and contributor(s) and not of MDPI and/or the editor(s). MDPI and/or the editor(s) disclaim responsibility for any injury to people or property resulting from any ideas, methods, instructions or products referred to in the content.

