Article

Hydrochemical and Isotopic Explanations of the Interaction between Surface Water and Groundwater in a Typical-Desertified Steppe of Northern China

1
Yinshanbeilu Grassland Eco-Hydrology National Field Observation and Research Station, China Institute of Water Resources and Hydropower Research, Beijing 100038, China
2
Collaborative Innovation Center for Grassland Ecological Security (Jointly Supported by the Ministry of Education of China and Inner Mongolia Autonomous Region), Hohhot 010021, China
3
Institute of Water Resources for Pastoral Area, China Institute of Water Resources and Hydropower Research, Hohhot 010020, China
*
Author to whom correspondence should be addressed.
Sustainability 2023, 15(14), 11034; https://doi.org/10.3390/su151411034
Submission received: 24 May 2023 / Revised: 9 July 2023 / Accepted: 11 July 2023 / Published: 14 July 2023

Abstract

:
The Tabu catchment, a typical-desertified steppe in China, was selected as the study area to qualitatively analyze the interaction between surface water (SW) and groundwater (GW), and an integration of hydrochemical analysis and isotopic techniques was applied. The results show that the ion contents in SW and GW increased from upstream to downstream, and the hydrochemical evolutions were both controlled by rock weathering and influenced by evaporation. The δD–δ18O lines of SW and GW were δD = 5.14δ18O − 24.68 and δD = 6.89δ18O − 5.81, respectively. Along the I–I′ profile, the contents of most indices, δD and δ18O in SW and GW both showed increasing tendencies. All of the similarities in the hydrochemical characteristics and isotopic techniques indicated that SW was recharged by GW. The δD–δ18O inconsistency in SW and GW samples from midstream and downstream areas indicated that SW did not recharge to GW in these areas and was consumed by evaporation or replenished the moisture in the vadose zones. The runoff decreased, which was mainly caused by excessive exploitation of GW and a decline in the GW level. This study deepens the understanding of the hydrological cycle and provides guidance for the optimal combined utilization of SW and GW.

1. Introduction

Surface water (SW) and groundwater (GW) are important water resources, and interactions between them frequently occur in nature [1]. Research on the interaction between SW and GW is an important and challenging topic in the hydrological field [2] and is of great significance for a better understanding of the hydrological cycle, of the scientific management of water resources, and of the protection of ecological systems. For example, the double counting of integrated water resources can be avoided, and the quantity of water resources can be accurately obtained, both of which are beneficial for water utilization and management [3]. The interchange of SW and GW allows for the exchange of major ions and contaminants [1,4], which can influence water quality.
Domestic and foreign scholars have performed many studies in this field. Thomas [5] discussed the interaction between SW and GW in different landscape types. Tang [6] has pointed out that the study of the transformation between SW and GW in the arid area of China was very beneficial for the optimum dispatching of water resources. Some scholars [7,8] have noted that the relationship between SW and GW was influenced by geological and hydrogeological conditions. Gu et al. [9] have demonstrated frequent interaction between GW and SW in the Liujiang basin, and the interaction was influenced by human activities. Ochoa et al. [10] analyzed the spatial–temporal dynamics of water balance and GW–SW interactions in the upper creek basin of Del Azul based on a coupled hydrological–hydrogeological model. Shu et al. [11] analyzed the spatial–temporal variations in SW and GW and quantified the flow exchanges between them in the Xinbian catchment based on an integrated method. Loh et al. [12] demonstrated the application of hydrochemical data and stable water isotopes of δ18O and δD in the evaluation of the relationship between SW in Lake Bosumtwi and the underlying GW system. Compared with the results obtained from a temperature tracer and analytical method, Qiao et al. [13] confirmed that the numerical simulation method is a better choice for studying the interaction between lake water and GW in semiarid areas with detailed data. Wang et al. [14] used hydrochemistry, radioactive isotopes (14C), and stable isotopes (13C, 18O, and 15N) to indicate that the Yiluo River and shallow groundwater had frequent interactions.
Steppes account for 40% of the total land area in China and are widely distributed in northern China, playing important roles in preventing desertification and sustaining ecosystem health. The climatic conditions in typical-desertified steppes are unfavorable, and water resources are rare. Surface runoff varies seasonally, and socioeconomic development is highly dependent on groundwater resources. The ecosystem is fragile and profoundly influenced by SW and GW. Contaminant movement is highly associated with the complex relationships between SW and GW. Tian et al. [15] have pointed out that recognizing the relationship between GW and rivers in semiarid steppes is of great significance for the ecological recovery of the riparian zone. Fang et al. [16] found that the degraded area of grasslands in Inner Mongolia has reached 70% of the total grassland area since the 1960s. Due to the influence of climate change and human activities, factors such as rainfall change [17] and the excessive exploitation of water resources [18] have incurred great changes in the hydrological processes of the inland rivers of the steppes. Given this background, there is an urgent need to understand the interactions between SW and GW in the steppes. Although many studies have been performed in many areas, such as the EI Pescado Creek watershed [8], Maowusu Lake basin [13], Ciliwung River streams [19], Tarim River basin [20], and Yangtze River basin [21], few studies of SW–GW interactions have been conducted with regard to arid and semi-arid steppe regions.
The Tabu River catchment, which is in a typical-desertified steppe of northern China, is an ecological functional zone and plays important roles in the implementation of national strategies in China. Few studies have been performed in the Tabu River catchment, and the studies were mainly focused on SW [18,22] and ecology [23]. Insufficient attention has been given to water resources in the catchment. In recent years, rivers and lakes have dried up, the GW level has declined, and the problems of grassland desertification and soil salinization have become serious. Water resources are the key to solving these problems. Thus, the Tabu River catchment was selected as the study area to research the interaction between SW and GW, and it is expected to provide a better understanding of the hydrological cycle mechanism and scientific support for regional water resource management and protection. The specific objectives are (1) to analyze the characteristics of hydrochemical indices and stable isotopes of SW and GW; (2) to reveal hydrochemical evolutionary mechanisms of SW and GW from the temporal perspective; and (3) to further assess the interaction between SW and GW based on the spatial characteristics of hydrochemical indices and δD–δ18O compositions along the flow path.

2. Materials and Methods
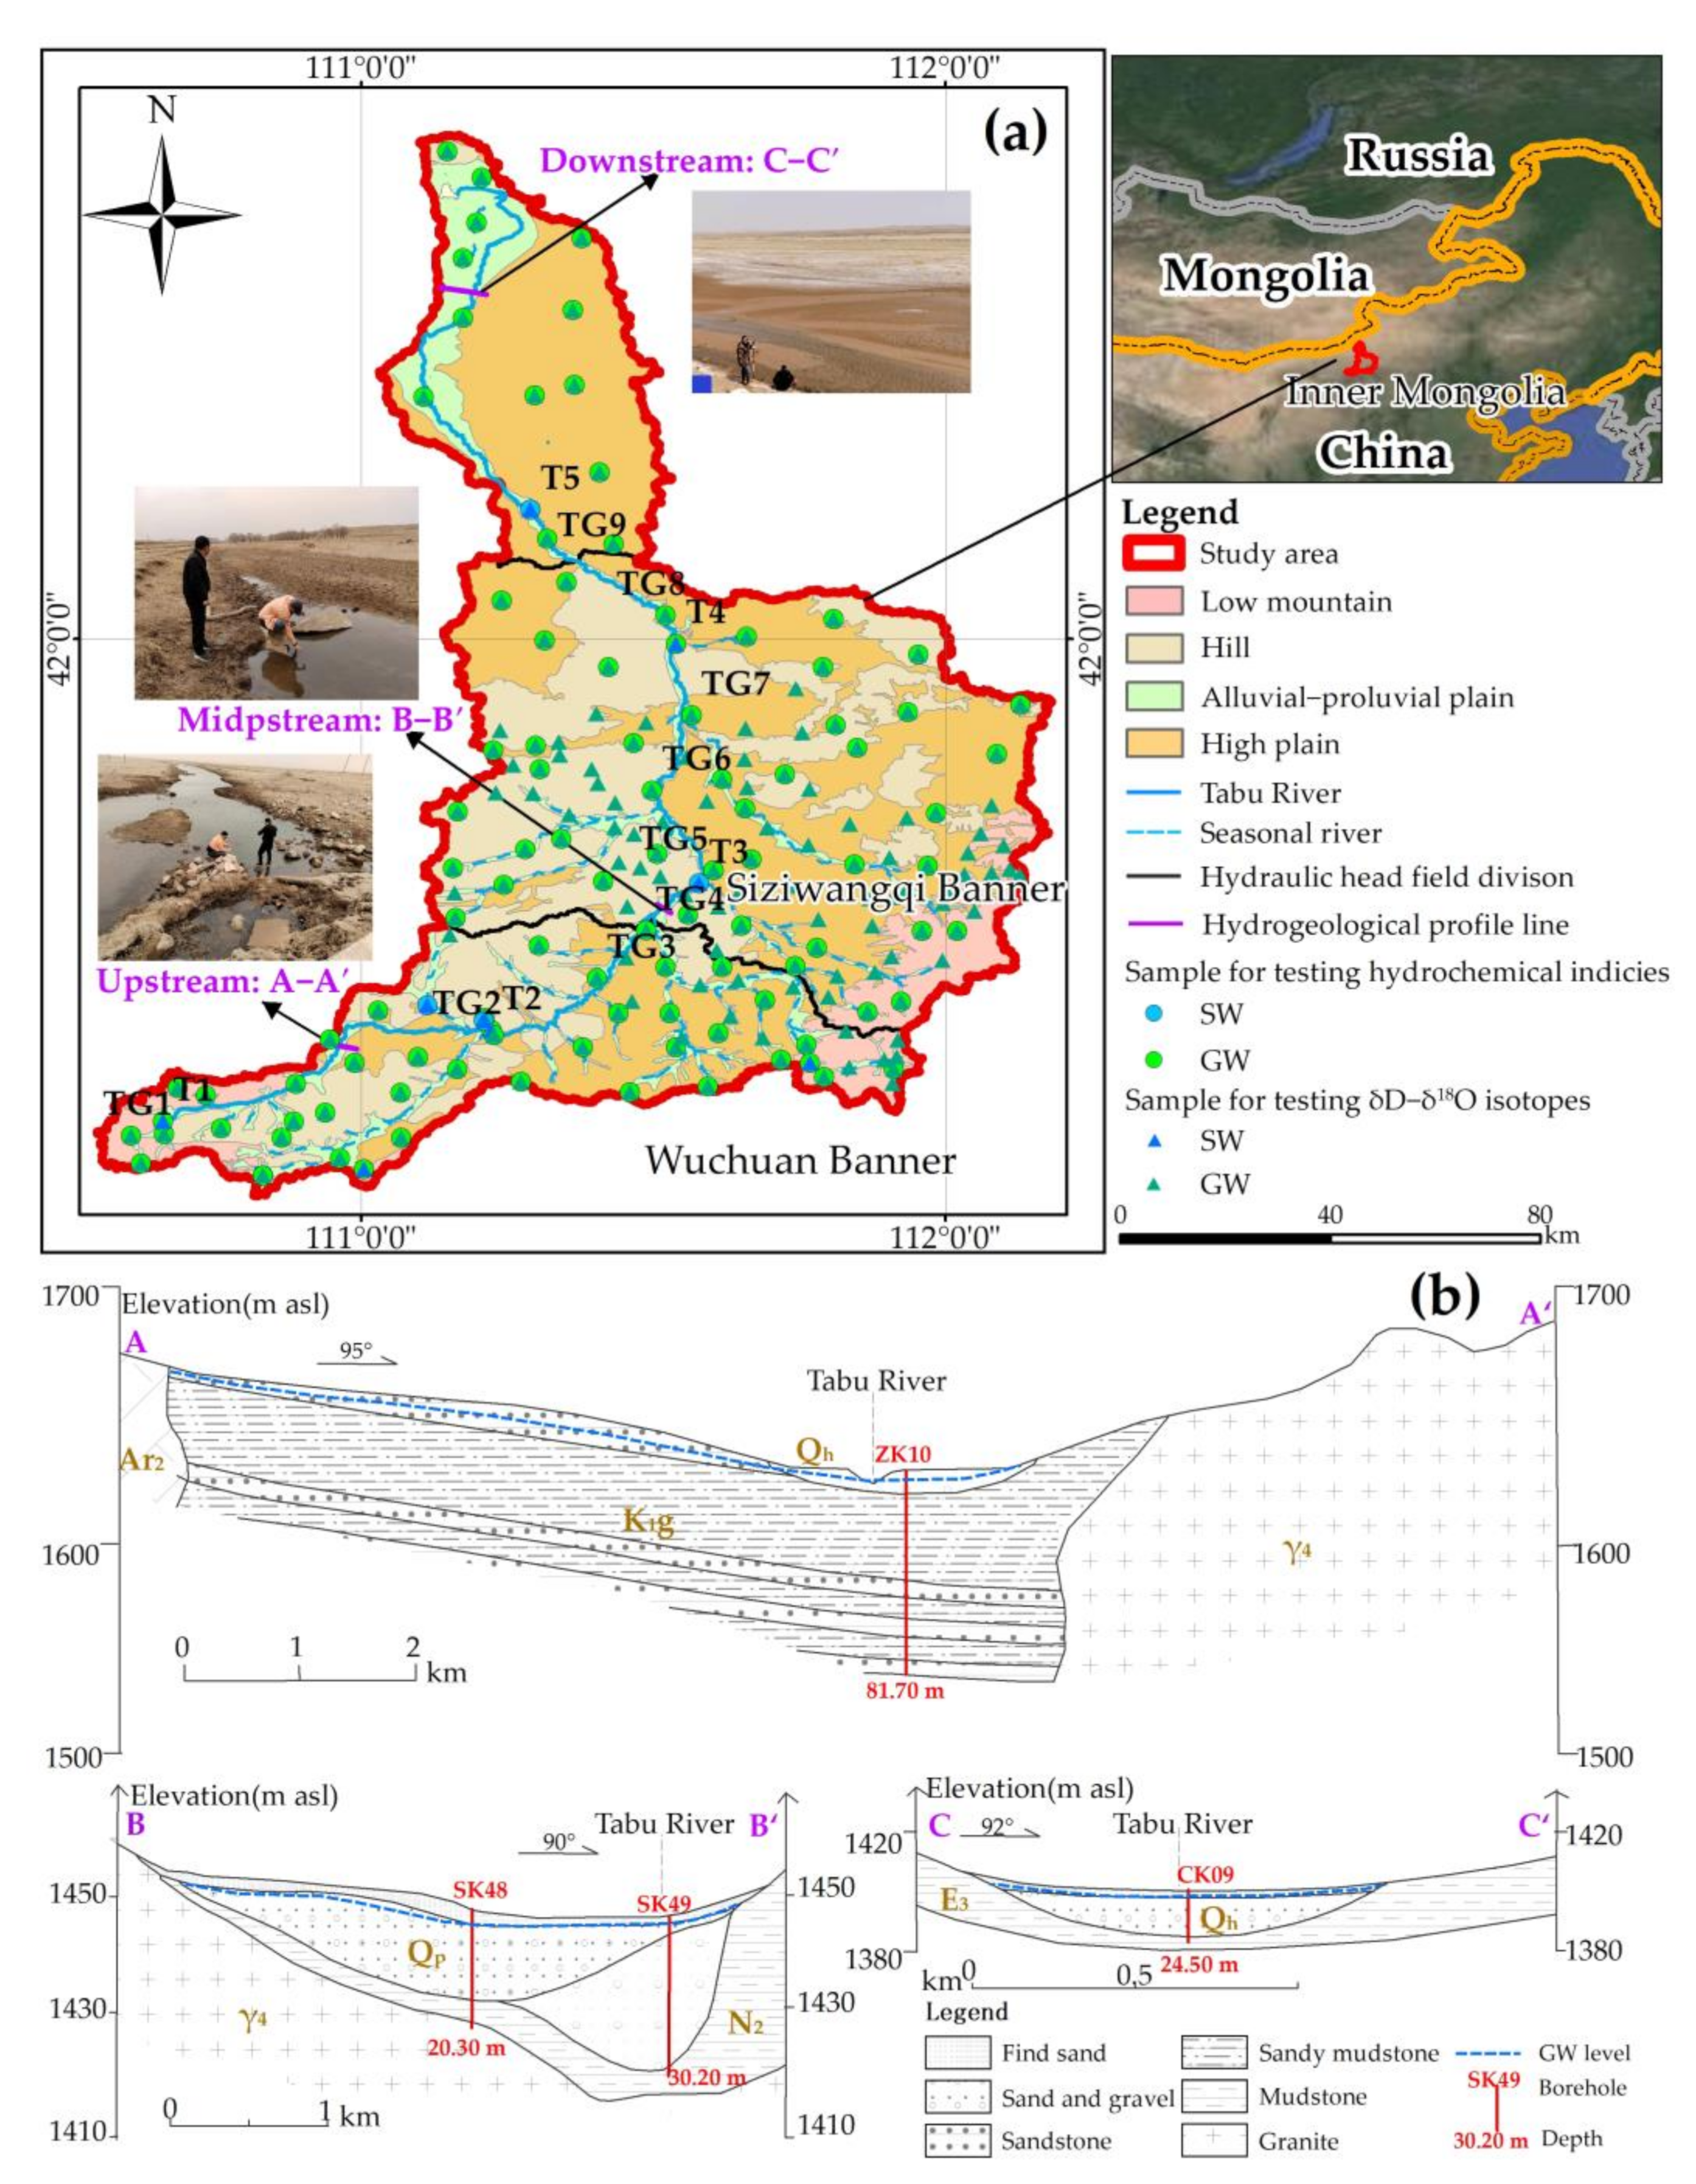
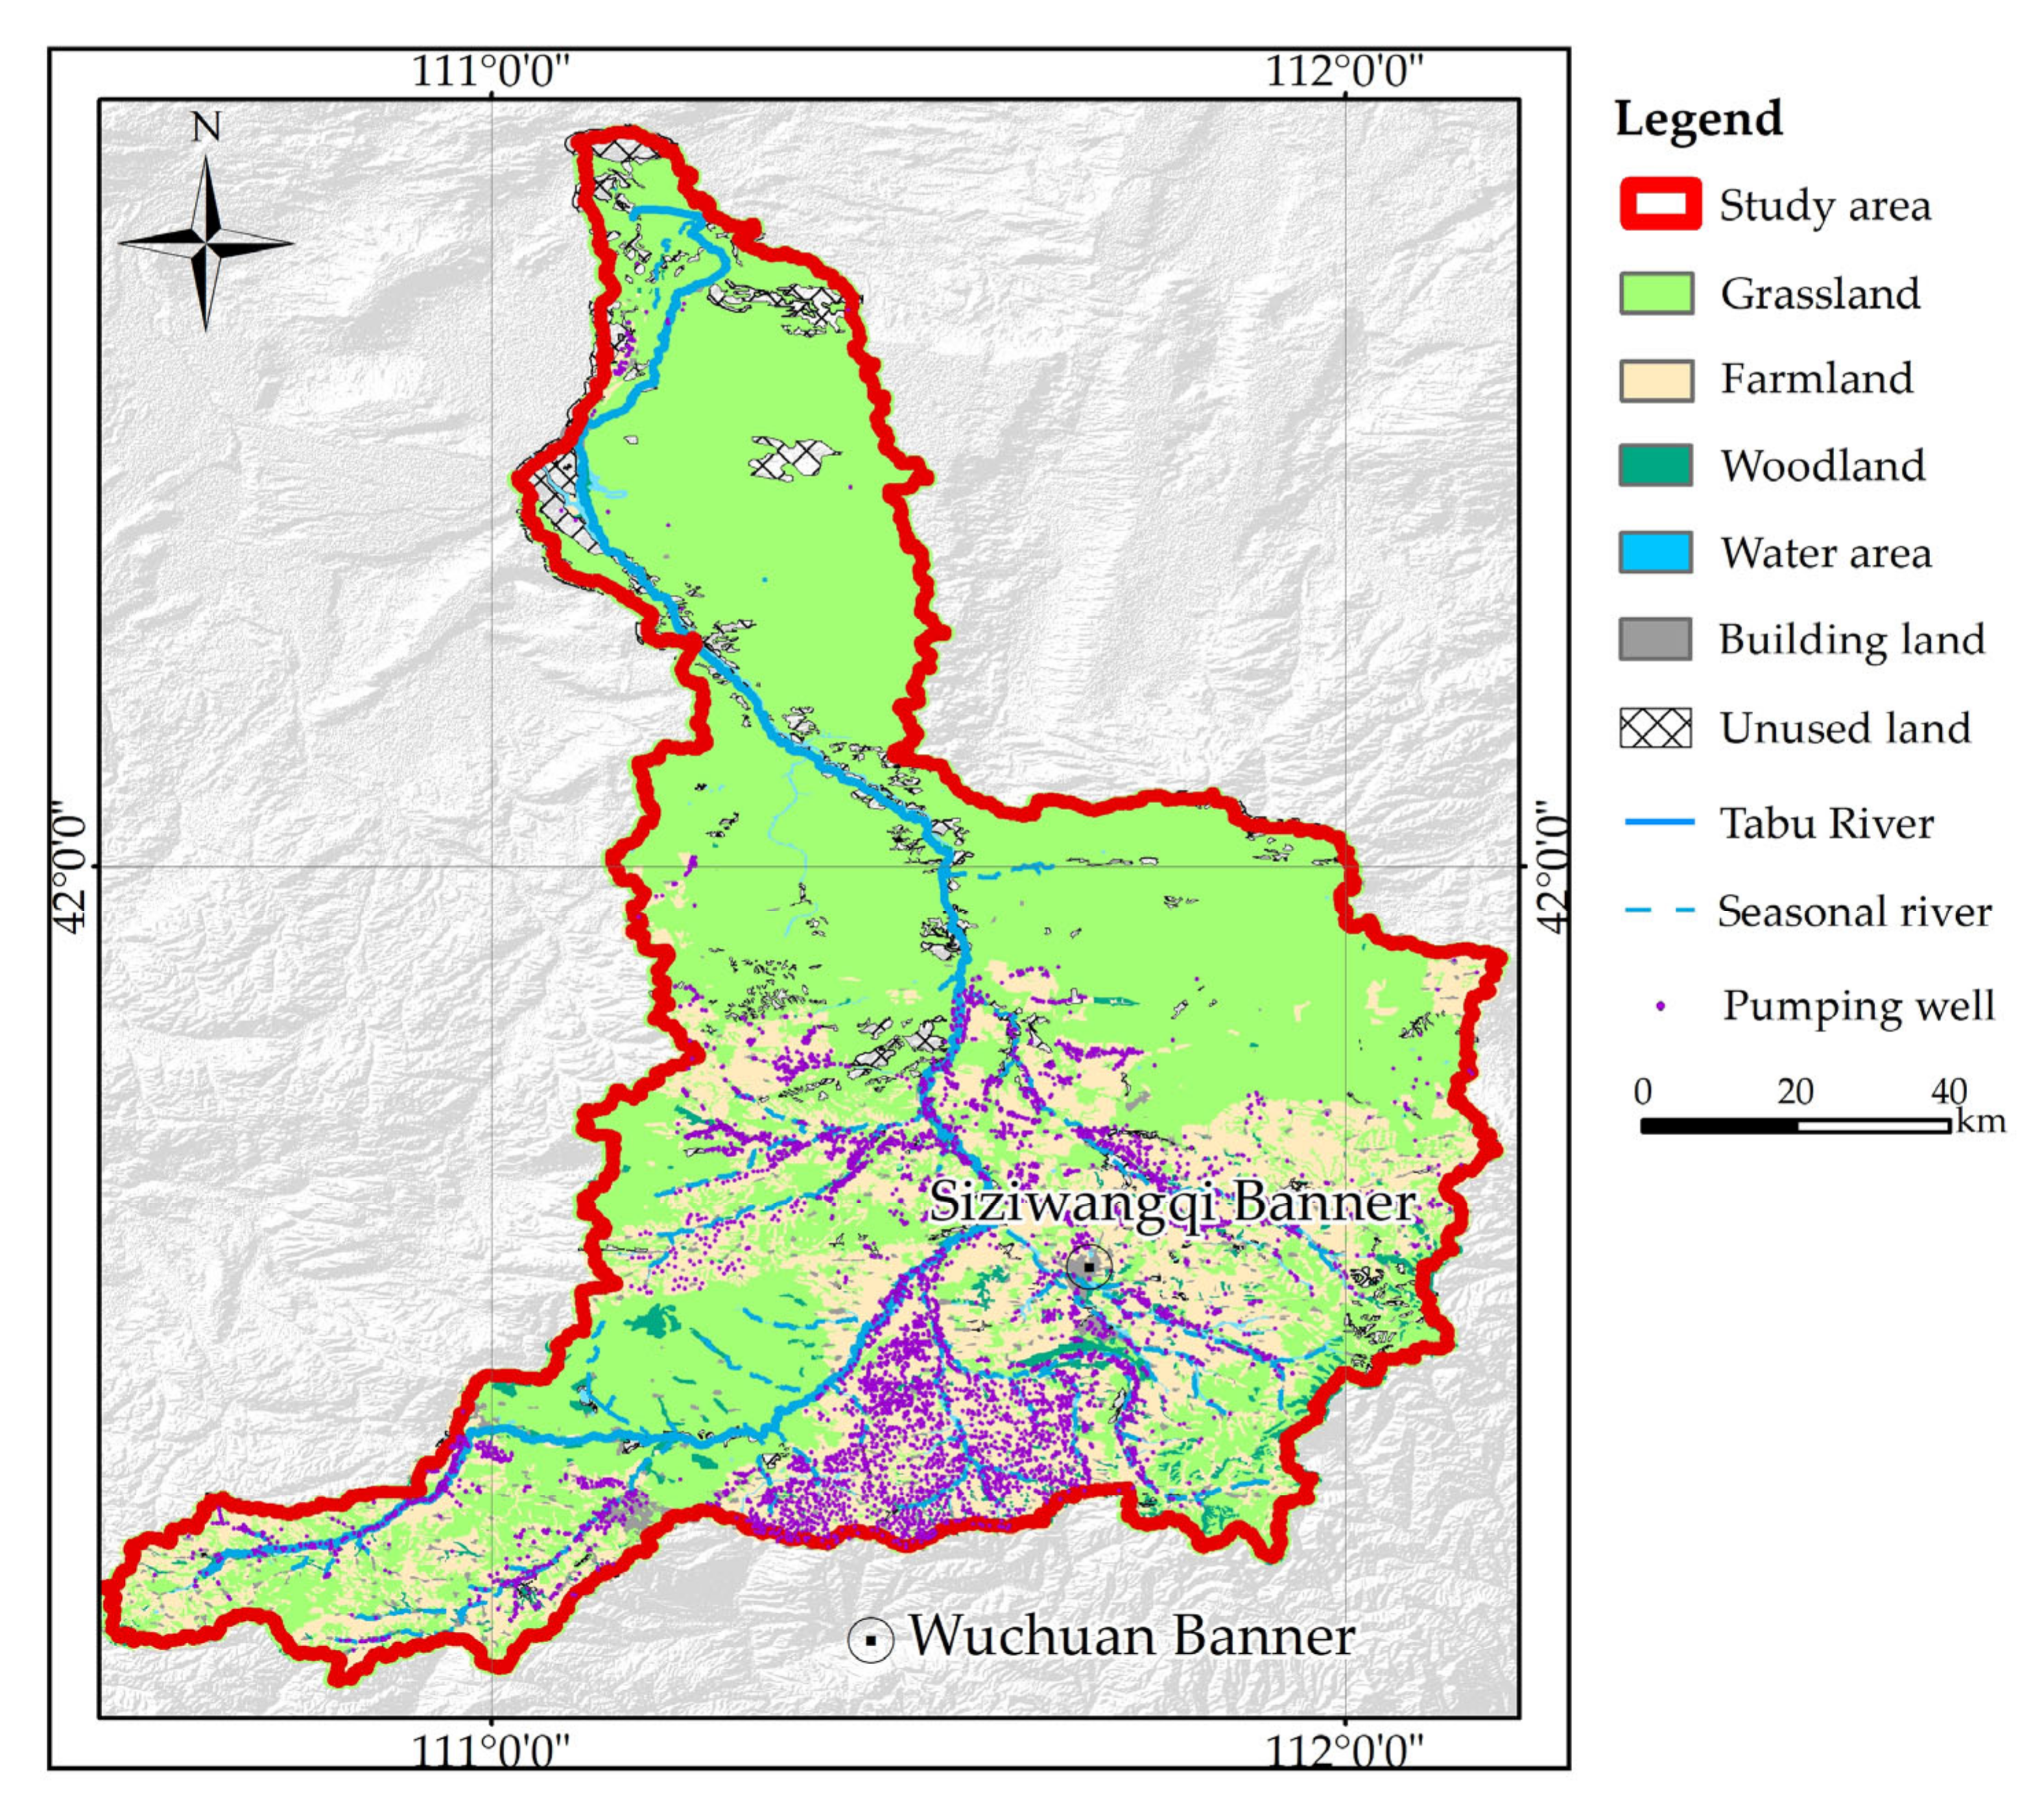
2.1. Study Area

The Tabu River catchment (110°33′–112°210′ E, 41°2′–42°51′ N), which covers an area of 10,219 km2, is in Inner Mongolia, China (Figure 1a). The study area has a mid-temperate arid and semi-arid continental monsoon climate, and the annual average temperature is below 5 °C. The annual average precipitation is 311.2 mm, approximately 80% of which occurs from July to September, whereas the annual average evaporation reaches 1365.2 mm. The Tabu River is one of four inland rivers in Inner Mongolia. Over the past two decades, the gap between water demand and water supply has widened over time with socioeconomic development. The GW level decreased, the runoff from the Tabu River has significantly decreased, and water limitations have seriously affected ecological health and regional development.
The landform is mainly characterized by hills, mountains, high plains and alluvial–proluvial plains from south to north. The terrain becomes low and gentle from south and north, and the lithologic particles gradually change from coarse to fine. The Tabu River flows from south and north along the terrain and discharges into the terminal Huhonor Lake. The study area has a groundwater system with a complete process of recharge, runoff, and discharge. Aquifers are divided into three types: porous aquifers related to regolith systems, fissured aquifers in bedrock, and clastic rock pore-fissure aquifers [22,24]. Based on previous hydrogeological surveys (Figure 1b), the Quaternary loose porous aquifers are widely distributed in the alluvial–proluvial plains and are mainly composed of sandy gravels, pebbles and sands. The Paleogene and Cretaceous clastic rock pore-fissure aquifers are mainly distributed in the high plains and exposed to the surface, which has led to severe weathering and the development of pores and fissures. The Cretaceous clastic rock pore-fissure aquifers accept recharge from rainfall and have a hydraulic connection with the Quaternary loose porous aquifer. Fissured aquifers with joints and fissures provide storage space for bedrock fissure water, and they receive rainfall recharge. Based on the runoff data of the Xichanghan hydrometric stations, the Tabu River runoff has decreased significantly since 2005, and the river often dries up the middle and lower reaches [18]. GW generally flows from south to north. Based on the geomorphology, terrain and division of the subwatershed, the study area is divided into three parts: upstream, midstream and downstream (Figure 1a).

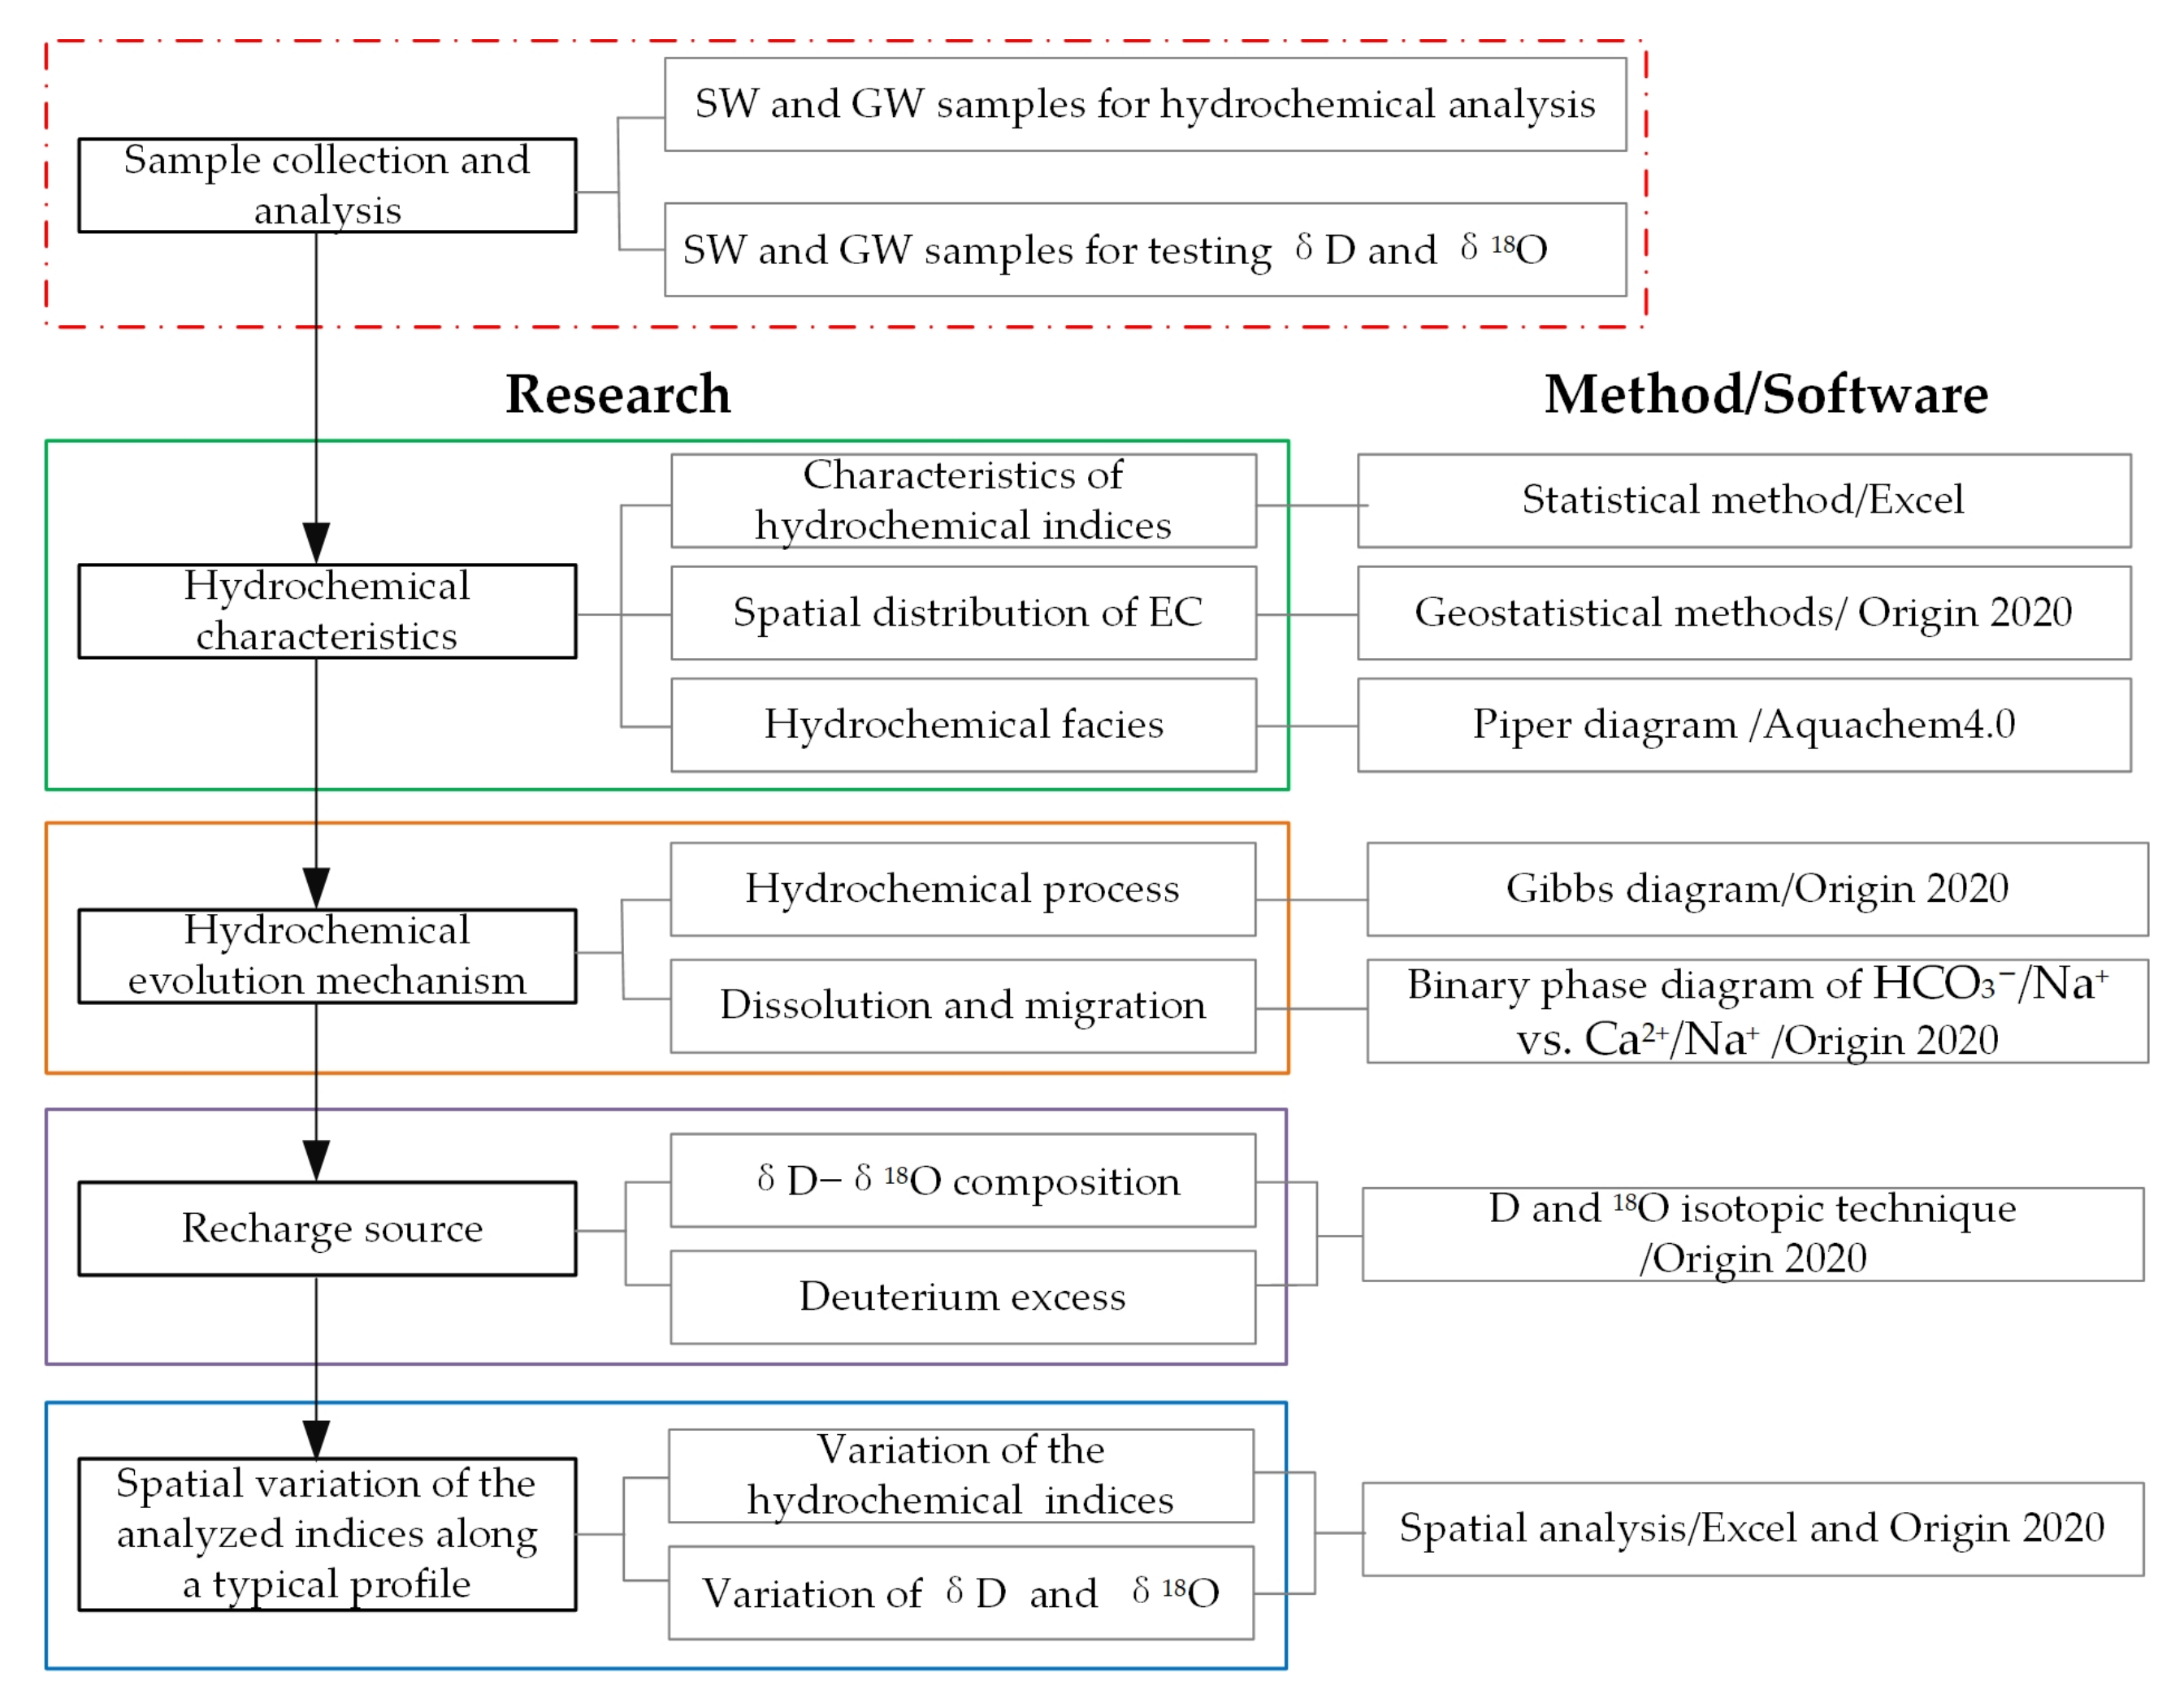
2.2. Methods and Data Preparation

2.2.1. Methods

The methods for researching the SW–GW relationship include the field method, water balance method, numerical simulation, and isotopic techniques. Field methods are time consuming and have large errors [5]. When using the water balance method, the identification and quantification of the recharging and discharging sources are complicated, and the accuracy of the results needs to be further verified [25,26]. Numerical simulation is visualizable, and its results are intuitive [10], but requires detailed basic data, and the accuracy is influenced by the parameters; thus, numerical simulation is appropriate only for areas with detailed and basic data covering long time series [27]. Isotopic techniques are simple and effective and have been widely used in studies of the interactions between SW and GW because of their special fingerprint effect [28]. The natural chemical compositions of water record the formation processes and migration paths of water bodies to some extent [9,29], and stable water isotopes (δD and δ18O) are ideal natural tracers for understanding the hydrological cycle and water modification processes [30,31,32]. The combination of hydrochemical analysis and isotopic techniques can effectively reduce the uncertainty inherent in the use of a single method, allowing the relationship between SW and GW to be more comprehensively studied [1,33].
Comparing the merits and demerits of each method and considering the basic data of the study area, hydrochemical analysis and isotopic techniques were combined to research the interaction between SW and GW. According to the concentrations of hydrochemical indices and hydrochemical facies of SW and GW, whether there was a close connection between SW and GW was preliminarily estimated. Then, the common features of SW and GW during the hydrochemical evolution process were revealed via Gibbs diagrams and a dissolution mechanism diagram. By using isotopic techniques, the recharge sources of SW and GW were identified. The interaction of SW and GW was further studied by analyzing the characteristics of hydrochemical indices and isotopic compositions along a typical profile. The methodology flowchart (Figure 2) is shown below.

2.2.2. Data Preparation

The GW level and depth data were measured with a hydrological gauge (XTR-288) in May and July 2022. One hundred and seven water samples were simultaneously collected to test the hydrochemical indices, including eight SW samples and ninety-nine GW samples. One hundred eighty samples for testing δD and δ18O were collected, including eight SW samples and one hundred seventy-two GW samples.
The electrical conductivities (ECs) of all samples were tested on site by using a YSI Pro Plus Instrument. Before sampling, the sample bottles were rinsed three times, and the wells for collecting GW samples were pumped for thirty minutes to obtain fresh GW. All GW samples were collected from the shallow aquifer. SW samples were collected from the Tabu River and the small ponds in the river channel. Samples were collected according to Environmental Quality Standards for Surface Water (GB3838-2002) [34] and Standard for Groundwater Quality (GB/T 14848-2017) [35]. Water samples were sealed and stored in 5 L PVC bottles and kept at 4 °C after collection. Based on the study objectives, the main hydrochemical indices (pH, K+, Na+, Ca2+, Mg2+, HCO3, Cl, SO42−, NO3, total hardness, total dissolved solid and F) of SW and GW were analyzed by the Inner Mongolia Mineral Resources Experimental Research Institute. pH was analyzed by an ion meter (PXJ-1B, Jiangsu Electric Analysis Instrument Factory, Jiangyan, China). The concentrations of cations (Mg2+, Ca2+, Na+ and K+) were analyzed by a PerkinElmer Optima 8300 with a detection accuracy of 0.001 mg/L. The concentrations of anions (SO42−, Cl, F and NO3) were measured by ion chromatography (IC850). The concentrations of HCO3 and total hardness (TH) were analyzed by the titration method. The total dissolved solids (TDS) were determined by the weighing method (Electronica scales JA31001). The accuracy of the testing results was checked using an ionic error equilibrium, and the relative error was controlled below 3%, which meant that the analytical results were reliable [36]. According to the standards [34,35], the units of hydrochemical indices, except pH and EC, are in mg/L. When using the Piper diagram, the mass unit (mg/L) must be changed into the mole fraction. The mole fraction is the ratio of the amount of substance in a solution to the sum of the amounts of substance in each component [36], and the equation is listed below. The mole fraction can reflect the relative amount of a substance in a solution and is the basis of the classification of hydrochemical facies.
C i = ρ i / M r i i = 1 n ρ i / M r i × 100 %
where Ci is the mole fraction of the i ion, %; ρi is the mass concentration, mg/L; and Mri is the relative molecular mass, 1.
The samples for testing δD and δ18O were collected and sealed in 10 mL EP plastic tubes after filtering with 0.45 μm membranes and then stored at a low temperature. All isotope samples were analyzed by LICA United Technology Limited. The δD–δ18O isotope was tested by a liquid water isotope analyzer (912-0050, Los Gatos Research, Inc., San Jose, CA, USA). The results are expressed in values per mil (‰) relative to Vienna Standard Mean Ocean Water (V-SMOW) using the δ notation [37], which is defined as:
δ = R s a m p l e R r e f e r e n c e R r e f e r e n c e × 1000
where R is the isotope ratio, such as D/1H and 18O/16O, and the H and O isotopes take V-SMOW as the reference standard.

3. Results

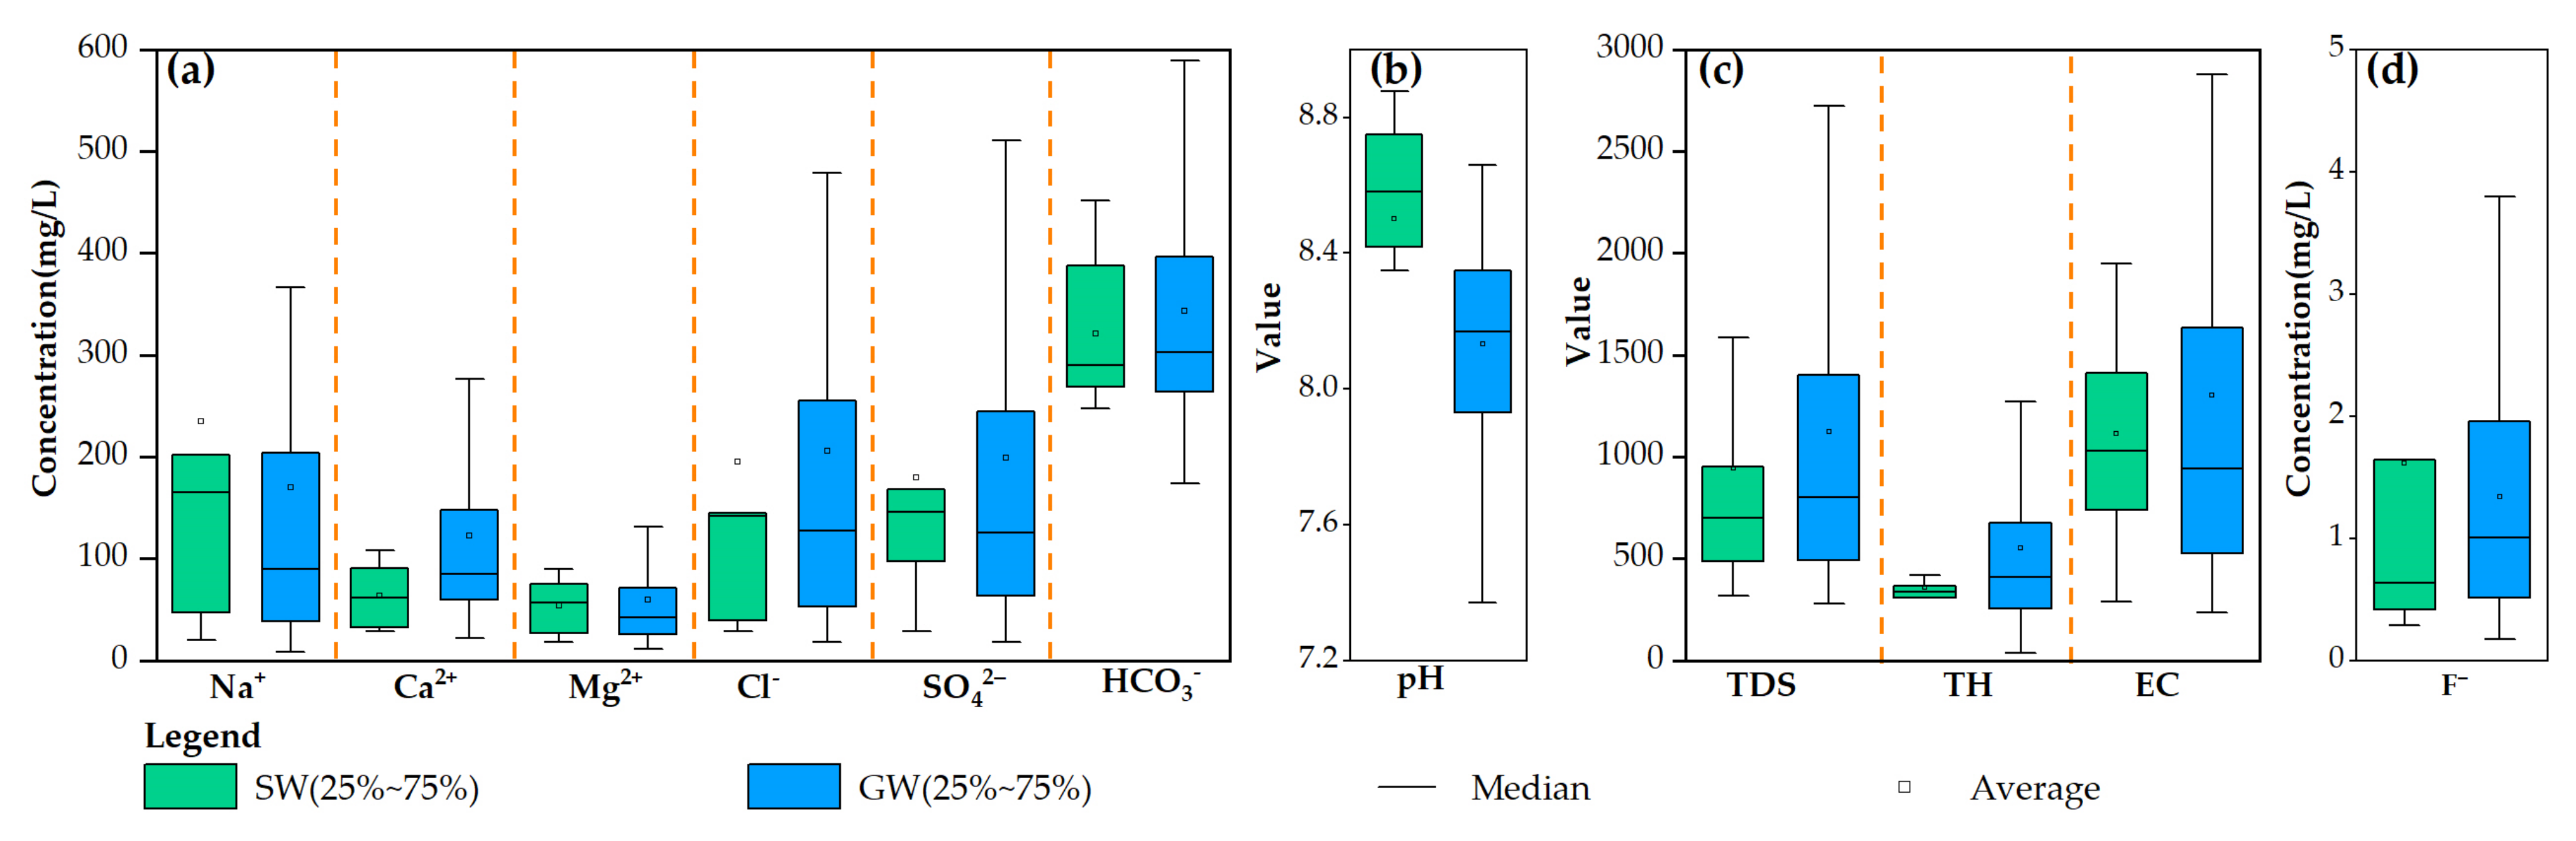
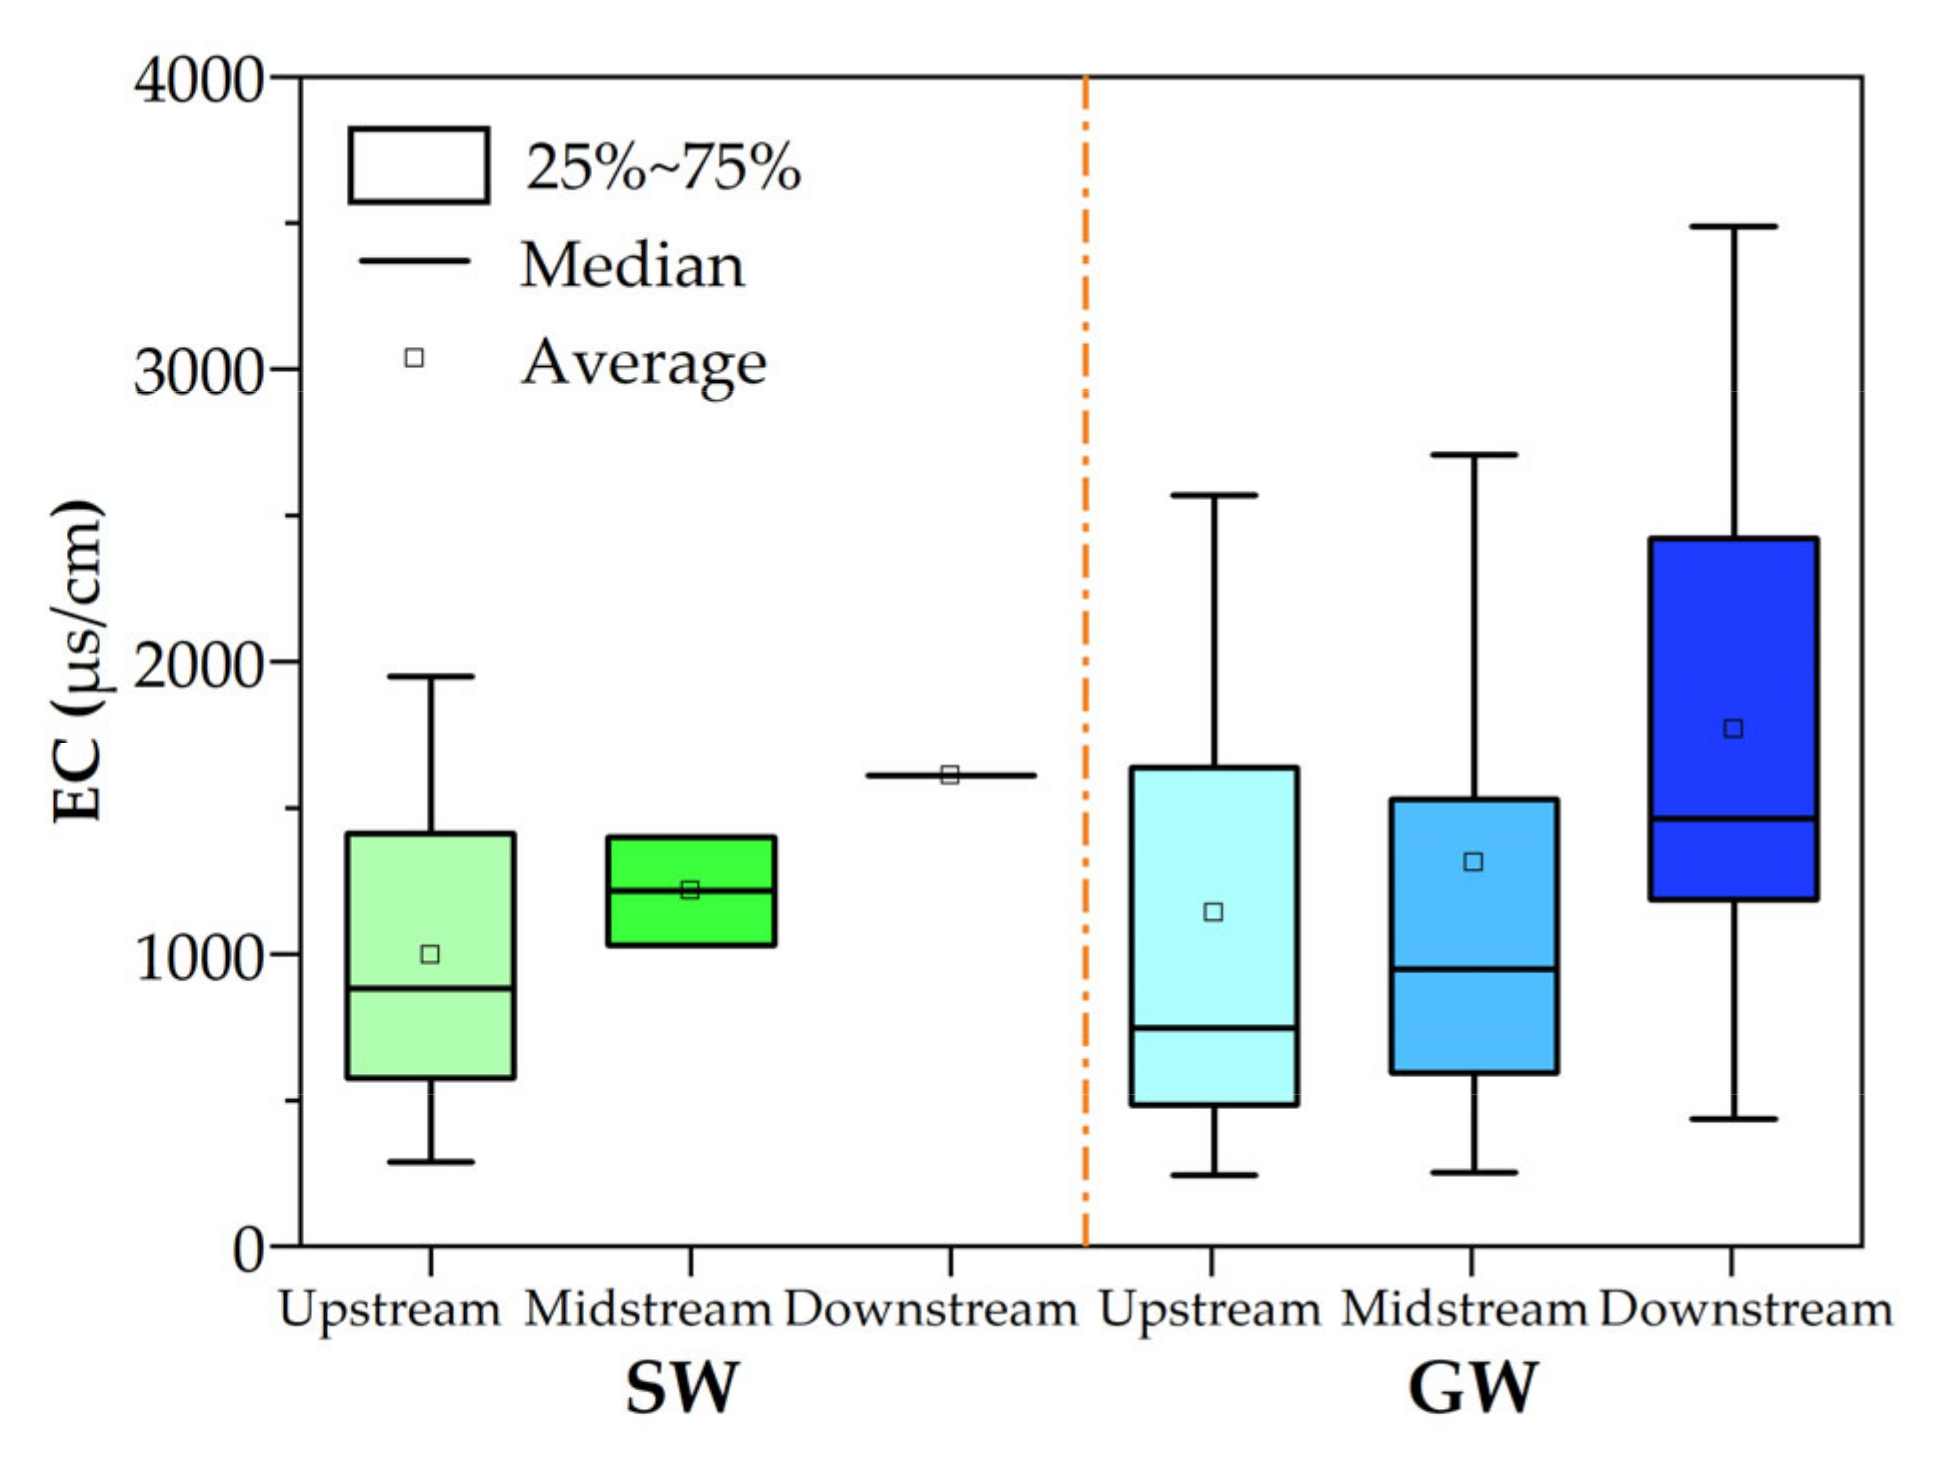
3.1. Hydrochemical Characteristics

The concentrations variations in the hydrochemical indices are presented in Figure 3. SW in the study area was weakly alkaline with low salinity overall, and the pH values ranged from 7.38 to 8.50 with an average value of 7.82 (Figure 3b). The TDS in SW ranged from 318.11 to 2455.41 mg/L, with an average of 944.52 mg/L. GW was weakly alkaline and the pH varied between 7.37 and 8.66, with an average of 8.17. The TDS in GW ranged from 277.95 to 5398.52 mg/L, with an average of 1119.63 mg/L. As shown in Figure 3c, the high TDS in GW reflects the intensive reaction of rock–weathering and the long residence time. The TDS values of GW in most areas were below 1000 mg/L, indicating that the water was suitable for drinking. The relative abundance of anions in SW and GW was in the order of HCO3 > Cl > SO42−, whereas the cationic abundance followed the order Na+ > Ca2+ > Mg2+ > K+, which indicates that there was a similarity in the hydrochemical compositions of SW and GW. Among the two water bodies, the ranges of variation in the hydrochemical indices of GW were greater than those of SW, and the average EC, TDS and TH of GW were greater than those of SW. This is because the flow conditions of GW were complex, the water–rock interaction was intensive, and soluble salts were dissolved along the flow path. The pH and HCO3 of GW were lower than those of SW, indicating that the acid–base environment of GW was influenced by cation exchange and, to some extent, by the conversion of HCO3 into CO2 during the flow process.
As shown in Figure 4, the anions in SW were mainly distributed closer to the HCO3 and Cl side, the cations were distributed in a dispersed pattern, and the contents of Ca2+ and Mg2+ decreased and the contents of Na+ + K+ increased from upstream to downstream. While the anions of GW were mainly distributed closer to the HCO3 and Cl side, the cations were mainly distributed closer to the Ca2+ and Na+ + K+ side, and the contents of Na+ + K+ increased from upstream to downstream (Figure 4b). The complex hydrogeological environment led to the differences in the hydrochemical facies between SW and GW, but the spatial changes in the main ions of SW and GW were similar overall, and the same hydrochemical characteristics of SW and GW in the same zones indicated the close connection between SW and GW [9]. Samples T2 and TG2 are used as examples to discuss the connection between SW and GW. SW sample T2 was geographically close to GW sample TG2. The high F concentration was mainly due to the original geological conditions [38]. The F concentration of sample TG2 reached 1.55 mg/L and that of sample T2 was 1.64 mg/L, while the F concentrations of the two samples were higher than those of the other samples. Along the flow path from T1 to T2, the hydrochemical facies of SW changed from HCO3·SO4–Ca to HCO3·Cl–Na·Mg·Ca, while the hydrochemical facies of GW changed from HCO3–Ca to Cl·HCO3–Ca·Mg, indicating that the contents of Cl and Mg2+ increased and the contents of HCO3 and Ca2+ decreased in both SW and GW. All the similarities support the close connection between SW and GW. The coarse alluvial sediments provide a good channel for the transformation of SW and GW.
The spatial distribution of EC in a water body can be used to infer the length of the runoff path and the remaining time [20]. The EC values of SW ranged from 289.5 to 1949 μs/cm, with an average of 1114.94 μs/cm, and those of GW ranged from 238 to 5973 μs/cm, with an average of 1295.30 μs/cm. SW runoff was mainly controlled by the terrain, while the GW flow was influenced by the hydraulic gradient. GW was characterized by a long residence time, and water–rock interactions occurred during the flow process. The EC values of GW were higher than those of SW, indicating that GW did not receive recharge from SW or received only small amounts of recharge from SW. Considering the spatial perspective, the ECs of SW and GW both increased from upstream to downstream (Figure 5), and the spatial changes in EC in the two water bodies were consistent.

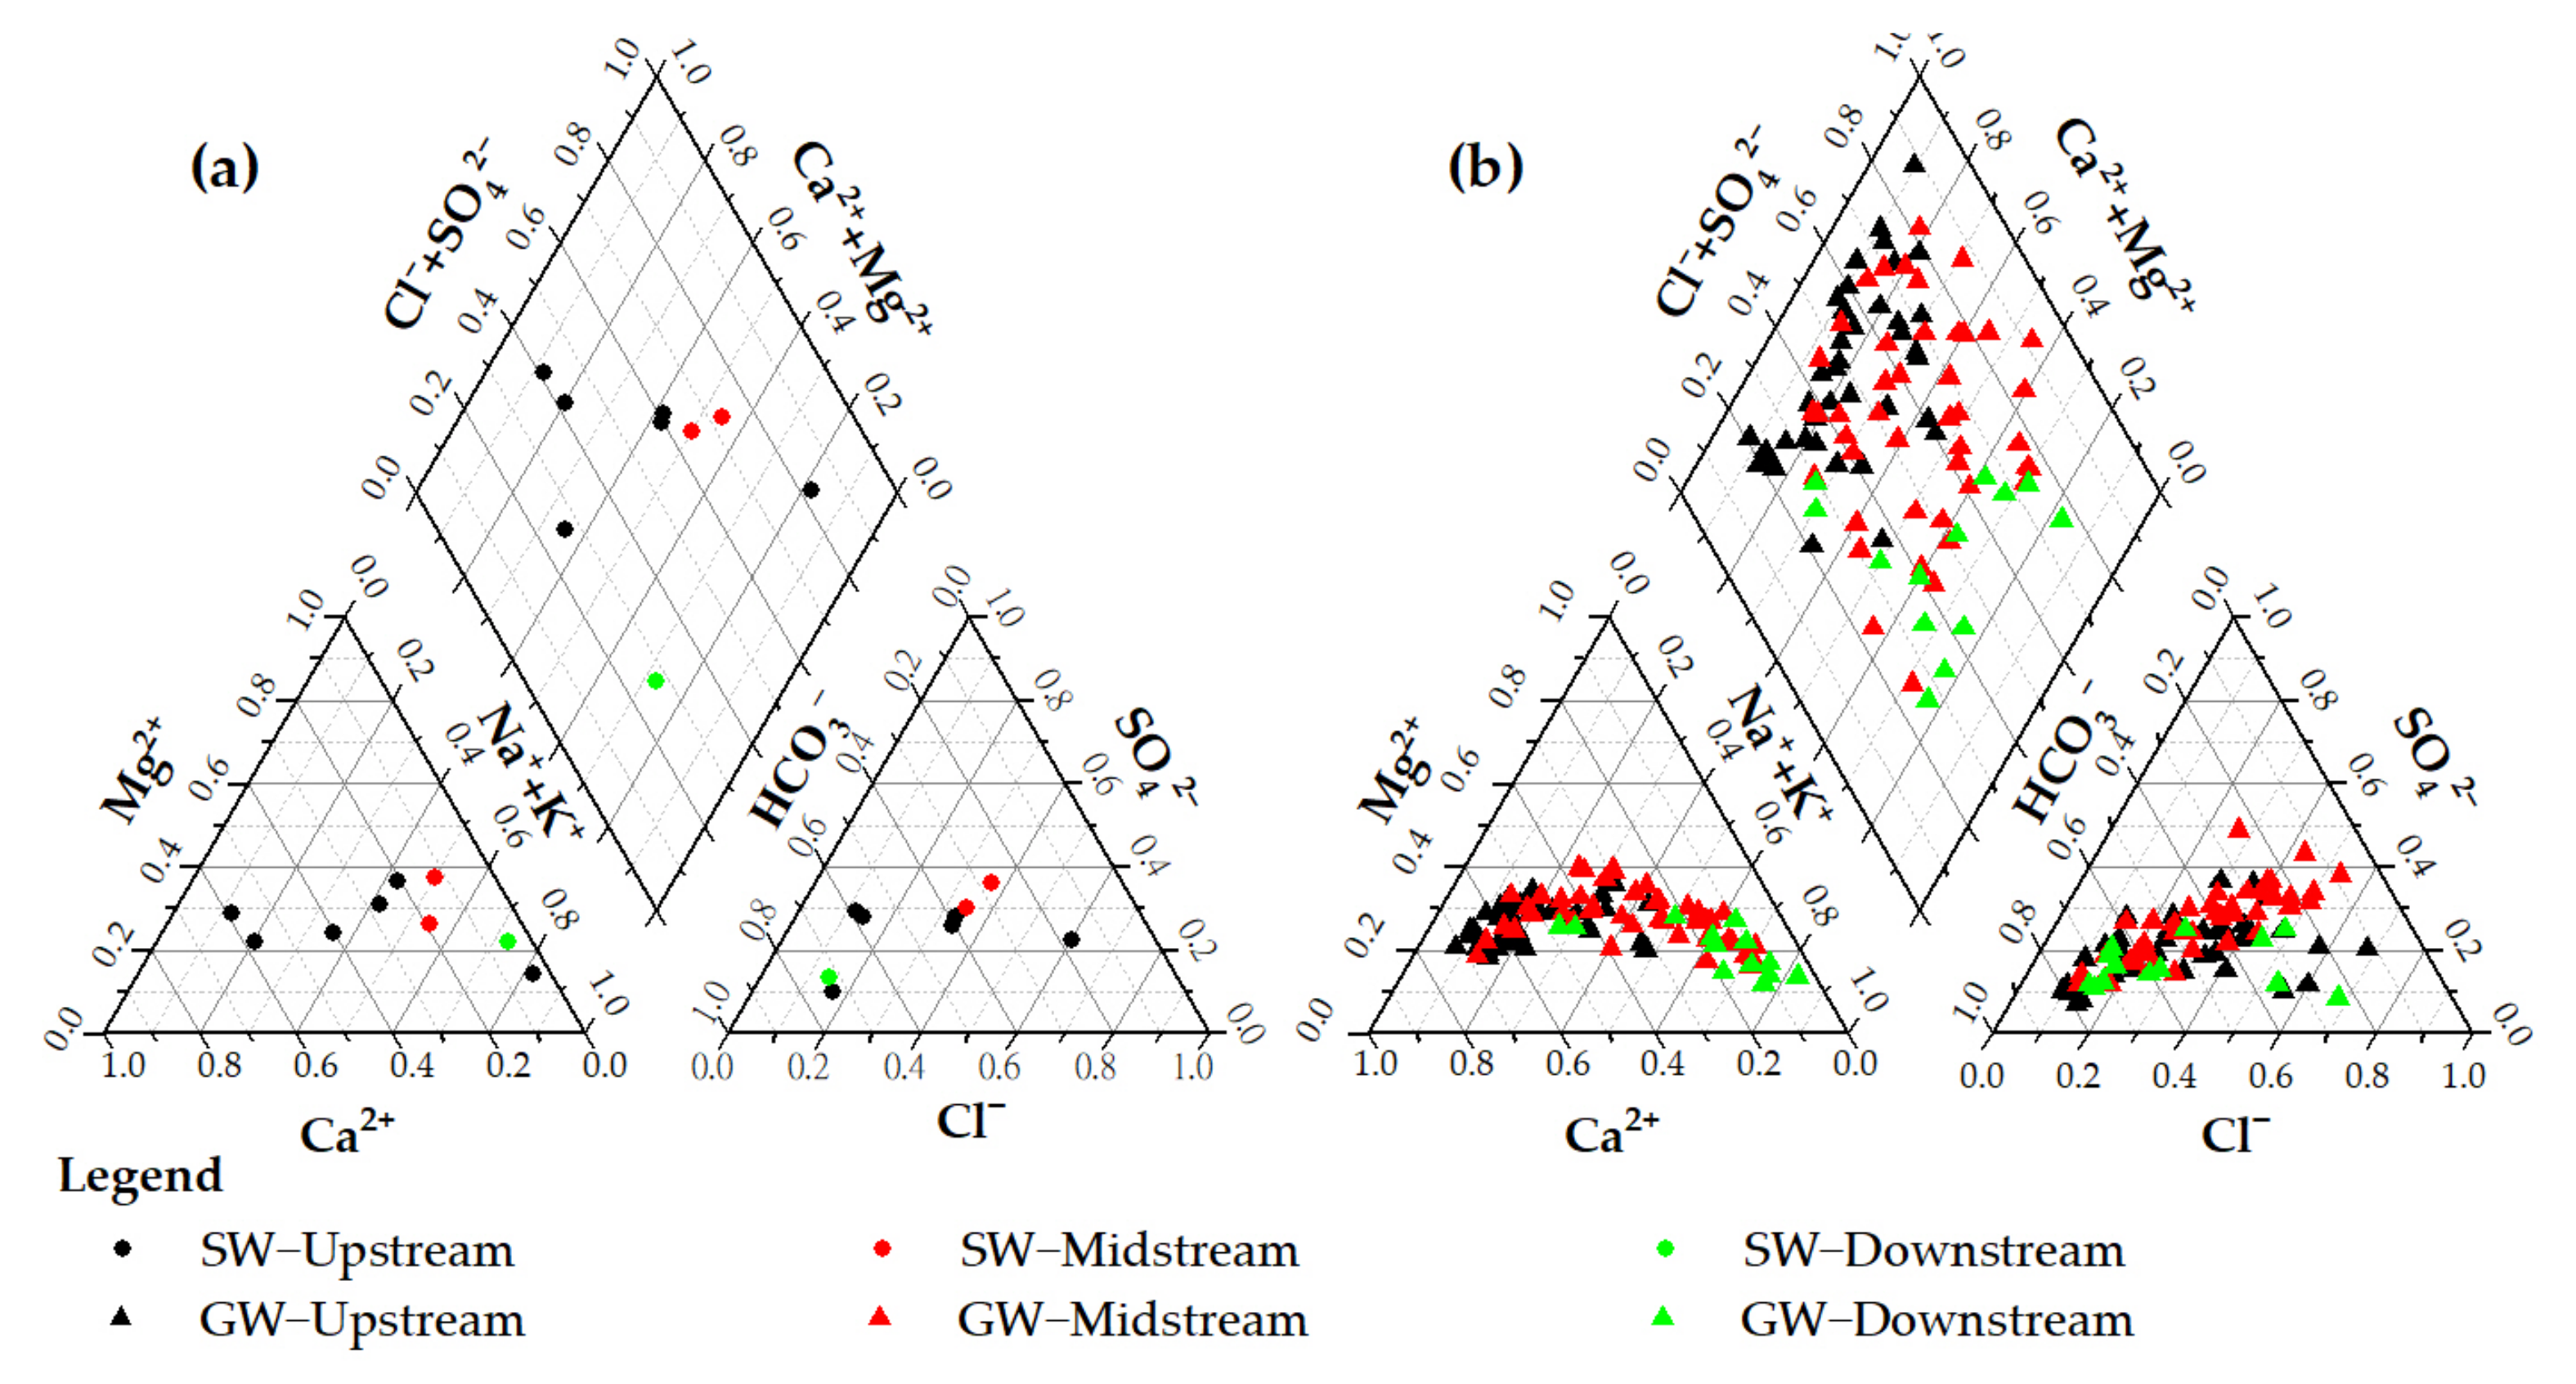
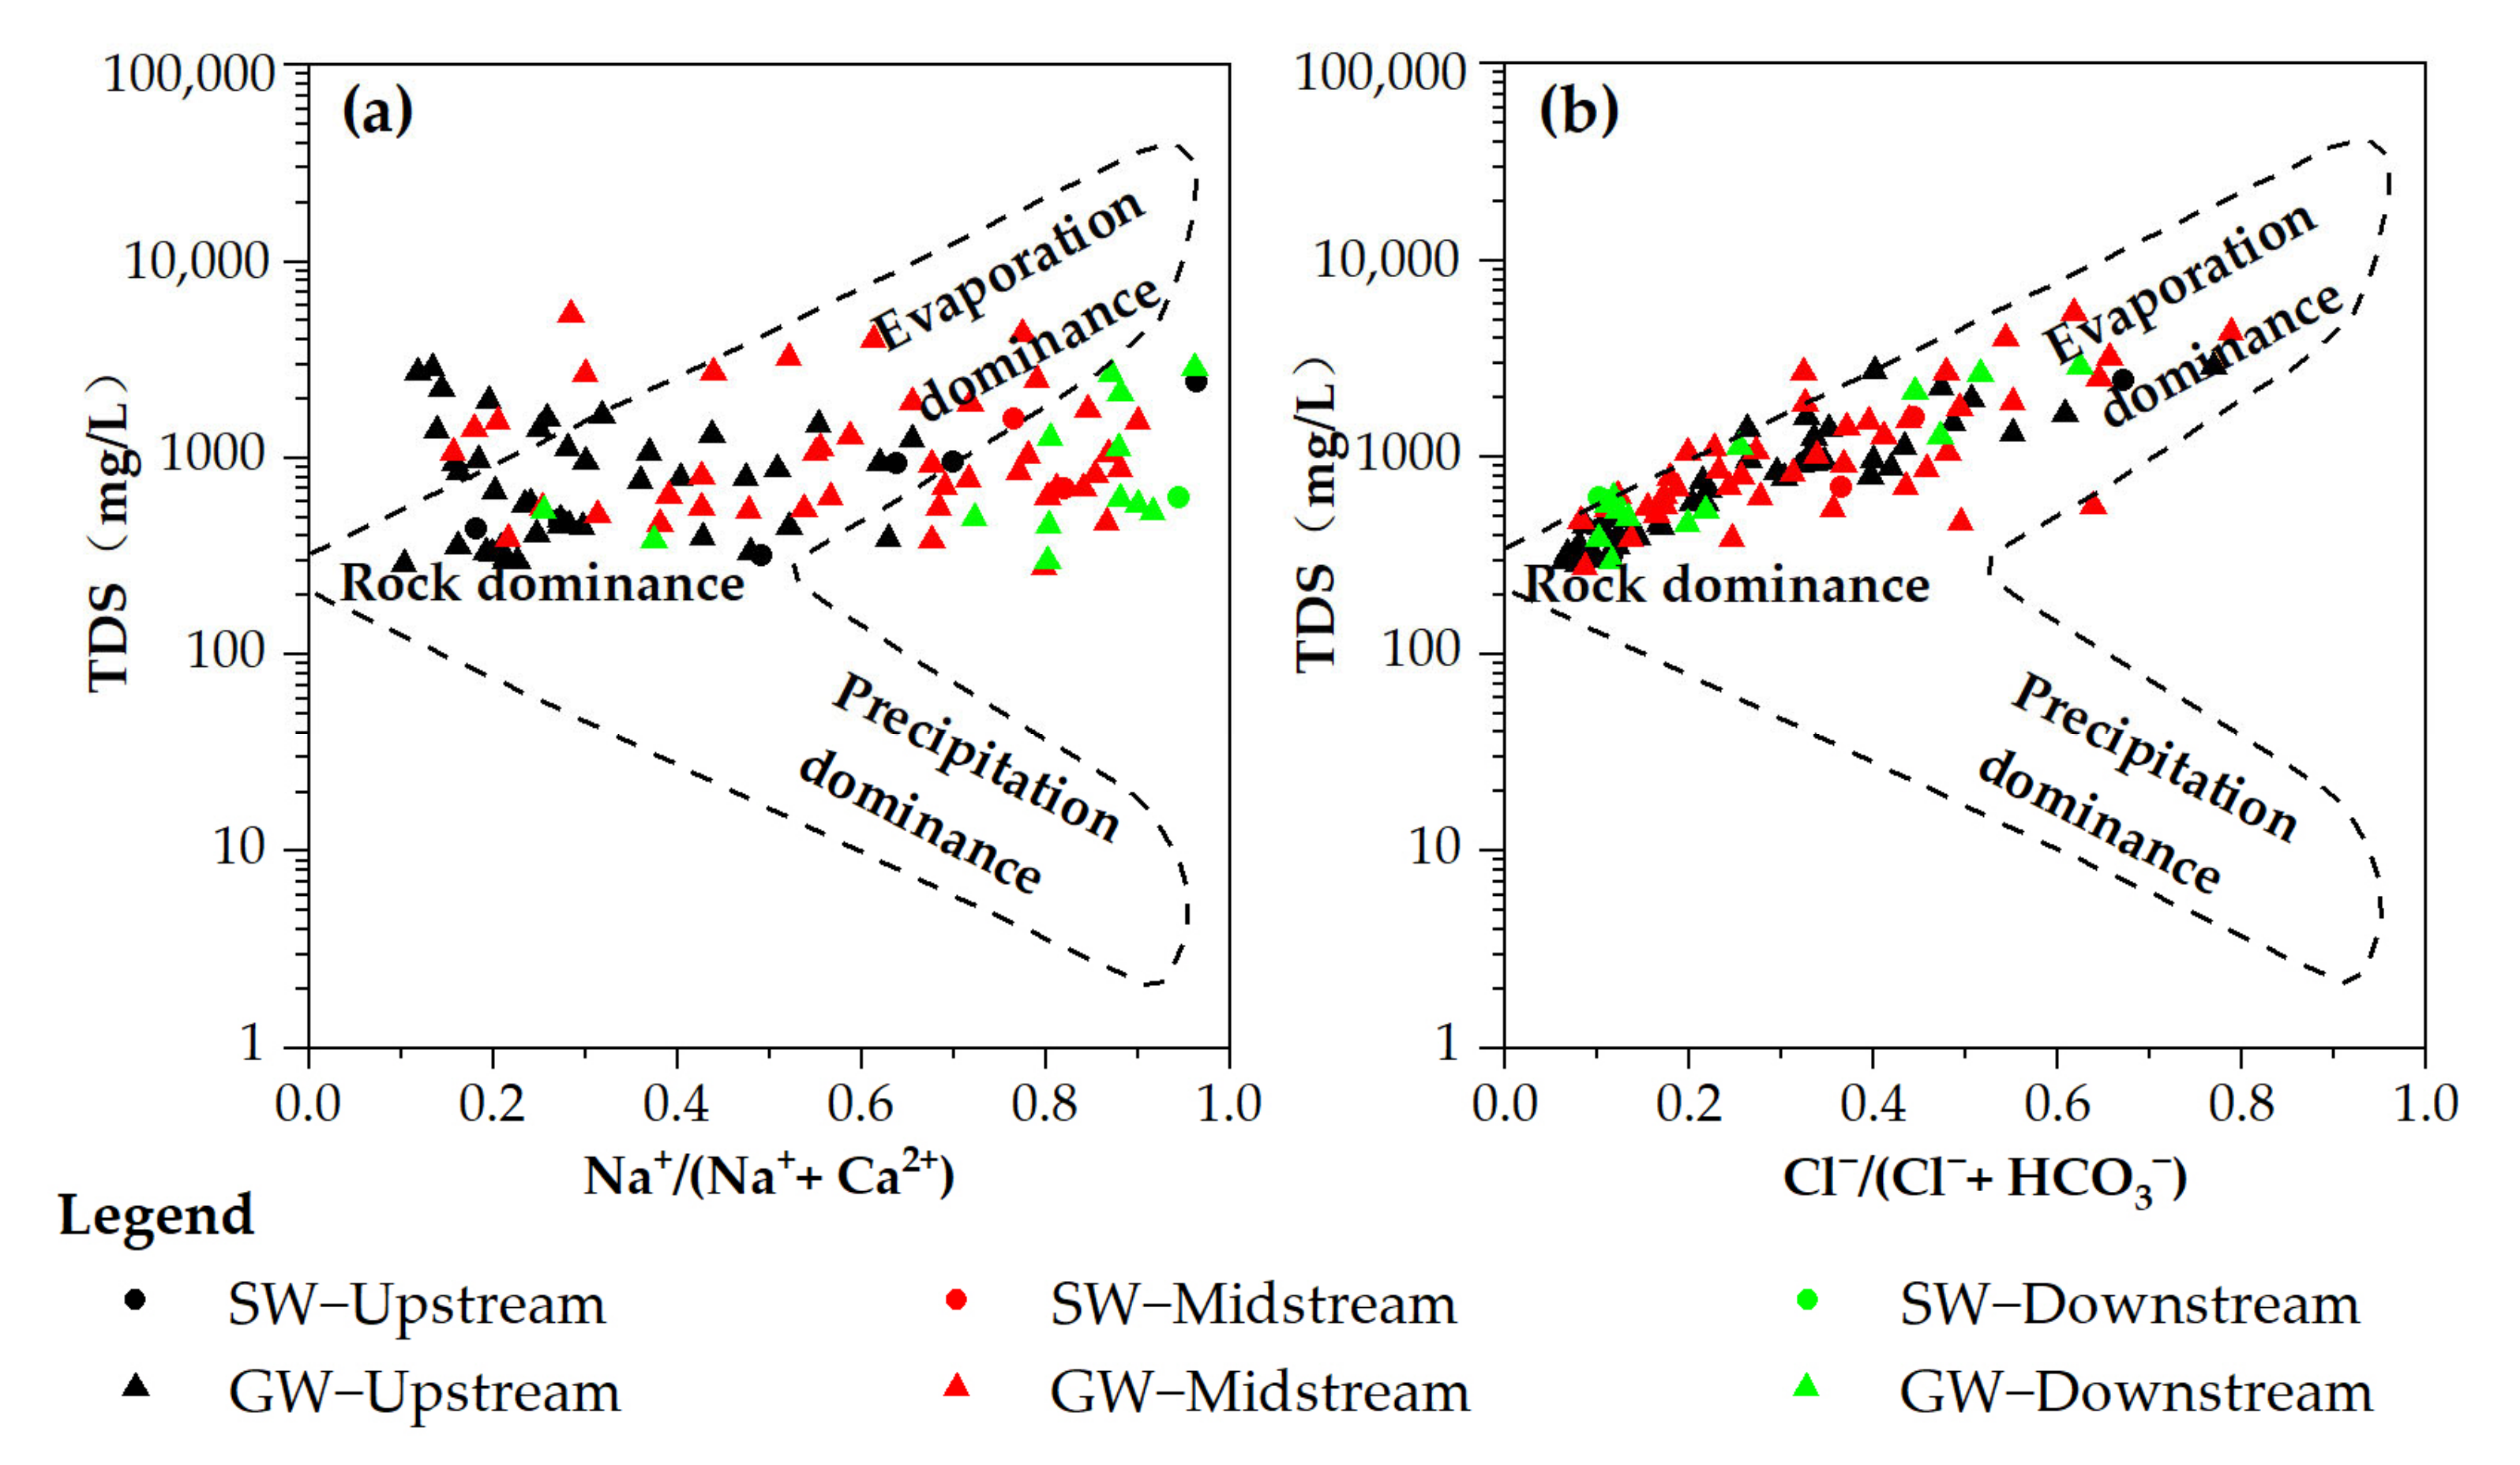
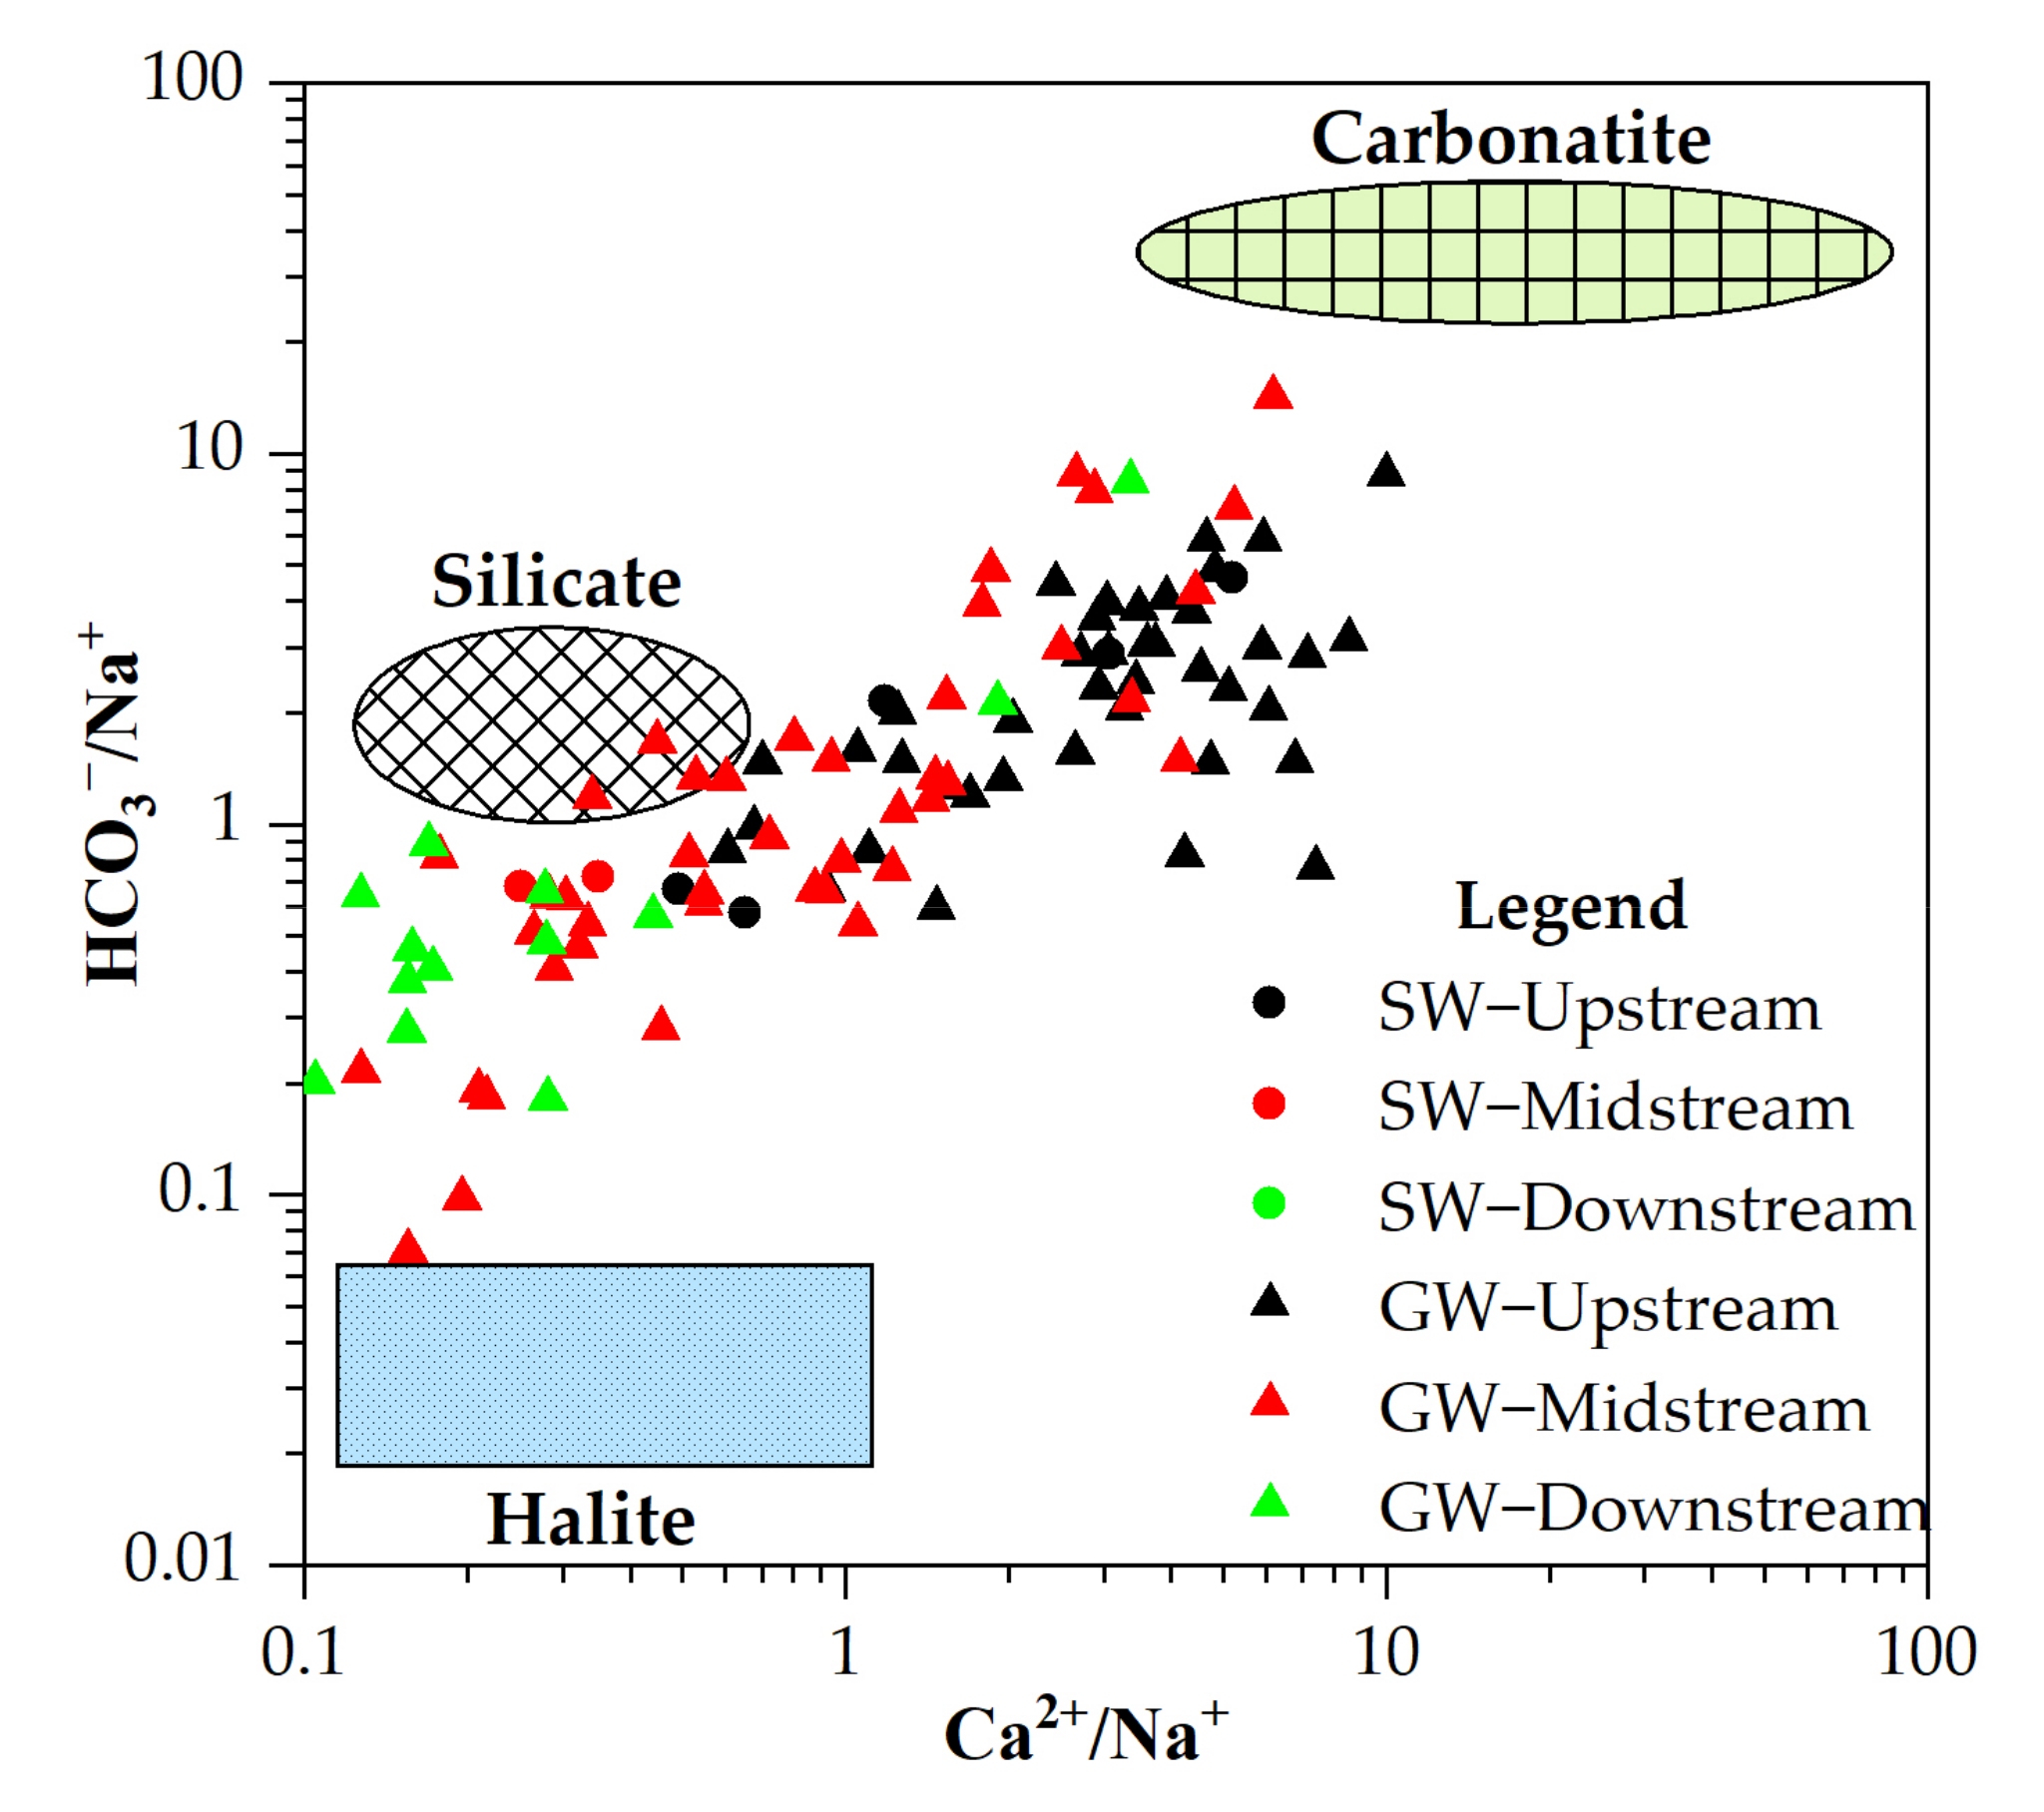
3.2. Hydrochemical Evolutionary Mechanism

In the natural environment, the specific hydrochemical characteristics of water are formed over time in response to the comprehensive influence of climate, topography, aquifer lithology and other factors [39]. According to the Gibbs diagram, the main hydrochemical evolutionary mechanisms were classified into three types: evaporation, rock weathering and atmospheric precipitation [40,41]. As shown in Figure 6, the ratios of Na+/(Na+ + Ca2+) varied between 0.18 and 0.96 for SW and between 0.10 and 0.96 for GW, and the ratio of Cl/(Cl + HCO3) varied between 0.10 and 0.67 for SW and between 0.06 and 0.78 for GW. The SW and GW samples were mainly distributed in the rock weathering zone and drifted toward the evaporation zone, indicating that the ion sources of SW and GW mainly came from rock weathering, and evaporation influenced the ion concentrations. The identification of the same hydrochemical evolution further verified that there was a close connection between SW and GW. As shown in Figure 6a, some GW samples upstream were located above the dotted line, and the ratios of Na+/(Na+ + Ca2+) in these samples were small, but their TDS contents were high. The results indicate that the contents of Ca2+ upstream were higher than those of Na+, and that the TDS was influenced by Ca2+. Some GW samples from midstream and downstream areas were on the right side of the dotted line, meaning that the contents of Na+ in these samples were higher than those of Ca2+. This was mainly due to cation exchange and anthropogenic activities during the runoff process.
Furthermore, the dissolution mechanism was revealed based on the binary phase diagram of HCO3/Na+ vs. Ca2+/Na+ (Figure 7). As shown in the figure, the hydrochemical compositions of the SW and GW upstream were mainly influenced by the dissolution of carbonatite (such as CaCO3), which led to the high contents of HCO3 and Ca2+; while the hydrochemical compositions in the midstream and downstream areas were controlled by the dissolution of silicate and influenced by halite (such as NaCl), which released Na+ and Cl into the water. Based on these findings, it was further verified that there was a certain similarity in the dissolution mechanisms of SW and GW.

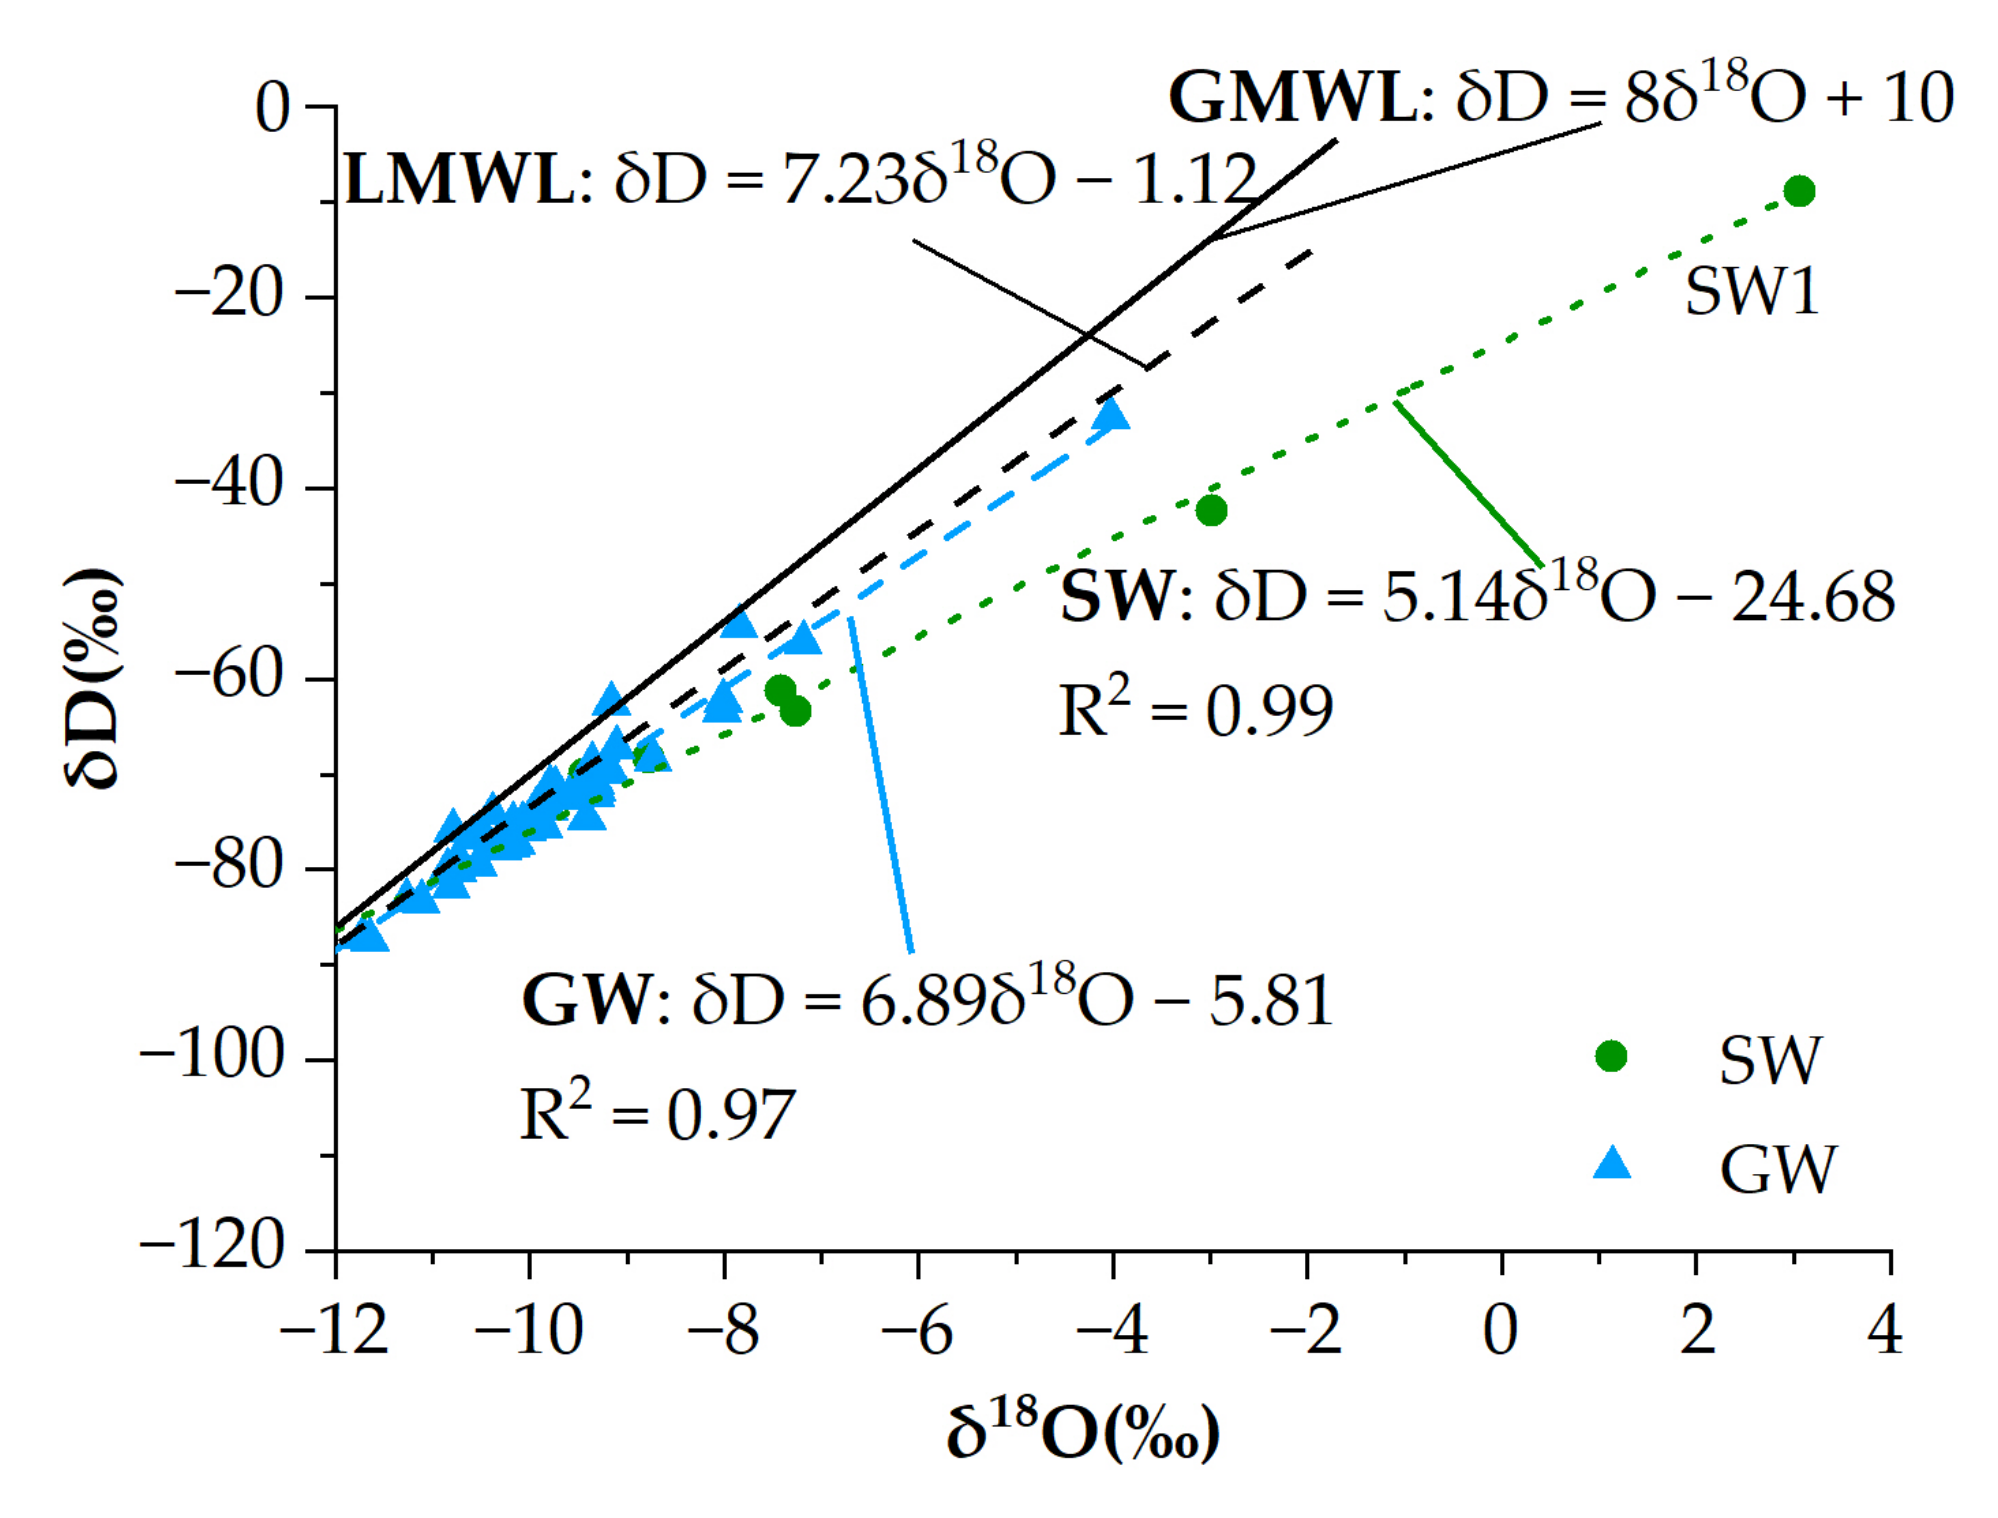
3.3. Isotopic Compositions

The isotopic compositions of SW varied between −94.38‰ and −5.40‰ for δD and between −12.80‰ and +3.06‰ for δ18O, with the averages being −51.75‰ and −5.41‰, respectively. The δD–δ18O line of SW was δD = 5.14δ18O − 24.68 (R2 = 0.99) (Figure 8). The δD values of GW ranged from −111.56‰ to −32.64‰, with an average of −77.51‰, and the δ18O values of GW ranged from −15.10‰ to −4.02‰, with an average of −10.38‰. As shown in Figure 8, the δD–δ18O lines of GW and SW were δD = 6.89δ18O − 5.81 (R2 = 0.97) and δD = 6.89δ18O − 5.81 (R2 = 0.99), respectively. The global meteoric water line (GMWL) was δD = 8δ18O + 10 [42]. According to the studies by Zhang et al. [43], the local meteoric water line (LMWL) was δD = 7.23δ18O + 1.12. The slopes and intercepts of the δD–δ18O lines of SW and GW were both smaller than those of the LMWL, indicating that the isotopic compositions of SW and GW underwent evaporation. This conforms to the reality that evaporation was 4.39 times greater than rainfall.
Comparing the isotopic composition of SW and GW with the GMWL and LMWL, it was inferred that SW and GW were recharged by rainfall infiltration. The δD–δ18O line of SW was closer to that of GW than that of the LMWL, indicating that SW was also recharged by GW. Isotopic analysis of SW showed a deviation from the GW δD–δ18O line, and the average values of δD and δ18O of SW were higher than those of GW. The main reason for this finding was isotopic enrichment following a tendency associated with evaporation processes. The SW and GW samples were collected from May to June, before the rainy season in the study area. During this period, rainfall was infrequent, and SW in the study area was recharged not only by rainfall but also by shallow GW to a great extent. SW samples were dispersedly distributed below the GW δD–δ18O line, indicating that after recharging from GW, the stable isotopes of SW were enriched due to intensive evaporation. Taking sample SW1, which was collected from a reservoir in the upstream area, as an example, the water surface was exposed to the air and evaporation was intensive. Therefore, the δD and δ18O values of the sample were as high as −8.88‰ and +3.06‰, respectively.

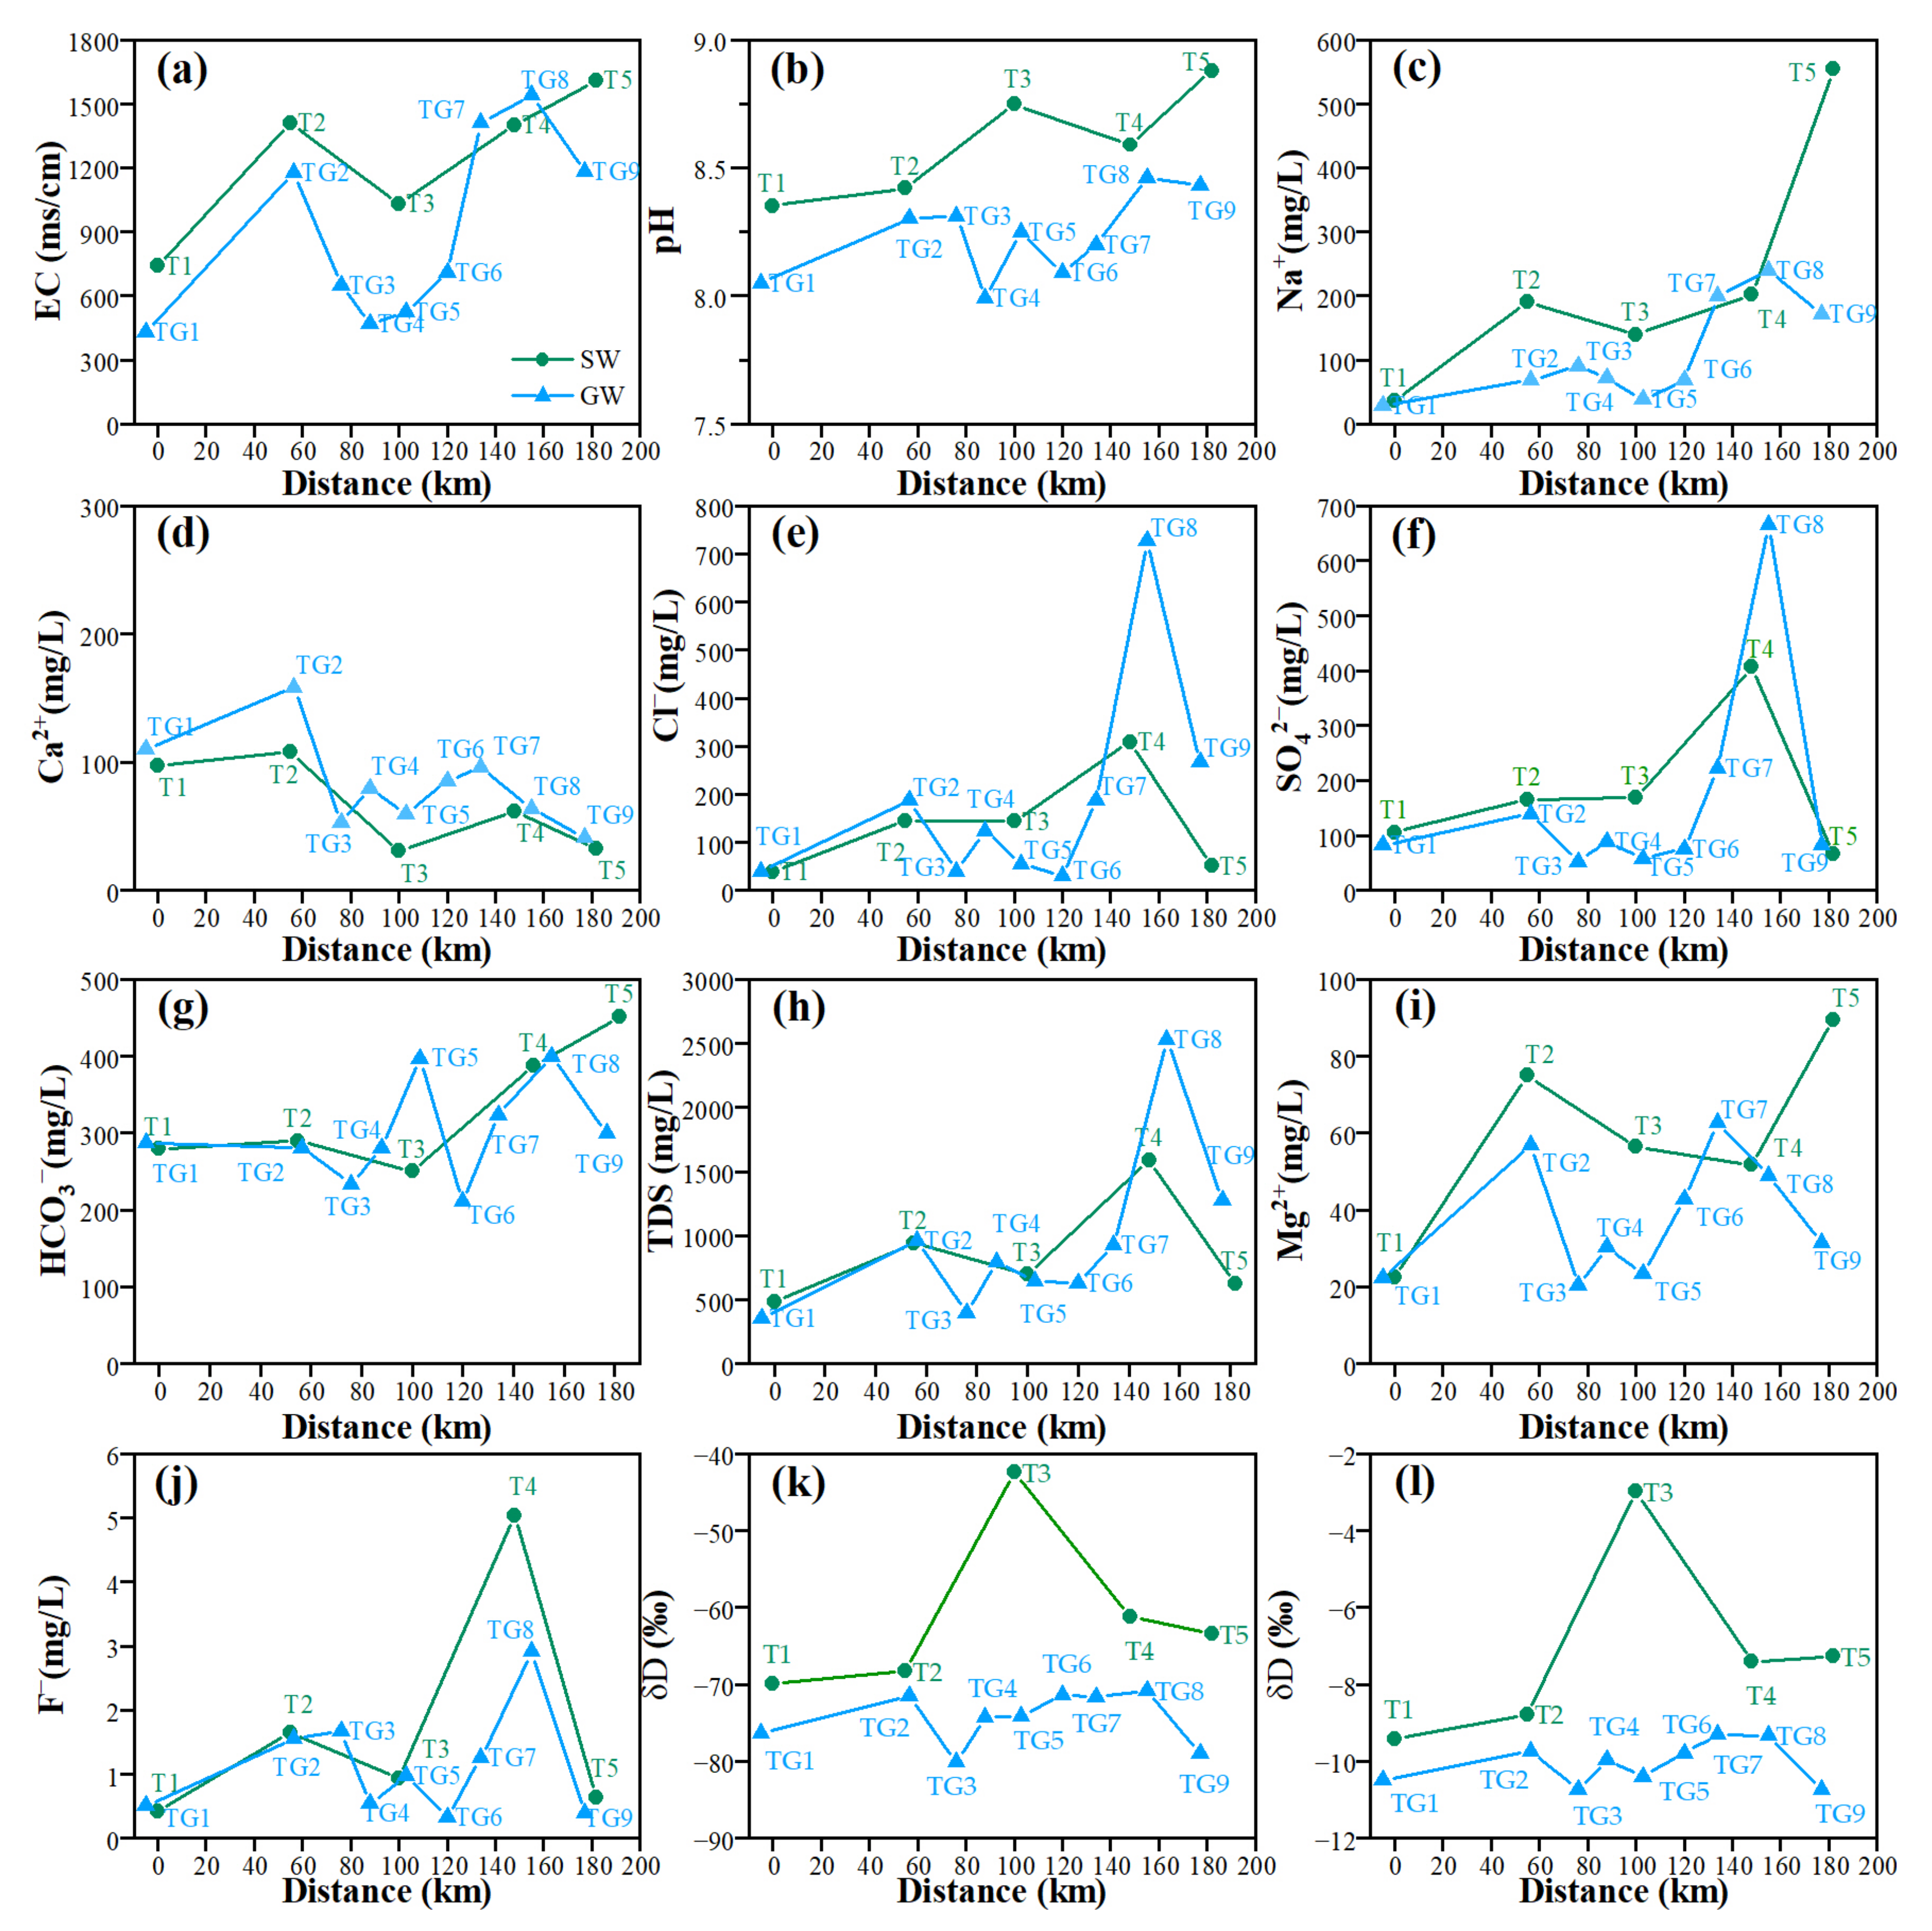
3.4. Analysis of Hydrochemical Indices and Isotopic Characteristics along a Typical Profile

To better understand the interaction between SW and GW, the I–I′ profile along the flow path of the Tabu River was used to analyze the variations in the hydrochemistry and stable isotopes of SW and GW.
As can be seen in Figure 9, the spatial changes in the indices (EC, pH, Na+, Ca2+, Cl, SO42−, HCO3, TDS and F) of SW and GW were the same along the flow path. SW sample T1 and GW sample TG1 were geographically close and were both collected in the upstream area. The indices’ contents of the two samples were similar; sample T4 and sample TG8 were geographically close, the concentrations of the indices (EC, pH, Na+, Ca2+ and HCO3) in the two samples were similar, and the concentrations of Cl, SO42−, TDS and F in sample T4 increased correspondingly when the concentrations in GW sample TG8 increased. GW sample TG9 was collected close to SW sample T5, and the contents of the indices (Ca2+, Cl, SO42−, TDS and F) in sample T5 changed correspondingly when the contents in sample TG9 changed. The consistency of change in the above indices indicates a close relationship between SW and GW. There was a difference in some indices between SW and GW in the midstream and downstream areas, which was mainly caused by tributary recharge and external factors.
The variations in the δD and δ18O of SW and GW along the I–I’ profile were considered. As shown in Figure 9k,l, the δD and δ18O values of SW were enriched from upstream to downstream, and the δD and δ18O values in sample T3 obviously increased. According to the studies by Prabhat et al. [31], the effects of evaporation on the isotopic composition in smaller and shallower water bodies were greater than those on large lakes. Sample T3 was collected from a small pond in which the water was not flowing, and the δD and δ18O compositions were intensively influenced by evaporation. Additionally, the deuterium excess values (d-excess = δD − 8δ18O), proposed by Dansgaard [44], were used to analyze the intensity of evaporation. The more negative the d-excess value was, the stronger the evaporation was [45]. The d-excess of sample T3 was −18.569‰, which was far smaller than the d-excess average of the global meteoric water (10‰) [46] and the d-excess values of other SW samples (Table 1). This result indicates that the evaporation at this sample site was more intensive and led to the enrichment of heavy isotopes in the T3 water body. The δD and δ18O values of GW were enriched from TG1 to TG2 in the upstream area, and the isotopic composition was basically stable in the midstream area (TG4–TG8), indicating that GW received steady runoff recharge from upstream. The δD and δ18O values in sample TG9 were depleted.
Comparing the δD and δ18O of SW and GW, the isotopic values of SW and GW both increased along the flow path, and the isotopic values of SW were higher than those of GW. This result indicates that SW was recharged by GW, and that evaporation had a greater influence on SW after recharging from GW, which led to the enrichment of δD and δ18O in SW. The δD and δ18O values of SW sample T3 were higher, and the Tabu River dried out downstream of T3. GW sample TG5 was collected downstream of T3, but the δD and δ18O values of sample TG5 did not increase, indicating that SW did not recharge the GW and was consumed in other ways, such as absorption by the vadose zone or evaporation.

4. Discussion

The interaction between SW and GW is affected by many factors. The Tabu River catchment is located at a high latitude, and the winter is cold; the coldest month of the year is January, the average temperature is −14 °C and the lowest temperature is −39 °C. The frost period is from October to April, with an average freezing depth of approximately 2.5 m and a maximum of 2.73 m. During the frost period, the river and riverbed are frozen, and there is no interchange between SW and GW until May. This is consistent with the characteristics of other northern steppes [15].
Rainfall in the study area was the main recharge source of SW and GW, which is consistent with the studies focused on the other steppes by Tian and Fang et al. [16]. However, unlike the previous studies, the GW in the study area was recharged by meltwater from the hills and mountains with depleted stable isotopes, which, based on the contents of most GW samples, was determined as being located to the lower left of the GMWL (Figure 8). One reason for this is that the winter in the upstream area is cold, the elevation is high and the landforms are mainly low mountains and hills. All of these conditions are advantageous for the accumulation of ice and snow, meaning that, when spring comes, the meltwaters infiltrate into the phreatic aquifers. Another reason is that GW exists below the surface, and the influence of evaporation on GW is slighter than that on SW.
Upstream (T1~T2), where the terrain is steep, the valleys and plains are distributed in low-lying areas among the low mountains and hills, and the sediment mainly consists of pebbles and cobbles with sand, which makes the structure of the loose vadose zone loose. The vadose zone has strong permeability and provides a good channel for the transformation between SW and GW. The hydrochemical indices, δD and δ18O, in SW and GW both showed increasing trends along the flow path in the upstream area; the contents of some indices (Cl, HCO3, SO42−, TDS and F) of SW were close to those of GW, while the contents of some indices (Na+, Ca2+, δD and δ18O) of SW were higher than those of GW. This phenomenon illustrates the way in which GW is the recharge source of SW. The spatial hydrochemical variations and the hydrochemical evolutionary mechanisms of SW and GW are similar, and the F concentration in SW was correspondingly high where the GW sample featured a high F concentration. Combining the δD–δ18O compositions of SW and GW, it was found that GW recharged SW in the upstream area. This is consistent with studies that have focused on other steppes in Inner Mongolia [15,16].
In the midstream area (T3–T8), where the main landform is high plains and the terrain is flat, the river runs slowly compared with the upstream area. As shown in Figure 10, the study area is in the northern farming-pastoral zone, the farmlands are widely distributed in the south and the agriculture is well developed; the grassland is mainly distributed in the north and the animal husbandry is well developed. The water demand of irrigation is highly reliant on GW. The long-term rapid development of irrigation agriculture (large-scale land reclamation, irrigation, and groundwater pumping) in arid regions has caused the groundwater level to decline. Studies by Delgado et al. [47] have proven that intensive agricultural activities lead to modifications in infiltration runoff patterns. The decline in the GW level led to a decrease in the recharge from GW to SW, or GW recharged SW in the lower area. The runoff decreased, and the river dried in the midstream and downstream areas. SW remained in the form of small ponds. The δD and δ18O of SW were enriched due to intensive evaporation; the GW depths in the midstream area are always deeper than 5 m (the limited evaporation depth), and evaporation has a slight influence on GW compared with SW, which leads to the δD and δ18O values of GW being smaller than those of SW. According to Figure 9k,l, the δD and δ18O lines of SW and GW did not intersect along the profile, which means that SW which was enriched heavy isotopes were not exchanged with GW, and the δD and δ18O compositions in GW were at relatively stable levels. There are two possible reasons for this finding. The first possibility is related to the influence of the hydrogeological features; the sediments in the midstream and downstream areas are composed of finer sediments, such as clay and silt, and the permeability became weak, which was disadvantageous for the interaction between SW and GW. This was consistent with studies proposed by Geris [48] wherein the connectivity is poor in low productivity aquifers. The other possible reason is that the GW levels declined due to human activities and the surface runoff was reduced. The GW depths in the midstream and downstream areas ranged from 5.43 to 21.15 m, that is, the vadose zones were thickened, and SW was consumed by evaporation or replenished the moisture in the vadose zones before infiltrating into the phreatic aquifer. In the downstream area, the δD and δ18O values in sample TG9 were depleted. The GW depth near sample TG9 was as deep as 6.92 m, and the influence of evaporation on the water at this site was slight. In addition, the GW was probably recharged by lateral runoff, which was depleted in δD and δ18O.
According to a previous hydrological survey carried out in 2013 [49], SW recharges GW, and the recharge from SW is important when calculating the GW balance. However, the SW–GW interaction is currently disturbed and the interaction has become unidirectional. That is, GW recharges SW but SW is no longer changed into GW. This occurred because excessive exploitation led to a decline of the GW level and a decrease in river runoff. The finding that human activities have influenced the spatial distribution of SW and GW and their hydraulic connection has been confirmed by Gu [9] and by Irawan [19] et al.
GW is an important recharge source for SW, and the excessive exploitation of GW and the decline in GW level may lead to a decrease in SW runoff and even dryness. Storing runoff generated from rainfall is important for enhancing the seepage of water to aquifers. GW and SW form an organic whole, and the two water bodies affect each other. In addition, water resources are an important habitat factor of arid and semi-arid steppes. To sustain the ecological balance, realize sustainable development and guarantee the implementation of national strategies, it is necessary to reveal the relationship between SW and GW and then optimize the combined management of different water bodies. In addition, water is the carrier of solute transport; the study of the SW–GW interaction is conducive to contaminant tracing and can provide guidance for water pollution control and prevention.
In this study, there are three problems that need to be further studied. The first is that sampling data for only one year were used to reflect the hydrochemical changes and isotopic composition of water bodies, and the representativeness and stability of the data are thus slightly insufficient. In further in-depth studies, sample data from multiple years should be obtained to enhance the credibility of the results. The second problem is that the geological background in the study area is complex, and the basis of previous research is weak; thus, the SW–GW interaction was qualitatively analyzed, but the transformation degree between different water bodies was not quantitatively studied. The quantitative analysis could be further improved by means of hydrogeological investigation, 222Rn isotopic techniques and other methods. The third problem is that SW does not replenish GW in the middle and lower reaches; however, the question of whether SW is consumed by evaporation, replenishes the moisture in the vadose zones, or if both forms of SW consumption exist simultaneously is a problem that needs further research based on the monitoring of soil moisture and δD–δ18O data.

5. Conclusions

Research on the interaction of SW and GW in steppes is of great significance for understanding the hydrological cycle and managing water resources. Due to the unique ecological function of the typical-desertified steppe in northern China, the Tabu catchment was selected as the study area, and an approach combining hydrochemistry and stable isotopes (D and 18O) was applied.
SW and GW in the study area were both weakly alkaline. The relative anionic abundance of SW and GW was in the order of HCO3 > Cl > SO42−, whereas the cationic abundance was Na+ > Ca2+ > Mg2+ > K+. From a spatial perspective, the concentrations of the main ions of SW and GW both showed increasing tendencies from south to north. The hydrochemical evolutions of the two water bodies are controlled by rock weathering and influenced by evaporation. The similarities in the hydrochemical characteristics and evolutions indicate a close relationship between SW and GW, and the loose sediments provide a good channel for SW–GW transformation.
Based on isotopic techniques, it was inferred that the SW and GW in the study area generally originates from rainfall. The δD–δ18O lines of SW and GW were δD = 5.14δ18O − 24.68 and δD = 6.89δ18O − 5.81, respectively. The average values of δD and δ18O of SW were higher than those of GW. The depleted δD–δ18O composition of GW indicates that the meltwater recharge of GW, and that evaporation has a slight influence on GW. SW receives the GW recharge and undergoes intensive evaporation processes.
Along the I–I′ profile, the concentrations of most indices and the δD–δ18O contents in SW and GW both showed increasing tendencies. The closer the SW and GW sampling sites were, the more similar the contents were. The inconsistency of δD and δ18O between SW sample T3 and GW sample TG5 indicates that SW did not recharge to GW in the midstream and downstream areas and was consumed by evaporation or replenished the moisture in the vadose zones. The river dried out midstream and downstream, and SW remained in the form of small ponds, which was mainly caused by the excessive exploitation of GW and the decline in the GW level. This study on the SW–GW interaction deepens the understanding of the hydrological cycle in typical-desertified steppes and reminds us that the influence of the interaction on ecological health should be comprehensively considered. From a management perspective, GW and SW are an organic whole and the two affect each other. The artificial consumption of SW is generally low in the steppes, but the excessive exploitation of GW may lead to a decrease in SW. Thus, the relationship between SW and GW needs to be considered, and the optimal utilization of water resources should be based on it. Additionally, the interaction has the potential to trigger quality exchange between both water bodies. This study is also conducive to contaminant tracing and can provide guidance for water pollution control and prevention. The quantitative analysis of the SW–GW interactions should be further implemented based on 222Rn isotopic techniques, temperature tracing and other methods.

Author Contributions

Conceptualization, J.J. and T.L.; methodology, J.J. and Z.L.; investigation, M.W. and J.Z.; data curation, Z.L.; writing-original draft preparation, J.J.; writing-review and editing, J.J.; funding acquisition, T.L. and J.J. All authors have read and agreed to the published version of the manuscript.

Funding

This research was funded by the Project of Collaborative Innovation Center for Grassland Ecological Security (Eco-hydrological Characteristics and Ecosystem Services Assessment in Tabu River Watershed, No. MK0143A032021), the Basic Scientific Research Foundation Special Project of the China Institute of Water Resources and Hydropower Research (No. MK2022J05) and Inner Mongolia Science and Technology Planning Project (No. 2022YFHH0024).

Institutional Review Board Statement

Not applicable.

Informed Consent Statement

Not applicable.

Data Availability Statement

Not applicable.

Acknowledgments

The authors are grateful to all the editors and anonymous reviewers for their helpful comments that greatly improved the quality of the manuscript.

Conflicts of Interest

The authors declare no conflict of interest.

References

  1. Yang, N.; Zhou, P.P.; Wang, G.C.; Zhang, B.; Shi, Z.M.; Liao, F.; Li, B.; Chen, X.L.; Guo, L.; Dang, X.Y.; et al. Hydrochemical and isotopic interpretation of interactions between surface water and groundwater in Delingha, Northwest China. J. Hydrol. 2021, 598, 126243. [Google Scholar] [CrossRef]
  2. Liu, Y.Y.; Feng, Y.Q.; Jiang, X. Literature analysis of surface water and groundwater interaction based on Citespace. South–North Water Transf. Water Sci. Technol. 2022, 20, 218–229. (In Chinese) [Google Scholar] [CrossRef]
  3. Singh, A. Conjunctive use of water resources for sustainable irrigated agriculture. J. Hydrol. 2014, 519, 1688–1697. [Google Scholar] [CrossRef]
  4. Khan, H.H.; Khan, A. Groundwater–Surface water interaction along river Kali, near Aligarh, India. HydroResearch 2019, 2, 119–128. [Google Scholar] [CrossRef]
  5. Thomas, C.W. Recent advances in understanding the interaction of groundwater and surface water. Rev. Geophys. 1995, 33, 985–994. [Google Scholar] [CrossRef]
  6. Tang, Q.C. Transformation of groundwater and surface water in Chinese arid lands. Geogr. Res. 1990, 9, 51–57. (In Chinese) [Google Scholar] [CrossRef]
  7. Elsawwaf, M.; Feyen, J.; Batelaan, O.; Bakr, M. Groundwater–surface water interaction in Lake Nasser, Southern Egypt. Hydrol. Process. 2014, 28, 414–430. [Google Scholar] [CrossRef]
  8. Delgado, M.I.; Carol, E.; Casco, M.A.; Casco, M.A. Chemical variation of surface water and groundwater in relation to water balance in the watershed of EI Pescado Creek (Central–Eastern Argentina). Environ. Earth Sci. 2020, 79, 399. [Google Scholar] [CrossRef]
  9. Gu, H.B.; Chi, B.M.; Wang, H.; Zhang, Y.W.; Wang, M.Y. Relationship between surface water and groundwater in the Liujiang basin–hydrochemical constrains. Adv. Earth Sci. 2017, 32, 789–799. (In Chinese) [Google Scholar] [CrossRef]
  10. Ochoa, C.G.; Sierra, A.M.; Vives, L. Spatio–temporal effect of climate change on water balance and interactions between groundwater and surface water in plains. Sci. Total Environ. 2020, 722, 137886. [Google Scholar] [CrossRef]
  11. Shu, L.C.; Yin, X.R.; Yuan, Y.J.; Lu, Y.; Lu, C.P.; Liu, B. Temporal and spatial variation of water quantity exchange between surface water and groundwater in typical district of Sanjiang Plain. J. Hydraul. Eng. 2021, 52, 1151–1162. (In Chinese) [Google Scholar] [CrossRef]
  12. Loh, Y.S.A.; Fynn, O.F.; Manu, E.; Afrifa, G.Y.; Addai, M.O.; Akurugu, B.A.; Yidana, S.M. Groundwater–surface water interactions: Application of hydrochemical and stable isotope tracers to the lake bosumtwi area in Ghana. Environ. Earth Sci. 2022, 81, 518. [Google Scholar] [CrossRef]
  13. Qiao, X.Y.; Jiang, M.; Ma, S.Y. Analysis of interaction between lake water and groundwater in beach of Maowusu Lake Basin. Bull. Geol. Sci. Technol. 2022, 41, 50–59. (In Chinese) [Google Scholar] [CrossRef]
  14. Wang, X.H.; Liu, C.L.; Hou, H.B.; Wang, X.Y. Identifying watershed–scale spatiotemporal groundwater and surface water mixing function in the Yiluo River, Middle of China. Environ. Sci. Pollut. Res. Int. 2020, 28, 11053–11065. [Google Scholar] [CrossRef]
  15. Tian, B.Y.; Hu, H.Z.; Xu, L.P.; Zhao, K.; Ren, J.W.; Yu, R.H. Seasonal variations of river–groundwater interaction in a semiarid steppe. J. Arid Land Resour. Environ. 2021, 35, 118–125. (In Chinese) [Google Scholar]
  16. Fang, L.J.; Gao, R.Z.; Jia, D.B.; Yu, R.H.; Liu, X.Y.; Liu, T.X.; Wang, X.X. Characteristics and environmental driving factors of water transformation in the Balaguer river watershed of Inner Mongolia steppe. Chin. J. Appl. Ecol. 2021, 32, 860–868. (In Chinese) [Google Scholar] [CrossRef]
  17. Woessner, W.W. Stream and fluvial plain ground water interactions: Rescaling hydrogeologic thought. Groundwater 2000, 38, 423–429. [Google Scholar] [CrossRef]
  18. Li, F.F.; Liang, W.T.; Yin, H.; Dong, T.T.; Han, Y.J. Effects of climate change and human activities on runoff change in the Tabu river basin. Inn. Mong. Water Resour. 2021, 5, 12–15. (In Chinese) [Google Scholar]
  19. Irawan, D.E.; Silaen, H.; Sumintadireja, P.; Lubis, R.F.; Brahmantyo, B.; Puradimaja, D.J. Groundwater–surface water interactions of Ciliwung River streams, segment Bogor–Jakarta, Indonesia. Environ. Earth Sci. 2015, 73, 1295–1302. [Google Scholar] [CrossRef]
  20. Li, L. Transformation relationship between surface water and groundwater in Tarim river basin. Bull. Soil Water Conserv. 2021, 41, 23–28. (In Chinese) [Google Scholar] [CrossRef]
  21. Li, J.; Wu, H.W.; Zhou, Y.Q.; Zhao, Z.H.; Wang, X.L.; Cai, Y.J.; He, B.; Chen, W.; Sun, W. Variations of stable oxygen and deuterium isotopes in river and lake waters during flooding season along the middle and lower reaches of the Yangtze River regions. Environ. Sci. 2020, 41, 1176–1183. (In Chinese) [Google Scholar] [CrossRef]
  22. Wang, X.Y.; Chang, M.Y.; Gao, C.; Lu, Y.C.; Sha, J.Y. The role of seasonal river in the evolution of desertification in semi–arid region: Taking Tabu river basin of Inner Mongolia as an Example. Geogr. Res. 2004, 7, 440–446. (In Chinese) [Google Scholar]
  23. Liang, W.T.; Yin, H.; Han, Z.H.; Zhang, Y.F.; Zhang, P. Temporal and Spatial Variation Analysis of evapotranspiration in Tabu River Basin based on remote sensing. J. Inn. Mong. Agric. Univ. (Nat. Sci. Ed.) 2022, 43, 27–34. (In Chinese) [Google Scholar] [CrossRef]
  24. Hou, Q.Q.; Dong, S.G.; Zhang, M.W. Chemical characteristics and genesis of shallow groundwater in Siziwang Banner, Inner Mongolia. J. Arid Land Resour. Environ. 2020, 34, 116–121. (In Chinese) [Google Scholar]
  25. Wei, Z.Y.; Tang, Q.Y. Interaction between surface water and groundwater resources and calculations of total amount of water resources in the arid zone of northwest China. J. Arid Land Resour. Environ. 1997, 12, 2–8. (In Chinese) [Google Scholar] [CrossRef]
  26. Yin, L.H.; Zhang, J.; Wang, Z.; Dong, J.Q.; Chang, L.; Li, C.Y.; Zhang, P.W.; Gu, X.F.; Nie, Z.L. Groundwater circulation patterns and its resources assessment of inland river catchments in northwestern China. Geol. China 2021, 48, 1094–1111. (In Chinese) [Google Scholar] [CrossRef]
  27. Wang, H.M.; Jiao, Y.F.; Hu, B.X.; Li, F.L.; Li, D. Study on interaction between surface water and groundwater in typical reach of Xiaoqing River based on WEP–L model. Water 2023, 15, 492. [Google Scholar] [CrossRef]
  28. Zhan, L.C.; Chen, J.S.; Zhang, S.Y.; Li, L.; Huang, D.W. Isotopic signatures of precipitation, surface water, and groundwater interactions, Poyang Lake Basin, China. Environ. Earth Sci. 2016, 75, 1307. [Google Scholar] [CrossRef]
  29. Kumar, M.; Ramanathan, A.; Keshari, A.K. Understanding the extent of interactions between groundwater and surface water through major ion chemistry and multivariate statistical techniques. Hydrol. Process. 2009, 23, 297–310. [Google Scholar] [CrossRef]
  30. Kattan, Z. Chemical and isotopic characteristics of the Euphrates River water, Syria: Factors controlling its geochemistry. Environ. Earth Sci. 2015, 73, 4763–4778. [Google Scholar] [CrossRef]
  31. Prabhat, S.; Suhas, K.; Kumar, J.S.; Sudhir, K. Variation in δ18O and δ2H values of rainfall, surface water, and groundwater in the Sukhna Lake basin in northwest India. Environ. Earth Sci. 2020, 79, 535. [Google Scholar] [CrossRef]
  32. Lei, M.; Zhou, J.L.; Zhang, J.; Chen, Y.P.; Teng, J.; Wu, T.; Xu, D.S.; Sun, Y.; Ji, Y.Y. Hydrochemical characteristics and transformation relationship of surface water and groundwater in the plain area of Bortala River Basin, Xinjiang. Environ. Sci. 2022, 43, 1873–1884. (In Chinese) [Google Scholar] [CrossRef]
  33. Gil-M’arquez, J.M.; Andreo, B.; Mudarra, M. Combining hydrodynamics, hydrochemistry, and environmental isotopes to understand the hydrogeological functioning of evaporite–karst springs: An example from southern Spain. J. Hydrol. 2020, 576, 299–314. [Google Scholar] [CrossRef]
  34. GB3838–2002; Environmental Quality Standards for Surface Water. Standards Press of China: Beijing, China, 2017. (In Chinese)
  35. GB/T14848–2017; Standard for Groundwater Quality. Standards Press of China: Beijing, China, 2017. (In Chinese)
  36. China Geological Survey. Handbook of Hydrogeology, 2nd ed.; Geological Publishing House: Beijing, China, 2018.
  37. Heaton, T.H.E. Isotopic studies of nitrogen pollution in the hydrosphere and atmosphere: A review. Chem. Geol. Isot. Geosci. Sect. 1986, 59, 87–102. [Google Scholar] [CrossRef]
  38. Fuoco, I.; Marini, L.; De Rosa, R.; Figoli, A.; Gabriele, B.; Apollaro, C. Use of reaction path modelling to investigate the evolution of water chemistry in shallow to deep crystalline aquifers with a special focus on fluoride. Sci. Total Environ. 2022, 830, 154566. [Google Scholar] [CrossRef]
  39. Jin, J.; Wang, Z.H.; Zhao, Y.P.; Ding, H.J.; Zhang, J. Delineation of hydrochemical characteristics and tracing nitrate contamination of groundwater based on hydrochemical methods and isotope techniques in the northern Huangqihai Basin, China. Water 2022, 14, 3168. [Google Scholar] [CrossRef]
  40. Gibbs, R.J. Mechanisms controlling world water chemistry. Science 1970, 170, 1088–1090. [Google Scholar] [CrossRef]
  41. Hu, C.P.; Liu, Z.Q.; Xiong, K.N.; Liu, X.X.; Li, Y.; Zhang, R.K. Characteristics of and influencing factors of hydrochemistry and carbon/nitrogen variation in the Huangzhouhe river basin, a World Natural Heritage Site. Int. J. Environ. Res. Public Health 2021, 18, 13169. [Google Scholar] [CrossRef]
  42. Craig, H. Isotopic variations in meteoric waters. Science 1961, 133, 1702–1703. [Google Scholar] [CrossRef]
  43. Zhang, Y.F.; Wei, Y.F.; Liao, Z.L.; Xu, X.M.; Han, Z.H.; Liang, W.T.; Long, Y.H.; Guo, J.Y. Determination of soil-groundwater systems recharge mechanism in the middle Inner Mongolia Plateau by isotopic tracers. Environ. Earth Sci. 2020, 79, 473. [Google Scholar] [CrossRef]
  44. Dansgaard, W. Stable isotopes in precipitation. Tellus 1964, 16, 436–468. [Google Scholar] [CrossRef]
  45. Claus, K.; Rolf, F.R.; Fernando, R.B.; Iñaki, V. Vapor source and spatiotemporal variation of precipitation isotopes in southwest Spain. Hydrol. Process. 2021, 35, e14445. [Google Scholar] [CrossRef]
  46. Mayo, A.L.; Tingey, D.G. Shallow groundwater chemical evolution, isotopic hyperfiltration, and salt pan formation in a hypersaline endorheic basin: Pilot Valley, Great Basin, USA. Hydrogeol. J. 2021, 29, 2219–2243. [Google Scholar] [CrossRef]
  47. Delgado, M.I.; Carol, E.; Casco, M.A. Land–use changes in the peri urban interface: Hydrologic consequences on a flat land watershed scale. Sci. Total Environ. 2020, 722, 137836. [Google Scholar] [CrossRef]
  48. Geris, J.; Comte, J.C.; Franchi, F.; Petros, A.K.; Tirivarombo, S.; Selepeng, Ame, T.; Villholth, K.G. Surface water-groundwater interactions and local land use control water quality impacts of extreme rainfall and flooding in a vulnerable semi-arid region of Sub-Saharan Africa. J. Hydrol. 2022, 609, 127834. [Google Scholar] [CrossRef]
  49. Geological Institute of Inner Mongolia. Report of Groundwater Resources Exploration and Utilization Zoning; Geological Institute of Inner Mongolia: Hohhot, China, 2017. [Google Scholar]
Figure 1. (a) Location of the study area, distributions of samples and pictures of sampling sites; (b) hydrogeological profile (A–A’, B–B’, C–C’) of the study area.
Sustainability 15 11034 g001
Figure 2. Methodology flowchart.
Sustainability 15 11034 g002
Figure 3. Boxplots of hydrochemical indices of SW and GW. (a) Na+, Ca2+, Mg2+, Cl, HCO3, SO42−; (b) pH; (c) TDS, TH and EC; and (d) F. EC: μs/cm. pH is unitless, the units of other hydrochemical indices are in mg/L.
Sustainability 15 11034 g003
Figure 4. Piper diagrams of SW (a) and GW (b).
Sustainability 15 11034 g004
Figure 5. Boxplots of EC of SW and GW.
Sustainability 15 11034 g005
Figure 6. Gibbs diagram of SW and GW. (a) the relationship between TDS vs. Na+/(Na+ + Ca2+), and (b) the relationship between TDS vs. Cl/(Cl + HCO3).
Sustainability 15 11034 g006
Figure 7. Binary phase diagram of HCO3/Na+ vs. Ca2+/Na+.
Sustainability 15 11034 g007
Figure 8. δD–δ18O plot showing data of SW and GW.
Sustainability 15 11034 g008
Figure 9. Variations in hydrochemical indices (aj) and isotopes (k,l) along the I–I’ profile. Distance: the distance between the water sampling site and the source of the Tabu River.
Sustainability 15 11034 g009
Figure 10. Distributions of land use types and pumping wells of the study area.
Sustainability 15 11034 g010
Table 1. Statistics of d-excess of SW and GW (Unit: ‰).
LocationSWGW
Sampled-excessSampled-excess
UpstreamT1+5.48n = 56+6.21
T2+1.93
MidstreamT3−18.57n = 103+5.46
T4−1.94
DownstreamT5−5.35n = 13+2.93
Disclaimer/Publisher’s Note: The statements, opinions and data contained in all publications are solely those of the individual author(s) and contributor(s) and not of MDPI and/or the editor(s). MDPI and/or the editor(s) disclaim responsibility for any injury to people or property resulting from any ideas, methods, instructions or products referred to in the content.

