Article

Comparative Valuation of Three Ecosystem Services in a Canadian Watershed Using Global, Regional, and Local Unit Values

by
Tariq Aziz
1,2,*,
Alain-Désiré Nimubona
3 and
Philippe Van Cappellen
2
1
Aquanty, 600 Weber St. N., Unit B, Waterloo, ON N2V 1K4, Canada
2
Ecohydrology Research Group, Water Institute and Department of Earth and Environmental Sciences, University of Waterloo, Waterloo, ON N2L 3G1, Canada
3
Department of Economics and Water Institute, University of Waterloo, Waterloo, ON N2L 3G1, Canada
*
Author to whom correspondence should be addressed.
Sustainability 2023, 15(14), 11024; https://doi.org/10.3390/su151411024
Submission received: 13 April 2023 / Revised: 6 July 2023 / Accepted: 10 July 2023 / Published: 14 July 2023

Abstract

:
Economic valuations of ecosystem services often transfer previously estimated global unit values to the geographical setting of interest. While this approach produces quick results, its reliability depends on how representative the large-scale average unit values are for the given local context. Here, we estimate the values of three ecosystem services (ES)—water filtration, nutrient cycling, and carbon sequestration—in the Grand River watershed (GRW) of southern Ontario, Canada. The watershed covers nearly 7000 km2, has a humid continental climate and a population of close to one million people. Land cover is dominated by agriculture. We compare ES valuations using locally derived (i.e., GRW-specific) unit values to valuations based on unit values from a regional database and those compiled in the global Ecosystem Services Valuation Database (ESVD). The regional database includes mean unit values from three case studies within southern Ontario and one boreal watershed in British Columbia. As expected, the regional database yields average monetary values for the three ES that are close to those obtained using the local unit values but with larger associated uncertainties. Using the ESVD, however, results in significantly higher monetary values for the ES. For water filtration, the ESVD value is more than five times higher than the regional and local estimates. We further illustrate the effect of the extent of aggregation of forested and agricultural land categories on the ES values. For example, by subdividing the forest category into three subcategories (deciduous, coniferous, and mixed forest), the estimated value of the carbon sequestration service from forested areas within the GRW decreases by 7%. Overall, our results emphasize the importance of critically assessing the origin of unit values and the land cover resolution in ES valuation, especially when ES valuation is used as a policy-guiding tool.

1. Introduction

The importance of ecosystem services (ES) is now well established, as well as the need to protect ES against degradation and loss [1]. In almost all cases, humans are directly or indirectly causing the loss of ES through, among others, land use and land cover changes, climate warming, the introduction of invasive species, changing lifestyles, and conflicts [2,3,4,5,6,7]. To highlight the contributions of ES to decision makers attuned to economic thinking, the concept of assigning economic values to ES was introduced [8]. While the number of studies on the economic valuation of ESrapidly grew over the past few decades, many challenges still face its practical uptake in environmental policy and management [9,10]. The value transfer method—a straightforward and popular method for estimating monetary values of ES—uses secondary data from pre-existing valuation studies and applies them to the region of interest. That is, the data originate from other geographical settings and were generated employing a variety of economic valuation methods, e.g., cost-based and survey-based methods [11]. Despite the associated uncertainties, many valuation studies from around the world transfer unit values compiled in global databases to their study area (Table 1).
The value transfer method can yield rough first estimates of the economic value of ES in a given geographical unit, for example, a country, province, river watershed or coastal zone. The valuation of ecosystem services using the value transfer method provides a simple approach to obtain monetary values for multiple ES. However, it is well-recognized that this method has inherent limitations. The monetary values that are generated should not be construed as exact values. Instead, they should be used to inform the comparative analysis of the relative values of different services at specific temporal intervals [28]. The method is particularly favored in regions where little or no prior ES economic valuation work has been conducted [29]. Here, we focus on ES in a moderately large watershed in southern Ontario, Canada. River watersheds are the fundamental landscape units of the freshwater cycle. Watersheds are mosaics of surface and subsurface ecosystems and the comprehensive value assessment of all their ES requires a combination of methods and metrics [30]. Because of the diversity of ecosystems and ecosystem functions within watersheds, a full valuation of ES based on primary data may become prohibitive in terms of costs and human resources [31]. Thus, the transfer of part, or all, of the required unit values from existing global and regional databases may be inevitable.
The ranges associated with transferred unit values are typically very large, hence, yielding monetary estimates of ES with equally large uncertainties that, in turn, cast doubt on the reliability and relevance of the ES values. Kennedy (2014), for example, compared the value transfer method against cost-based approaches for ES in a region of the Netherlands [32]. This author showed that the value transfer method imparted systematically higher (up to three times higher) values to the ES compared to the other methods. This raises the question as to how meaningful and effective unit values transferred from existing datasets are for informing decision making at the local level [33,34,35].
The valuation of (land-based) ecosystem services is often performed by considering two variables [8]: (1) The unit value of a given ES delivered by a particular land use category (expressed, e.g., in units of dollars per hectare per year); (2) The area of the land use category in the region of interest. The unit values determine to a large extent the accuracy and reliability of the monetary estimates of ES [36]. There is, thus, a need to investigate how regional and global unit values compare against primary valuation studies specific to the watershed under consideration. Furthermore, in many studies, diverse land cover types are aggregated into a single land use category to match the available unit values. However, the aggregation process itself can significantly affect the outcomes of economic valuation studies [37,38,39,40,41,42].
With advances in remote sensing, high spatial resolution land cover datasets are becoming available worldwide [43]. This may cause a growing mismatch between the level of detail in local land use data and the coarseness of the unit values in existing databases that only account for major land use categories (for an example of this mismatch, see [24]). To apply the (coarse) unit values it then becomes necessary to aggregate land use sub-categories (e.g., deciduous, mixed plus coniferous forest) into the larger category (e.g., forest). Hence, there is a need to explore the effect of the aggregation of land use categories on the estimated values of ES.
In this paper, we assess the effects of using different unit values and land use datasets on the economic values of three ES: water filtration, nutrient cycling, and carbon sequestration. The valuations are carried out for the Grand River watershed (GRW) in southern Ontario. Specifically, we compare watershed-scale monetary values of the ES using local, that is specific to the GRW, unit values against those derived from regional and global compilations of unit values. We further compare the results obtained using the local unit values for two different land use resolutions. Our case study illustrates the danger of using unit values that are not grounded in the local reality, as well as the importance of considering the variable impacts of land use resolution on the valuation of ES.

2. Materials and Methods
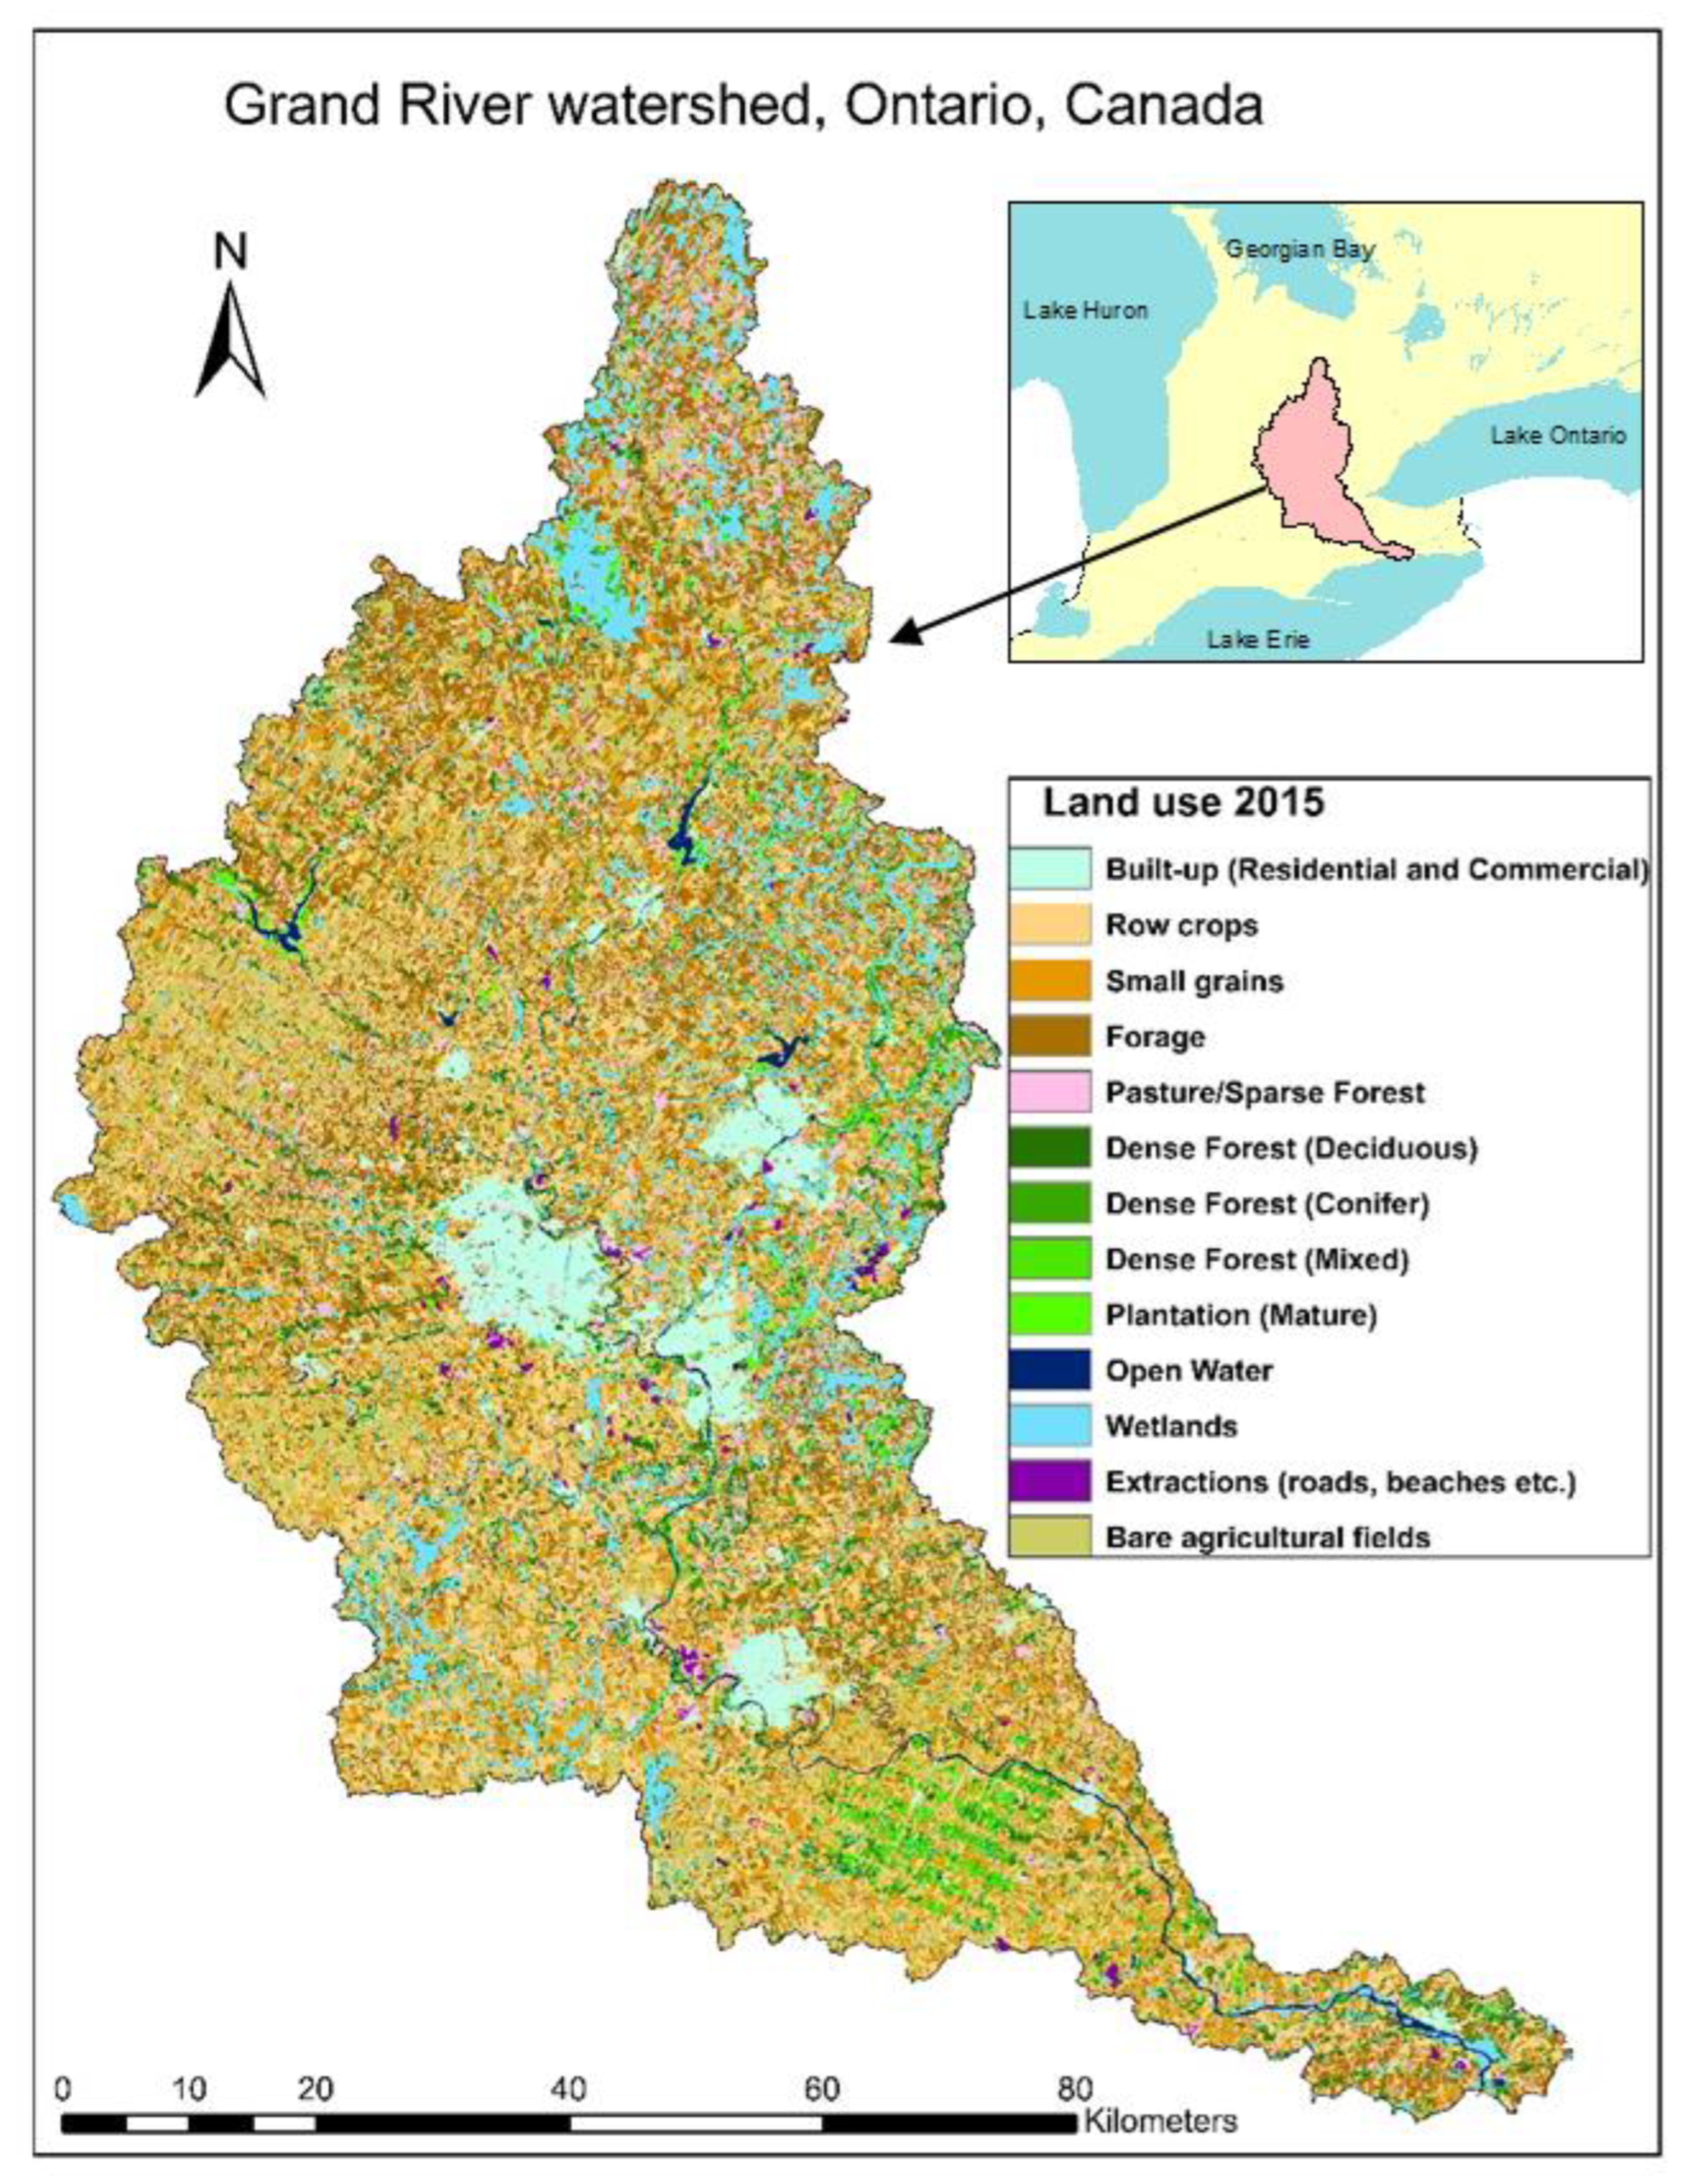
2.1. Study Area

The Grand River watershed (GRW) in southern Ontario, Canada covers an area of 680,000 hectares and flows into Lake Erie ([44], Figure 1). It is a multiuse watershed with land cover dominated by agriculture (66%). It has a rapidly growing population of just under 1 million, mostly concentrated in the urban areas. Olewiler (2004) previously valued the total natural capital and ES of the GRW at $195/ha/year [45]. Increasing pressures from ongoing population growth, urban expansion, and agricultural intensification, however, are negatively impacting the provision of many ES in the watershed [45,46]. Most importantly for our study, primary (i.e., local, GRW-specific) unit values have been estimated for the selected ES (see next section). In addition, detailed land cover data are available (Table 2).

2.2. Economic Valuation of Three Ecosystem Services

The annual monetary value of a given ES integrated over the entire watershed was calculated as follows [12]:
E S V = k = 1 n ( A k × U V k )
where E S V is the total ES value for the watershed ($/year), A k is the area (ha) of land cover category k, U V k is the unit value ($/ha/year) of the selected ES provided by land cover category k , and n is the total number of land cover (or land cover) categories considered. All unit values used here were recalculated to 2017 Canadian dollars (CAD) using the Bank of Canada’s inflation calculator.
Equation (1) was applied to three ES: water filtration (or purification), nutrient cycling, and carbon sequestration. These ES were selected because they are key to, respectively, drinking water source protection and supply, soil fertility, and climate regulation. Furthermore, their values are closely linked to the performance of local ecosystem functions, as well as regional socioeconomic and, particularly in the case of climate change mitigation, political factors. Nutrient cycling reflects the nature and management practices of agroecosystems, including fertilizer usage, crop rotation, and nutrient abatement strategies [47]. Carbon pricing politics across various levels of government affect the value of carbon sequestration, while the loss of natural water filtration capacity in turn may require additional investment in conventional (engineering) water treatment infrastructure.
The use of Equation (1) requires that the unit values and land cover categories coincide. Thus, when unit values are only available for major land cover categories (e.g., forest, agriculture, and open water) the areas of land cover subcategories must be aggregated to generate the total area of the corresponding major category. Alternatively, when unit values are available for multiple land cover subcategories but the land cover data only cover the major land cover categories, the unit values of the land cover subcategories must somehow be averaged to produce a single value for the major land cover category.

2.3. Unit Values

2.3.1. Local Unit Values

Local unit values for the three ES based on primary biophysical and economic data specific to the GRW have been estimated by Aziz (2018) [48] and Belcher et al. (2001) [49]. Both studies used cost-based approaches, including the replacement cost, and avoided cost methods, to derive the unit values. Cost-based approaches are appropriate to valuate a single or a limited number of ES, given that technological solutions cannot replace all the services provided by an ecosystem [50]. The resulting unit values, expressed in 2017 CAD, are listed in Table 3. Because these values are specific to the GRW they are henceforward assumed to yield the best (i.e., most accurate) baseline valuations for the watershed.

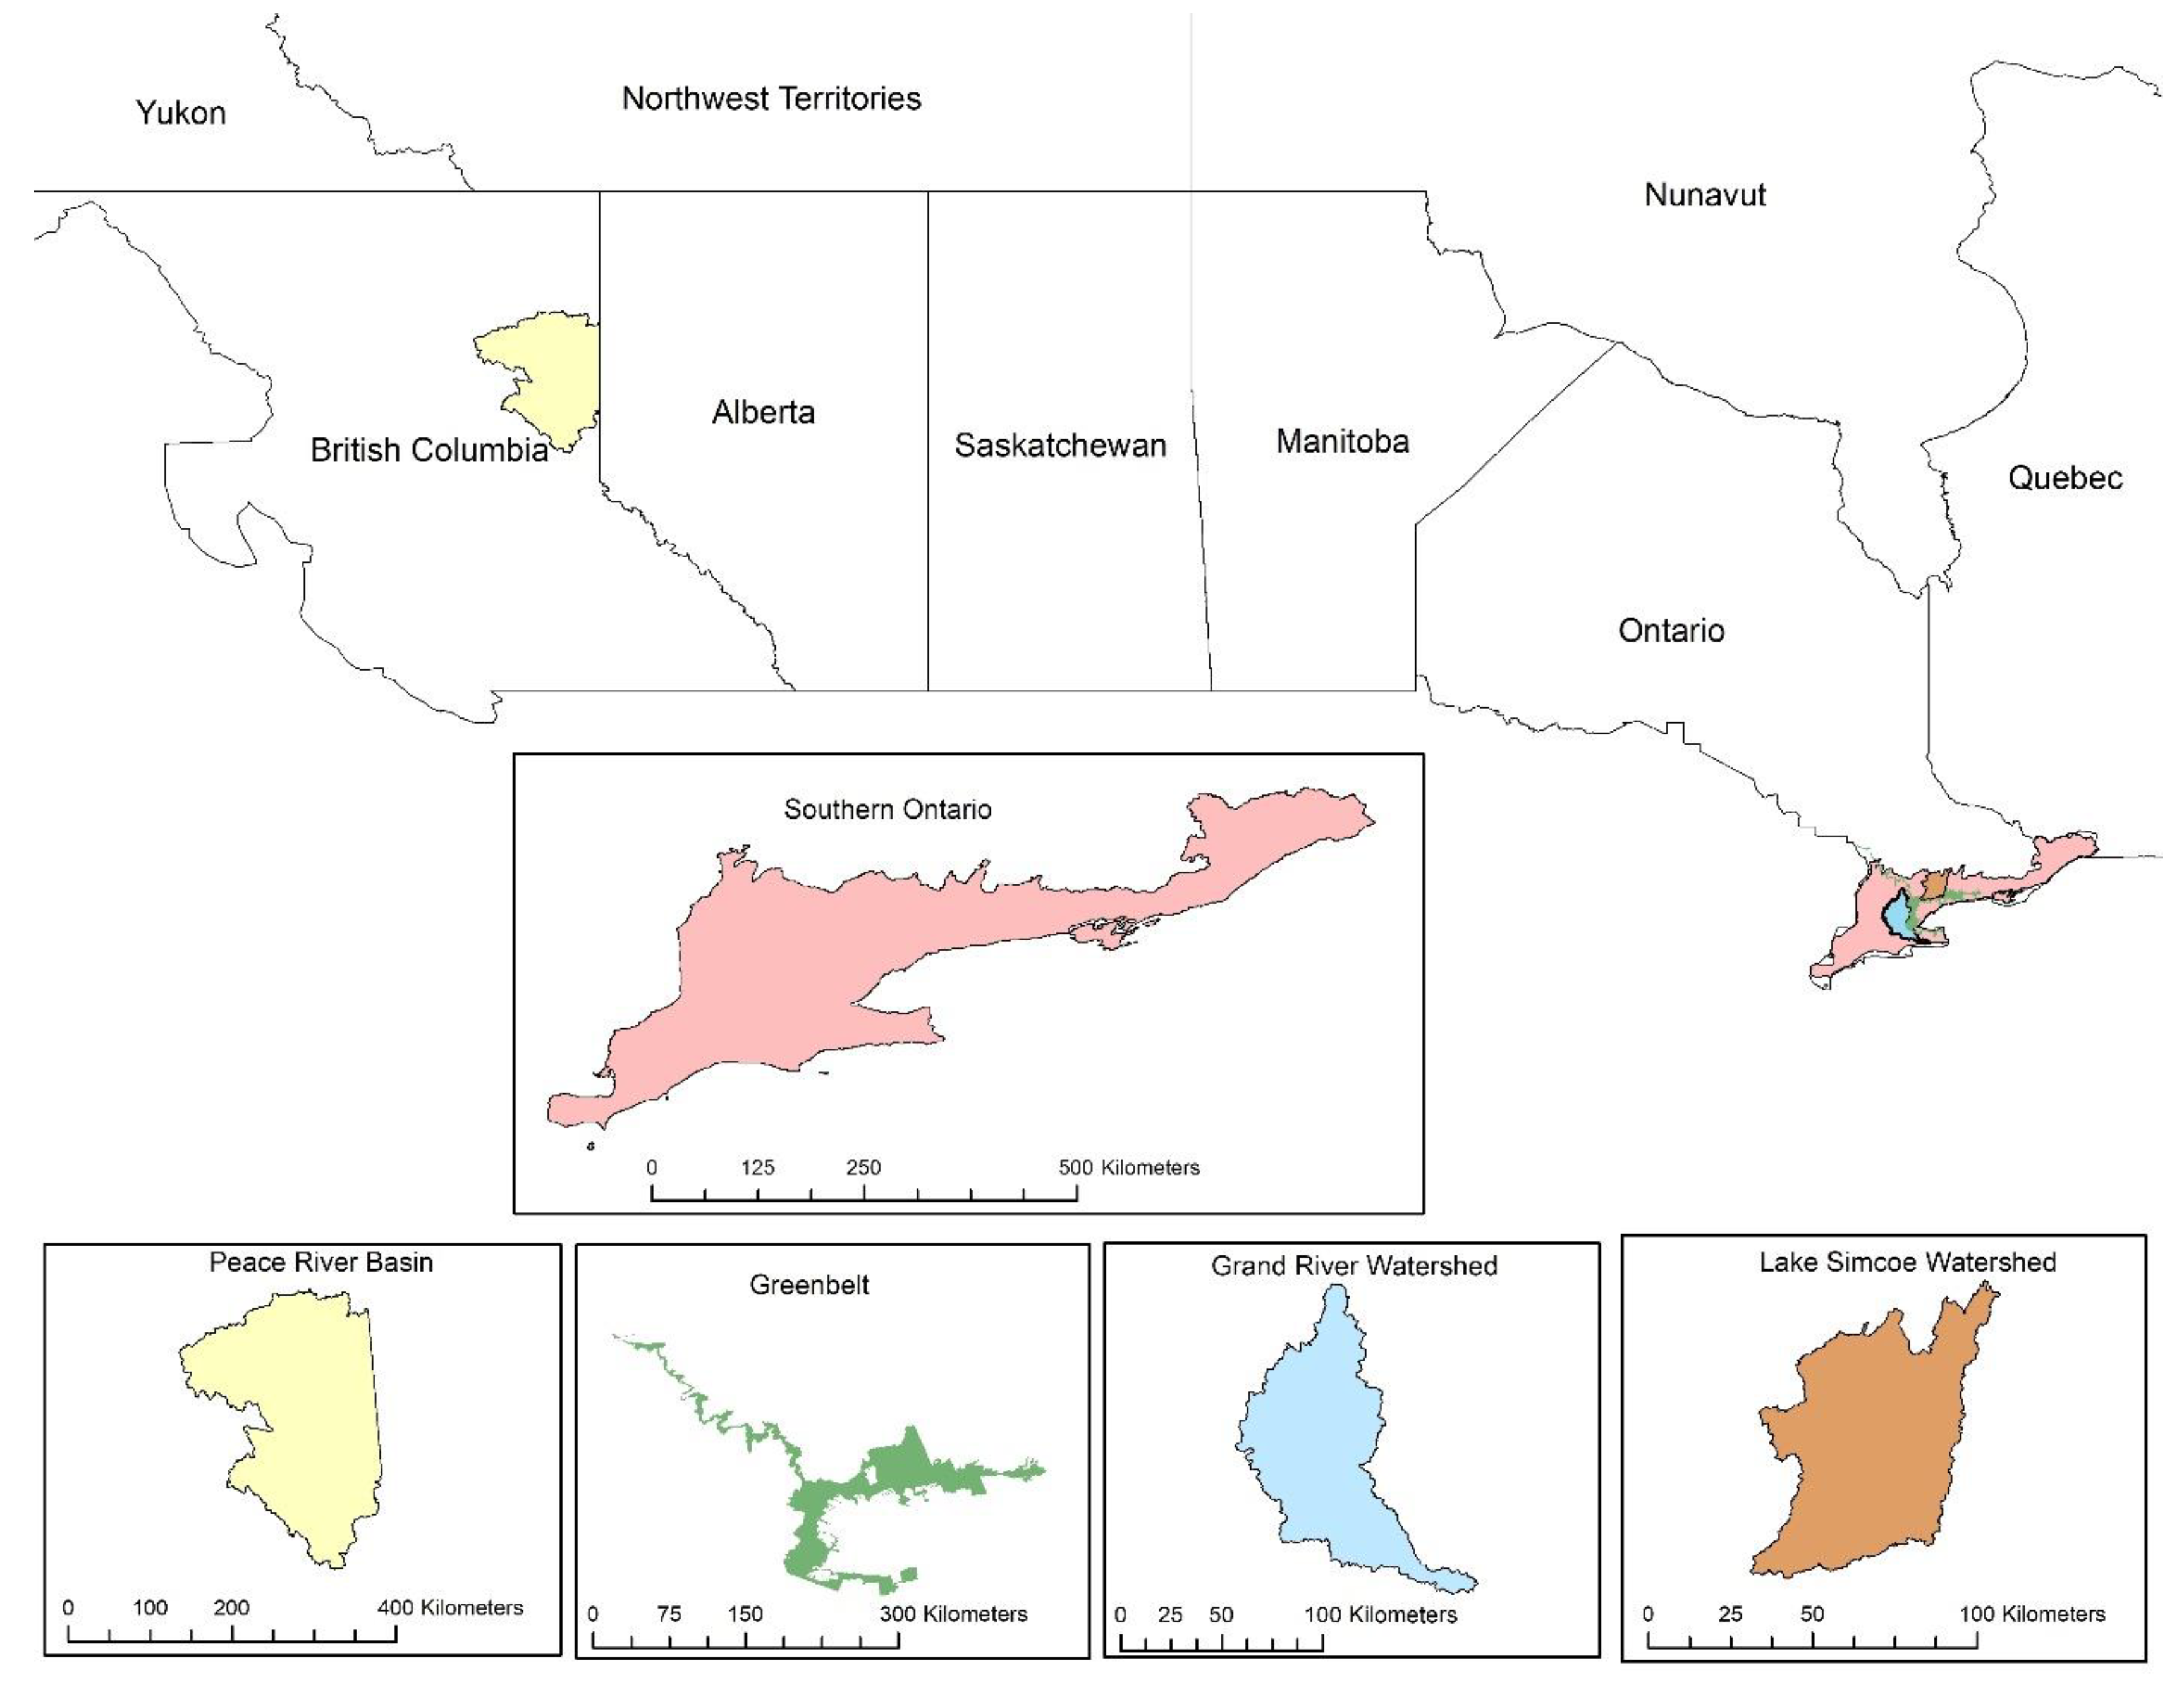
2.3.2. Regional Unit Values

To build a regional dataset of unit values for the three ES, we reviewed existing valuation studies conducted for Canadian watersheds or areas. The studies were screened using web-based search engines/databases (Google scholar and Web of Science), and the Environmental Valuation Reference Inventory (EVRI; https://www.evri.ca/), which was developed by Environment and Climate Change Canada to help analysts interested in assessing environmental services. EVRI allows users to scan and select studies of interest [51]. For the regional unit values dataset in the present study, we only selected valuation studies that entirely or partially used local data to generate unit values and, hence, can be assumed to best reflect the local socioecological context.
Three of the four studies extracted from EVRI are in southern Ontario, that is, the region where the GRW is located. As shown in Figure A1, the studies correspond to the following: (1) The Greenbelt [52], which surrounds the Greater Toronto Area and overlaps with the GRW in places; (2) All of southern Ontario [53], which includes the GRW; (3) The Lake Simcoe watershed [54], a watershed neighboring the GRW. The fourth study area is the portion of the Peace River watershed within British Columbia, Canada, which is located in the boreal climate zone [55]. We included this watershed to align with the ESVD database which aggregates temperate and boreal forests into one category. For each of the three ES and each land cover, we computed the arithmetic average unit value and the standard deviation from the corresponding unit values reported in the four selected studies. In some cases, however, the same unit value was assigned in all four studies, in which case no standard deviation was computed. Henceforth, the average unit values derived from the four studies are referred to as the regional dataset (Table 3).

2.3.3. Global Unit Values

To derive global unit values of the three ES, we adopted the classification framework of the ESVD [56], which considers 10 biomes (or ecosystem complexes), each with 22 ES. The unit values for each biome are based on a review of over 300 local case studies across the world. The 22 ES are further divided into 90 subservices. In total, the database contains more than 1350 individual unit values and 665 standardized values. Unit values are expressed in 2007 international dollars per hectare. Because the ESVD includes a larger number of case studies, recent ES valuation studies tend to prefer it over the earlier global dataset of Costanza et al. (1997) (Table 1). As can be seen in Table 3, the ESVD does not provide unit values for all the land cover categories covered by the local dataset; for example, pastures and forests have no unit values assigned for the nutrient cycling ES.

2.4. Land Cover Resolution

Aggregation of land cover data or unit values, or both, becomes inevitable in some situations depending on the availability of unit values and the resolution of land cover data. To assess the effect of aggregation, we used high- and low-resolution land cover areas for forests and agriculture in the GRW (Figure 1). The forest category was subdivided into three subcategories: deciduous, coniferous, and mixed forest. The agriculture category was similarly subdivided into three subcategories: row crops, small grains, and forage. Aziz (2018) estimated the local unit values of the three ES (water filtration, carbon sequestration, and nutrient cycling) for each land cover subcategory in the GRW [48]. These values are given in Table 4 and were used directly in the high-resolution land cover calculations. In the low-resolution calculations, for each land cover category we imposed the weighted average of the unit values for each land cover subcategory, taking into account the areas of corresponding subcategories.

3. Results

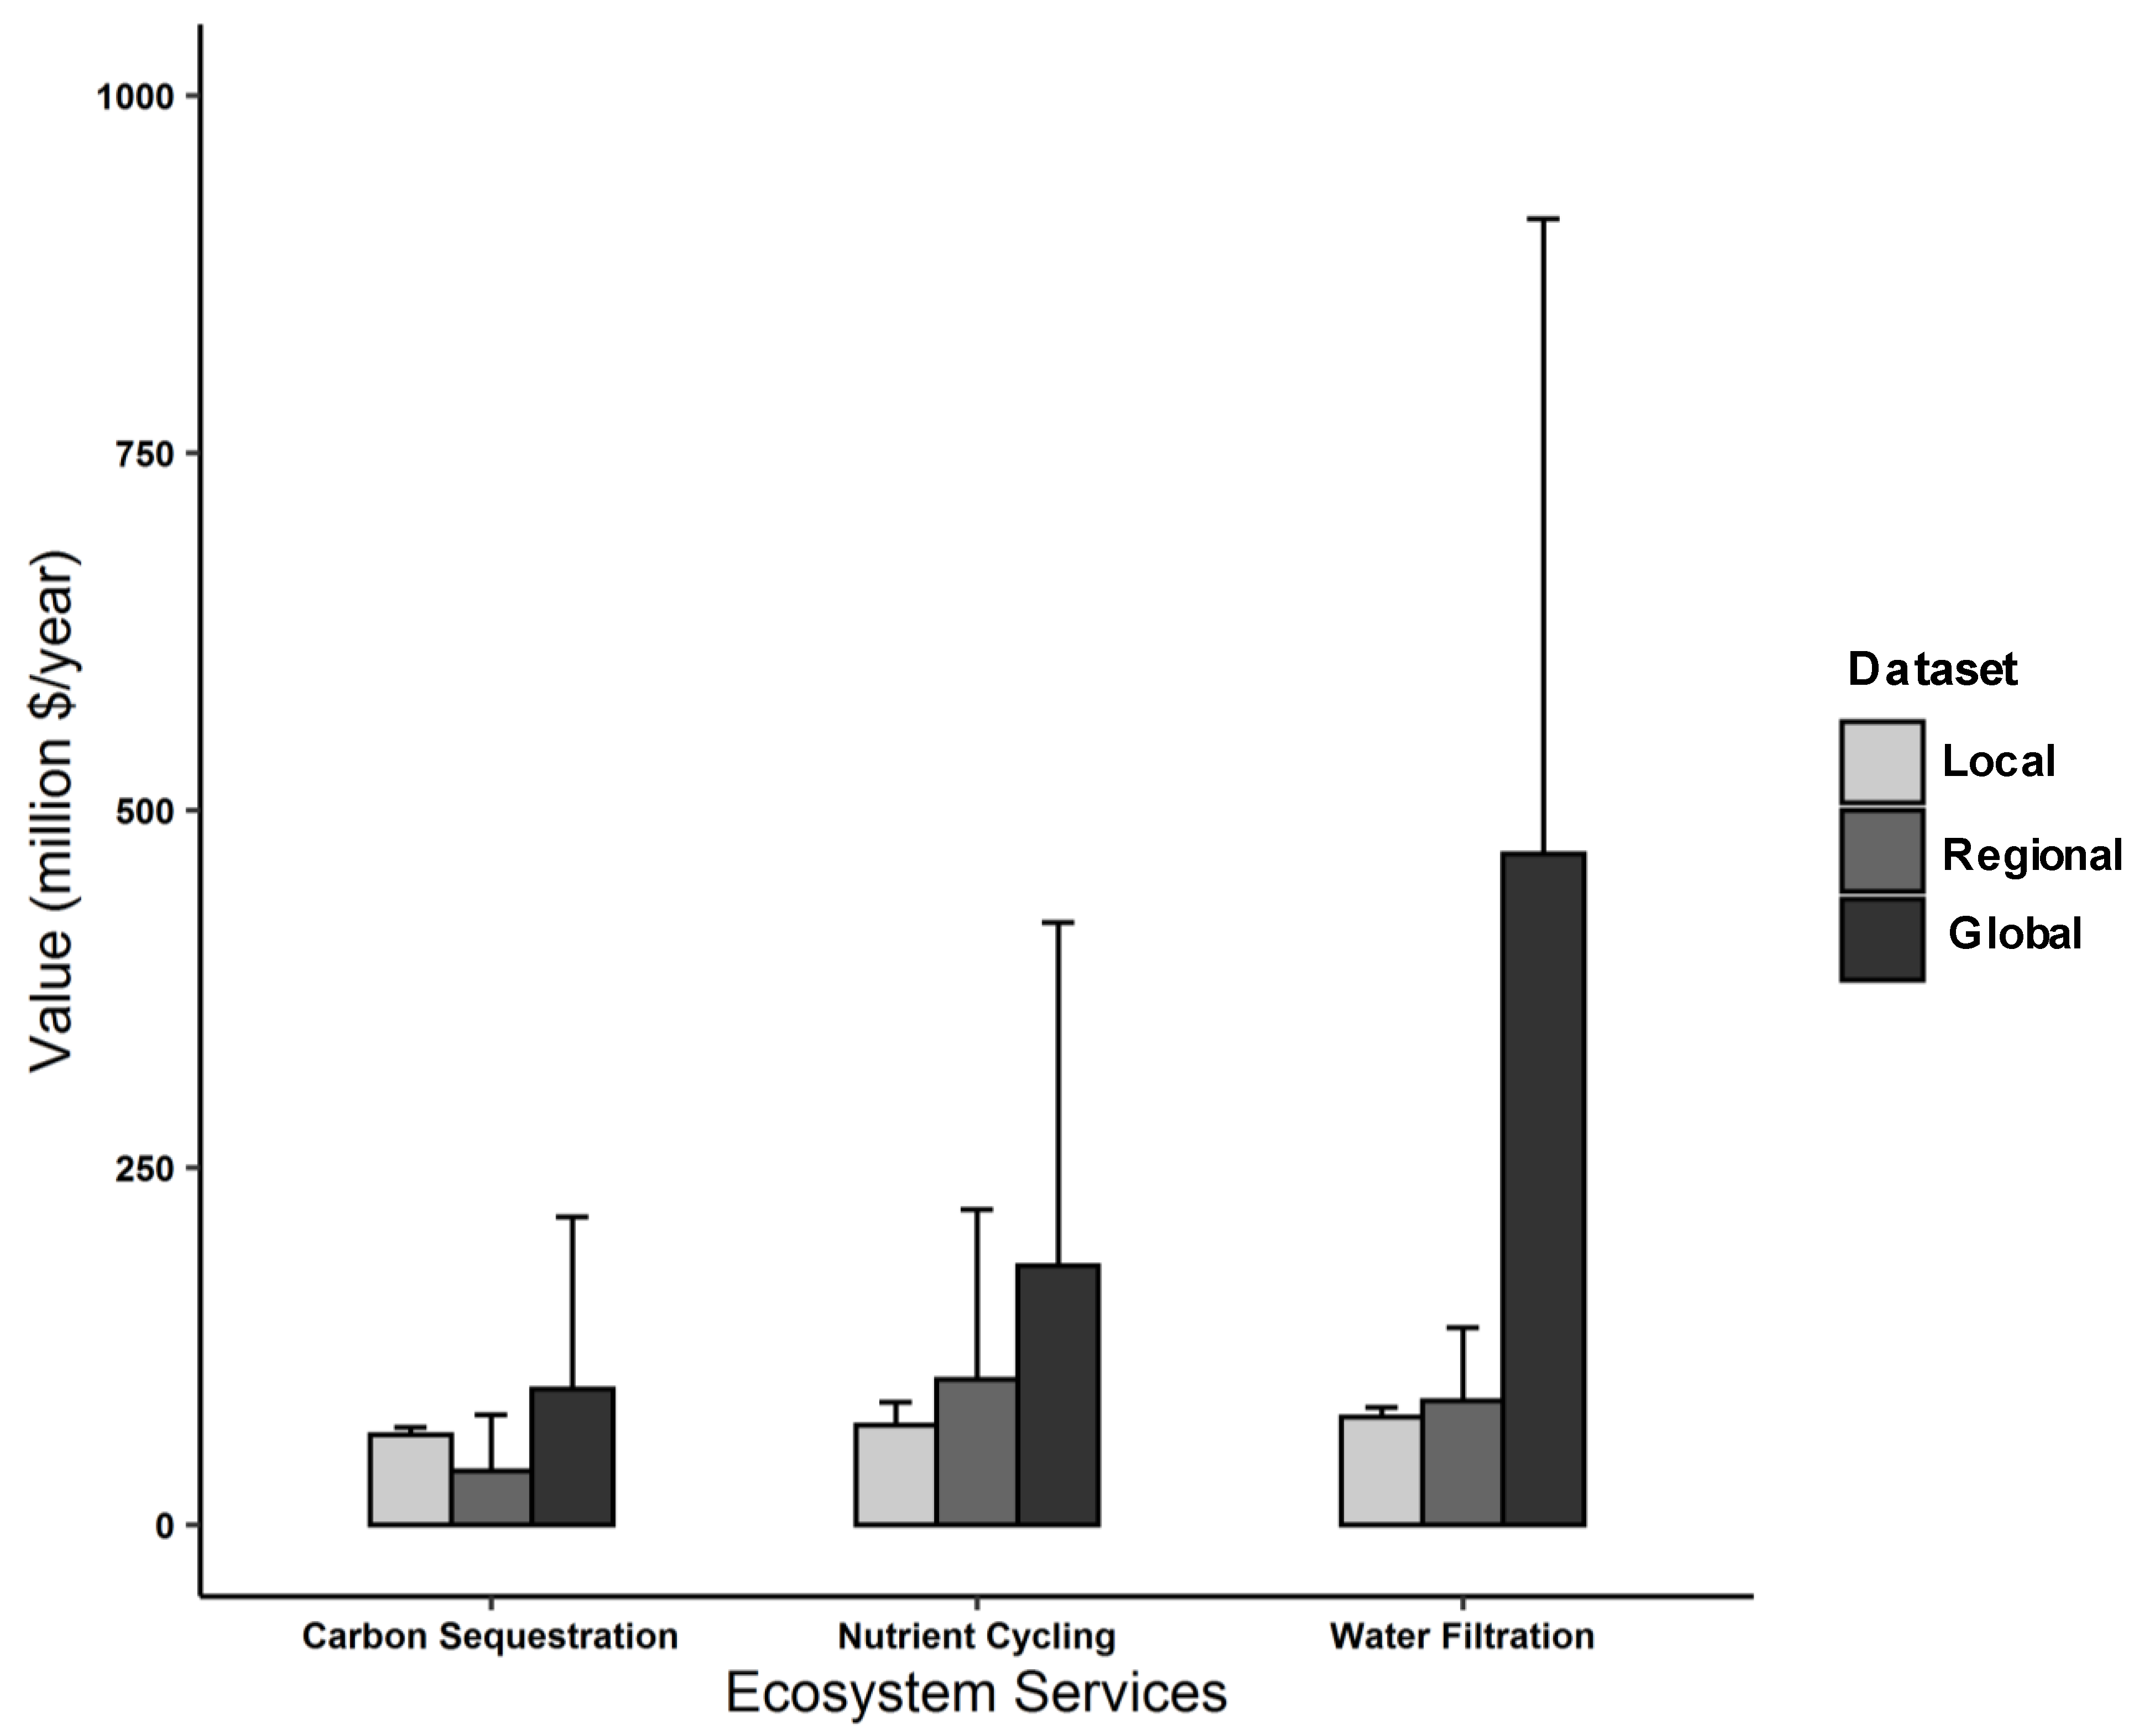
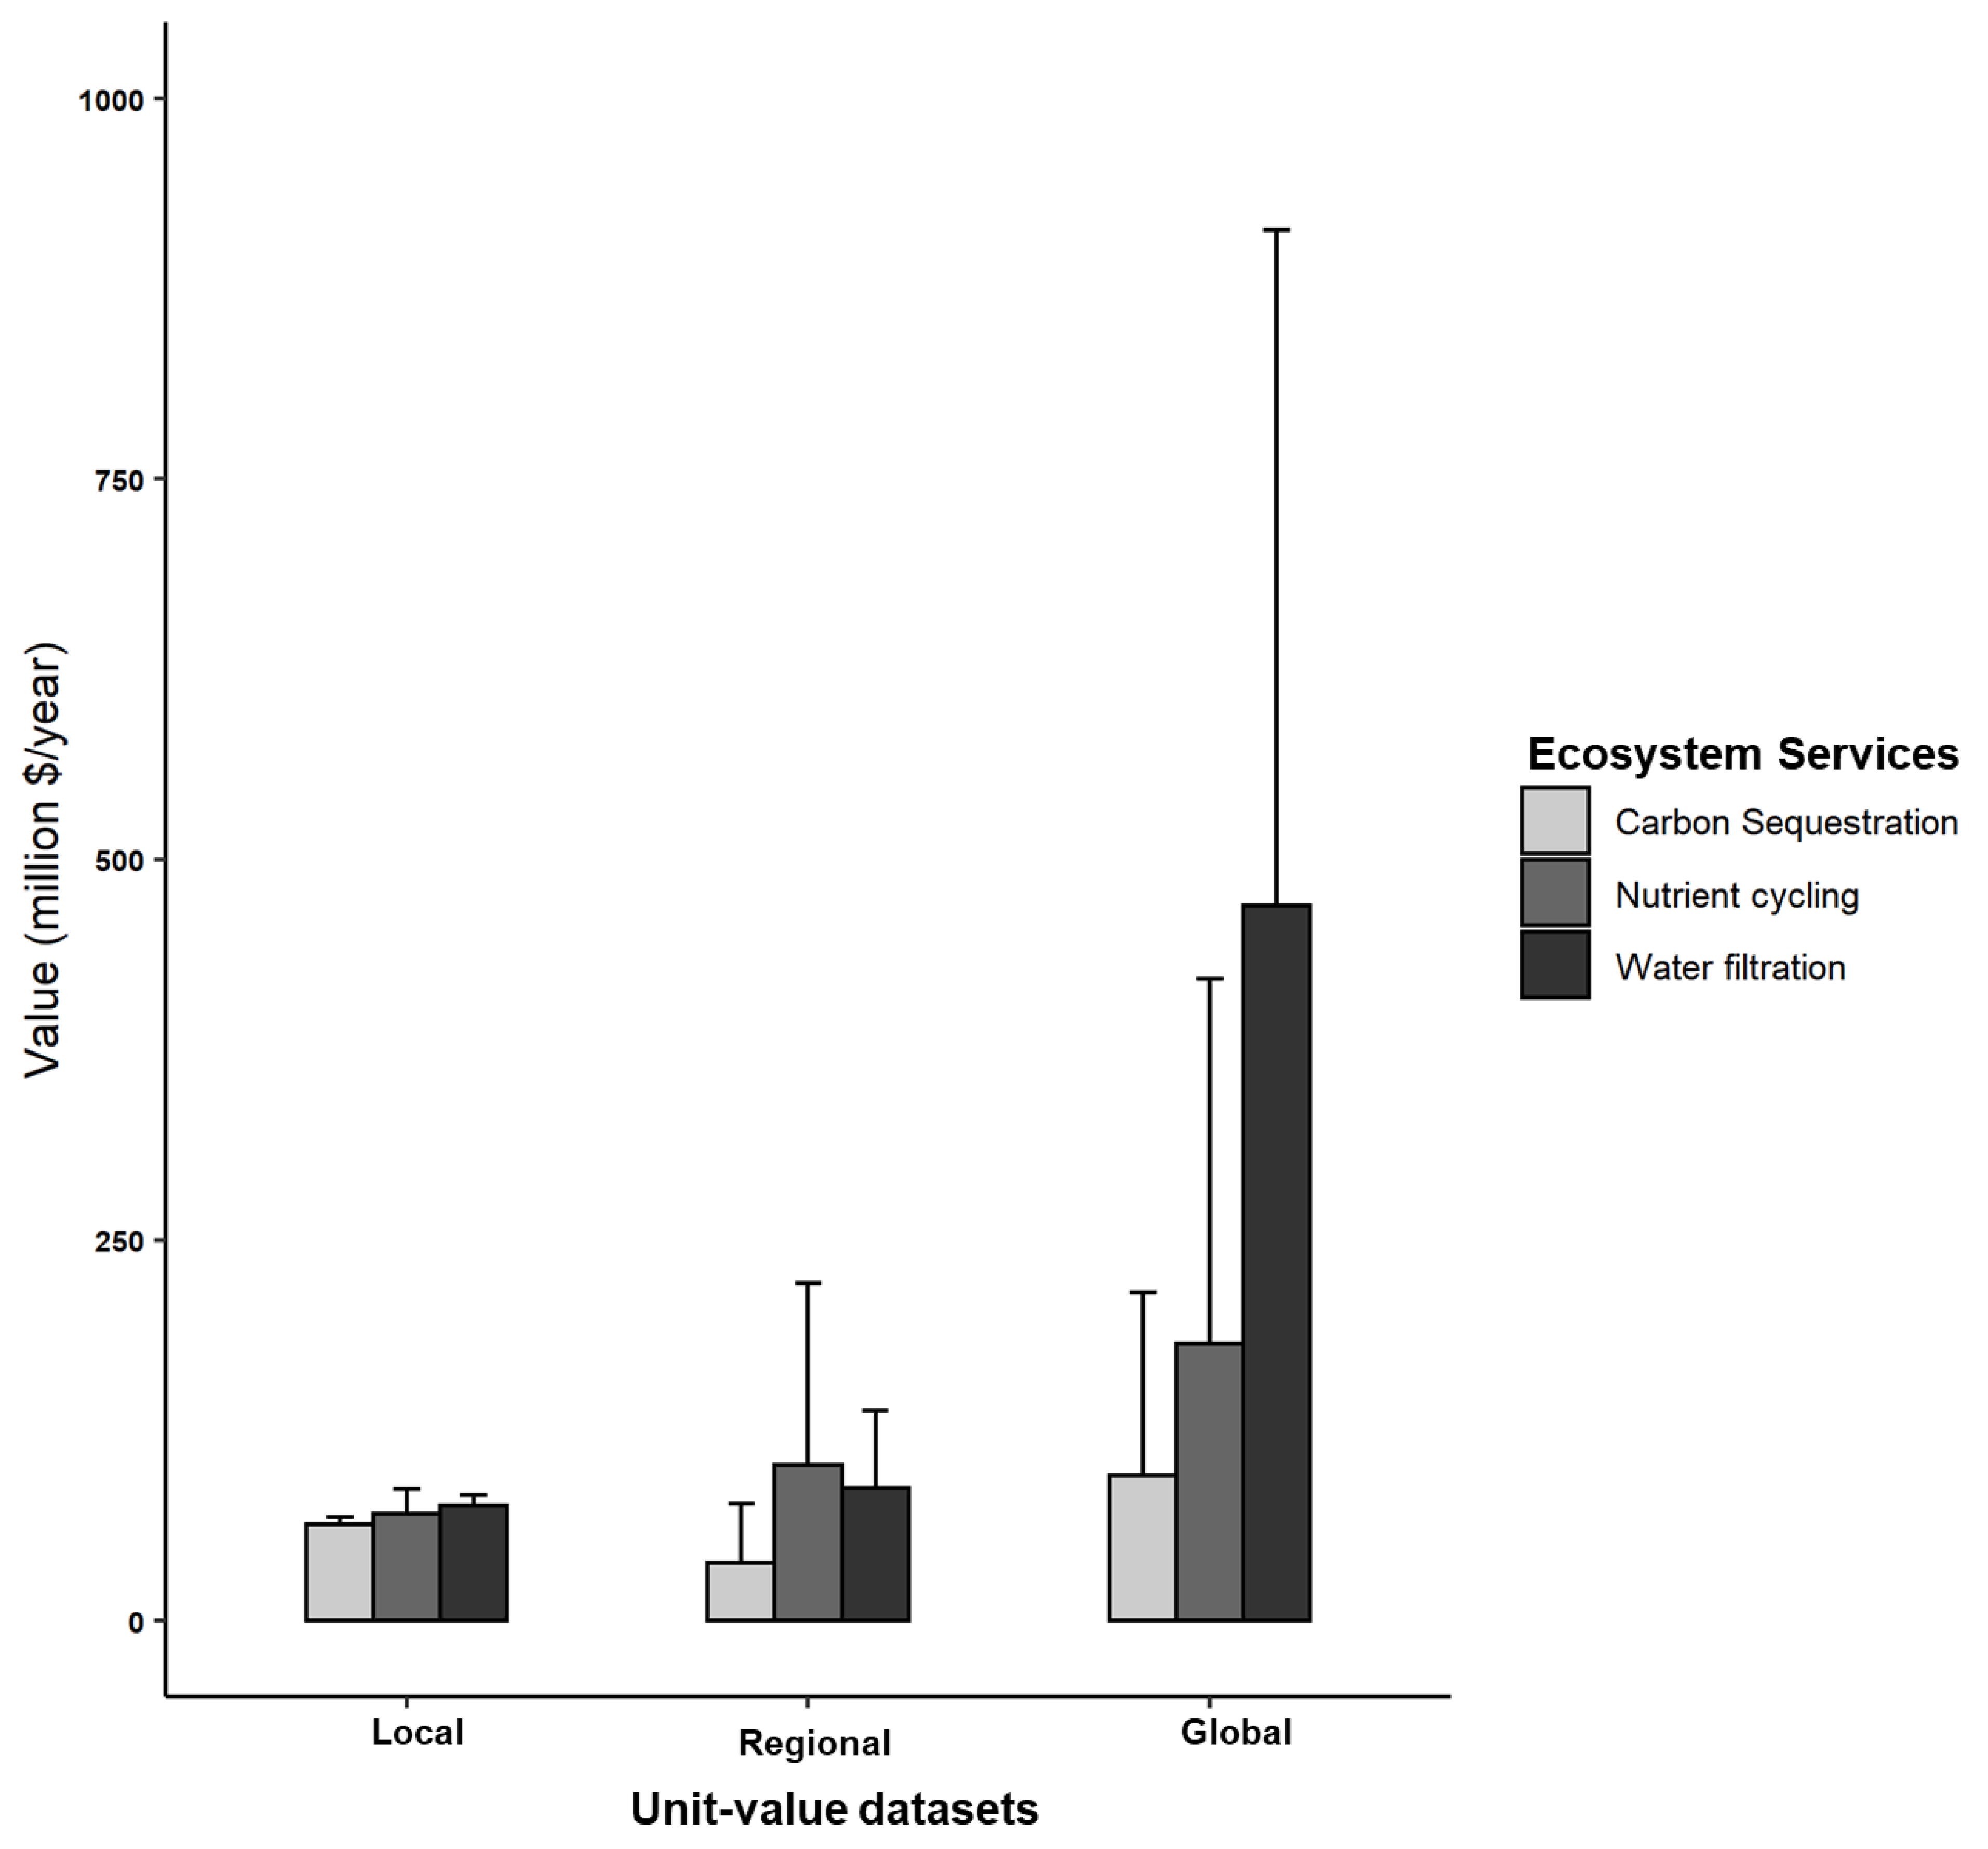
3.1. Whole-Watershed Valuation of the Three Ecosystem Services

Applying the local, regional, and global unit values, the combined annual value for each of the three ES (water filtration, carbon sequestration, and nutrient cycling) across the entire GRW is estimated at 209 ± 18, 227 ± 136 and 746 ± 518 M (CAD 2017), respectively. The single highest value is for the water filtration service estimated using the global unit values (Figure 2). For water filtration and nutrient cycling the values decrease in the order of global > regional > local. For carbon sequestration, the regional unit values yield a lower value than the local unit values. Overall, however, local and regional values are in reasonable agreement, although the regional unit values impart much larger standard deviations to the estimated ES values.
The global unit values result in the highest monetary values for the three ES. The estimate for water filtration is more than five times greater than the local and regional estimates. This is a result of the order-of-magnitude of higher global unit values for water filtration and nutrient cycling by wetlands, compared to the corresponding local and regional unit values (Table 3).

3.2. Impact of Land Cover Resolution

The results of combining the forest and agricultural subcategories into major categories are summarized in Table 5. The forest land cover contributes most to carbon sequestration despite only representing 11% of the area of the watershed, compared to 66% for agricultural land. The importance of forests reflects their very high unit value for carbon sequestration. By aggregating the different forest subcategories, the value of carbon sequestration by forests rises by 7%; that by agriculture drops by 3%. This contrasting fluctuation in values suggests that the impact of aggregation can lead to either an increase or decrease in the value of a service, depending on the areas of land use categories involved and the respective magnitudes of their unit values. Water filtration is the least impacted when aggregating the land cover subcategories because differences in the unit values among the subcategories are small.

4. Discussion

Global datasets of unit values offer a ready solution for estimating the economic value of ES in data-poor regions (Table 1). Prior to the ESVD, many valuation studies used the Costanza et al. (1997) dataset of unit values together with the value transfer method. The dataset was originally assembled to raise awareness about the need to recognize and value ES. In that respect, it has very successfully served its purpose, with the resulting global monetary estimates clearly showing the critical importance of ES to human wellbeing [57]. The Costanza et al. (1997) dataset includes the values of 17 ES in 16 biomes synthesized from more than 100 studies that, in turn, were based on a wide variety of methods and underlying assumptions, with only a few unit values derived from primary data.
Costanza et al. (2014) re-estimated the total monetary value of global ES based on the 2012 ESVD unit values. For the same land area distribution of terrestrial biomes this yielded an approximately 6 times higher value than that estimated based on the 1997 dataset (both converted to 2007 international dollars). There are numerous reasons for the differences in unit values between the two global datasets, including the availability of new data, evolving functionality of ecosystems, and changes in human or built capital [57]. The unit values for wetlands (swamps/floodplains) and open water (lakes/river) showed minimal differences, which can be explained by the fact that these ecosystems were already well-studied when the Costanza et al. (1997) dataset was established [57]. It should be noted, however, that the Costanza et al. (1997) estimates have been criticized for overestimating the unit values for wetlands and underestimating those for croplands [36]. Nonetheless, because it is a more comprehensive database, we use the ESVD as the reference global dataset of unit values.
As expected, the global unit values are also characterized by much broader ranges compared to those in the regional and local datasets. According to de Groot et al. (2012), the following five reasons explain the high variability of the unit values in the ESVD: (1) The inclusion of a very large number of valuation studies from around the world; (2) The variety of valuation methods used; (3) The variety of subservices considered; (4) The possibility of double counting; (5) The variability of unit values across geographies, as well as over time [56]. Other factors may interfere with the transferability of unit values across geographies, such as differences in income and income inequality [58].
In the study here, we compared the values of three nonmarket ES obtained by transferring global unit values to those based on unit values derived from local biophysical and cost data in a moderate-size watershed (GRW, ~7000 km2) using the replacement cost method [59]. The replacement cost method estimates the cost of replacing an asset that has been damaged or lost. This cost is then used as a proxy or indicator of the value lost. It is important to note that the replacement cost method does not directly account for the demand for a particular ES and, in accordance with economic theory, may not yield accurate welfare measures, such as Marshallian or Hicksian welfare change measures. Consequently, the replacement cost method only captures a portion of the broader economic value of an ES. Nonetheless, despite these limitations, this method can still serve as a heuristic tool in appraisal processes that can be used by decision makers [60]. As representative ES where the replacement cost method can be readily applied, we considered water filtration, carbon sequestration, and nutrient cycling. In principle, these ES can be replaced or compensated by water treatment, carbon pricing, and fertilizer applications [48,61]. The unit values can, therefore, be derived from contemporaneous local market prices and costs; that is, market values serve as proxies for the valuation of the ES. These local unit values help overcome the assumption that the supply of ES by a particular land cover is constant from one location to another [62]. Overall, more efforts should go toward generating locally relevant unit values. Although this requires more work than simply transferring unit values from a global dataset, it will confer credibility to the estimated ES values and help restore confidence in the practicality of ES valuation.
Our results show that the value estimates are markedly higher for the nutrient cycling and water filtration ES when applying the global ESVD than local unit values (Figure 2). The values from the regional dataset agree much more closely, which is not surprising given that the four case studies included in the regional dataset are in Canada, with three of them in the same region as the GRW. In addition, these studies and the associated estimations of the unit values were conducted over a relatively short time span (six years). That is, the general agreement between the local and regional values reflects the closeness in biophysical and socioeconomic characteristics, as well as the current state of knowledge in ES valuation, underlying the two datasets [63]. The standard deviations of the values estimated using the regional dataset, however, are significantly higher than those of the local dataset.
The GRW is dominated by the human-managed ecosystems that cover a growing fraction of the continents [64]. Global datasets of unit values, such as the ESVD, tend to focus on natural ecosystems and their services, however. In agriculture-dominated watersheds, the transfer of unit values from global datasets may, therefore, be unreliable because it fails to capture the relevant local environmental and socioeconomic context [65]. For instance, for the three ES considered here, the ESVD does not valuate ES provided by agroecosystems but assigns very high unit values to other land covers, most notably to wetlands (Table 3). The high ESVD wetland unit values are one of the main reasons for the large deviations between the global and local value estimates, even though wetlands make up less than 10% of the GRW area (Table 2). The local unit value for water filtration by wetlands was derived using local water treatment replacement cost estimates, while many unit values in the literature rely on contingent valuation methods. The latter methods typically valuate a broader set of welfare benefits and preferences associated with clean water and, therefore, tend to yield higher unit values.
The limitations of ES valuation based on the application of unit values should be clearly recognized and, where possible, alleviated using complementary methods. For example, regarding economies of scale, the unit values of ES may vary depending on their supply and spatial extent. One possible approach is to introduce scaling factors that account for such variations. Moreover, the unit value approach may, in itself, not capture the interconnectedness of ecosystems, so complementary techniques, such as spatial modeling and network analysis, can help in accounting for complex ecological relationships and dependencies. Further adjustments and re-evaluations can be made to reflect market fluctuations, inflation, or other economic factors. Additionally, economic scarcity can be incorporated into unit values through appropriate discounting or pricing mechanisms [66]. Thus, by integrating multiple approaches and considerations, more comprehensive and accurate valuations could be achieved using the unit value transfer method.
Land cover resolution can substantially alter estimated values of ESs [67]. Konarska et al. (2002), for example, reported an increase of 200% of the total value of ESs in the United States when switching from a 1 km satellite land cover resolution to a 30 m one [68]. Such a dramatic effect of land cover resolution is not seen for the ESs in the GRW (Table 5), although the lower (coarser) resolution decreases the values of carbon sequestration and nutrient cycling by forests and agricultural landscapes by 14–17%. The much larger effect seen by Konarska et al. (2002) is due to the detection of ES-rich land covers (e.g., wetlands) in the 30 m resolution satellite data that were not recognized in the 1 km resolution data. By contrast, in our study, the total spatial coverages of forest and agricultural lands remain constant at the high and low resolution; the only factor influencing the ES values is the aggregation of subcategories into the corresponding major category. The observed changes, therefore, reflect the variability in weighted average unit values of subcategories within the major land cover categories. In other words, at the regional to local scales, increasing land cover resolution can only improve ES valuation if it can be paired with a reliable assignment of unit values to newly emerging land cover subcategories.
When valuating ESs, it is crucial to identify the methods and underlying assumptions that are used. Although the use of global datasets may be inevitable in regions with no primary or local unit values, the caveats of transferring global unit values to a specific watershed or area should be clearly delineated to avoid undermining the credibility of the estimated ES values. This is especially important when ES valuation is included into decision-making processes, as these should be based on reliable and locally relevant monetary values. In that respect, the transfer of global unit values to areas where land cover, climate, biodiversity, and socioeconomic conditions deviate significantly from their global average counterparts may be risky, and potentially counterproductive. To enhance the relevance of ES valuation for policy, establishing, documenting, and regularly updating national and regional datasets of ES unit values would seem to be the most logical step forward.

5. Conclusions

The value transfer method offers a simple method to monetize ES, especially when limited information and quantitative data are available on the local supporting ecosystem functions and economic context. As shown here, however, the transfer of unit values from global databases such as the ESVD can introduce a high degree of uncertainty in ES values. For the GRW, the large differences in the values of water filtration and nutrient cycling estimated using global versus regional and local unit values reflect both the specific biophysical characteristics of the watershed, largely dominated by agricultural land cover, and the methods underpinning the derivation of the unit values (e.g., replacement cost and contingent valuation methods). In the case study presented here, the comparative analysis underpins the credibility of the local unit values for the three ES considered, precisely because they are valuated in one of the most densely populated and agriculturally intensive watersheds in Canada. By contrast, the very large, often by orders of magnitude, ranges in valuation estimates that are obtained using global unit values, such as the ESVD, limits their practical acceptance and even undermines their uptake in decision-making processes. The valuation of broad land cover and land cover categories (e.g., forest, wetlands, and agriculture) represents a further source of uncertainty that brings into question the relevance of the estimated ES values. Research should, therefore, focus on refining ES unit values to match the increasingly high-resolution earth-surface mapping capabilities. While valuating ES has shown potential to inform land planning, environmental policy, and infrastructure investments, further advances will need to clearly identify, quantify, and reduce the sources of uncertainty in ES unit values.

Author Contributions

Conceptualization, T.A. and P.V.C.; methodology, T.A.; software, T.A.; formal analysis, T.A.; investigation, T.A.; data curation, T.A. and, A.-D.N.; writing—original draft preparation, T.A.; writing—review and editing, P.V.C. and A.-D.N.; visualization, T.A.; supervision, A.-D.N. and P.V.C.; project administration, P.V.C.; funding acquisition, P.V.C. All authors have read and agreed to the published version of the manuscript.

Funding

This research was supported by the Canada Excellence Research Chair program and the Canada First Research Excellence Fund (CFREF) through the Global Water Futures (GWF) project, and the APC was also funded by the CFREF.

Data Availability Statement

Not applicable.

Conflicts of Interest

The authors declare no conflict of interest.

Appendix A

Regional Values

Four studies on the valuation of ES conducted across Canada (Figure A1) are used to establish the regional dataset. The values of three ES (carbon sequestration, water purification, and nutrient cycling) are extracted from the regional dataset (Table A1). Some of the studies did not assign any value to these ES and a few assigned zero values. If there is only one value available for an ecosystem service, we refer to that as the best estimate.
Figure A1. The location of areas/watersheds across Canada used to derive regional unit-value dataset of ecosystem services (top). The areas are magnified for their shape and size in the panels below.
Sustainability 15 11024 g0a1
Figure A2. Comparison of the total values of three ecosystem services in the Grand River watershed based on three datasets (i.e., local, regional, and global). Error bars show standard deviations. All values are in CAD 2017.
Sustainability 15 11024 g0a2
Table A1. Unit values of ecosystem services for major ecosystems taken from regional studies.
Ecosystem ServicesProviding Land CoversValue ($/Hectare/Year)
LowBestHigh
Carbon SequestrationForest 48 a815 b
Pasture 35 a
Wetlands 16 a
Open water 16 a
Cropland0 a-
Fallow fields 36 a
Water PurificationForest258 c583 a
Pasture0 c
Wetlands258 c583 a1701 b
Open Water258 c
Cropland0 c
Fallow fields
Nutrient cyclingForest0 c 596 e
Pasture/sparse forest29 c 28.5 e
Wetlands0 c275 d3225 e
Open water0 c 63 e
Cropland0 c -
Fallow fields 30 a
a [52];b [45]; c [54]; d [55]; e [53].
Table A2. Different features of the selected studies for regional database.
ParametersStudy AreaStudies Used for Regional Database
(Grand River)Southern OntarioGreenbeltLake SimcoePeace River basin
Area (ha)679,82012,449,039760,420330,7415,611,799
Dominant land useAgricultureAgricultureAgricultureAgricultureForest
Population density
(people/ha)
1.500.901–3.65 *1.200.01
* population density at inner and outer rings of the greenbelt.
Table A3. Total values of each of the three ecosystem services in the Grand River watershed using unit values from three datasets.
Ecosystem ServicesTotal Value Using Three Datasets
LocalRegionalGlobal
Carbon Sequestration63.23 ± 5.0738.02 ± 39.0195.56 ± 120.03
Nutrient Cycling70.09 ± 16.23102.01 ± 119.62182.79 ± 239.16
Water Filtration75.56 ± 6.9587.21 ± 50.99469.54 ± 444.24

References

  1. Millenium Ecosystem Assessment (MEA). Ecosystems and Human Well-Being: Synthesis; Island Press: Washington, DC, USA, 2005. [Google Scholar]
  2. Wu, K.; Ye, X.; Qi, Z.; Zhang, H. Impacts of Land Use/Land Cover Change and Socioeconomic Development on Regional Ecosystem Services: The Case of Fast-Growing Hangzhou Metropolitan Area, China. Cities 2019, 31, 276–284. [Google Scholar] [CrossRef]
  3. Walsh, J.R.; Carpenter, S.R.; Vander, M.J. Invasive Species Triggers a Massive Loss of Ecosystem Services through a Trophic Cascade. Proc. Natl. Acad. Sci. USA 2016, 113, 4081–4085. [Google Scholar] [CrossRef]
  4. Junquera, V.; Meyfroidt, P.; Sun, Z.; Latthachack, P.; Grêt-regamey, A. From Global Drivers to Local Land-Use Change: Understanding the Northern Laos Rubber Boom. Environ. Sci. Policy 2020, 109, 103–115. [Google Scholar] [CrossRef]
  5. Hassan, Q.K.; Ejiagha, I.R.; Ahmed, M.R.; Gupta, A.; Rangelova, E.; Dewan, A. Remote sensing of local warming trend in Alberta, Canada during 2001–2020, and its relationship with large-scale atmospheric circulations. Remote Sens. 2021, 13, 3441. [Google Scholar] [CrossRef]
  6. Hasan, M.E.; Zhang, L.; Mahmood, R. Spatiotemporal Pattern of Forest Degradation and Loss of Ecosystem Function Associated with Rohingya Influx: A Geospatial Approach. Land Degrad. Dev. 2020, 32, 3666–3683. [Google Scholar] [CrossRef]
  7. Dewan, A.; Kiselev, G.; Botje, D. Diurnal and Seasonal Trends and Associated Determinants of Surface Urban Heat Islands in Large Bangladesh Cities. Appl. Geogr. 2021, 135, 102533. [Google Scholar] [CrossRef]
  8. Costanza, R.; d’Arge, R.; de Groot, R.; Farber, S.; Grasso, M.; Hannon, B.; Limburg, K.; Naeem, S.; O’Neill, R.V.; Paruelo, J.; et al. The Value of the World’s Ecosystem Services and Natural Capital. Nature 1997, 387, 253–260. [Google Scholar] [CrossRef]
  9. Polasky, S.; Tallis, H.; Reyers, B. Setting the Bar: Standards for Ecosystem Services. Proc. Natl. Acad. Sci. USA 2015, 112, 7356–7361. [Google Scholar] [CrossRef] [PubMed]
  10. Small, N.; Munday, M.; Durance, I. The Challenge of Valuing Ecosystem Services That Have No Material Benefits. Glob. Environ. Chang. 2017, 44, 57–67. [Google Scholar] [CrossRef]
  11. Rusche, K.; Wilker, J.; Phillip, B.; Benning, A. Economic Valuation Methods: Overview of Existing Economic Valuation Methods to Capture Ecosystem Service Benefits of Quarry Restorations. Restore-Restoring Miner. Sites Biodivers. People Econ. North West Eur. 2013. [Google Scholar]
  12. Kreuter, U.P.; Harris, H.G.; Matlock, M.D.; Lacey, R.E. Change in Ecosystem Service Values in the San Antonio Area, Texas. Ecol. Econ. 2001, 39, 333–346. [Google Scholar] [CrossRef]
  13. Zhao, B.; Kreuter, U.; Li, B.; Ma, Z.; Chen, J.; Nakagoshi, N. An Ecosystem Service Value Assessment of Land-Use Change on Chongming Island, China. Land Use Policy 2004, 21, 139–148. [Google Scholar] [CrossRef]
  14. Wang, Z.; Zhang, B.; Zhang, S.; Li, X.; Liu, D.; Song, K.; Li, J.; Li, F.; Duan, H. Changes of Land Use and of Ecosystem Service Values in Sanjiang Plain, Northeast China. Environ. Monit. Assess. 2006, 112, 69–91. [Google Scholar] [CrossRef]
  15. Tong, C.; Feagin, R.A.; Lu, J.; Zhang, X.; Zhu, X.; Wang, W.; He, W. Ecosystem Service Values and Restoration in the Urban Sanyang Wetland of Wenzhou, China. Ecol. Eng. 2007, 29, 249–258. [Google Scholar] [CrossRef]
  16. Yun-Guo, L.; Xiao-Xia, Z.; Li, X.; Shi, J.; Wang, L.; Hu, S.; Su, S. Impacts of Land-Use Change on Ecosystem Service Value in Changsha, China. Huagong Xuebao/CIESC J. 2009, 60, 444–449. [Google Scholar]
  17. Tianhong, L.; Wenkai, L.; Zhenghan, Q. Variations in Ecosystem Service Value in Response to Land Use Changes in Shenzhen. Ecol. Econ. 2010, 69, 1427–1435. [Google Scholar] [CrossRef]
  18. Kubiszewski, I.; Costanza, R.; Dorji, L.; Thoennes, P.; Tshering, K. An Initial Estimate of the Value of Ecosystem Services in Bhutan. Ecosyst. Serv. 2013, 3, e11–e21. [Google Scholar] [CrossRef]
  19. Frélichová, J.; Vačkář, D.; Pártl, A.; Loučková, B.; Harmáčková, Z.V.; Lorencová, E. Integrated Assessment of Ecosystem Services in the Czech Republic. Ecosyst. Serv. 2014, 8, 110–117. [Google Scholar] [CrossRef]
  20. Brooks, E.G.E.; Smith, K.G.; Holland, R.A.; Poppy, G.M.; Eigenbrod, F. Effects of Methodology and Stakeholder Disaggregation on Ecosystem Service Valuation. Ecol. Soc. 2014, 19, 18. [Google Scholar] [CrossRef] [Green Version]
  21. Parrott, L.; Kyle, C. The Value of Natural Capital in the Okanagan; Okanagan Institute for Biodiversity, Resilience, and Ecosystem Services (BRAES): Kelowna, BC, Canada, 2014. [Google Scholar]
  22. Lopes, L.F.G.; dos Santos Bento, J.M.R.; Arede Correia Cristovão, A.F.; Baptista, F.O. Exploring the Effect of Land Use on Ecosystem Services: The Distributive Issues. Land Use Policy 2015, 45, 141–149. [Google Scholar] [CrossRef] [Green Version]
  23. Li, G.; Fang, C.; Wang, S. Exploring Spatiotemporal Changes in Ecosystem-Service Values and Hotspots in China. Sci. Total Environ. 2016, 545–546, 609–620. [Google Scholar] [CrossRef]
  24. Tolessa, T.; Senbeta, F.; Abebe, T. Land Use/Land Cover Analysis and Ecosystem Services Valuation in the Central Highlands of Ethiopia. For. Trees Livelihoods 2017, 26, 111–123. [Google Scholar] [CrossRef]
  25. Yuan, M.; Lo, S.; Yang, C. Integrating Ecosystem Services in Terrestrial Conservation Planning. Environ. Sci. Pollut. Res. 2017, 24, 12144–12154. [Google Scholar] [CrossRef]
  26. Badamfirooz, J.; Mousazadeh, R.; Sarkheil, H. A Proposed Framework for Economic Valuation and Assessment of Damages Cost to National Wetlands Ecosystem Services Using the Benefit-Transfer Approach. Environ. Chall. 2021, 5, 100303. [Google Scholar] [CrossRef]
  27. Cook, D.; Davíðsd, B. A Preliminary Estimate of the Economic Value of Iceland’s Terrestrial Ecosystem Services and Opportunities for Future Research. Sustain. Futures 2022, 4, 100076. [Google Scholar] [CrossRef]
  28. Aziz, T. Changes in Land Use and Ecosystem Services Values in Pakistan, 1950–2050. Environ. Dev. 2021, 37, 100576. [Google Scholar] [CrossRef]
  29. Pascual, U.; Muradian, R.; Brander, L.; Gómez-baggethun, E.; Martín-lópez, B.; Verma, M.; Armsworth, P.; Christie, M.; Cornelissen, H.; Eppink, F.; et al. The Economics of Valuing Ecosystem Services and Biodiversity; Taylor and Francis: Abingdon, UK, 2010. [Google Scholar] [CrossRef]
  30. Lee, J.F.J.; Springborn, M.; Handy, S.L.; Quinn, J.F.; Shilling, F.M. Approach for Economic Valuation of Environmental Conditions and Impacts. Final. Valuat. Rep. UCD 2010, 123. [Google Scholar]
  31. Costanza, R.; Wilson, A.; Troy, A.; Voinov, A.; Liu, S. The Value of New Jersey’s Ecosystem Services and Natural Capital; Portland State University: Portland, OR, USA, 2006; Volume 7. [Google Scholar]
  32. Kennedy, E. Comparing Valuation Methods for Ecosystem Services in Amstelland Applying Ecosystem Service Valuation; Vrije Universiteit Amsterdam: Amsterdam, The Netherlands, 2014. [Google Scholar]
  33. de Groot, R.; Alkemade, R.; Braat, L.; Hein, L.; Willemen, L. Challenges in Integrating the Concept of Ecosystem Services and Values in Landscape Planning, Management and Decision Making. Ecol. Complex. 2010, 7, 260–272. [Google Scholar] [CrossRef]
  34. Förster, J.; Barkmann, J.; Fricke, R.; Hotes, S.; Kleyer, M.; Kobbe, S.; Kübler, D.; Rumbaur, C.; Siegmund-Schultze, M.; Seppelt, R.; et al. Assessing Ecosystem Services for Informing Land-Use Decisions: A Problem-Oriented Approach. Ecol. Soc. 2015, 20. [Google Scholar] [CrossRef] [Green Version]
  35. Pandeya, B.; Buytaert, W.; Zulkafli, Z.; Karpouzoglou, T.; Mao, F.; Hannah, D.M. A Comparative Analysis of Ecosystem Services Valuation Approaches for Application at the Local Scale and in Data Scarce Regions. Ecosyst. Serv. 2016, 22, 250–259. [Google Scholar] [CrossRef] [Green Version]
  36. Wang, Y.; Gao, J.; Wang, J.; Qiu, J. Value Assessment of Ecosystem Services in Nature Reserves in Ningxia, China: A Response to Ecological Restoration. PLoS ONE 2014, 9, e89174. [Google Scholar] [CrossRef] [PubMed]
  37. Vitousek, P.M.; Mooney, H.A.; Lubchenco, J.; Melillo, J.M. Human Domination of Earth’s Ecosystems. Am. Assoc. Adv. Sci. 1997, 277, 494–499. [Google Scholar] [CrossRef] [Green Version]
  38. Su, C.; Fu, B. Evolution of Ecosystem Services in the Chinese Loess Plateau under Climatic and Land Use Changes. Glob. Planet. Chang. 2013, 101, 119–128. [Google Scholar] [CrossRef]
  39. Si, J.; Nasiri, F.; Han, P.; Li, T. Variation in Ecosystem Service Values in Response to Land Use Changes in Zhifanggou Watershed of Loess Plateau: A Comparative Study. Environ. Syst. Res. 2014, 3, 2. [Google Scholar] [CrossRef] [Green Version]
  40. Yang, W.; Dietz, T.; Kramer, D.B.; Ouyang, Z.; Liu, J. An Integrated Approach to Understanding the Linkages between Ecosystem Services and Human Well-Being. Ecosyst. Health Sustain. 2009, 1, 11878993. [Google Scholar] [CrossRef] [Green Version]
  41. Palomo, I.; Martín-López, B.; Zorrilla-Miras, P.; García Del Amo, D.; Montes, C. Deliberative Mapping of Ecosystem Services within and around Doñana National Park (SW Spain) in Relation to Land Use Change. Reg. Environ. Chang. 2014, 14, 237–251. [Google Scholar] [CrossRef]
  42. Fürst, C.; Frank, S.; Witt, A.; Koschke, L.; Makeschin, F. Assessment of the Effects of Forest Land Use Strategies on the Provision of Ecosystem Services at Regional Scale. J. Environ. Manag. 2013, 127, S96–S116. [Google Scholar] [CrossRef]
  43. Chen, D.; Stow, D.; Getis, A. Multi-Resolution Classification Framework for Improving Land Use/Cover Mapping. In Linking People, Place and Policy: A GIS Approach; Walsh, S.J., Crews-Meyer, K.A., Eds.; Springer Science + Business Media: New York, NY, USA, 2012; Volume 34. [Google Scholar]
  44. GRCA Grand River Watershed Water Management Action Plan: 2014 Report on Actions. Available online: https://www.grandriver.ca/en/our-watershed/resources/Documents/WMP/Water_WMP_Plan_AnnualReport_2014.pdf (accessed on 19 April 2018).
  45. Olewiler, N. The Value of Natural Capital in Settled Areas of Canada; Ducks Unlimited Canada and the Nature Conservancy of Canada; Simon Fraser University: Vancouver, BC, Canada, 2004. [Google Scholar]
  46. Brox, J.A.; Kumar, R.C.; Stolleryl, K.R. Willingness to Pay for Water Quality and Supply Enhancements in the Grand River Watershed. Can. Water Resour. J./Rev. Can. Des Resour. Hydr. 1996, 21, 275–288. [Google Scholar] [CrossRef] [Green Version]
  47. Mohamed, M.N.; Wellen, C.; Parsons, C.T.; Taylor, W.D.; Arhonditsis, G.; Chomicki, K.M.; Boyd, D.; Weidman, P.; Mundle, S.O.C.; Van Cappellen, P.; et al. Understanding and Managing the Re-Eutrophication of Lake Erie: Knowledge Gaps and Research Priorities. Freshw. Sci. 2019, 38, 675–691. [Google Scholar] [CrossRef]
  48. Aziz, T. Ecosystem Services: Linking Ecohydrology with Economic Valuation; University of Waterloo: Waterloo, ON, Canada, 2018; Available online: http://hdl.handle.net/10012/14004 (accessed on 10 July 2023).
  49. Belcher, K.; Edwards, C.K.; Gray, B. Ecological Fiscal Reform and Agricultural Landscapes. 2001. Available online: https://digital.library.yorku.ca/yul-413928/ecological-fiscal-reform-and-agricultural-landscapes-analysis-economic-instruments (accessed on 21 January 2023).
  50. Notaro, S.; Paletto, A. The Economic Valuation of Natural Hazards in Mountain Forests: An Approach Based on the Replacement Cost Method. J. For. Econ. 2012, 18, 318–328. [Google Scholar] [CrossRef]
  51. McComb, G.; Lantz, V.; Nash, K.; Rittmaster, R. International Valuation Databases: Overview, Methods and Operational Issues. Ecol. Econ. 2006, 60, 461–472. [Google Scholar] [CrossRef]
  52. Wilson, S.J. Ontario’s Wealth, Canada’s Future: Appreciating the Value of the Greenbelt’s Eco-Services; David Suzuki Foundation: Vancouver, BC, Canada, 2008. [Google Scholar]
  53. Troy, A.; Bagstad, K. Estimating Ecosystem Service Values in Southern Ontario; Ministry of Ntural Resources, Ontario: Pleasanton, CA, USA, 2010. [Google Scholar]
  54. Wilson, S.J. Lake Simcoe Basin’s Natural Capital: July The Value of the Watershed’s Ecosystem Services; David Suzuki Foundation: Vancouver, BC, Canada, 2008. [Google Scholar]
  55. Wilson, S.J. The Peace Dividend: Assessing the Economic Value of Ecosystems in B.C.’s Peace River Watershed; David Suzuki Foundation: Vancouver, BC, Canada, 2014. [Google Scholar]
  56. de Groot, R.; Brander, L.; van der Ploeg, S.; Costanza, R.; Bernard, F.; Braat, L.; Christie, M.; Crossman, N.; Ghermandi, A.; Hein, L.; et al. Global Estimates of the Value of Ecosystems and Their Services in Monetary Units. Ecosyst. Serv. 2012, 1, 50–61. [Google Scholar] [CrossRef]
  57. Costanza, R.; de Groot, R.; Sutton, P.; van der Ploeg, S.; Anderson, S.J.; Kubiszewski, I.; Farber, S.; Turner, R.K. Changes in the Global Value of Ecosystem Services. Glob. Environ. Chang. 2014, 26, 152–158. [Google Scholar] [CrossRef]
  58. Meya, J.N.; Drupp, M.A.; Hanley, N. Testing Structural Benefit Transfer: The Role of Income Inequality. Resour. Energy Econ. 2021, 64, 101217. [Google Scholar] [CrossRef]
  59. Ledoux, L.; Turner, R.K. Valuing Ocean and Coastal Resources: A Review of Practical Examples and Issues for Further Action. Ocean Coast. Manag. 2002, 45, 583–616. [Google Scholar] [CrossRef]
  60. Jackson, S.; Finn, M.; Scheepers, K. The Use of Replacement Cost Method to Assess and Manage the Impacts of Water Resource Development on Australian Indigenous Customary Economies. J. Environ. Manag. 2014, 135, 100–109. [Google Scholar] [CrossRef]
  61. Aziz, T.; Van Cappellen, P. Valuation of Ontario’s Ecosystem Services and Relevance for Decision-Making. In Canada: Past, Present and Future Perspectives; Lund, S.A., Ed.; Nova Science Publishers: New York, NY, USA, 2020; pp. 131–165. ISBN 978-53618-404-4. [Google Scholar]
  62. Whitham, C.E.L.; Shi, K.; Riordan, P. Ecosystem Service Valuation Assessments for Protected Area Management: A Case Study Comparing Methods Using Different Land Cover Classification and Valuation Approaches. PLoS ONE 2015, 10, e0129748. [Google Scholar] [CrossRef] [PubMed] [Green Version]
  63. Feuillette, S.; Levrel, H.; Boeuf, B.; Blanquart, S.; Gorin, O.; Monaco, G.; Penisson, B.; Robichon, S. The Use of Cost-Benefit Analysis in Environmental Policies: Some Issues Raised by the Water Framework Directive Implementation in France. Environ. Sci. Policy 2016, 57, 79–85. [Google Scholar] [CrossRef]
  64. Birkhofer, K.; Eva, D.; Andersson, J.; Ekroos, J.; Früh-Müller, A.; Machnikowski, F.; Mader, V.L.; Nilsson, L.; Sasaki, K.; Rundlöf, M.; et al. Ecosystem Services—Current Challenges and Opportunities for Ecological Research. Front. Ecol. Evol. 2015, 2, 87. [Google Scholar] [CrossRef] [Green Version]
  65. Simpson, R.D. The Simple but Not-Too-Simple Valuation of Ecosystem Services: Basic Principles and an Illustrative Example. J. Environ. Econ. Policy 2016, 6, 96–106. [Google Scholar] [CrossRef]
  66. Jarisch, I.; Bödeker, K.; Bingham, L.R.; Friedrich, S.; Kindu, M.; Knoke, T. The Influence of Discounting Ecosystem Services in Robust Multi-Objective Optimization—An Application to a Forestry-Avocado Land-Use Portfolio. For. Policy Econ. 2022, 141, 102761. [Google Scholar] [CrossRef]
  67. Fang, X.; Tang, G.; Li, B.; Han, R. Spatial and Temporal Variations of Ecosystem Service Values in Relation to Land Use Pattern in the Loess Plateau of China at Town Scale. PLoS ONE 2014, 9, e110745. [Google Scholar] [CrossRef] [PubMed] [Green Version]
  68. Konarska, K.M.; Sutton, P.C.; Castellon, M. IMPORTANTE_Evaluating Scale Dependence of Ecosystem Service Valuation a Comparison of NOAA-AVHRR and Landsat TM Datasets. Ecol. Econ. 2002, 41, 491–507. [Google Scholar] [CrossRef]
Figure 1. Land cover in the Grand River watershed, Ontario, Canada (data taken from the Grand River Conservation Authority, or GRCA, website: https://data.grandriver.ca/downloads-geospatial.html. Accessed on 4 May 2020).
Sustainability 15 11024 g001
Figure 2. Total value of three ecosystem services in the Grand River watershed based on three datasets (i.e., local, regional, and global) (see Section 2.3 for details on datasets). Error bars show standard deviations. All values are in CAD 2017. The service comparison for each dataset is shown in Figure A2.
Sustainability 15 11024 g002
Table 1. Studies from around the world that have used unit values from Costanza et al. (1997) and the Ecosystem Services Valuation Database (ESVD, 2012) to value ecosystem services.
Study AreaReferenceDataset Used
Texas, USA[12]Costanza et al. (1997)
Chongming Island, China[13]Costanza et al. (1997)
Sanjiang Plain, Northeast China[14]Costanza et al. (1997)
Wenzhou, China[15]Costanza et al. (1997)
Changsha, China[16]Costanza et al. (1997)
Shenzhen, China[17]Costanza et al. (1997)
Bhutan[18]ESVD (2012)
Czech Republic[19]ESVD (2012)
Asia[20]ESVD (2012)
Okanagan, Canada[21]ESVD (2012)
Portugal[22]ESVD (2012)
China[23]ESVD (2012)
Central highlands, Ethiopia[24]Costanza et al. (1997)
Taiwan[25]ESVD (2012)
Iran[26]ESVD (2012)
Iceland[27]ESVD (2012)
Table 2. Areas of land cover categories in the Grand River watershed based on the data shown in Figure 1 [44]. Note that the categories shown in Italic are not valuated for ecosystem services. The numbers in bold represent the total area and percentage of the major land use categories.
Major CategoriesSubcategoriesArea (Hectares)Area (%)
Agriculture 446,16266
Row crops133,08219
Small grains79,66212
Forage127,38919
Fallow fields106,02916
Pasture/sparse forest 55,6608
Forest 72,30511
Dense forest (Deciduous)35,7225
Dense forest (Conifer)11,7312
Dense forest (Mixed)19,4973
Plantation (Mature)53051
Wetlands 64,2789.5
Open Water 84751
Urban 29,4424
Extraction(roads/beach/bedrock)32560.5
Total 679,820100
Table 3. Local, regional, and global unit values of three ecosystem services for land cover categories in the Grand River watershed. Where no unit value is shown, the ES provided by the given land cover was not valuated in the source study or, for the global unit values, in the ESVD dataset. (The value from multiple sources is the arithmetic average of their unit values).
Ecosystem ServiceProviding Land CoversValue (2017 CAD/Hectare/Year)
LocalRegionalGlobal
Carbon SequestrationForest485 ± 30 a,b430 ± 540680 ± 1570
Pasture/sparse forest110 ± 75 a35585 ± 580
Wetlands100 ± 10 a,b16215 ± 340
Open water-16-
Cropland35 ± 5 a--
Fallow fields35 ± 5 a36-
Water PurificationForest105 ± 28 a,b420 ± 23010 ± 20
Pasture/sparse forest175 ± 75 a-115 ± 140
Wetlands105 ± 10 a,b850 ± 7504690 ± 6910
Open Water20 ± 15 a260290 ± 370
Cropland115 ± 5 a-466
Fallow fields--
Nutrient cyclingForest135 ± 35 a300 ± 420145
Pasture/sparse forest545 ± 2 a30 ± 1-
Wetlands240 ± 13 a1170 ± 18002665 ± 3730
Open water930 ± 105 a30 ± 45-
Cropland15 ± 45 a--
Fallow fields15 ± 45 a30-
a Aziz (2018) [48]; b Belcher et al. (2001) [49]; a,b average of the values in Aziz (2018) and Belcher et al. (2001).
Table 4. Local unit values ($/ha/year) of three ecosystem services for sub- and major land cover types (in bold; weighted average of land cover subcategories). The total values (million $/year) for high and low resolutions of agricultural and forest land cover types are obtained by applying Equation (1), using the unit values and land cover data given in Table 2. The “Total” value represents the combined value of each ecosystem service for agricultural plus forest land cover types.
ParameterLand CoverSubcategoriesEcosystem Services
Carbon SequestrationNutrient CyclingWater Filtration
Unit values of ecosystem services ($/ha/year)Agriculture 35 ± 515 ± 55110 ± 55
Row crop52 ± 1370 ± 115102 ± 100
Small grains28 ± 818 ± 1898 ± 98
Forage24 ± 2−42 ± 80125 ± 90
Forest 1040 ± 85135 ± 10178 ± 50
Deciduous1330 ± 160145 ± 20178 ± 80
Coniferous540 ± 60110 ± 22178 ± 80
Mixed855 ± 110130 ± 15178 ± 80
Plantation910 ± 70130 ± 10178 ± 80
Value of ES (million $/year) for
high resolution
Agriculture 12.2 ± 1.97.7 ± 18.537.3 ± 19.2
Forest 70.5 ± 6.19.0 ± 0.811.9 ± 3.4
Total 82.72 ± 6.416.7 ± 18.549.2 ± 19.5
Value of ES (million $/year) for
low resolution
Agriculture 11.9 ± 1.75.1 ± 18.737.4 ± 18.7
Forest 75.2 ± 6.19.8 ± 0.712.6 ± 3.6
Total 87.1 ± 6.314.9 ± 18.750.0 ± 19.0
Table 5. Total values of forest and agriculture for low- and high-resolution land cover data (inferred by aggregating the value of three ecosystem services given in Table 4).
Land Cover DataValue (million $/year) of Land Cover
ForestAgricultureTotal
High resolution91 ± 7.057 ± 27149 ± 28
Low resolution98 ± 7.054 ± 25152 ± 27
Percent change, Ci (%)862
Disclaimer/Publisher’s Note: The statements, opinions and data contained in all publications are solely those of the individual author(s) and contributor(s) and not of MDPI and/or the editor(s). MDPI and/or the editor(s) disclaim responsibility for any injury to people or property resulting from any ideas, methods, instructions or products referred to in the content.

