Article

Climate Change and Water Scarcity at the Focus of Environmental Impacts Associated with the COVID-19 Crisis in Spain

by
Cristina Cambeses-Franco
*,
Humberto José Urdaneta
,
Gumersindo Feijoo
,
María Teresa Moreira
and
Sara González-García
CRETUS Centre, Department of Chemical Engineering, School of Engineering, Universidad de Santiago de Compostela, Rúa Lope Gómez de Marzoa s/n, 15782 Santiago de Compostela, Spain
*
Author to whom correspondence should be addressed.
Sustainability 2023, 15(14), 11001; https://doi.org/10.3390/su151411001
Submission received: 18 April 2023 / Revised: 19 June 2023 / Accepted: 21 June 2023 / Published: 13 July 2023

Abstract

:
The conditions of social distancing and home confinement imposed to contain the outbreak of the severe acute respiratory syndrome coronavirus 2 (COVID-19) pandemic have changed the dietary patterns and lifestyle of society. These changes have had significant consequences not only for our personal well-being but also for the health of the planet. In this context, the aim of this study was to describe the effect of household containment during the COVID-19 pandemic on greenhouse gas (GHG) emissions related to food and water consumption. In addition, the dietary pattern of the Spanish population during home confinement was compared with the usual dietary pattern of consumption for the immediately preceding reference year (2019) to elucidate in depth the environmental consequences derived from food consumption due to COVID-19 restrictions. Life Cycle Assessment (LCA) and Water Footprint Assessment (WFA) methodologies were used to assess carbon footprint and water footprint. The functional unit of reference was the average daily food intake per capita. The results showed that COVID-19 home confinement had a negative impact on the carbon footprint (CF) and water footprint (WF) of the Spanish dietary pattern mainly due to the increase in the amount of food consumed during 2020. The monthly analysis revealed two peaks in April and October for both environmental indicators in 2020 compared to the same period in 2019, which was mainly due to the increase in food consumption in Spanish households during the weeks of confinement as well as to the new COVID-19 wave in October. On the other hand, an upward trend in GHG emissions and water consumption could be observed in the last months of both years, which is attributed to increased consumption during the Christmas holidays. These findings indicate that people should be more aware than ever of the importance of maintaining a healthy lifestyle and dietary pattern, in line with health guidelines and the Sustainable Development Goals.

Graphical Abstract

1. Introduction

On 31 December 2019, the World Health Organization reported that several cases of pneumonia of unknown aetiology associated with a new coronavirus, later named “COVID-19 virus”, had been detected in Wuhan, China [1]. On 30 January 2020, the outbreak of the new coronavirus was declared a Public Health Emergency of International Concern and shortly thereafter, in March 2020, due to the rapid increase in the number of cases outside China, with more than 100,000 and 4000 deaths reported in 114 countries, COVID-19 was officially termed a global pandemic [2].
In order to contain the spread of COVID-19, countries around the world imposed various measures to contain the spread of the pandemic. First, quarantine and self-isolation helped mitigate the health crisis. However, support for those who needed to isolate was not the same in all countries. The United Kingdom and Finland provided financial support through the welfare system. Sweden provided supported accommodation. Denmark and other non-European countries also provided hotel facilities. Second, some European countries strongly recommended the use of face masks (e.g., Belgium, Poland, Switzerland, Finland). Other countries were more cautious at first and reserved the use of face masks for health and social care workers (e.g., the UK and France). Third, universal testing was recommended to end COVID-19. Although this was not a problem for countries with testing capacity, such as Germany, other smaller countries sent samples abroad (e.g., Ireland) [3].
In the case of Spain, the Government announced the implementation of the state of alarm on 14 March 2020 [4], which initially imposed on the population the obligation to confine themselves to their homes, so that they would only be allowed to go out to buy food or medicines or to work in jobs classified as essential. In addition, there were temporary closures of businesses and restrictions on restaurants and takeaways.
Uncertainty about the health effects of the coronavirus and the limitations associated with containment measures influenced physical and mental illness, anxiety, anger, and depression [5,6], as well as dietary behaviours [7]. Not only did food consumption increase during the lockdown, but also access to fresh foods was limited, leading to high consumption of processed foods [8,9]. The possibility of following a healthy and varied diet was compromised at a time when it was especially necessary to strengthen our immune systems. In this framework, the WHO issued a series of dietary and nutritional advice during self-quarantine to address the problems of overweight and obesity that intensified with the pandemic [10].
Despite the volume of research published so far on healthy guidelines during lockdowns [11] and on the effects on personal health due to changes in eating behavior [12,13], few studies have assessed their impact on planetary health. The temporary suspension of activities in industry and reduced demand for public and private transportation led to an overall decrease in emissions to the environment [14], but how did the temporary variation in food consumption patterns influence environmental sustainability? This study provides a unique and valuable insight into the potential impact of lockdown periods on eating habits and lifestyle in Spain through the evaluation of environmental metrics. Not only does this study analyze the changes in food consumption patterns due to the COVID-19 pandemic but also shows the link between COVID-19, eating patterns, and planetary health. This issue is particularly challenging as it has hardly been addressed in the literature, despite the fact that food change scenarios have implications for the achievement of the UN Sustainable Development Goals (SDG) [15]. Indeed, food systems are responsible for more than one-third of global GHG emissions [16,17] and are drivers of biodiversity loss and freshwater consumption [18]. Therefore, major issues related to food systems include climate change and water consumption [19]. Therefore, carbon footprint (CF) and water footprint (WF) within the Life Cycle Assessment (LCA) framework could address the need to consider the environmental consequences of changing food habits due to the restrictive measures adopted in Spain to minimize the spread of COVID-19.
Thus, the aim of this study was to map monthly CF and WF derived from food consumption patterns in the first year of the COVID-19 pandemic in Spain (2020). Specifically, the assessment includes the analysis of the environmental sustainability of the Spanish food pattern months before, during, and after the lockdown. A comparison of the environmental consequences of the dietary pattern during the year of pandemic-related home confinement with the Spanish dietary pattern of usual consumption for a baseline year (2019) was also performed.
Through this analysis, the implication of the pandemic health crisis on the fulfillment of the 2030 Agenda was explored by tracking progress on SDGs related to food and agriculture. This was very useful in evidence-based policy formulation regarding health measures to ensure not only personal health but also planetary health and future food sustainability.

2. Materials and Methods

2.1. Food Consumption Data

Monthly per capita food consumption was based on the 2019 and 2020 Household Consumption Survey of the Ministry of Agriculture, Fisheries and Food [20,21]. This database only considers household food consumption, representing 86% of total food consumption in Spain in 2019 and 92% in 2020 [22]. Therefore, the consumption of ready-made meals was not included in the analysis.

2.2. Data Analysis

Based on the data reported, a set of 24 diet scenarios (12 per year) was designed to characterize the monthly Spanish dietary intake patterns in 2019 and 2020. Each scenario covers a wide variety of 86 representative foods, grouped into 12 food groups according to the classification reported by González-García et al. [23]. Due to the lack of reliable data, beverages and spices were excluded from dietary scenarios in agreement with other studies available in the literature [24,25]. The average intake per food category for each scenario for the years 2019 and 2020 was gathered in Tables S1 and S2 in the Supplementary Material. Microsoft Excel was used as a tool to calculate, analyze, and visualize the large amount of data used for the study.

2.3. Carbon Footprint

The LCA methodology was used to assess the environmental impacts of food consumption by Spanish households [26]. The CF was used as an indicator of the impact of GHG emissions associated with each monthly dietary scenario. The average amount of food consumed (grams) per person per day provides the basis for calculating the CF. A cradle-to-consumer LCA approach was taken, considering the food supply chain from agricultural production to final household consumption. The system was therefore divided into three stages (Figure 1):
(i)
Agriculture and industrial food production (S1): This first stage encompasses the production of the foods that make up each dietary scenario.
(ii)
Wholesale and retail distribution stage (S2): This second stage comprises the flow of food items from manufacturer to wholesaler and retailer.
(iii)
Household consumption stage (S3): This last part of the value chain includes the distribution of food items from retailers to households.
Data collection covered the analysis of 40 LCA studies focused on the agricultural or industrial production phases. A detailed summary of the foods and their corresponding CF was presented in Table S3 in the Supplementary Material. The CF associated with the wholesale and retail distribution stage was calculated based on 2020 import and export data provided by the Ministry of Economy and Competitiveness (multidimensional database DATACOMEX) [27]. Based on these data, average import distances were calculated with reference to two modes of transport, transoceanic ships and trucks, and GHG emission factors (Ecoinvent® v3.2 database). For national foodstuffs, an average distance of 400 km per Euro 5 diesel freight lorries (>32 tons) was considered [28]. Detailed information on import and export volumes and distribution distances by food for 2019 and 2020 was compiled in Tables S4 and S5 in the Supplementary Material.
For the household consumption stage, the CF was calculated assuming that an average Spanish citizen follows a weekly grocery shopping routine. The average distance between the supermarkets and households was estimated at 3.3 km, and a diesel vehicle with an emission rate of 106 gCO2eq·km−1 was considered as a means of transport [29]. Food losses and food waste from the distribution and consumption stages were taken into consideration [30,31]. A complete description of the CF methodology is described in detail elsewhere [23].

2.4. Water Footprint

WF measures the volume of water used in the production of food or dietary items, separated by water source [32]. Green WF represents the volume of rainwater consumed (evaporated); blue WF, surface or groundwater use; and grey WF, surface, or groundwater polluted [33].
Available evidence was used to quantify the WF of crops, derived crops, and livestock products included in the Spanish monthly dietary intake patterns. In particular, the scientific reports by [34,35] were considered as the reference dataset. For marine capture production, a WF of zero was assumed [36,37]. The WF of aquafeed production was quantified based on the effect of feed intake on water consumption [38]. A detailed description of the WF methodology could be consulted elsewhere [23].

3. Results

3.1. Composition of the Spanish Average Dietary Pattern during the COVID-19 Pandemic (2020)

Table 1 shows the daily intake per food group for the Spanish dietary pattern throughout the year 2020. The Spanish dietary pattern, influenced by the Mediterranean and the Atlantic diets, is characterized by an abundant intake of plant-based foods (53% of total intake), including fruits, vegetables, pulses, starch-based products, nuts, and plant-based oils and fats. The intake of animal products (meat, dairy, eggs, and seafood) contributed 38% to the total Spanish daily diet in 2020. The remaining percentage corresponded to sweets (13%) and ready meals (3%).
The food group that contributed most to the total intake was dairy products (22%). This food category includes milk, yoghurt, cheese, and butter, with milk responsible for the highest intake (80% of total dairy intake). The second most consumed food category was fruits (19%), with oranges (19% of total fruit intake), bananas (15%), apples (12%), and watermelons (10%), respectively. On the other hand, pulses and nuts were the lowest contributors, both categories representing less than 1% of total intake.

3.2. Carbon Footprint Analysis for the Spanish Dietary Pattern during the COVID-19 Pandemic (2020)

The average dietary CF for Spanish households during the COVID pandemic period (2020) was 3.64 kgCO2·person−1·day−1. Almost 96% of total GHG emissions come from the agriculture and industrial food production stage (S1), the most critical in terms of environmental impact. GHG emissions related to wholesale and retail trade (S2) and transportation of food products from supermarkets to households (S3) accounted for 3% and 2% of total CF, respectively. Food losses or waste were estimated at 175.1 g·person−1·day−1 of the food supply. We found that the most commonly wasted food groups were sweets (mainly refined flour) (23.4 g·person−1·day−1), fruits (56.1 g·person−1·day−1), and vegetables (45.8 g·person−1·day−1). The greater waste of sweets was associated with their increased consumption during the first weeks of lockdown triggered by stress, boredom, and emotional eating.
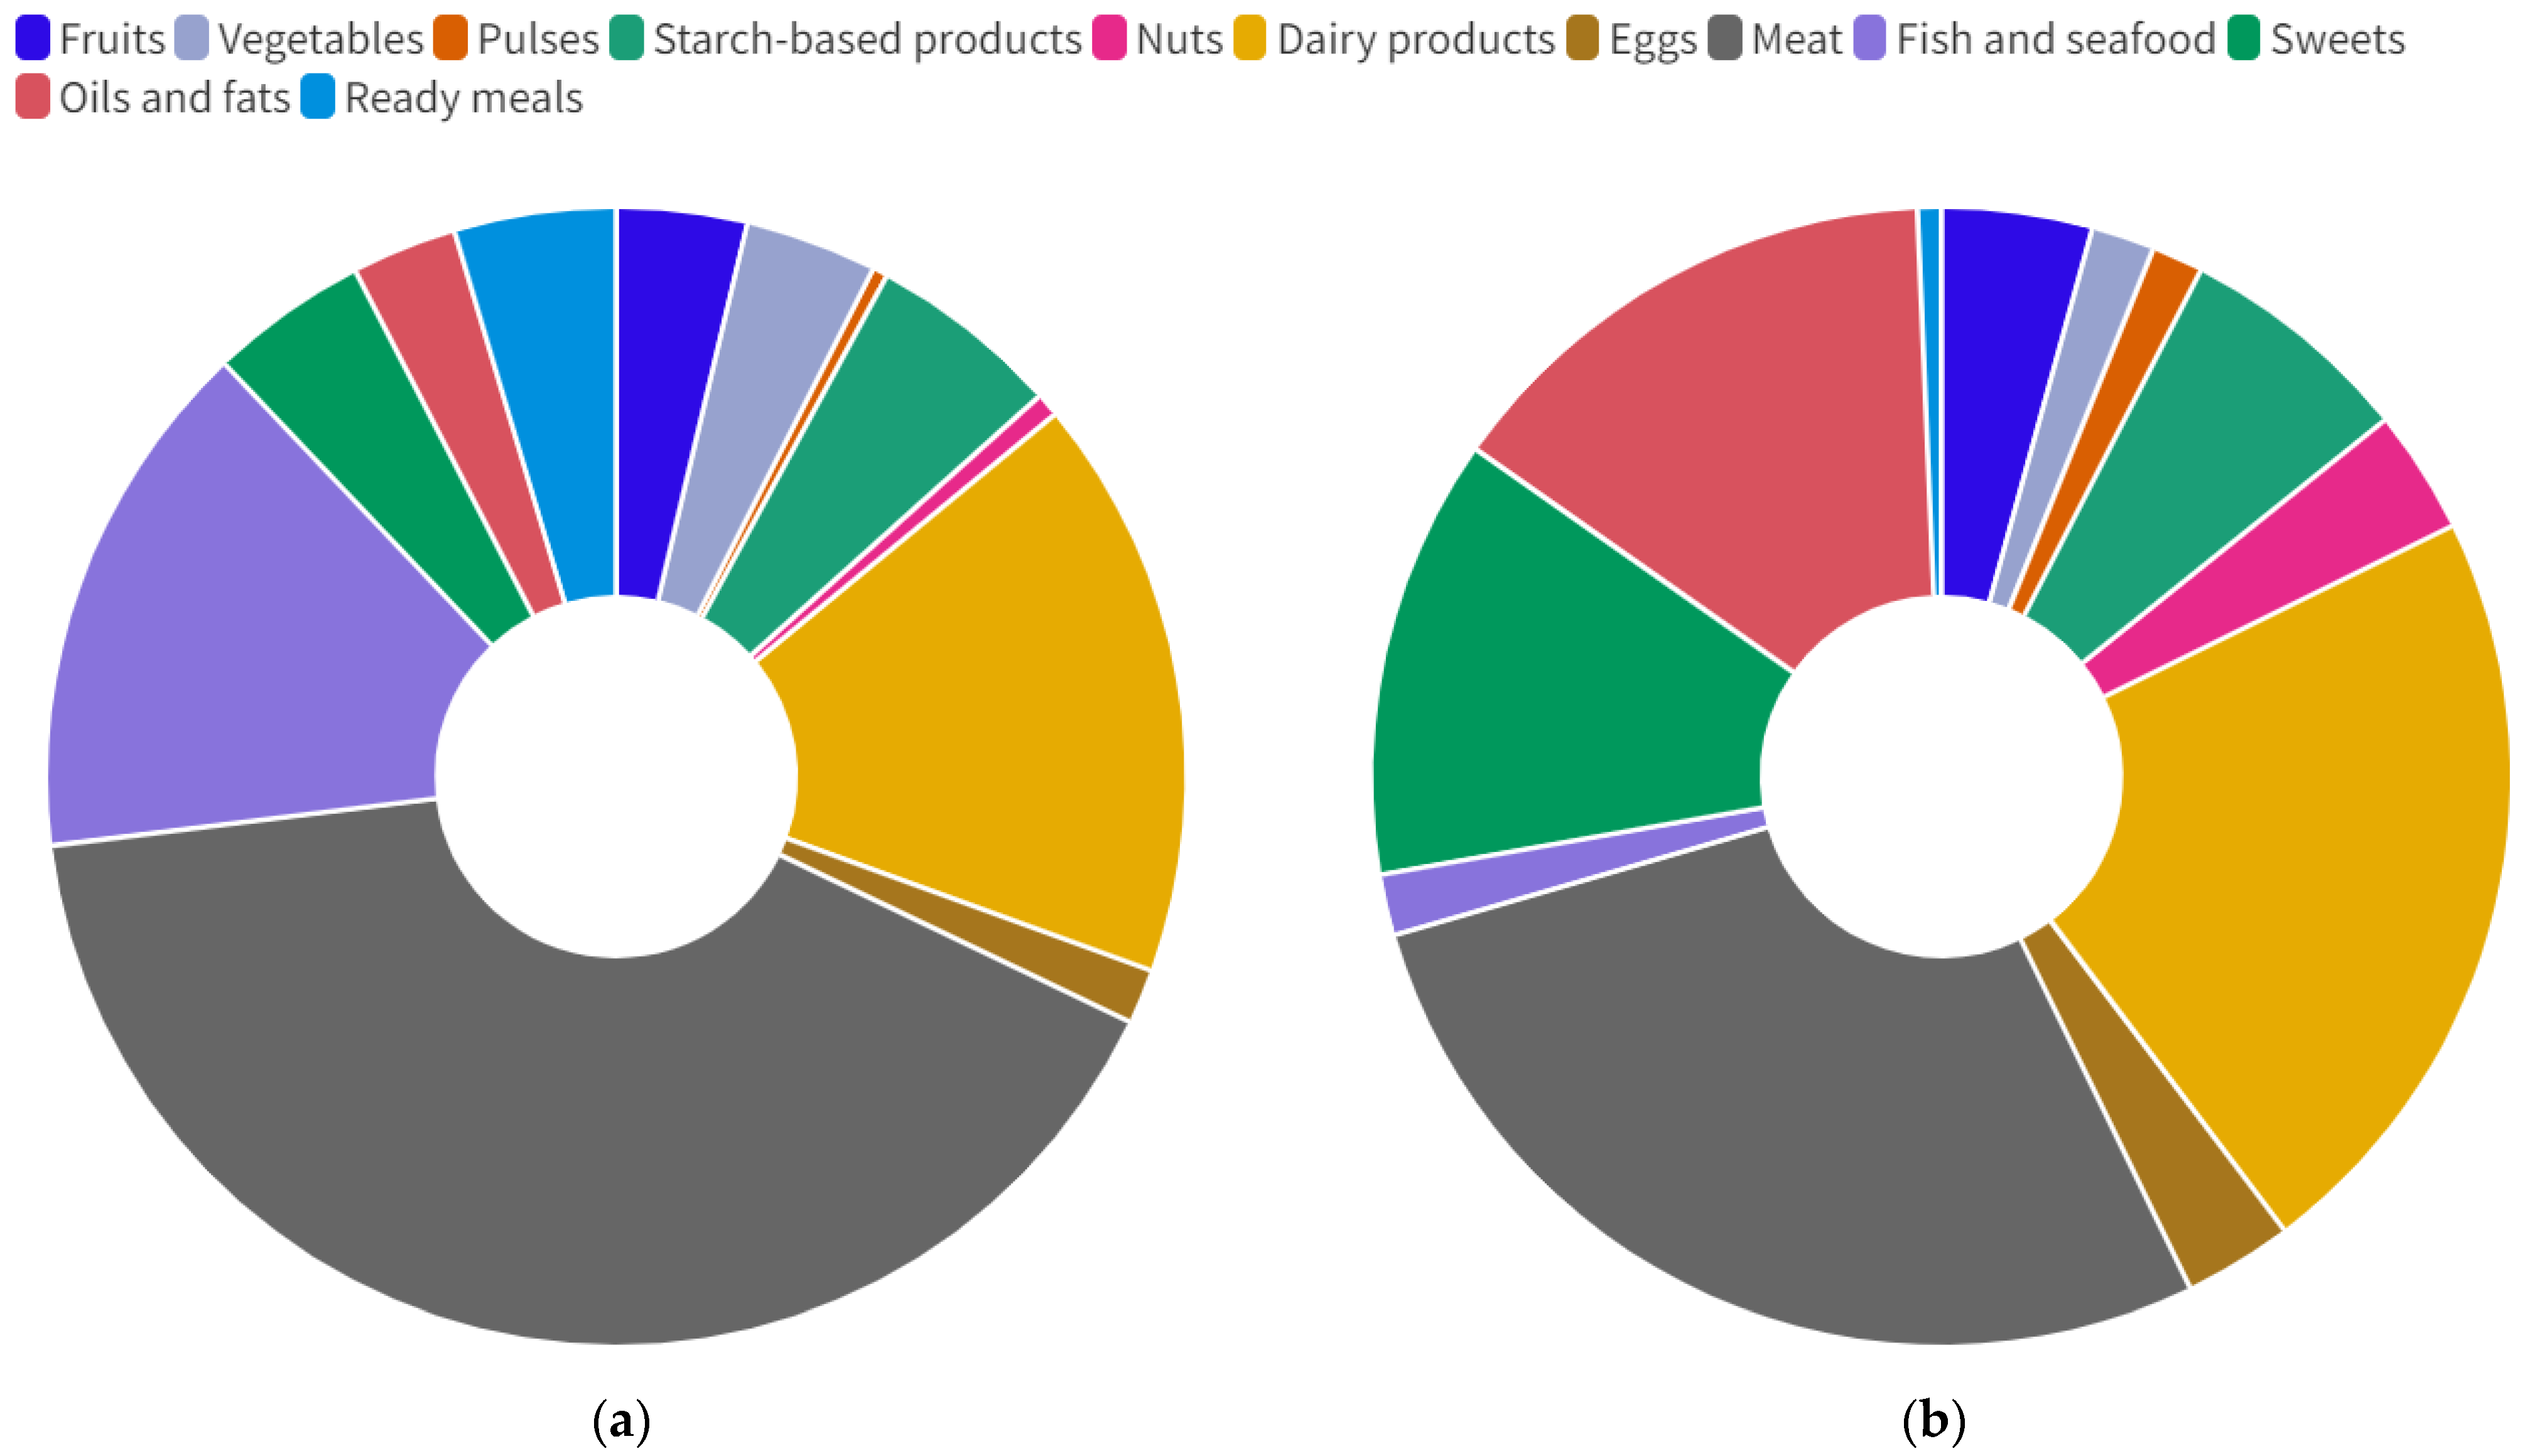
Figure 2a represents the contribution of each food category to climate change, showing the high impact of animal-derived foods on this environmental indicator (59% of total CF). We can observe that there is not a close relationship between higher food group consumption and higher CF. Although meat only represents 9% of total intake alone, it accounts for 40% of total GHG emissions. Beef and processed meat are the major environmental hotspots. It is also worth noting the impact of dairy products (0.60 kgCO2·person−1·day−1) and fish and seafood (0.54 kgCO2·person−1·day−1) on CF. In contrast, although the Spanish dietary pattern is associated with a high intake of fruits (278.4 g·person−1·day−1) and vegetables (243.7 g·person−1·day−1), the CF values for these food items are of much less relevance.

3.3. Water Footprint Analysis for the Spanish Dietary Pattern during the COVID-19 Pandemic (2020)

The WF of the 2020 Spanish dietary pattern was 3337 L·person−1·day−1, divided further into green (2612 L·person−1·day−1), blue (381 L·person−1·day−1), and grey (344 L·person−1·day−1) WFs. Figure 2b shows the WF sorted per food category for the Spanish dietary pattern in 2020. While animal-based products represent 55% of the total WF, the contribution of plant-based products to the total WF was 32%. Meat, dairy products, oils, and fats and sweets were the main contributors to dietary WF, covering 28%, 22%, 15%, and 13% of total WF, respectively. However, there is no strong relationship between higher consumption of food groups and higher WF. In fact, of these four food categories, only dairy products were among the most consumed (322.2 g·person−1·day−1). The rationale behind this finding is the high WF of some food items within these food groups, such as beef, cheese, olive oil, or chocolate [34,35].

3.4. Month-to-Month Analysis of the Spanish Food Consumption Patterns and Its Impacts on the Environment during 2020

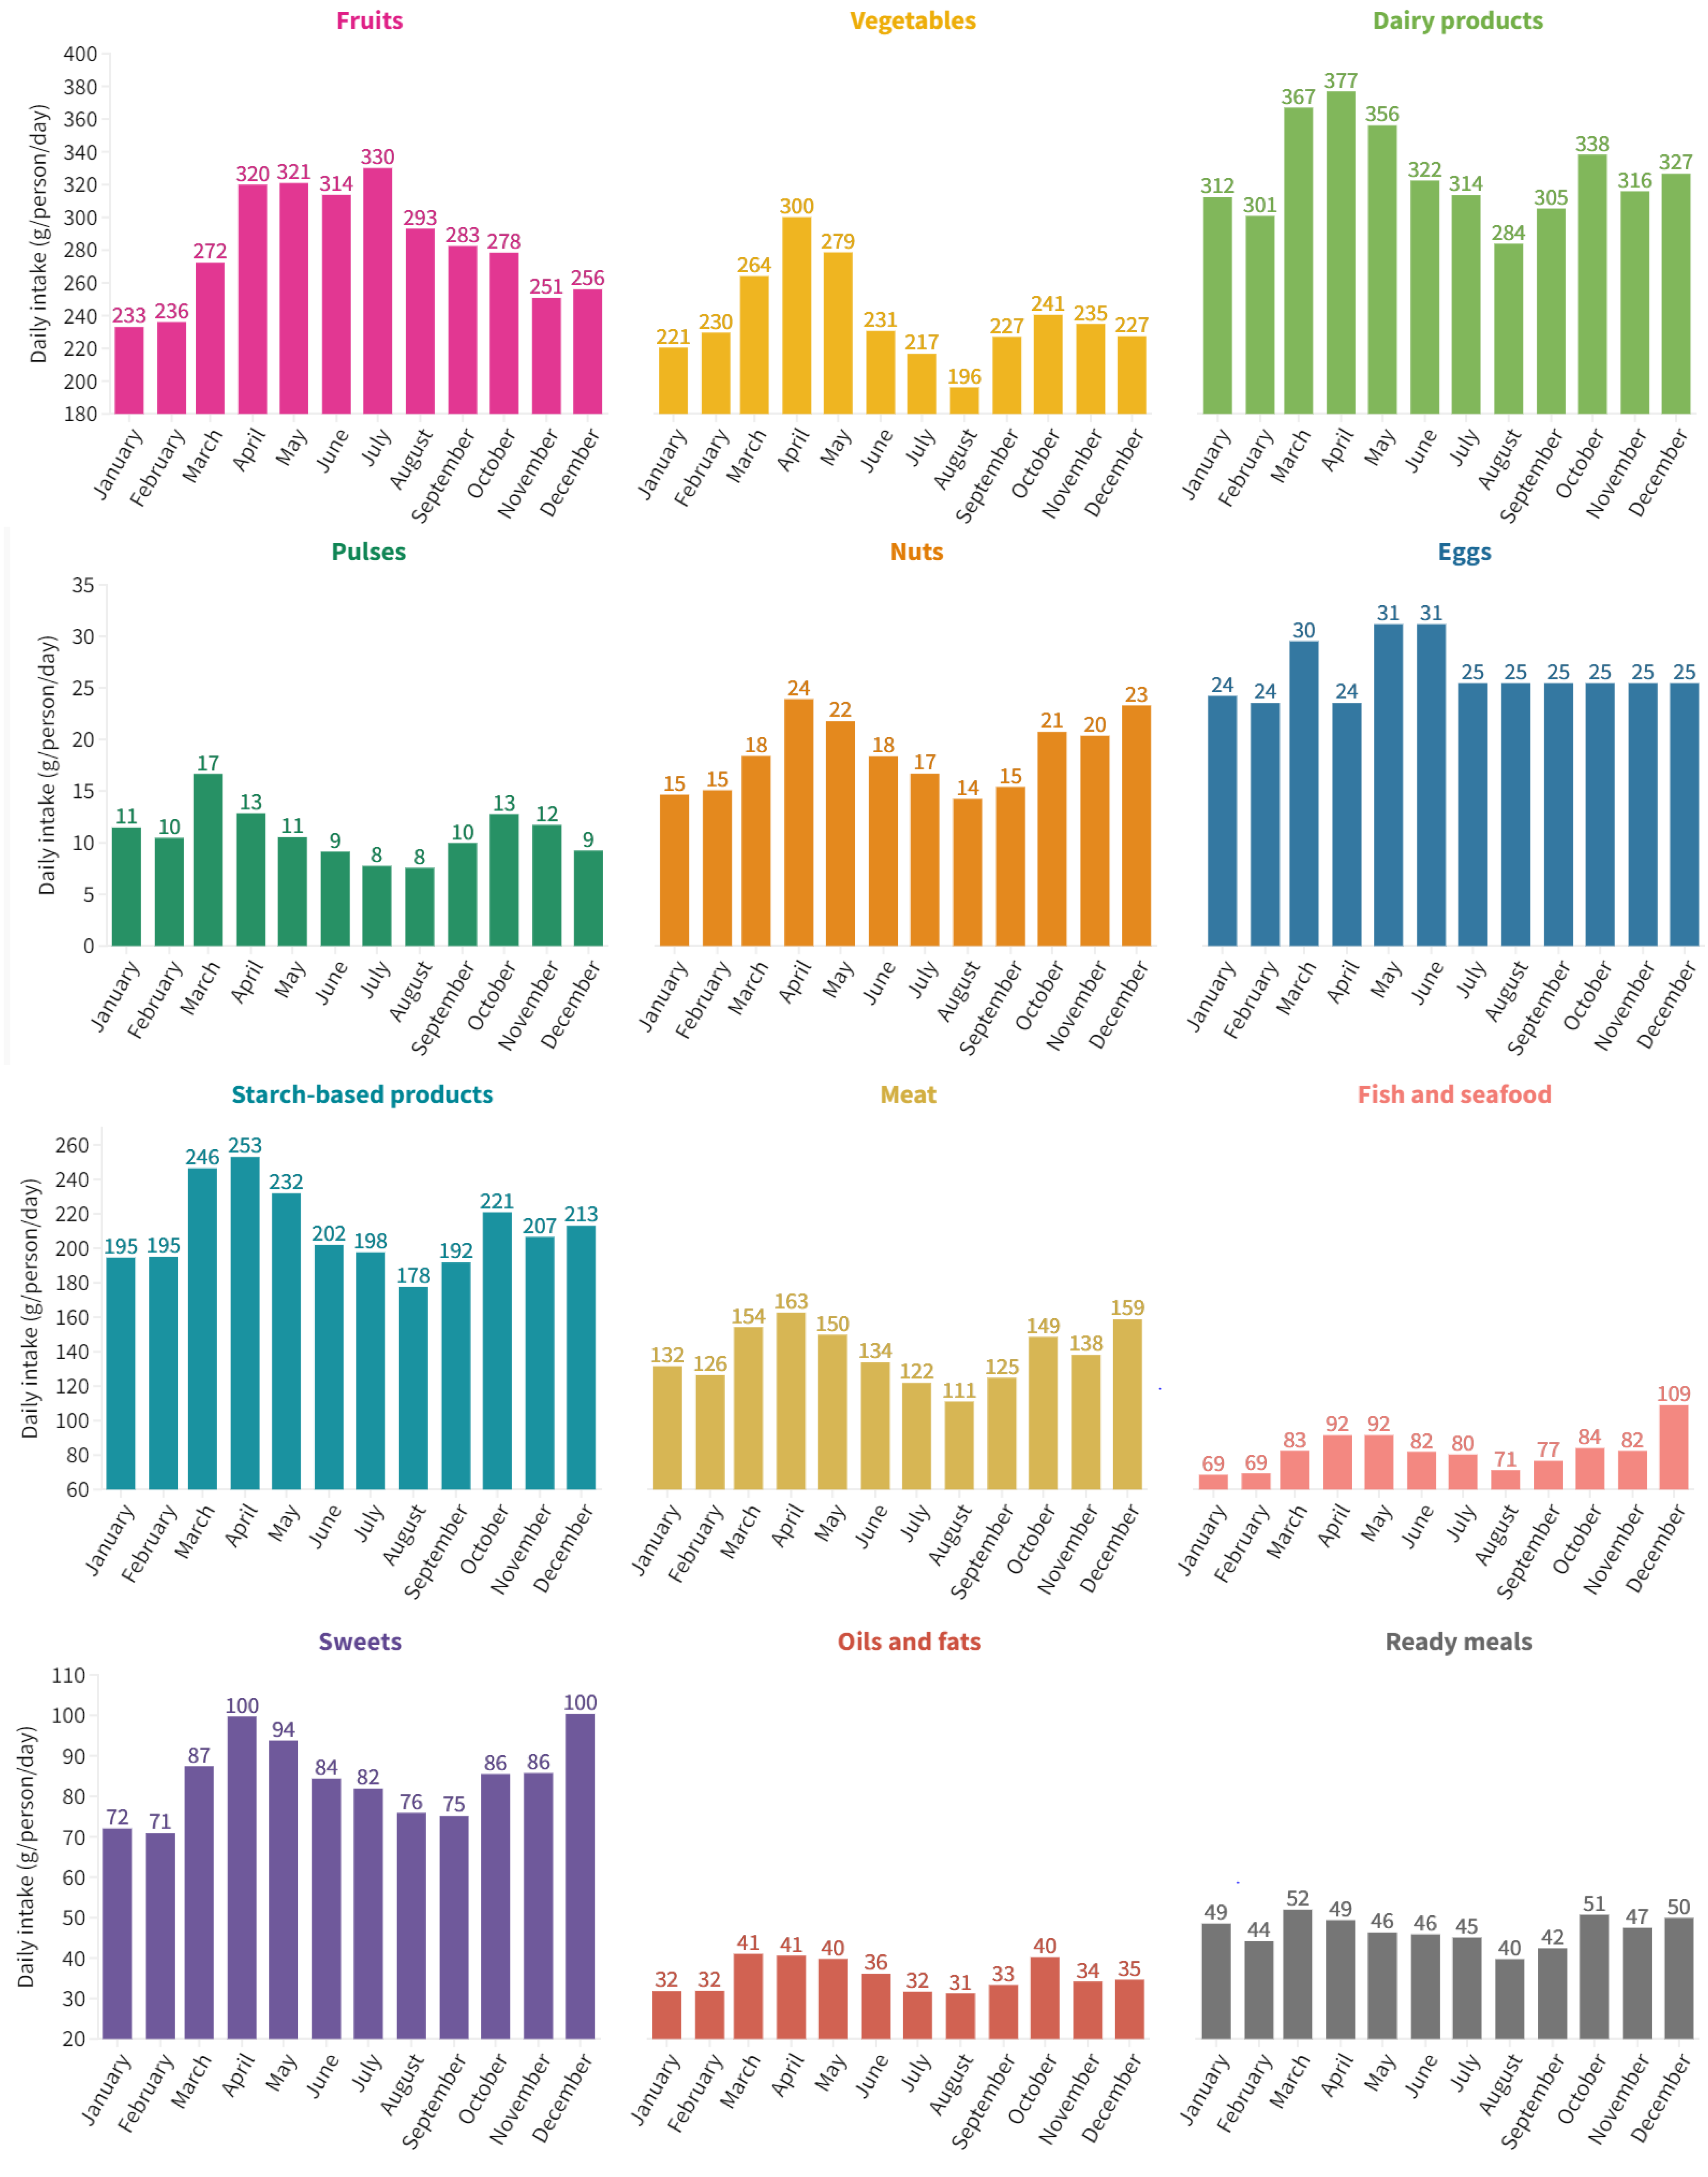
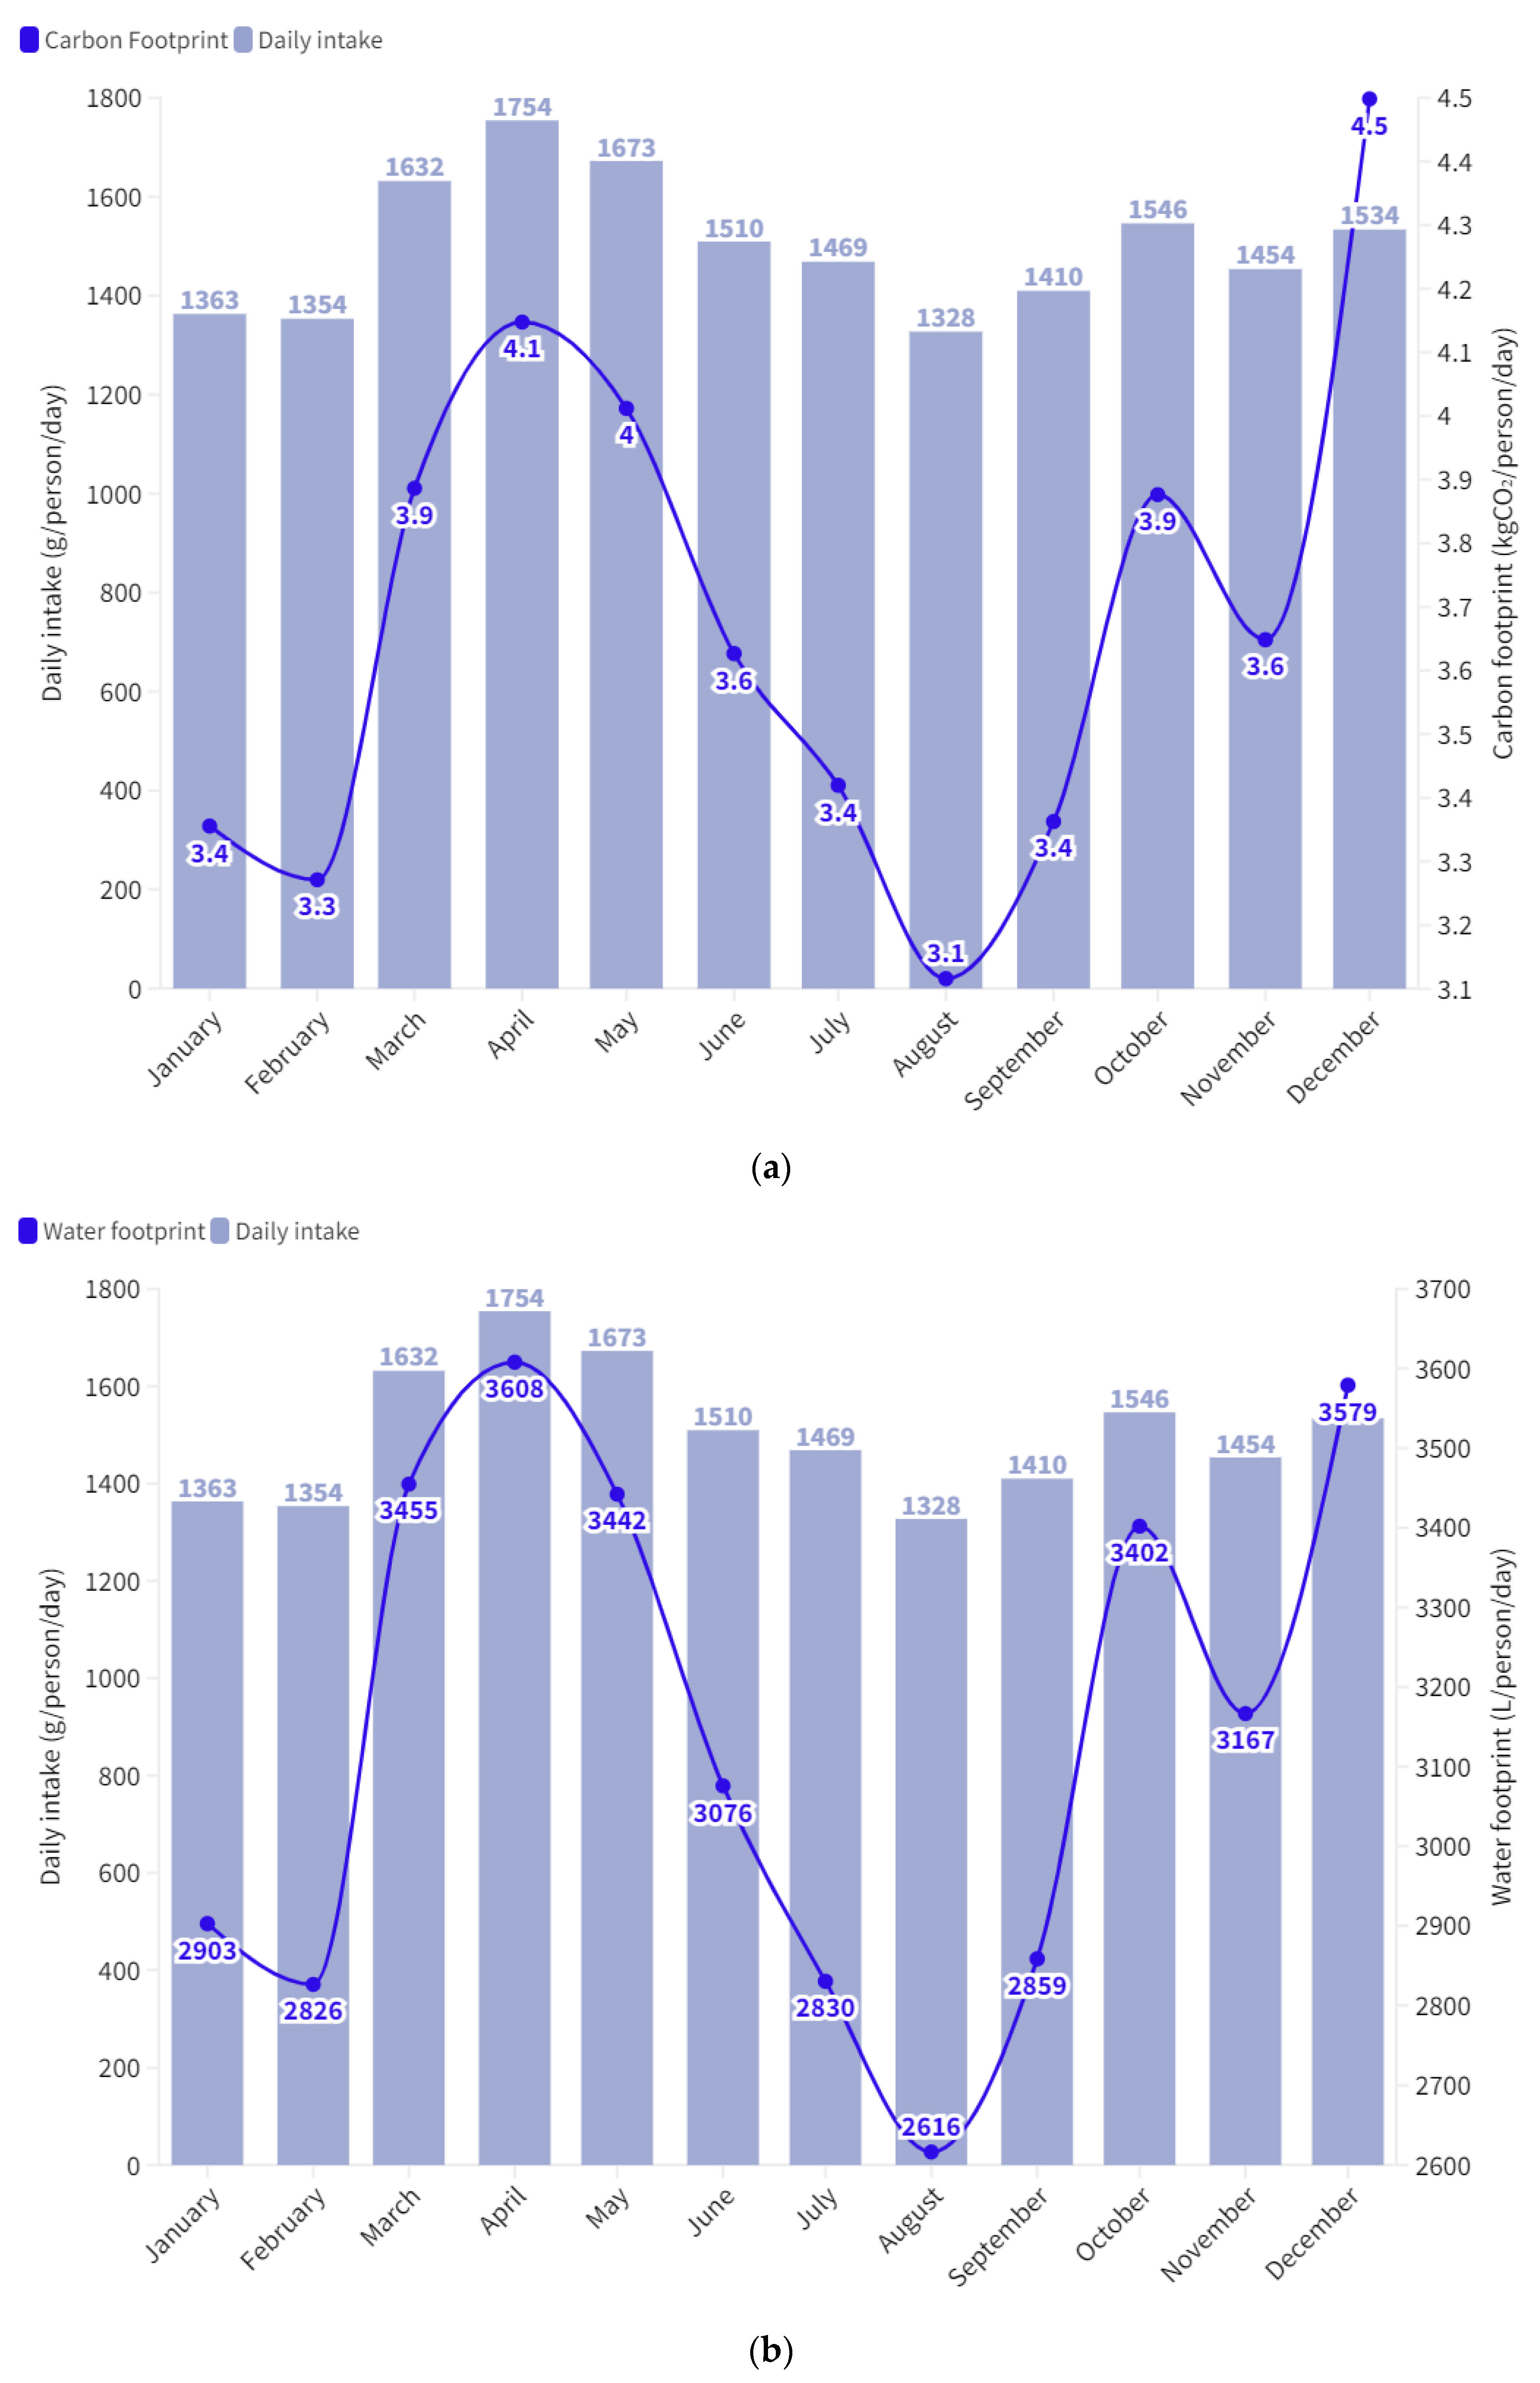
Figure 3 and Figure 4 show the monthly variation of daily household food consumption, CF, and WF of the Spanish dietary pattern during 2020. We found that the change in the environmental indicators over time varied according to the critical response actions for COVID-19.
The first critical fluctuation in environmental parameters occurred between February and March in values of CF, which increased by 19% and WF by 22%. On 14 March, the Government approved a nationwide state of alarm, restricting citizens’ freedom of movement to certain circumstances and closing all non-essential shops. The closure of most shops and all leisure, educational, and cultural places created pressure to increase food inventory. At this point, food consumption increased, partially attributed to stress, feeling of emptiness, anxiety, and boredom, emotions caused by the confinement [39]. The upward trend in CF and WF continued until April when both environmental indicators reached their maximum values (4.15 kgCO2·person−1·day−1 and 3608 L·person−1·day−1).
Pulses were the food category, which experienced the highest increase (59%) between February and March. This food group mainly includes the following items, chickpeas, beans, and lentils. This increase in pulses consumed was responsible for the highest values of increase in CF (40%) and WF (59%) for this food category. The Spanish dietary pattern also experienced quite marked increases in eggs (ranging from 23.5 g·person−1·day−1 in February to 29.5 g·person−1·day−1 in March), sweets (from 70.9 to 87.4 g·person−1·day−1), starch-based products (from 195.0 to 246.4 g·person−1·day−1), and oils and fats consumption (from 31.9 to 41.1 g·person−1·day−1) (Figure 3) and in their associated CF and WF (Figure 4). The lowest percentage increase occurred in the fresh produce categories, fruits (ranging from 236.1 g·person−1·day−1 in February to 272.3 g·person−1·day−1 in March), vegetables (from 229.6 to 264.2 g·person−1·day−1), and fish and seafood (from 69.4 to 82.5 g·person−1·day−1) (Figure 3). Logistics constraints have contributed to potential shortages of these food groups of a perishable nature [8]. In addition, citizens aimed to reduce the risk of coronavirus infection by purchasing food products with a longer shelf life (and thus reducing consumption of fresh food) and limiting shopping trips to once a week.
The number of new cases and deaths decreased from 3 to 11 April. However, on 3 April, it was reported the highest number of deaths caused by COVID-19 in Spain. This was paralleled by increasing CF and WF. As noted above, both values peaked in April. The results for March and April showed a significant decrease in consumption in the food categories of pulses (22.7%) and eggs (20%). In contrast, consumption of fresh fruits (from 272.3 g·person−1·day−1 in March to 320.0 g·person−1·day−1 in April), vegetables (from 264.2 g·person−1·day−1 to 300.1 g·person−1·day−1), and fish and seafood (from 82.5 g·person−1·day−1 to 99.8 g·person−1·day−1) increased. There was also an increase in the intake of sweets, which ranged from 87.4 g·person−1·day−1 in March to 99.8 g·person−1·day−1 in April.
In April, the Government approved the de-escalation plan, which was gradually implemented until 21 June, when Spain entered the “new normality”. On 13 April, workers in some non-essential sectors, who cannot telework, return to work. On 26 April and 27, children will be allowed to go out for short walks with their parents, and on 28 April, the Government announced the four-phase plan for the adaptation of the whole society to the new normality. The relaxation of the confinement measures led to an overall decrease in household food consumption expenditure in Spain. For example, if we compare April and June, we can observe a significant decrease in household consumption (from 1754 g·person−1·day−1 in April to 1510 g·person−1·day−1 in June), CF (from 4.14 kgCO2·person−1·day−1 in April to 3.63 kgCO2·person−1·day−1 in June), and WF (from 3608 L·person−1·day−1 in April to 3076 L·person−1·day−1 in June). CFs and WFs decreased progressively to reach their minimum value in August (3.12 kgCO2·person−1·day−1 and 2616 L·person−1·day−1). This lower household food consumption in August across all food categories is also due to the effect of heat and appetite. In addition, spending time outdoors during the summer because there were hardly any restrictions in August could also have affected this decline in household food consumption.
A peak was detected in October for both environmental indicators (3.88 kgCO2·person−1·day−1 and 3402 L·person−1·day−1). The high value in CF and WF coincided with the approval of a new national state of alarm for the country on October 25, in an attempt to combat the coronavirus wave that was being experienced. The state of alarm would last until 9 May 2021. In addition, the Government introduced a national regulation to contain a new coronavirus outbreak.
The third peak in the environmental variables analyzed occurred in December (4.50 kgCO2·person−1·day−1 and 3579 L· person−1·day−1). This third peak could be associated with the extra calories consumed in all celebrations during Christmas. In fact, if we compare the consumption in December with that of November, a significant increase can be observed in the most consumed products at Christmas in Spain: meat (ranging from 138.1 g·person−1·day−1 in November to 158.8 g·person−1·day−1 in December), fish and seafood (from 82.5 g·person−1·day−1 to 109.0 g·person−1·day−1), sweets (from 85.6 g·person−1·day−1 to 100.4 g·person−1·day−1), and nuts (from 20.3 g·person−1·day−1 to 23.3 g·person−1·day−1) food categories.

3.5. Comparison of the Carbon Footprint and Water Footprint of the Dietary Pattern in Spain with 2019 as the Baseline Year

The CF and WF results for 2020 were compared with those of 2019, prior to the outbreak of the COVID-19 pandemic.

3.5.1. Carbon Footprint

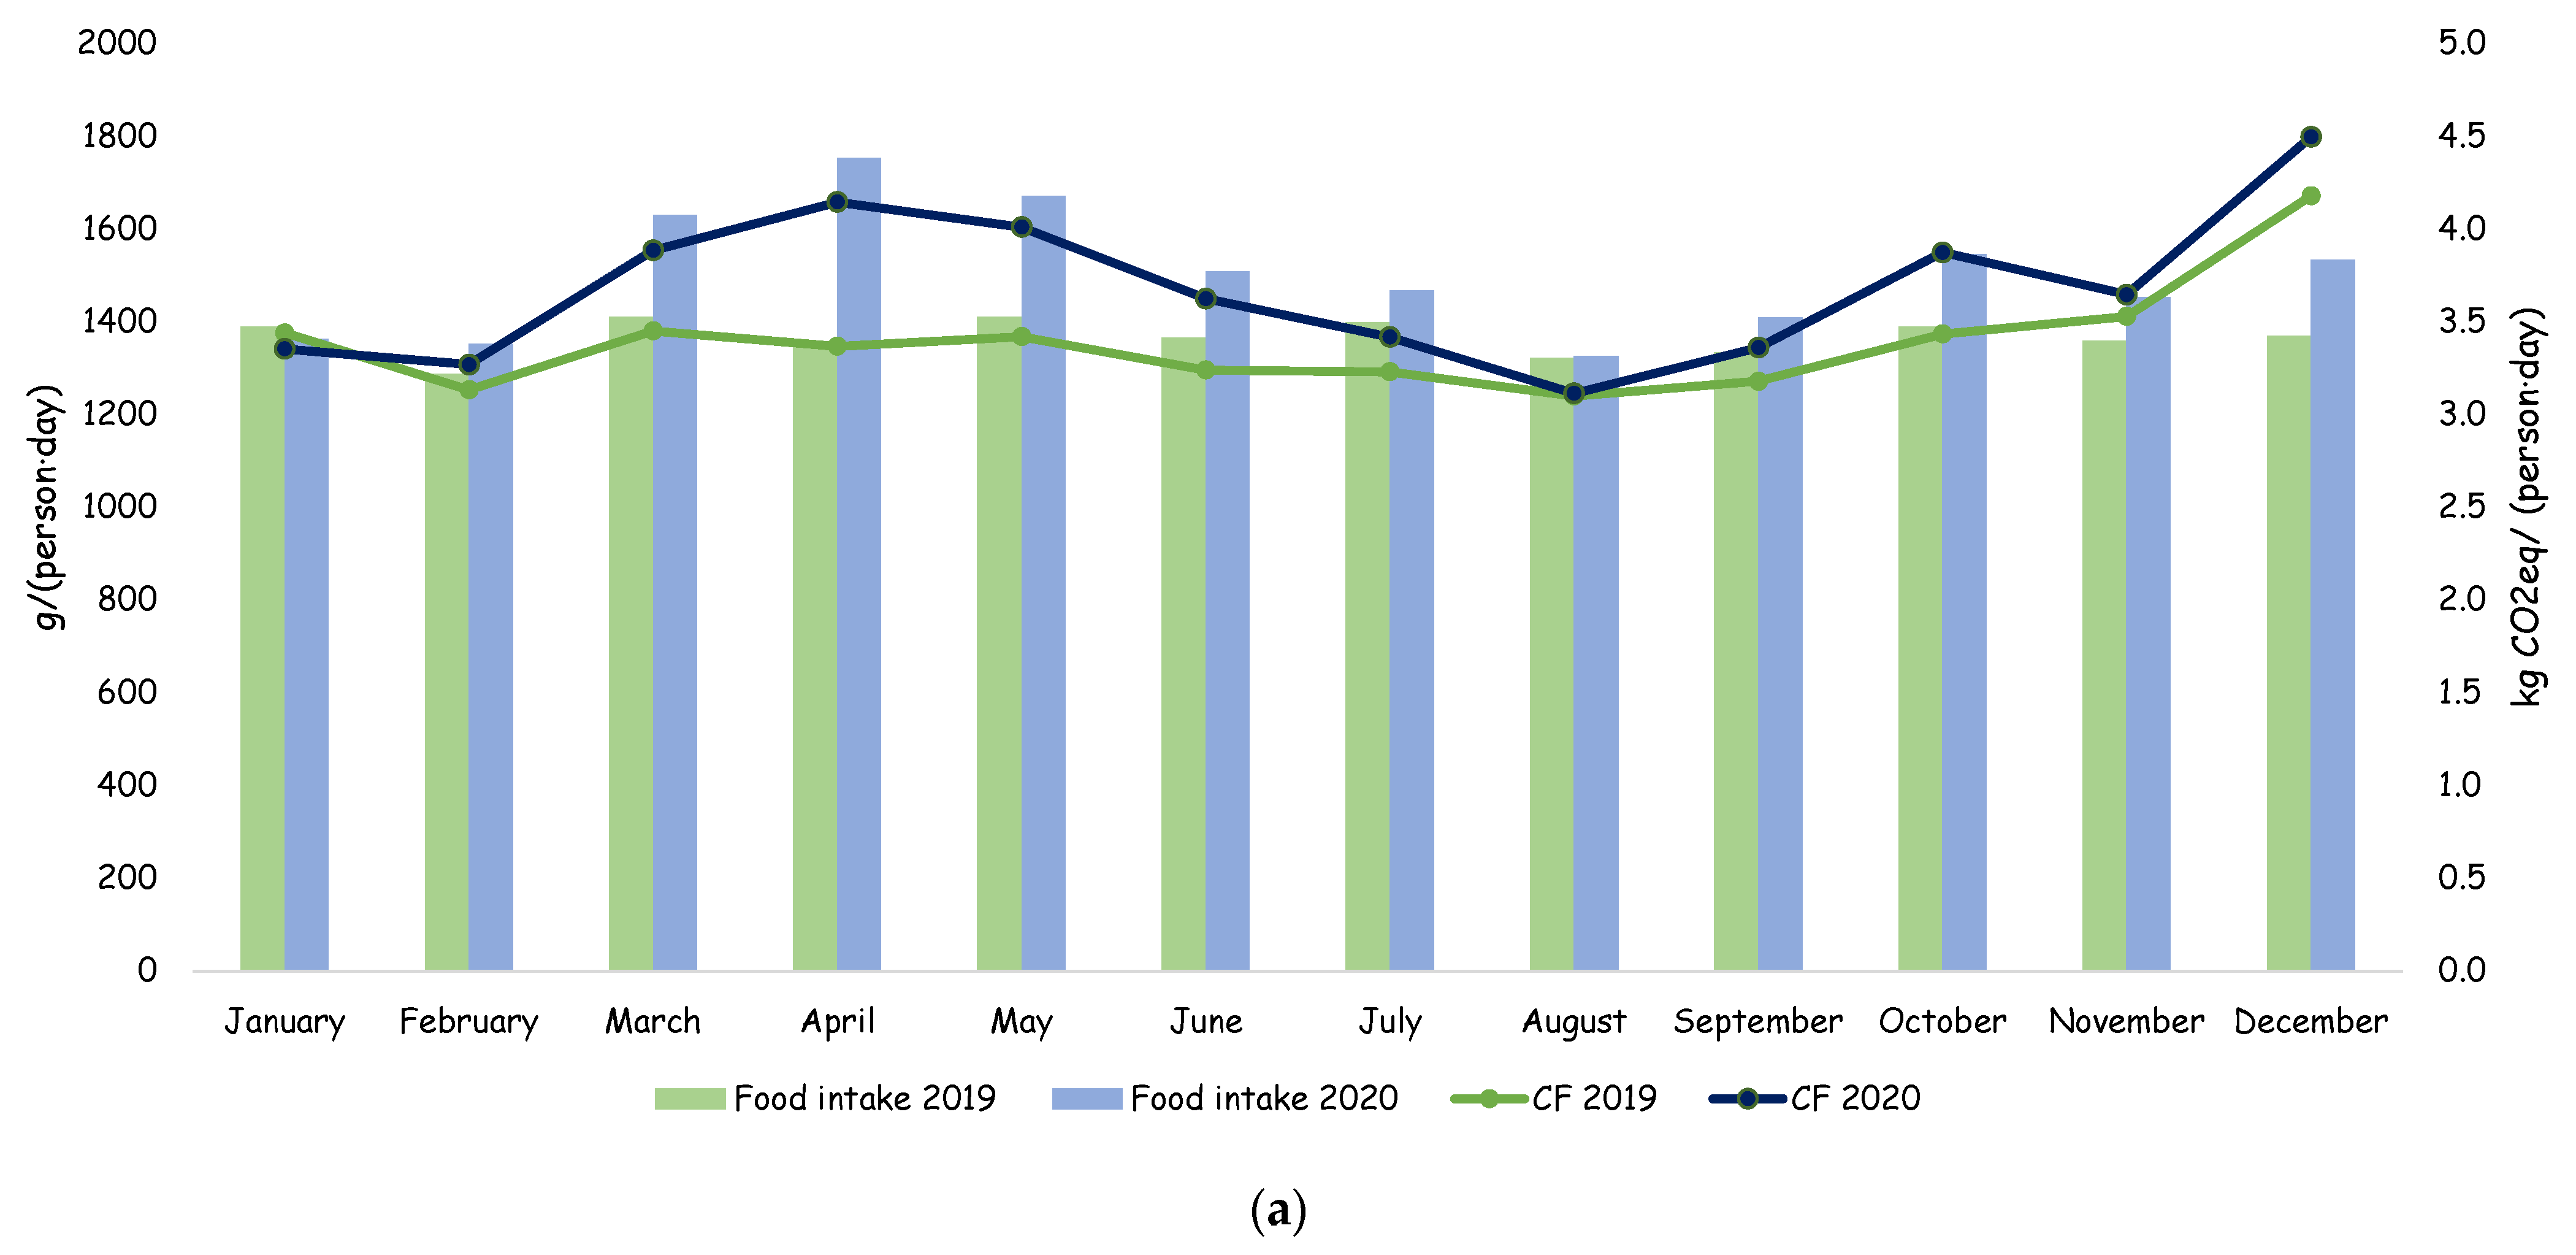
Figure 5a shows the month-to-month variation of the CF for the baseline year (2019) and establishes a comparison with the 2020 results analyzed previously. Based on this figure, we can state that there were changes in food consumption patterns during the COVID-19 pandemic. These changes included an increase in the amount of food purchased, which led to an increase in CF. As for 2020, meat (about 40% of total CF) and dairy products (about 17%) were the main dietary contributors to CF in 2019. Starch-based products and fish and seafood also contributed significantly to total CF in this baseline year, accounting for around 6% and 15% of total CF, respectively.
However, the month-to-month CF profile for 2019 showed a much more linear trend compared to 2020. The slight downward trend observed in spring and summer could be due to seasonal variation, with the lowest CF occurring in the summer, particularly in August (3.10 kgCO2·person−1·day−1). Summer fitness goals and the effects of heat on appetite may be responsible for this slight decrease in food consumption and its impact on CF. On the other hand, an increase in CF could be seen in the last months of the year peaking in December 2019 (4.18 kgCO2·person−1·day−1), coinciding with the celebration of Christmas. In summary, the comparison with the baseline year reinforces the fact that the COVID-19 outbreak containment measures had a significant impact on the total climate impact of the Spanish diet.

3.5.2. Water Footprint

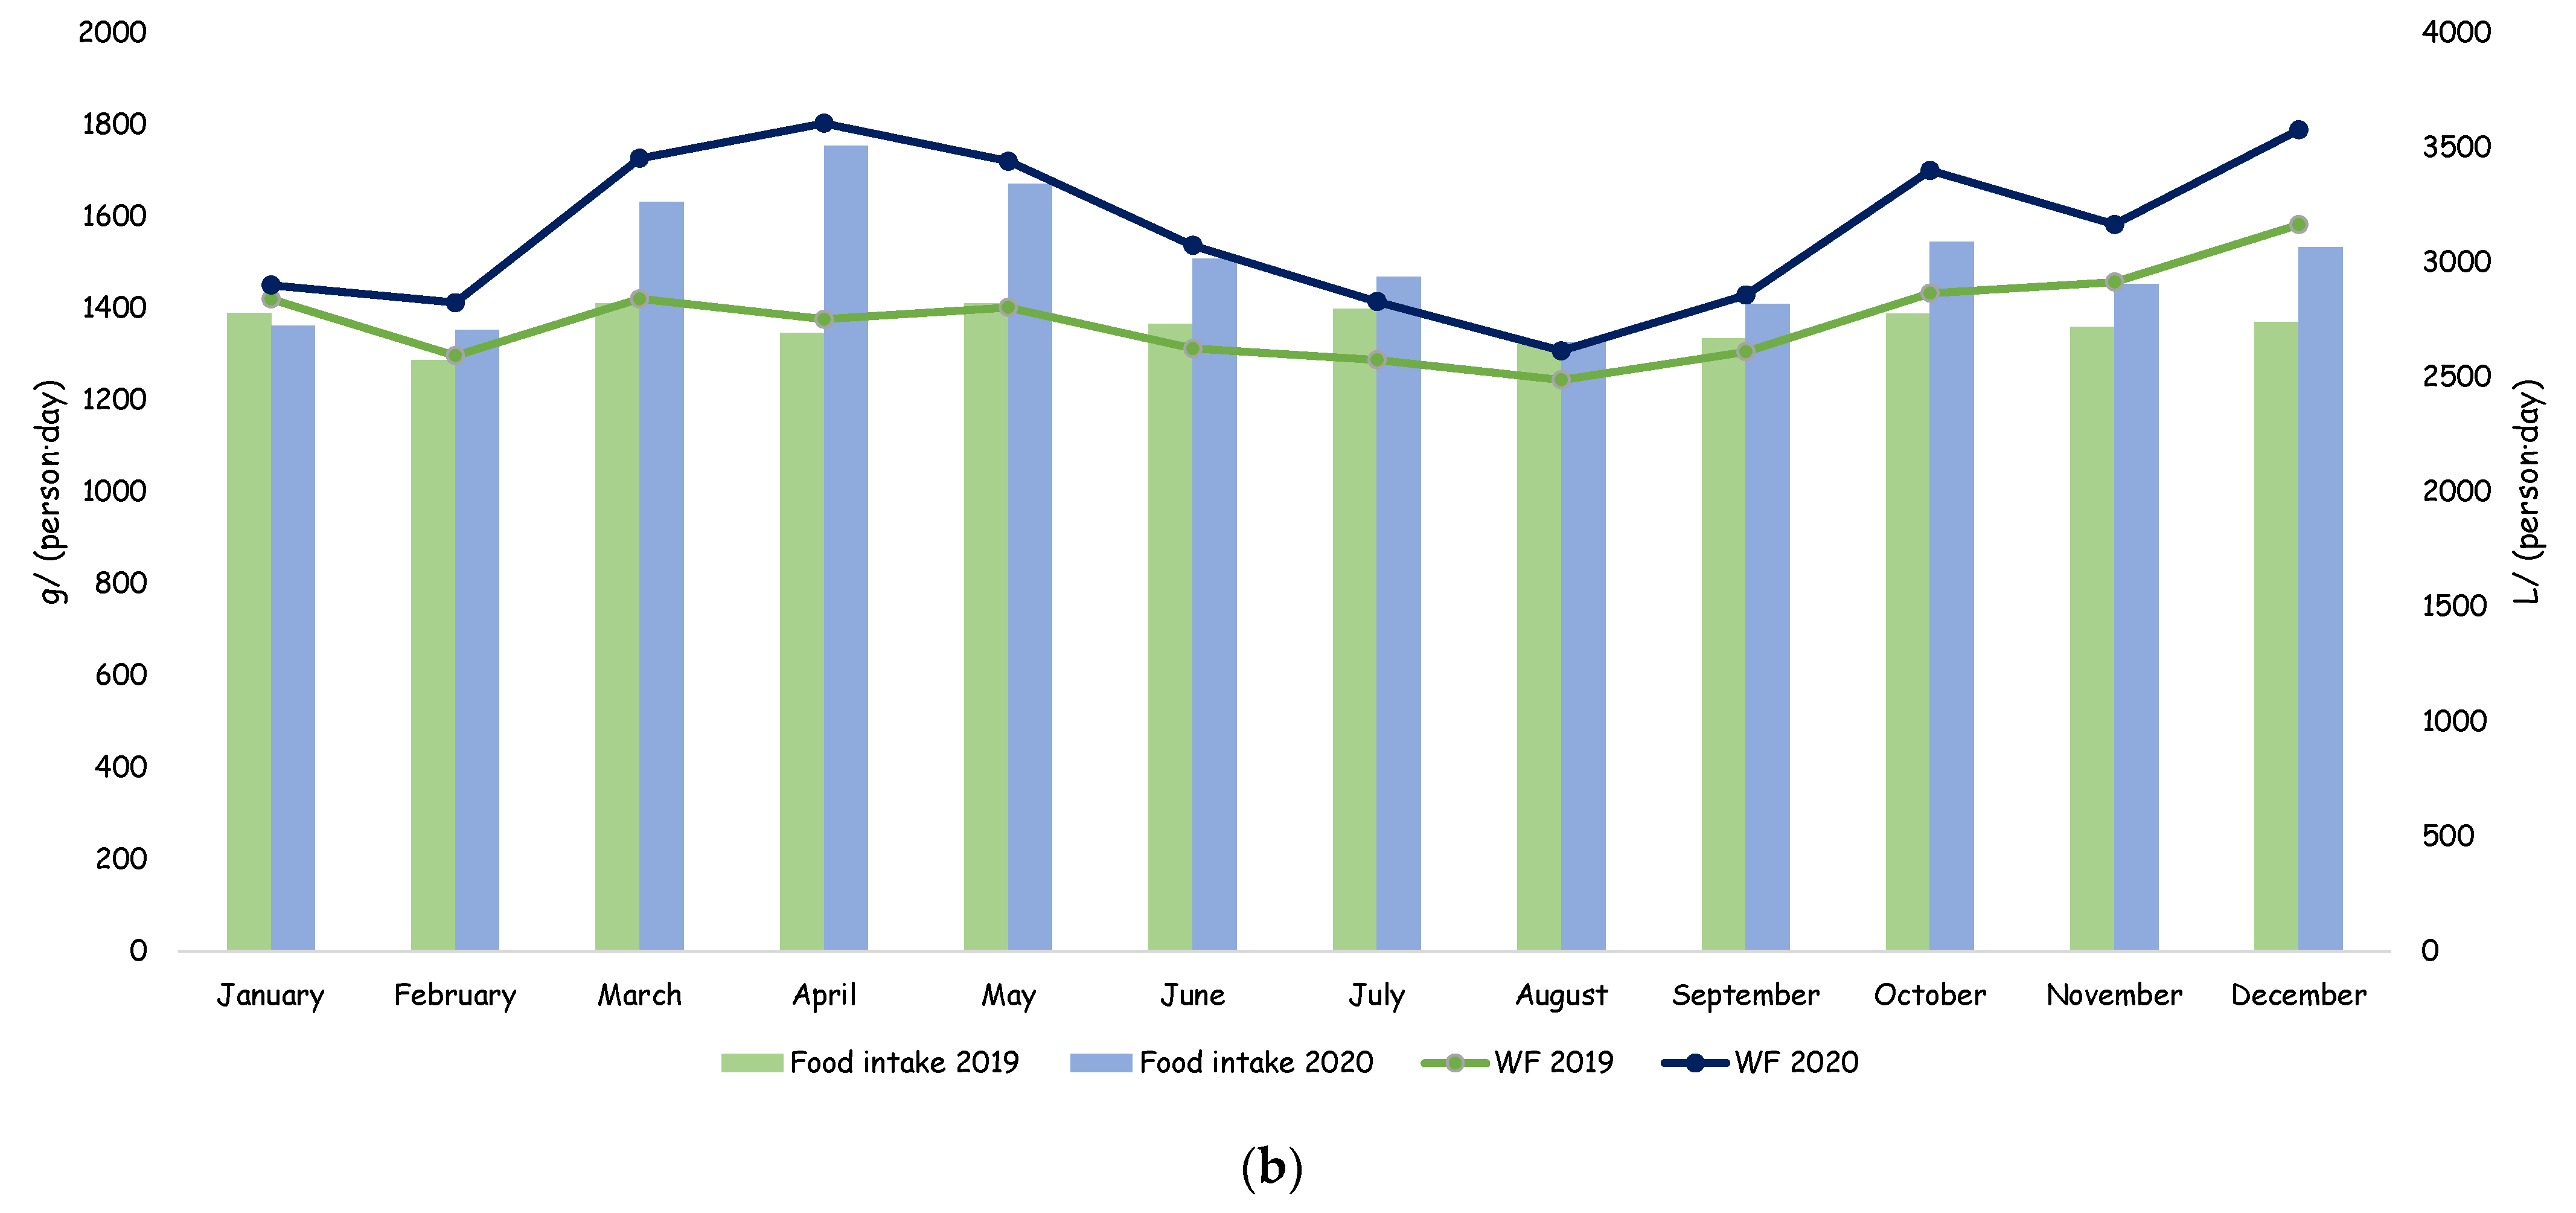
Figure 5b shows the monthly variation of the WF for the baseline year (2019) and makes a comparison with the 2020 results analyzed above. The WF profile is very similar to the CF profile. The comparison reported significant increases in WF in 2019 compared to 2020, mainly due to the higher level of food consumption during the first year of the COVID-19 pandemic in Spain. Dairy, meat, sweets, and oils and fats consumption were also the largest contributors, accounting for about 25%, 28%, 12%, and 13% of total WF in 2019, respectively.
In March 2019, there was no pronounced upward trend in WF as shown in 2020. When comparing WF in the pre-quarantine and food consumption quarantine datasets, we automatically assigned the peak WF in April 2020 (3608 L·person−1·day−1) to the COVID-19 pandemic. The WF in April 2019 was 2754 L·person−1·day−1. On the other hand, as depicted in Figure 5b, the WF also increased in 2019 during the last month of the year, in December (3166 L·person−1·day−1) during the Christmas holidays.

4. Discussion

4.1. Comparison with Other International Studies

Food is one of the sectors of daily life that are most affected by global socio-economic and health crisis. Studies have reported a positive correlation between food interests and mobility. Despite some variation between countries, there are notable food categories that have been more consumed during COVID-19 as a result of spending more time at home. People worldwide were interested in carbohydrates and calorie-dense foods likely due to changes in preferences, accessibility, and prices. Thus, it was observed a significant decrease in the nutritional quality of diets worldwide during COVID-19 [40].
Italians increased their consumption of flour-based and sugary foods in place of fresh food [41] in the same line as Spaniards [42]. The level of adherence to French dietary recommendations also decreased during the lockdown due to a sharp increase in processed meat, sweet-tasting beverages, and alcoholic beverages [43]. The trend in Latin American countries was the same. A higher prevalence of inactivity and high consumption of ultra-processed was observed in teenagers in Brazil, Chile, and Colombia [44]. The consumption of packaged foods, takeout meals, and packaging from online shopping as well as the tendency to stock up and overbuy led to more food waste, which affects the environment, human systems, and water quality [45].
In this line, Battle-Bayer (2020) made a comparison from a threefold environmental perspective (Global Warming Potential, Blue Water Footprint, and Land Use) between a set of scenarios: a pre-COVID-19 diet, a COVID-19 diet, and two alternative diets, based on Spanish dietary recommendations and recommendations of the EAT-Lancet Commission on healthy diets from sustainable food systems, respectively [46]. According to their results, the COVID-19 diet had a larger energy intake, lower nutritional quality, and higher environmental impacts than the pre-COVID-19 diet, which is consistent with our analysis. Moreover, the COVID-19 diet showed an increase in environmental impacts in comparison with EAT-Lancet dietary recommendations.
Changes in dietary behaviors at the beginning of the COVID-19 outbreak also impacted on the nutritional quality and environmental impact of French diets. Marty et al. (2020) found a temporary decrease in nutritional quality and environmental impact during the first lockdown but no sustained changes in the long run [47]. They found a 1-year trend towards more organic and local food consumption. This long-term trend agrees with the analysis made in Italy [48]. They showed that COVID-19 significantly influenced the behavior of consumers, who were more willing to pay for sustainable products and pay attention to environmental issues.

4.2. Policy Implications

Results show that the pandemic in 2020 influenced the achievement of SDGs. It poses a significant challenge to the implementation of the 2030 Agenda for Sustainable Development. The COVID-19 pandemic caused an increase in the consumption quantity of different food products affecting SDG 12 (Responsible production and consumption), which is key to a sustainable food future.
These changes led to an increase in food’s carbon footprint, hindering the achievement of SDG 13 (Climate Action), which addresses climate change and its impacts. Therefore, the COVID-19 pandemic was a great threat to planetary health with serious consequences on global warming and climate change effects.
On the other hand, the vulnerabilities of the COVID-19 pandemic affect the food-water nexus and impede the progress of SDG 6 (Clean water and sanitation). The COVID-19 pandemic showed an increase in water consumption in the agricultural sector due to food overconsumption during the pandemic.
Definitely, this study could help to build a coherent response to post-COVID-19 recovery progress accelerating progress on the SDGs and guiding decision-making towards a more sustainable and resilient food system for the future.

4.3. Strengths and Weaknesses of the Study

The strengths of our study include the large amount of data used to analyze the impact of COVID-19 on the environmental consequences of changes in Spanish dietary habits. We evaluated dietary scenarios covering more than 80 food products at monthly intervals over 2 years, which allowed us to have a clearer and more detailed picture of CF and WF associated with the dietary habits of a large number of Spaniards.
The main limitation of the study is that regional, climatic, and cultural variations in food consumption were not considered. This analysis could be of interest since the coexisting Atlantic and Mediterranean diets in Spain influence the type and quantity of food in the 17 autonomous communities. However, considering an average pattern is very common in the research conducted in this field [49,50].
On the other hand, some limitations related to the methodology need to be addressed. The CF assessment is sensitive to the CF values collected for each food product in the meta-analysis, systematic reviews, and scientific articles from LCA research. Uncertainty about the total CF content of the diet cannot be quantified since the variability of the CF content of each food in the diet is unknown. The limitations in the WF assessment were the scarce information for the estimation of WF of non-aquaculture fishery products.

5. Conclusions

The global COVID-19 pandemic led to containment measures such as lockdowns and restrictions on contact-intensive businesses and indoor operations. The measures taken to control the spread of the COVID-19 pandemic in Spain were very restrictive in changing people’s lifestyles in all dimensions.
Through this study, we were able to analyze the impact of the COVID-19 pandemic on the Spanish dietary pattern. From the results, changes in food consumption patterns were obvious. This had consequences related to environmental indicators. Therefore, the monthly analysis of CF and WF showed two significant peaks, one in April 2020 and the other in October 2020, which could not be detected at the same time in 2019. These results were interpreted as indicative of increased food consumption during spring confinement and the recurrent large wave of COVID-19 in October. The third significant peak in both environmental indicators for the baseline year (2019) and the first pandemic outbreak year in Spain (2020) occurred in December. Overeating during the Christmas holidays could explain these results.
The most important finding was that the pandemic caused by COVID-19 changed dietary patterns and food consumption in Spain since early 2020, which lead to significant increases in global greenhouse gas emissions and water consumption. For future work, a more detailed study of changes in dietary patterns throughout the duration of the COVID-19 pandemic, incorporating household consumption data from 2021 and 2022, including specific regions within and outside Spain, and considering different nutritional and economic indicators could be of great interest not only for health authorities but also for the well-being of citizens. For example, it could be possible to analyze how the suspension of contracts, the reduction of working hours, or the implementation of measures such as Temporary Redundancy Provisions influenced buying and selling behaviour. Identifying the exact behavioural changes in each country will provide better-informed decisions during the COVID recovery process, opening up future possibilities towards a diet that integrates nutrition and sustainability considerations.

Supplementary Materials

The following supporting information can be downloaded at: https://www.mdpi.com/article/10.3390/su151411001/s1, Table S1. Daily intake (g·person−1·day−1) per food item for the Spanish Dietary Pattern (SDP) in 2020. Table S2. Daily intake (g·person−1·day−1) per food group for the Spanish Dietary Pattern (SDP) in 2019. Table S3. Carbon footprint per foodstuff. Table S4. Importing and exporting volumes, and distribution distances (import and national) per food item in 2020. Table S5. Importing and exporting volumes, and distribution distances (import and national) per food item in 2019.

Author Contributions

Conceived and designed the experiments: C.C.-F. and S.G.-G.; Performed the experiments: C.C.-F. and H.J.U.; Analysed the data: C.C.-F., H.J.U., S.G.-G. and M.T.M.; Contributed materials/analysis tools: G.F. and M.T.M.; Writing of the original draft: C.C.-F.; Review & Editing: C.C.-F., S.G.-G., G.F. and M.T.M. All authors have read and agreed to the published version of the manuscript.

Funding

C.C.-F. would like to express her gratitude to the Ministry of Science, Innovation and Universities for financial support (Grant reference FPU 19/06648). This research has been supported by the project Enhancing diversity in Mediterranean cereal farming systems (CerealMed) project funded by PRIMA Program and FEDER/Spanish Ministry of Science and Innovation (PCI2020-111978).

Institutional Review Board Statement

Not applicable.

Informed Consent Statement

Not applicable.

Data Availability Statement

Data is contained within the article or Supplementary Materials.

Acknowledgments

We thank Paula Cambeses-Franco for the scientific support on data curation and data analysis. C.C-F, H.J.U., G.F., M.T.M. and S.G.-G. belong to the Galician Competitive Research Group (GRC ED431C 2017/29) and to the Cross-disciplinary Research in Environmental Technologies (CRETUS Research Center, ED431E 2018/01). All these programs are co-funded by FEDER (EU).

Conflicts of Interest

The authors declare no conflict of interest.

References

  1. WHO. Coronavirus Disease (COVID-19) Pandemic. World Health Organization [WWW Document]. 2019. Available online: https://www.euro.who.int/en/health-topics/health-emergencies/coronavirus-covid-19/novel-coronavirus-2019-ncov (accessed on 2 October 2022).
  2. WHO. WHO Coronavirus Disease (COVID-19). Dashboards; World Health Organization: Geneva, Switzerland, 2020. [Google Scholar]
  3. Rajan, S.; McKee MHernández-Quevedo CKaranikolos, M.; Richardson, E.; Webb, E.; Cylus, J. What have European countries done to prevent the spread of COVID-19? Lessons from the COVID-19 Health System Response Monitor. Health Policy 2022, 126, 355–361. [Google Scholar] [CrossRef]
  4. BOE. Real Decreto 463/2020, de 14 de Marzo, por el que se Declara el Estado de Alarma para la Gestión de la Situación de Crisis Sanitaria Ocasionada por el COVID-19. 2020. Boletín Oficial del Estado, 67, de 14/03/2020. Available online: https://www.boe.es/buscar/act.php?id=BOE-A-2020-3692 (accessed on 19 October 2022).
  5. Brooks, S.K.; Webster, R.K.; Smith, L.E.; Woodland, L.; Wessely, S.; Greenberg, N.; Rubin, G.J. The psychological impact of quarantine and how to reduce it: Rapid review of the evidence. Lancet 2020, 395, 912–920. [Google Scholar] [CrossRef] [PubMed] [Green Version]
  6. Fawaz, M.; Samaha, A. COVID-19 quarantine: Post-traumatic stress symptomatology among Lebanese citizens. Int. J. Soc. Psychiatry 2020, 66, 666–674. [Google Scholar] [CrossRef]
  7. Imperial College of London. Food and Coronavirus. Examining the Pandemic’s Impact on the Diet [WWW Document]. 2020. Available online: https://www.imperial.ac.uk/stories/food-and-coronavirus/ (accessed on 21 November 2022).
  8. Eftimov, T.; Popovski, G.; Petković, M.; Seljak, B.K.; Kocev, D. COVID-19 pandemic changes the food consumption patterns. Trends Food Sci. Technol. 2020, 104, 268–272. [Google Scholar] [CrossRef]
  9. Navarro-Pérez, C.F.; Fernández-Aparicio, Á.; González-Jiménez, E.; Montero-Alonso, M.Á.; Schmidt-RioValle, J. Effects of COVID-19 lockdown on the dietary habits and lifestyle in a population in southern Spain: A cross-sectional questionnaire. Eur. J. Clin. Nutr. 2021, 76, 883–890. [Google Scholar] [CrossRef]
  10. WHO. Food and Nutrition Tips during Self-Quarantine [WWW Document]. 2019. Available online: https://www.euro.who.int/en/health-topics/health-emergencies/coronavirus-covid-19/publications-and-technical-guidance/food-and-nutrition-tips-during-self-quarantine (accessed on 28 November 2022).
  11. WHO. Coronavirus Disease (COVID-19): Staying Active. World Health Organization [WWW Document]. 2020. Available online: https://www.who.int/emergencies/diseases/novel-coronavirus-2019/question-and-answers-hub/q-a-detail/coronavirus-disease-covid-19-staying-active (accessed on 2 December 2022).
  12. Ammar, A.; Brach, M.; Trabelsi, K.; Chtourou, H.; Boukhris, O.; Masmoudi, L.; Bouaziz, B.; Bentlage, E.; How, D.; Ahmed, M.; et al. Effects of COVID-19 Home Confinement on Eating Behaviour and Physical Activity: Results of the ECLB-COVID19 International Online Survey. Nutrients 2020, 12, 1583. [Google Scholar] [CrossRef] [PubMed]
  13. Brown, A.; Flint, S.W.; Kalea, A.Z.; O’Kane, M.; Williams, S.; Batterham, R.L. Negative impact of the first COVID-19 lockdown upon health-related behaviours and psychological wellbeing in people living with severe and complex obesity in the UK. EClinicalMedicine 2021, 34, 100796. [Google Scholar] [CrossRef] [PubMed]
  14. European Commission. Emissions Changes Due to Lockdown Measures during the First Wave of the COVID-19 Pandemic in Europe; European Commission: Brussels, Belgium, 2020. [Google Scholar]
  15. UN. Sustainable Development Goals. 2021. Available online: http://sustainabledevelopment.un.org/?menu=1300 (accessed on 2 October 2021).
  16. Crippa, M.; Solazzo, E.; Guizzardi, D.; Monforti-Ferrario, F.; Tubiello, F.N.; Leip, A.J.N. Food systems are responsible for a third of global anthropogenic GHG emissions. Nat. Food 2021, 2, 198–209. [Google Scholar] [CrossRef]
  17. Xiong, X.; Zhang, L.; Hao, Y.; Zhang, P.; Chang, Y.; Liu, G. Urban dietary changes and linked carbon footprint in China: A case study of Beijing. J. Environ. Manag. 2020, 255, 109877. [Google Scholar] [CrossRef]
  18. Zucchinelli, M.; Spinelli, R.; Corrado, S.; Lamastra, L. Evaluation of the influence on water consumption and water scarcity of different healthy diet scenarios. J. Environ. Manag. 2021, 291, 112687. [Google Scholar] [CrossRef]
  19. Clark, M.A.; Springmann, M.; Hill, J.; Tilman, D. Multiple health and environmental impacts of foods. Proc. Natl. Acad. Sci. USA 2019, 116, 23357–23362. [Google Scholar] [CrossRef] [PubMed] [Green Version]
  20. MAPA. Spanish Ministry of Agriculture, Food and Environment. 2019. Available online: https://www.mapa.gob.es/app/consumo-en-hogares/consulta.asp (accessed on 1 August 2022).
  21. MAPA. Spanish Ministry of Agriculture, Food and Environment. 2020. Available online: https://www.mapa.gob.es/app/consumo-en-hogares/consulta11.asp (accessed on 2 August 2022).
  22. Ministerio de Agricultura Pesca y Alimentación. 2020. Informe del Consumo de Alimentación en España 2019. Minist. Agric. Pesca y Aliment. 674. Available online: https://www.mapa.gob.es/en/alimentacion/temas/consumo-tendencias/informe2019_v2_tcm38-540250.pdf (accessed on 20 July 2022).
  23. González-García, S.; Green, R.F.; Scheelbeek, P.F.; Harris, F.; Dangour, A.D. Dietary recommendations in Spain –affordability and environmental sustainability? J. Clean. Prod. 2020, 254, 120125. [Google Scholar] [CrossRef] [PubMed]
  24. Cambeses-Franco, C.; González-García, S.; Feijoo, G.; Moreira, M.T. Is the paleo diet safe for health and the environment? Sci. Total Environ. 2021, 781, 146717. [Google Scholar] [CrossRef]
  25. Kovacs, B.; Miller, L.; Heller, M.C.; Rose, D. The carbon footprint of dietary guidelines around the world: A seven country modeling study. Nutr. J. 2021, 20, 15. [Google Scholar] [CrossRef]
  26. ISO 14040:2006; Environmental Management-Life Cycle Assessment. International Organization for Standarization. ISO: Geneva, Switzerland, 2006.
  27. Ministerio de Economia. DATACOMEX. Base de Datos Multidimensionales de Comercio Exterior de Mercancías Español. 2019. Available online: https://comercio.serviciosmin.gob.es/Datacomex/ (accessed on 20 July 2022).
  28. Castañé, S.; Antón, A. Assessment of the nutritional quality and environmental impact of two food diets: A Mediterranean and a vegan diet. J. Clean. Prod. 2017, 167, 929–937. [Google Scholar] [CrossRef]
  29. Batlle-Bayer, L.; Bala, A.; García-Herrero, I.; Lemaire, E.; Song, G.; Aldaco, R.; Fullana-i-Palmer, P. The Spanish Dietary Guidelines: A potential tool to reduce greenhouse gas emissions of current dietary patterns. J. Clean. Prod. 2019, 213, 588–598. [Google Scholar] [CrossRef]
  30. Garcia-Herrero, I.; Hoehn, D.; Margallo, M.; Laso, J.; Bala, A.; Batlle-Bayer, L.; Fullana, P.; Vazquez-Rowe, I.; Gonzalez, M.J.; Durá, M.; et al. On the estimation of potential food waste reduction to support sustainable production and consumption policies. Food Policy 2018, 80, 24–38. [Google Scholar] [CrossRef]
  31. Gustavsson, J.; Cederberg, C.; Sonesson, U.; Emanuelsson, A. The Methodology of the FAO Study: “Global Food Losses and Food Waste-Extent, Causes and Prevention”-FAO, 2011, SIK Report No. 857; Food and Agriculture Organization of the United Nations: Düsseldorf, Germany, 2013. [Google Scholar]
  32. Harris, F.; Moss, C.; Joy, E.J.M.; Quinn, R.; Scheelbeek, P.F.D.; Dangour, A.D.; Green, R. The Water Footprint of Diets: A Global Systematic Review and Meta-analysis. Adv. Nutr. 2020, 11, 375–386. [Google Scholar] [CrossRef] [Green Version]
  33. Tickner, D.; Chapagain, A.K. Water Footprint Assessment: A Guide for Business; Routledge: London, UK, 2017. [Google Scholar] [CrossRef]
  34. Mekonnen, M.M.; Hoekstra, A. The Green, Blue and Grey Water Footprint of Farm Animals and Animal Products. Volume 1: Main Report. Unesco Value Water Res. Rep. Ser. No. 48; UNESCO-IHE Institute for Water Education: Enschede, The Netherlands, 2010. [Google Scholar]
  35. Mekonnen, M.M.; Hoekstra, A.Y. The green, blue and grey water footprint of crops and derived crop products. Hydrol. Earth Syst. Sci. 2011, 15, 1577–1600. [Google Scholar] [CrossRef] [Green Version]
  36. Blas, A.; Garrido, A.; Unver, O.; Willaarts, B. A comparison of the Mediterranean diet and current food consumption patterns in Spain from a nutritional and water perspective. Sci. Total Environ. 2019, 664, 1020–1029. [Google Scholar] [CrossRef]
  37. Harris, F.; Green, R.F.; Joy, E.J.M.; Kayatz, B.; Haines, A.; Dangour, A.D. The water use of Indian diets and socio-demographic factors related to dietary blue water footprint. Sci. Total Environ. 2017, 587, 128–136. [Google Scholar] [CrossRef] [PubMed]
  38. Pahlow, M.; van Oel, P.R.; Mekonnen, M.M.; Hoekstra, A.Y. Increasing pressure on freshwater resources due to terrestrial feed ingredients for aquaculture production. Sci. Total Environ. 2015, 536, 847–857. [Google Scholar] [CrossRef] [PubMed] [Green Version]
  39. Maestre, A.; Sospedra, I.; Mart, M.; Gutierrez-Hervas, A.; Hurtado-Saez, A.; Norte, A. Assessment of Spanish Food Consumption Patterns during COVID-19 Home Confinement. Nutrients 2021, 13, 4122. [Google Scholar] [CrossRef] [PubMed]
  40. Glicorić, K.; Chiolero, A.; Kiciman, E.; White, R.; West, R. Population-scale dietary interests during the COVID-19 pandemic. Nat. Commun. 2022, 13, 1073. [Google Scholar] [CrossRef]
  41. Bracale, R.; Vaccaro, C.M. Changes in food choice following restricive measure due to COVID-19. Nutr. Metab. Cardiovasc. Dis. 2020, 30, 1423–1426. [Google Scholar] [CrossRef] [PubMed]
  42. Lagula, L.; Fiszman, S.; Puerta, P.; Chaya, C.; Tárrega, A. The impact of COVID-19 lockdown on food priorities. Results from a preliminary study using social media and an online survey with Spanish consumers. Food Qual. Prefer. 2020, 86, 104028. [Google Scholar] [CrossRef]
  43. Marty, L.; de Lauzon-Guillain, B.; Labesse, M.; Nicklaus, S. Food choice motives and the nutritional quality of diet during the COVID-19 lockdown in France. Appetite 2021, 157, 105005. [Google Scholar] [CrossRef]
  44. Ruíz-Roso, M.B.; de Carvalho Padilha, P.; Matilla-Escalante, D.C.; Brun, P.; Ulloa, N.; Acevedo-Correa, D.; Arantes Ferreira Peres, W.; Martorell, M.; Rangel Bousquet Carrilho, T.; de Oliveira Cardoso, L.; et al. Changes of physicial activity and ultra-processed food consumption in adolescents from different countries during COVID-19 pandemic: An observational study. Nutrients 2020, 12, 2289. [Google Scholar] [CrossRef]
  45. Raza, T.; Shehzad, M.; Abbas, M.; Eash, N.S.; Jatav, H.S.; Sillanpaa, M.; Flynn, T. Impact assessment of COVID-19 global pandemic on water, environment, and humans. Environ. Adv. 2022, 11, 100328. [Google Scholar] [CrossRef]
  46. Batlle-Bayer, L.; Aldaco, R.; Bala, A.; Puig, R.; Laso, J.; Margallo, M.; Vázquez-Rowe, I.; Antó, J.M.; Fullana-i-Palmer, P. Environmental and nutritional impacts of dietary changes in Spain during COVID-19 lockdown. Sci. Total Environ. 2020, 748, 141410. [Google Scholar] [CrossRef]
  47. Marty, L.; de Lauzon-Guillain, B.; Nicklaus, S. Short- and Mid- term impacts of COVID-19 outbreak on the nutritional quality and environmental impact of diet. Front. Nutr. 2022, 9, 314. [Google Scholar] [CrossRef] [PubMed]
  48. Dangelico, R.M.; Schiaroli, V.; Fraccascia, L. Is COVID-19 changing sustainable consumer behaviour? A survey of Italian consumers. Sustain. Dev. 2022, 30, 1477–1496. [Google Scholar] [CrossRef]
  49. Cambeses-Franco, C.; González-García, S.; Feijoo, G.; Moreira, M.T. Driving commitment to sustainable food policies within the framework of American and European dietary guidelines. Sci. Total Environ. 2021, 807, 150894. [Google Scholar] [CrossRef] [PubMed]
  50. Esteve-Llorens, X.; Dias, A.C.; Moreira, M.T.; Feijoo, G.; González-García, S. Evaluating the Portuguese diet in the pursuit of a lower carbon and healthier consumption pattern. Clim. Chang. 2020, 162, 2397–2409. [Google Scholar] [CrossRef]
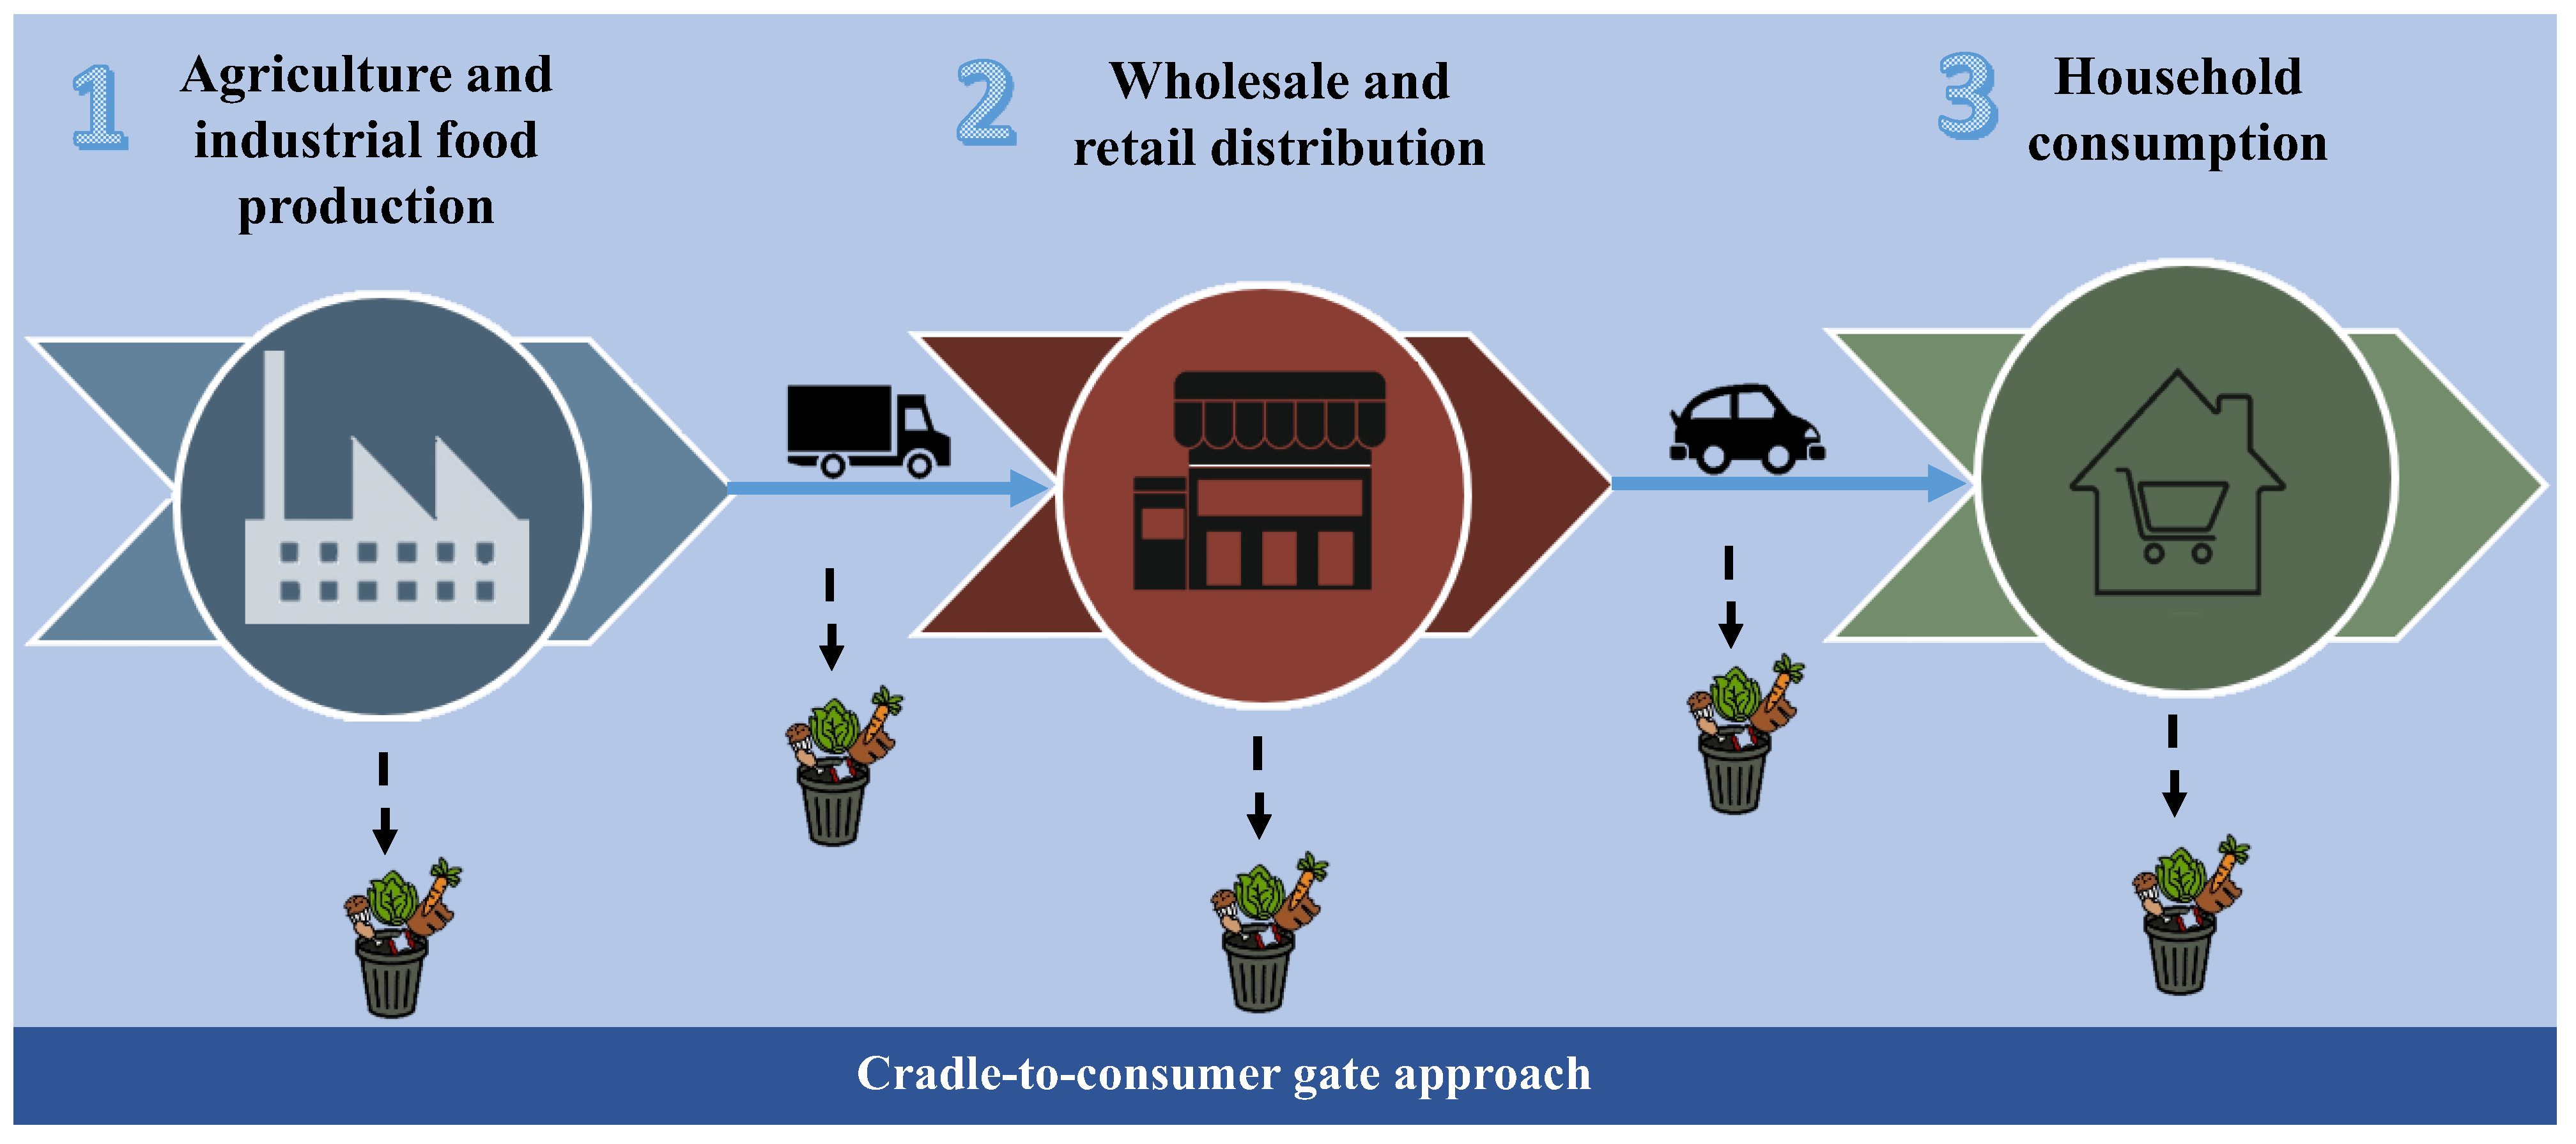
Figure 1. System boundaries for the carbon footprint analysis.
Sustainability 15 11001 g001
Figure 2. Distribution of carbon footprint (kgCO2·person−1·day−1) and water footprint (L·person−1·day−1) between food categories per 2020 Spanish Dietary Pattern. (a) Carbon footprint (kgCO2/person/day); (b) Water footprint (L/person/day).
Sustainability 15 11001 g002
Figure 3. Monthly variation of the daily intake of the Spanish dietary pattern throughout the year 2020.
Sustainability 15 11001 g003
Figure 4. Monthly variation of the carbon footprint and water footprint of the Spanish dietary pattern throughout the year 2020. (a) Monthly carbon footprint (kgCO2/person/day) of the Spanish dietary pattern (2020); (b) Monthly water footprint (L/person/day) of the Spanish dietary pattern (2020).
Sustainability 15 11001 g004
Figure 5. Comparison of the variation of the carbon footprint and water footprint month by month for 2020 and the baseline year (2019). (a) Monthly carbon footprint (kgCO2/person/day); (b) Monthly water footprint (L/person/day).
Sustainability 15 11001 g005aSustainability 15 11001 g005b
Table 1. Daily intake (g·person−1·day−1) per food group for the Spanish Dietary Pattern (2020).
Food ItemSpanish Dietary Pattern
(g·person−1·day−1)
Food ItemSpanish Dietary Pattern
(g·person−1·day−1)
FruitsDairy products
Oranges53.2Milk256.6
Mandarin19.5Yogurt34.6
Banana42.6Cheese29.5
Apple33.5Butter1.5
Pear16.1Total322.2
Melon25.8Eggs
Watermelon29.0Total26.7
Lemon8.4Meat
Peaches9.2Beef15.8
Apricot2.6Chicken40.3
Strawberry8.9Pork32.3
Plum3.8Rabbit2.8
Grapes7.3Sheep4.2
Kiwi9.4Turkey4.5
Pineapple6.3Processed meat36.6
Mango2.9Total136.6
Total278.4Fish and seafood
VegetablesHake14.8
Tomatoes67.4Mackerel1.8
Onions36.8Salmon9.2
Peppers26.2Pilchard1.4
Lettuce20.3Cod5.8
Carrot18.4Tuna2.9
Courgette21.0Trout1.4
Cucumber10.4Sole3.7
Cabbage8.0Bass4.3
Garlic3.5Gilt-head bream4.5
Mushroom7.0Turbot0.9
Asparagus2.8Angler2.0
Aubergines9.1Prawns11.2
Artichokes6.3Squids8.4
Leek5.2Mussels6.0
Green peas1.2Clams3.0
Total243.7Total81.3
PulsesSweets
Chickpeas4.4Honey1.4
Beans3.0Sugar11.9
Lentils3.2Ice cream12.3
Total10.7Chocolate13.2
Starch-based productsPastry20.4
Bread92.5Biscuits18.2
Rice12.0Cereals5.7
Pasta12.8Total83.3
Potatoes90.7Oils and fats
Total208.0Sunflower oil10.3
NutsOlive oil22.9
Olives11.6Margarine1.8
Almonds1.1Total35.1
Walnut2.8Ready meals
Peanut1.5Pizza10.2
Hazelnut0.3Soups and creams24.0
Pistachio0.9Sauces11.9
Chestnut0.0Total46.2
Total18.3
Disclaimer/Publisher’s Note: The statements, opinions and data contained in all publications are solely those of the individual author(s) and contributor(s) and not of MDPI and/or the editor(s). MDPI and/or the editor(s) disclaim responsibility for any injury to people or property resulting from any ideas, methods, instructions or products referred to in the content.